FOR P D R -...
238
FOR P D R Prepared for Government of India
Transcript of FOR P D R -...

FOR
P D R
Prepared for
Government of India

Project Coordination Ministry of Environment & Forests
Dr. Nalini Bhat Advisor, Ministry of Environment and Forests
Dr. T. Chandni Director, Ministry of Environment and Forests
Core Project Coordination Team IL&FS Environment
Mr. Mahesh Babu CEO
Mr. N. Sateesh Babu Vice President & Project Director
Mr. B.S.V. Pavan Gopal Manager –Technical
Mr. Vijaya Krishna. D Senior Environmental Engineer
Ms. Chaitanya Vangeti GIS Engineer
Ms. Suman Benedicta Thomas Technical Writer
Resource Person Sh. Narendra Kumar Thusu
Former President, Orient Paper & Industries Ltd. Expert Core & Peer Committee
Chairman Dr. V. Rajagopalan, IAS Additional Secretary
Ministry of Chemicals & Fertilizers Core Members Dr. R. K. Garg
Former Chairman, EIA Committee, Ministry of Environment and Forests
Mr. Paritosh C. Tyagi Former Chairman, Central Pollution Control Board
Prof. S.P. Gautam Chairman, Central Pollution Control Board
Dr. Tapan Chakraborti Director, National Environmental Engineering Research Institute
Mr. K. P. Nyati Former Head, Environmental Policy, Confederation of Indian Industry
Dr. G.K. Pandey Former Advisor, Ministry of Environment and Forests
Dr. Nalini Bhat Advisor, Ministry of Environment and Forests
Dr. G.V. Subramaniam Advisor, Ministry of Environment and Forests
Dr. B. Sengupta Former Member Secretary, Central Pollution Control Board
Dr. R. C. Trivedi Former Scientist, Central Pollution Control Board
Peer Members Prof. N. J. Rao Director, JAYPEE Institute of Engineering and Technology
Member Convener Mr. N. Sateesh Babu Project Director

Table of Contents
TGM for Pulp and Paper Industry i August 2010
TABLE OF CONTENTS
1. INTRODUCTION TO THE TECHNICAL EIA GUIDANCE MANUALS PROJECT 1-1
1.1 Purpose ............................................................................................................................. 1-2
1.2 Project Implementation ..................................................................................................... 1-4
1.3 Additional Information ..................................................................................................... 1-4
2. CONCEPTUAL FACETS OF EIA 2-1
2.1 Environment in EIA Context ............................................................................................ 2-1
2.2 Pollution Control Strategies .............................................................................................. 2-2
2.3 Tools for Preventive Environmental Management ........................................................... 2-2
2.3.1 Tools for assessment and analysis .................................................................. 2-3
2.3.2 Tools for action .............................................................................................. 2-5
2.3.3 Tools for communication ............................................................................... 2-9
2.4 Objectives of EIA ........................................................................................................... 2-10
2.5 Types of EIA .................................................................................................................. 2-10
2.6 Basic EIA Principles ....................................................................................................... 2-11
2.7 Project Cycle ................................................................................................................... 2-12
2.8 Environmental Impacts ................................................................................................... 2-13
2.8.1 Direct impacts ............................................................................................... 2-14
2.8.2 Indirect impacts ............................................................................................ 2-14
2.8.3 Cumulative impacts ...................................................................................... 2-15
2.8.4 Induced impacts ............................................................................................ 2-15
2.9 Significance of Impacts .................................................................................................. 2-15
2.9.1 Criteria/methodology to determine the significance of the identified impacts . 2-16
3. ABOUT PULP AND PAPER INDUSTRY INCLUDING PROCESS AND POLLUTION
CONTROL TECHNOLOGIES 3-1
3.1 Introduction ...................................................................................................................... 3-1
3.1.1 Pulp and paper industry in India ..................................................................... 3-1
3.1.2 Size of the Industry ......................................................................................... 3-2
3.2 Scientific Aspects of the Industrial Process ...................................................................... 3-3
3.2.1 Raw materials ................................................................................................. 3-3
3.2.2 Manufacturing Processes .............................................................................. 3-10
3.2.3 Recovery during manufacturing processes ................................................... 3-22
3.2.4 Environmental pollution during manufacturing process .............................. 3-25
3.2.5 Pulp and paper industry: Major challenges .................................................. 3-36
3.3 Technological Aspects .................................................................................................... 3-37
3.3.1 Cleaner technologies .................................................................................... 3-37
3.4 Benchmarking of Indian Paper Mills on Various Parameters ........................................ 3-43
3.5 Summary of Applicable National Regulations ............................................................... 3-51
3.5.1 General description of major statutes ........................................................... 3-51
3.5.2 General standards for discharge of environmental pollutants ...................... 3-51
3.5.3 Industry specific requirements ..................................................................... 3-51
3.5.4 Pending & proposed regulatory requirements .............................................. 3-53
Table of Contents
TGM for Pulp and Paper Industry ii August 2010
4. OPERATIONAL ASPECTS OF EIA 4-1
4.1 Coverage of Pulp & Paper Industry under the Purview of Notification ........................... 4-1
4.2 Screening .......................................................................................................................... 4-5
4.2.1 Applicable conditions for Category B projects .............................................. 4-5
4.2.2 Criteria for classification of Category B1 and B2 projects ............................ 4-5
4.2.3 Application for prior environmental clearance ............................................... 4-6
4.2.4 Siting guidelines ............................................................................................. 4-6
4.3 Scoping for EIA Studies ................................................................................................... 4-7
4.3.1 Pre-feasibility report ....................................................................................... 4-9
4.3.2 Guidance for providing information in Form 1 ............................................ 4-10
4.3.3 Identification of appropriate valued environmental components ................. 4-10
4.3.4 Methods for identification of impacts .......................................................... 4-11
4.3.5 Testing the Significance of Impacts ............................................................. 4-17
4.3.6 Terms of reference for EIA studies .............................................................. 4-17
4.4 Environmental Impact Assessment ................................................................................. 4-23
4.4.1 EIA team....................................................................................................... 4-24
4.4.2 Baseline quality of the environment ............................................................. 4-24
4.4.3 Impact prediction tools ................................................................................. 4-27
4.4.4 Significance of the impacts .......................................................................... 4-27
4.5 Social Impact Assessment .............................................................................................. 4-28
4.6 Risk Assessment ............................................................................................................. 4-31
4.6.1 Storage and handling of hazardous materials ............................................... 4-35
4.6.2 Hazard identification .................................................................................... 4-35
4.6.3 Hazard assessment and evaluation ............................................................... 4-35
4.6.4 Disaster management plan ............................................................................ 4-37
4.7 Mitigation Measures ....................................................................................................... 4-41
4.7.1 Important considerations for mitigation methods ......................................... 4-41
4.7.2 Hierarchy of elements of mitigation plan ..................................................... 4-42
4.7.3 Typical mitigation measures ......................................................................... 4-43
4.8 Environmental Management Plan ................................................................................... 4-47
4.9 Reporting ........................................................................................................................ 4-48
4.10 Public Consultation ......................................................................................................... 4-50
4.11 Appraisal ......................................................................................................................... 4-53
4.12 Decision Making ............................................................................................................. 4-54
4.13 Post-clearance Monitoring Protocol ............................................................................... 4-56
5. STAKEHOLDERS’ ROLES AND RESPONSIBILITIES 5-1
5.1 SEIAA .............................................................................................................................. 5-4
5.2 EAC and SEAC ................................................................................................................ 5-6
Table of Contents
TGM for Pulp and Paper Industry iii August 2010
LIST OF TABLES
Table 3-1: Consumption Pattern of Paper and Paper Boards in India ................................................ 3-2
Table 3-2: Major Raw Materials: Nature of Chemicals and Characteristics ...................................... 3-9
Table 3-3: Use of Additives and Product Aids ................................................................................. 3-10
Table 3-4: Pulping Processes – Raw material and End products ...................................................... 3-13
Table 3-5: Common Chemicals used for Bleaching of Pulp ............................................................. 3-20
Table 3-6: Environmental Characteristics for Raw Materials Used in Pulp & Paper Industry ........ 3-25
Table 3-7: Environmental Performance of Various Pulping Processes in Indian Mills ................... 3-26
Table 3-8: Advantages and Disadvantages of Common Chemicals used for Bleaching Pulp .......... 3-27
Table 3-9: Sources of Effluent Generation ....................................................................................... 3-28
Table 3-10: Characteristics of Effluent from Paper Mills ................................................................. 3-30
Table 3-11: Discharges from Paper Mill ........................................................................................... 3-30
Table 3-12: Typical Solid Waste Generation from Pulp & paper Mills ........................................... 3-31
Table 3-13: Characteristics of Kraft Mill Reduced Sulphur Gas ...................................................... 3-33
Table 3-14: Typical Emissions of Particulate Matter from Old and Modern Mills .......................... 3-33
Table 3-15: Typical Emissions of Total Reduced Sulphur from Old and Modern Mills .................. 3-34
Table 3-16: Typical Uncontrolled Emission Rates for SOx and NOx from Kraft Pulp Mill Combustion
Sources ............................................................................................................................ 3-34
Table 3-17: Air Emissions ................................................................................................................ 3-35
Table 3-18: Challenges of the paper industry ................................................................................... 3-36
Table 3-19: Fibre Use Efficiency (%) in Indian Paper Mills ............................................................ 3-43
Table 3-20: Sp. Energy Consumption in Indian Pulp Mills (GJ/BDMT of Unbld Pulp).................. 3-44

Table of Contents
TGM for Pulp and Paper Industry iv August 2010
Table 3-21: Specific Pulping Chemical Consumption in Indian Pulp Mills (Kg eqvt NaOH/ BDMT)3-
44
Table 3-22: Consumption of Elemental Chlorine in Indian Pulp Mills (KG// BDMT) .................... 3-44
Table 3-23: Bleaching Chemical Consumption (in Indian Pulp Mills) ............................................ 3-44
Table 3-24: Specific Water and Energy Consumption in Indian Pulp Mills in Bleach Plant
(m3/BDMT)..................................................................................................................... 3-45
Table 3-25: Specific Energy Consumption (GJ/BDMT Bleached Pulp) .......................................... 3-45
Table 3-26: Lime Use – Recovery % and Pulp Mill Energy Demand .............................................. 3-45
Table 3-27: Specific Energy Consumption in Paper Machine in Large Scale Indian Mills ............. 3-45
Table 3-28: Product Wise sp. Energy and Water Consumption during Papermaking in Indian Paper
Mills ................................................................................................................................ 3-46
Table 3-29: Specific Water Consumption (m3/ BDMT) in Indian mills – Basis Raw Material ....... 3-46
Table 3-30: Specific Water Consumption with Various Pulping Technologies in Indian Paper Mills
(m3/BDMT)..................................................................................................................... 3-46
Table 3-31: Sp Water Consumption in Indian Mills with Different Product Profiles (m3/ BDMT) 3-46
Table 3-32: Water Closure in Indian Paper Mills using Different Raw Materials (%)..................... 3-46
Table 3-33: Percentage of Total Energy Generated from the Biomass Wastes Internally in Indian
Mills (%) ......................................................................................................................... 3-47
Table 3-34: Specific Energy Consumption (GJ/BDMT) in Indian Mills .......................................... 3-47
Table 3-35: Specific Energy Consumption in Indian Mills (GJ/ BDMT) – Process Wise ............... 3-47
Table 3-36: Specific Energy Consumption in Indian Mills (GJ/BDMT) – Product Wise ................ 3-47
Table 3-37: Wastewater Characteristics from Wastepaper Pulping .................................................. 3-48
Table 3-38: Benchmarking Specific Average Wastewater Discharge of Large Scale Indian Pulp &
Paper Mills (m3/ BDMT) ................................................................................................ 3-48

Table of Contents
TGM for Pulp and Paper Industry v August 2010
Table 3-39: Benchmarking Specific Pollution Load of Indian Mills with European Mills (Kg/BDMT
product) ........................................................................................................................... 3-48
Table 3-40: Benchmarking Pollution Load (Kg/BDMT) of Large Scale Indian Paper Mills .......... 3-48
Table 3-41: Best Practice in Water Pollution Load of European Mills for Soft Wood Mills .......... 3-48
Table 3-42: Pollution Load in Indian Mills Effluent (Kg/BDMT of Product) .................................. 3-49
Table 3-43: Benchmarking Effluent Pollution-Load Discharged by Average Indian Large Scale Paper
Mills Vs. Global Best Practices ...................................................................................... 3-49
Table 3-44: Benchmarking Air Emissions by Indian Mills .............................................................. 3-50
Table 3-45: Solid Waste Generation & their Utilization in Indian Pulp & Paper Industry ............. 3-50
Table 3-46: Large Pulp & Paper/ Newsprint / Rayon Grade Pulp Plants of Capacity above 24000
TPA: Wastewater Discharge Standards .......................................................................... 3-51
Table 3-47: Small Pulp & Paper Industry: Standards for Liquid Effluents ...................................... 3-51
Table 3-48: Wastewater Discharge Standards .................................................................................. 3-52
Table 3-49: Emission Standards (For Large Pulp & Paper Industry) ............................................... 3-52
Table 3-50: Wastewater Generation Standards ................................................................................. 3-52
Table 3-51: Load Based Standards ................................................................................................... 3-53
Table 4-1: Advantages and Disadvantages of Impact Identification Methods ................................. 4-11
Table 4-2: Impact Matrix .................................................................................................................. 4-13
Table 4-3: List of Important Physical Environment Components and Indicators of EBM .............. 4-25
Table 4-4: Choice of Models for Impact Predictions: Risk Assessment .......................................... 4-32
Table 4-5: Typical Mitigation Measures ........................................................................................... 4-44
Table 4-6: Structure of EIA Report ................................................................................................... 4-48
Table 5-1: Roles and Responsibilities of Stakeholders Involved in Prior Environmental Clearance 5-1

Table of Contents
TGM for Pulp and Paper Industry vi August 2010
Table 5-2: Organization-specific Functions ........................................................................................ 5-2
Table 5-3: SEIAA: Eligibility Criteria for Chairperson/ Members/ Secretary ................................... 5-5
Table 5-4: EAC/SEAC: Eligibility Criteria for Chairperson / Members / Secretary .......................... 5-8
Table of Contents
TGM for Pulp and Paper Industry vii August 2010
LIST OF FIGURES
Figure 2-1: Inclusive Components of Sustainable Development ........................................................ 2-1
Figure 2-2: Types of Impacts ............................................................................................................ 2-14
Figure 2-3: Cumulative Impact ......................................................................................................... 2-15
Figure 3-1: Typical Pulp & paper Manufacturing Process ............................................................... 3-14
Figure 3-2: Agro-residue based Manufacturing Process ................................................................... 3-15
Figure 3-3: Typical Wood based Pulp & Paper Manufacturing Process .......................................... 3-18
Figure 3-4: Secondary Fibre or Wastepaper based Manufacturing Process ..................................... 3-21
Figure 3-5: Schematic Diagram of Chemical Recovery Flow Process ............................................. 3-22
Figure 3-6: Soda Recovery Process .................................................................................................. 3-23
Figure 3-7: Re-causticisation Process ............................................................................................... 3-24
Figure 3-8: Process flow sheet for Non Conventional Recovery process ......................................... 3-25
Figure 4-1: Prior Environmental Clearance Process for Activities Falling Under Category A ......... 4-3
Figure 4-2: Prior Environmental Clearance Process for Activities Falling Under Category B ......... 4-4
Figure 4-3: Approach for EIA Study ................................................................................................ 4-23
Figure 4-4: Risk Assessment – Conceptual Framework ................................................................... 4-32
Figure 4-5: Comprehensive Risk Assessment - At a Glance ............................................................ 4-34
Figure 4-6: Elements of Mitigation ................................................................................................... 4-42

Table of Contents
TGM for Pulp and Paper Industry viii August 2010
ACRONYMS
AAQ Ambient Air Quality
ADP Air Dried Pulp
APCD Air Pollution Control Devices
B/C Benefits Cost Ratio
BAT Best Available Technology
BOD Biochemical Oxygen Demand
BOQ Bill of Quantities
BOT Build Operate Transfer
CCA Conventional Cost Accounting
CER Corporate Environmental Reports
CEAA Canadian Environmental Assessment Agency
CFE Consent for Establishment
CPCB Central Pollution Control Board
CREP Corporate Responsibility for Environmental Protection
CRP Chemical Recovery Plant
CRZ Coastal Regulatory Zone
CTMP Chemo-Thermo-Mechanical Pulping
DMP Disaster Management Plan
EAC Expert Appraisal Committee
ECI Environmental Condition Indicators
EcE Economic-cum-Environmental
EIA Environmental Impact Assessment
EIS Environmental Information System
EMA Environmental Management Accounting
EMP Environmental Management Plan
EMS Environmental Management System
EPI Environmental Performance indicators
EPR Extended Producers Responsibilities
EPZ Export Processing Zones
ES Environmental Statements
FCA Full Cost Assessment
HAZOP Hazard and Operability Studies
HTL High Tide Level
IL&FS Infrastructure Leasing and Financial Services
IVI Importance Value Index
ISO International Standard Organization
Table of Contents
TGM for Pulp and Paper Industry ix August 2010
LCA Life Cycle Assessment
LDAR Leak Detection and Repair
LTL Low Tide Level
MCA Maximum Credible Accident
MoEF Ministry of Environment & Forests
NAQM National Air Quality Monitoring
NMCC National Manufacturing Competitiveness Council
NPE Nonyl Phenol Ethoxylates
O&M Operation and Maintenance
OECD Organization for Economic Co-operation and Development
PA Peracetic Acid
PM Particulate Matter
PPA Participatory Poverty Assessment
PRA Participatory Rural Appraisal
QA/QC Quality Assurance/Quality Control
QRA Quantitative Risk Assessment
SEA Strategic Environmental Assessment
SEAC State Level Expert Appraisal Committee
SEIAA State Level Environment Impact Assessment Authority
SEZ Special Economic Zone
SIA Social Impact Assessment
SME Small and Medium Scale Enterprises
SPCB State Pollution Control Board
SPM Suspended Particulate Matter
SS Suspended Solids
TA Technology Assessment
TCA Total Cost Assessment
TCF Total Chlorine Free Bleaching
TCLP Toxicity Characteristic Leaching Procedure
TOCL Total Organic Chloride
TEQM Total Environmental Quality Movement
TGM Technical EIA Guidance Manual
ToR Terms of Reference
TPA Tonnes per Annum
TRS Total Reduced Sulphur
USEPA United States Environment Protection Agency
UT Union Territory
UTEIAA Union Territory Level Environment Impact Assessment Authority
Table of Contents
TGM for Pulp and Paper Industry x August 2010
UTPCC Union Territory Pollution Control Committee
VOC Volatile Organic Compound

Table of Contents
TGM for Pulp and Paper Industry xi August 2010
LIST OF ANNEXURES
Annexure I
A Compilation of Legal Instruments
Annexure II
General Standards for Discharge of Environmental Pollutants as per CPCB
Annexure III
Form 1 (Application Form for Obtaining EIA Clearance)
Annexure IV
Critically Polluted Industrial Areas and Clusters / Potential Impact Zone
Annexure V
Pre-feasibility Report: Points for Possible Coverage
Annexure VI
Types of Monitoring and Network Design Considerations
Annexure VII
Guidance for Assessment of Baseline Components and Attributes
Annexure VIII
Sources of Secondary Data
Annexure IX
Impact Prediction Tools
Annexure X
Form through which the State Government/Administration of the Union Territories
Submit Nominations for SEIAA and SEAC for the Consideration and Notification by the
Central Government.
Annexure XI
Composition of EAC/SEAC
Annexure XII
Best Practices & Latest Technologies available and reference

dd
q{RTJT TAQTJAIRAM RAMESH "rq
df (etir uarre)qqteeq Eti Td
aIEd ?r*nrtag Rcft-r r oooe
MINISTER OF STATE (INDEPENDENT CHARGE}ENVIRONMENT & FORESTS
GOVERNMENT OF INDIANEW DELHI - 110 OO3
22"d December 2010
FOREIA/ORD
The Ministry of Environment & Forests (MOEF) introduced the Environmental ImpactAssessment (EIA) Notification 2006 on 14u' Septembet 2006, which not only reengineered theentire environment clearance (EC) process specified under the EIA Notification 1994, but alsointroduced a number of new developmental sectors which would require prior environmentalclearance. The EIA Notification 2006 has notified a list of 39 developmental sectors which havebeen further categorised as A or B based on their capacity and likely environmental impacts.Category B projects have been further categorised as 81 and 82. The EIA NotiJication 2006 hasfurther introduced a system of screening, scoping and appraisal and for the setting up ofEnvironment Impact Assessment Authority (EIAA) at the Central level and State LevelEnvironment Impact Assessment Authorities (SEIAAs) to grant environmental clearances at theCentral and State level respectively. The Ministry of Environment & Forests is the EnvironmentImpact Assessment Authority at the Central level and 25 State Level Environment ImpactAssessment Authorities (SEIAAS) have been set up in the various States/UTs. The EIANotification 2006 also stipulates the constitution of a multi-disciplinary Expert AppraisalComrnittee (EAC) at the Centre and State level Expert Appraisal Committees (SEACs) atState/ UT Level for appraisal of Category A or B projects respectively and to recommendgrant/rejection of environmental clearance to each project/ activities falling under tfre varroussectors to the EIAA/SEIAAs respectively.
Although the process of obtaining environmental clearance consisting of Screening,Scoping and Appraisal and for undertaking public consultation including the process ofconduct of Public Hearing has been elaborated under the EIA Notification 2006, fl'Le Notilicationitself provides for bringing out guidelines from time to time on the EIA Notification 2006 andthe EC process with a view to bringing clarity on the EC process for expediting environmentalclearance. This need was further reinforced after the constitution of SEIAAs and SEACs invarious States, who were assigned the task for the first time and with a need for addressing theconcerns of standardization of the quality of appraisal and in reducing inconsistencies betweenSEACs/SEIAAs in granting ECs for similar projects in different States.
The Technical Guidance Manual of "Pulp And Paper Industries" sector describes typesof process and pollution control technologies, operational aspects of EIA with model TOR ofthat Sector, technological options with cleaner production and waste minimization techniques,

monitoring of environmental quality, post clearance monitoring protocol, related regulations,and procedure of obtaining EC if linked to other clearances for e.g ., CRZ, etc.
Pulp & paper industuies are complex in nature consisting of emissions from severalprocesses determined by the quality and type of paper required and raw material used and theprevailing management practices. Implementation of cleaner production processes andpollution prevention measures can yield both economic and environmental benefits and shouldalso focus on reducing wastewatet discharges and air emissions. India's industrialcompetitiveness and environmental future depends on Industries such as Pulp And PaperIndustries adopting energy and resource efficient technologies. Recycling and reuse of materialsis critical.
To keep pace with changing technologies and needs of sustainable development, themanual would require regular updating in the future. The manual will be available on theMoEF website and we would appreciate receiving responses from stakeholders for furtherlmprovemen6.
I congratulate the entire team of IL&FS Ecosmart Ltd., experts from the sector who wereinvolved in the preparation of the Manuals, Chairman and rnembers of the Core and PeerComrnittees of various sectors and various Resource Persons whose inouts were indeedvaluable in the preparation and finalization of the Manuals.
\ - - ' - ' ' ' /f
i t;-+t".au ^1 t
(Jairam Ramesh)

TGM for Pulp and Paper Industry 1-1 August 2010
1. INTRODUCTION TO THE TECHNICAL EIA
GUIDANCE MANUALS PROJECT
Environmental Impact Assessment (EIA) is a process of identifying, predicting,
evaluating and mitigating the biophysical, social, and other relevant effects of
development proposals prior to major decisions being taken and commitments made.
These studies integrate the environmental concerns of developmental activities into the
process of decision-making.
EIA has emerged as one of the successful policy innovations of the 20th Century in the
process of ensuring sustained development. Today, EIA is formalized as a regulatory tool
in more than 100 countries for effective integration of environmental concerns in the
economic development process. The EIA process in India was made mandatory and was
also given a legislative status through a Notification issued by the Ministry of
Environment and Forests (MoEF) in January 1994. The Notification, however, covered
only a few selected industrial developmental activities. While there are subsequent
amendments, the Notification issued on September 14, 2006 supersedes all the earlier
Notifications, and has brought out structural changes in the clearance mechanism.
The basic tenets of this EIA Notification could be summarized into the following:
Pollution potential as the basis for prior environmental clearance instead of
investment criteria; and
Decentralization of clearing powers to the State/Union Territory (UT) level
Authorities for certain developmental activities to make the prior environmental
clearance process quicker, transparent and effective.
Devolution of the power to grant clearances at the state level for certain category of the
developmental activities / projects is a step forward to fulfill the basic tenets of the re-
engineering i.e., quicker, transparent and effective process but many issues impede/hinder
its functional efficiency. These issues could be in technical and operational domains as
listed below:
Technical issues
Ensuring level playing ground to avoid arbitrariness in the decision-making process
Classification of projects which do not require public hearing and detailed EIA
(Category B2)
Variations in drawing Terms of Reference (ToR) of EIA studies for a given
developmental activity across the States/UTs
Varying developmental-activity-specific expertise requirement for conducting EIA
studies and their appraisal
Availability of adequate sectoral experts and variations in competency levels
Inadequate data verification, cross checking tools and supporting institutional
framework

Introduction
TGM for Pulp and Paper Industry 1-2 August 2010
Meeting time targets without compromising with the quality of assessments/ reviews
Varying knowledge and skill levels of regulators, consultants and experts
Newly added developmental activities for prior environmental clearance, etc.
Operational issues
State level /UT level EIA Authorities (SEIAA/UTEIAA) are formulated for the first
time and many are functioning
Varying roles and responsibilities of involved organizations
Varying supporting institutional strengths across the States/UTs
Varying manpower availability, etc.
1.1 Purpose
The purpose of developing the sector-specific technical EIA guidance manuals (TGM) is
to provide clear and concise information on EIA to all the stakeholders i.e., the project
proponent, the consultant, the reviewer, and the public. The TGMs are organized to cover
following:
Chapter 1 (Introduction): This chapter provides a brief introduction on the EIA, basic
tenets of EIA Notification, technical & operational issues in the process of clearance,
purpose of the TGMs, project implementation process and additional information.
Chapter 2 (Conceptual facets of an EIA): Provides an overall understanding to the
conceptual aspects of control of pollution and EIA for the developmental projects. This
basic understanding would set the readers at same level of understanding for proper
interpretations and boundaries for identifying the environmental interactions of the
developmental projects and their significance for taking measures of mitigation. This
chapter covers the discussion on environment in EIA context i.e., sustainable
development, pollution control strategies, preventive environmental management tools,
Objectives of EIA, types and basic principles of EIA, project cycle for pulp and paper
industry, understanding on type of environmental impacts and the criteria for the
significance analysis.
Chapter 3 (The industry): The purpose of this chapter is to provide the reader precise
information on all the relevant aspects of the industry, which is essential to realize the
likely interaction of such developmental activities on the receiving environment. Besides,
this Chapter gives a holistic understanding on the sources of pollution and the
opportunities of the source control.
The specific coverage which provides precise information on the industry include (i)
introduction to industry in India, (ii) Scientific Aspects of the Industrial Process - Raw
materials sourcing and transportation, raw material storage , handling and preparation
Manufacturing Processes, Recovery during manufacturing processes, Environmental
pollution during manufacturing process, Major challenges in the industry, (iii) cleaner
technologies, (iv) Benchmarking of Indian paper mills on various parameter and (v) the
summary of applicable national regulation for this developmental activity.
Chapter 4 (Operational aspects): The purpose of this chapter is to facilitate the
stakeholders to extend clear guidance on coverage of legislative requirements, sequence
of procedures for obtaining the EIA clearance and each step-wise provisions and
considerations.

Introduction
TGM for Pulp and Paper Industry 1-3 August 2010
The coverage of the Chapter include provisions in the EIA Notification regarding pulp
and paper industry, screening (criteria for categorization of B1 and B2, siting guidelines,
etc.), scoping (pre-feasibility report, guidance for filling form 1, identification of valued
environmental components, identification of impacts, etc.), arriving at terms of reference
for EIA studies, impact assessment studies (EIA team, assessment of baseline quality of
environment, impact prediction tools, significance of impacts), social impact assessment,
risk assessment considerations, typical mitigation measures, designing considerations for
environmental management plan, structure of EIA report for incorporation of study
findings, process of public consultation, project appraisal, decision making process and
post-clearance monitoring protocol.
Chapter 5 (Roles and responsibilities of various organizations involved in the process of
prior environmental clearance): The purpose of this Chapter is to brief the stakeholders on
the institutional mechanism and roles & responsibilities of the stakeholders involved in
the process of prior environmental clearance. The Coverage of the Chapter include (i)
roles and responsibilities of the stakeholders, (ii) organization specific functions, (iii)
constitution, composition and decision making process of SEIAA and (iv) EAC & SEAC
and (v) other conditions which may be considered.
Conceptual facets of an EIA
Details on the developmental activity including environmental concerns and control
technologies etc.
Operational aspects; and
Roles and responsibilities of various organizations involved in the process of prior
environmental clearance
For any given industry, each topic listed above could alone be the subject of a lengthy
volume. However, in order to produce a manageable document, this project focuses on
providing summary information for each topic. This format provides the reader with a
synopsis of each issue. Text within each section was researched from many sources, and
was usually condensed from more detailed sources pertaining to specific topics.
The contents of the document are designed with a view to facilitate addressing of the
relevant technical and operational issues as mentioned in the earlier section. Besides, it
facilitates various stakeholders involved in the EIA clearance process i.e.
Project proponents will be fully aware of the procedures, common ToR for EIA
studies, timelines, monitoring needs, etc., in order to plan the projects/studies
appropriately.
Consultants across India will gain similar understanding about a given sector, and
also the procedure for EIA studies, so that the quality of the EIA reports gets
improved and streamlined
Reviewers across the states/UTs will have the same understanding about an industry
sector and would able to draw a benchmark in establishing the significant impacts for
the purpose of prescribing the ToR for EIA studies and also in the process of review
and appraisal.
Public who are concerned about new or expansion projects, use this manual to get a
basic idea about the manufacturing/production details, rejects/wastes from the
operations, choice of cleaner/control technologies, regulatory requirements, likely
environmental and social concerns, mitigation measures, etc., in order to seek
clarifications appropriately in the process of public consultation. The procedural
Introduction
TGM for Pulp and Paper Industry 1-4 August 2010
clarity in the document will further strengthen them to understand the stages involved
in clearance and roles and responsibilities of various organizations.
In addition, these manuals would substantially ease the pressure on reviewers at the
scoping stage and would bring in functional efficiency at the central and state levels.
1.2 Project Implementation
The Ministry of Environment & Forests (MoEF), Government of India took up the task of
developing sector-specific technical EIA guidance manuals for all the developmental
activities listed in the re-engineered EIA Notification. The Infrastructure Leasing and
Financial Services Ecosmart Limited (IL&FS Ecosmart), has been entrusted with the task
of developing these manuals for 27 industrial and related sectors. Pulp & paper industry
is one of these sectors, for which this manual is prepared.
The ability to design comprehensive EIA studies for specific industries depends on the
knowledge of several interrelated topics. Therefore, it requires expert inputs from
multiple dimensions i.e., administrative, project management, technical, scientific, social,
economic, risk etc., in order to comprehensively analyze the issues of concern and to
draw logical interpretations. Thus, Ecosmart has designed a well-composed
implementation framework to factor inputs of the experts and stakeholders in the process
of finalization of these manuals.
The process of manual preparation involved collection & collation of the secondary
available information, technical review by sectoral resource persons and critical review &
finalization by a competent Expert Committee composed of core and sectoral peer
members.
The MoEF appreciates the efforts of Ecosmart, Expert Core and Peer Committee,
resource persons and all those who have directly and indirectly contributed to this
Manual. .
1.3 Additional Information
This TGM is brought out by the MoEF to provide clarity to all the stakeholders involved
in the ‘Prior Environmental Clearance’ process. As such, the contents and clarifications
given in this document do not withstand in case of a conflict with the statutory provisions
of the Notifications and Executive Orders issued by the MoEF from time-to-time.
TGMs are not regulatory documents. Instead, these are the tools designed to assist in
successful completion of an EIA. For the purpose of this project, the key elements
considered under TGMs are: conceptual aspects of EIA; developmental activity-specific
information; operational aspects; and roles and responsibilities of involved stakeholders.
This manual is prepared considering the Notification issued on September 14, 2006 and
its latest amendment on 1st December 2009. For recent updates, if any, may please refer
the website of the MoEF, Government of India i.e., http://moef.nic.in/index.php

TGM for Pulp and Paper Industry 2-1 August 2010
2. CONCEPTUAL FACETS OF EIA
It is an imperative requirement to understand the basic concepts concerned to the
pollution control and the environmental impact assessment in an overall objective of the
sustainable development. This Chapter highlights the pollution control strategies and
their tools besides the objectives, types & principles of EIA, type of impacts their
significance analysis, in order to provide consistent understanding to the reader before
assessing the development of activity-specific environmental concerns in Chapter 3 and
identification & prediction of significant impacts in order to design mitigation measures
as detailed in Chapter 4.
2.1 Environment in EIA Context
“Environment” in EIA context mainly focuses, but is not limited to physical, chemical,
biological, geological, social, economical, and aesthetic dimensions along with their
complex interactions, which affect individuals, communities and ultimately determines
their forms, character, relationship, and survival. In EIA context, ‘effect’ and ‘impact’
can often be used interchangeably. However, ‘impact’ is considered as a value judgment
of the significance of an effect.
Sustainable development is built on three basic premises i.e., economic growth,
ecological balance and social progress. Economic growth achieved in a way that does not
consider the environmental concerns, will not be sustainable in the long run. Therefore,
sustainable development needs careful integration of environmental, economic, and social
needs in order to achieve both an increased standard of living in short term, and a net gain
or equilibrium among human, natural, and economic resources to support future
generations in the long term.
“It is necessary to understand the links between environment and development in order to
make choices for development that will be economically efficient, socially equitable and
responsible, as well as environmentally sound.”
Figure 2-1: Inclusive Components of Sustainable Development

Conceptual Facets of EIA
TGM for Pulp and Paper Industry 2-2 August 2010
2.2 Pollution Control Strategies
Pollution control strategies can be broadly categorized in to preventive and reactive. The
reactive strategy refers to the steps that may be applied once the wastes are generated or
contamination of the receiving environment takes place. The control technology or a
combination of technologies to minimize the impact due to the process rejects/wastes
varies with quantity and characteristics, desired control efficiency and economics.
Many combinations of techniques could be adopted for treatment of a specific waste or
the contaminated receiving environment, but are often judged based on techno-economic
feasibility. Therefore, the best alternative is to take all possible steps to avoid pollution it
self. This preventive approach refers to a hierarchy that involves i) prevention &
reduction; ii) recycling and re-use; iii) treatment; and iv) disposal, respectively.
Therefore, there is a need to shift the emphasis from the reactive to preventive strategy
i.e., to promote preventive environmental management. Preventive environmental
management tools may be grouped into management based tools, process based tools and
product based tools, which are given below:
Management Based Tools Process Based Tools Product Based Tools
Environmental Management
System (EMS)
Environmental Performance
Evaluation
Environmental Audits
Environmental Reporting
and Communication
Total Cost Accounting
Law and Policy
Trade and Environment
Environmental Economics
Environmental Technology Assessment
Toxic Use Reduction
Best Operating Practices
Environmentally Best Practice
Best Available Technology (BAT)
Waste Minimization
Pollution Prevention
Cleaner Production
4-R Concept
Cleaner Technology
Eco-efficiency
Industrial Ecology
Extended Producers
Responsibility
Eco-labeling
Design for
Environment
Life Cycle
Assessment (LCA)
2.3 Tools for Preventive Environmental Management
The tools for preventive environmental management can be broadly classified into
following three groups.
Tools for assessment and analysis - risk assessment, life cycle assessment, total cost
assessment, environmental audit / statement, environmental benchmarking,
environmental indicators
Tools for action - environmental policy, market based economic instruments,
innovative funding mechanism, EMS and ISO certification, total environmental
quality movement, eco-labeling, cleaner production, eco-efficiency, industrial
ecosystem or metabolism, voluntary agreements
Tools for communication - state of environment, corporate environmental reporting
Specific tools under each group are discussed precisely in next sections.

Conceptual Facets of EIA
TGM for Pulp and Paper Industry 2-3 August 2010
2.3.1 Tools for assessment and analysis
2.3.1.1 Risk assessment
Risk is associated with the frequency of failure and consequence effect. Predicting such
situations and evaluation of risk is essential to take appropriate preventive measures. The
major concern of the assessment is to identify the activities falling in a matrix of high &
low frequencies at which the failures occur and the degree of its impact. The high
frequency, low impact activities can be managed by regular maintenance i.e, LDAR
(Leak detection and repair) programmes. Whereas, the low frequency, high impact
activities are of major concern (accidents) in terms of risk assessment. As the frequency
is low, often the required precautions are not realized or maintained. However, risk
assessment identifies the areas of major concerns which require additional preventive
measures; likely consequence distances considering domino effects, which will give the
possible casualties and ecological loss in case of accidents. These magnitudes demand
the attention for preventive and disaster management plans (DMP). Thus is an essential
tool to ensure safety of operations.
2.3.1.2 Life cycle assessment
A broader approach followed to deal with environmental impacts during manufacturing is
called LCA. This approach recognizes that environmental concerns are associated with
every step of the processing w.r.t. manufacturing of products and also examines
environmental impacts of the product at all stages of the project life cycle. LCA includes
product design, development, manufacturing, packaging, distribution, usage and disposal.
LCA is concerned with reducing environmental impacts at all the stages and considering
the total picture rather than just one stage of the production process.
Industries/firms may apply this concept to minimize costs incurred on the environmental
conservation throughout the project life cycle.
2.3.1.3 Total cost assessment
Total Cost Assessment (TCA) is an enhanced financial analysis tool that is used to assess
the profitability of alternative courses of action e.g., raw material substitution to reduce
the costs of managing the wastes generated by process; an energy retrofit to reduce the
costs of energy consumption. This is particularly relevant for pollution prevention
options. These options, because of their nature, often produce financial savings that are
overlooked in conventional financial analysis, either because they are misallocated,
uncertain, and hard to quantify, or occur more than three to five years after the initial
investment. TCA includes all relevant costs and savings associated with an option so that
it can compete for scarce capital resources fairly, on a level playing field. The
assessments are often beneficial w.r.t. the following:
Identification of costly resource inefficiencies
Financial analysis of environmental activities/projects such as investment in cleaner
technologies
Prioritization of environmental activities/projects
Evaluation of product mix and product pricing
Bench marking against the performance of other processes or against the competitors
A comparison of cost assessments is given below:

Conceptual Facets of EIA
TGM for Pulp and Paper Industry 2-4 August 2010
Conventional cost accounting (CCA): Direct and indirect financial costs+ Recognized
contingent costs
Total Cost Assessment (TCA): A broader range of direct, indirect, contingent and
less quantifiable costs
Full Cost assessment (FCA): TCA + External social costs borne by society
2.3.1.4 Environmental audit/statement
Key objectives of an environmental audit includes compliance verification, problem
identification, environmental impact measurement, environmental performance
measurement, conforming effectiveness of EMS, providing a database for corrective
actions and future actions, developing company’s environmental strategy, communication
and formulating environmental policy.
The MoEF, Government of India issued Notification on ‘Environmental Statements’ (ES)
in April, 1992 and further amended in April 1993 – As per the Notification, the industries
are required to submit environmental statements to the respective State Pollution Control
Board (SPCB). ES is a proactive tool for self-examination of the industry itself to
reduce/minimize pollution by adopting process modifications, recycling and reusing of
the resources. The regular submission of ES will indicate the systematic improvement in
environmental pollution control being achieved by the industry. In other way, the specific
points in ES may be used as environmental performance indicators for relative
comparison, implementation and to promote better practices.
2.3.1.5 Environmental benchmarking
Environmental performance and operational indicators could be used to navigate, manage
and communicate the significant aspects and give enough evidence of good
environmental house keeping. Besides the existing prescribed standards, an insight to
identify the performance indicators and prescribing schedule for systematic improvement
in performance of these indicators will yield better results.
Relative indicators may be identified for different industrial sectors and be integrated in
companies and organizations to monitor and manage the different environmental aspects
of the company, to benchmark and compare two or more companies from the same sector.
These could cover water consumption, wastewater generation, energy consumption,
solid/hazardous waste generation, chemical consumption etc., per tonne of final product.
Once these bench marks are developed, the industries which are below them may be
guided and enforced to reach them while those which are better than the benchmark may
be encouraged further by giving incentives etc.
2.3.1.6 Environmental indicators
Indicators can be classified in to environmental performance indicators (EPI) and
environmental condition indicators (ECI). The EPIs can be further divided into two
categories i.e., operational performance indicators and management performance
indicators.
The operational performance indicators are related to the process and other operational
activities of the organization. These would typically address the issue of raw material
consumption, energy consumption, water consumption in the organization, the quantities
of wastewater generated, other solid wastes & emissions generated from the organization
etc.

Conceptual Facets of EIA
TGM for Pulp and Paper Industry 2-5 August 2010
Management performance indicators are related to the management efforts to influence
the environmental performance of the organisational operations.
The environmental condition indicators provide information about the environment.
These indicators provide information about the local, regional, national or global
condition of the environment. This information helps an organization to understand the
environmental impacts of its activities and thus helps in taking decisions to improve the
environmental performance.
Indicators basically used to evaluate environmental performance against the set standards
and thus indicate the direction in which to proceed. Selection of type of indicators for a
firm or project depends upon its relevance, clarity and realistic cost of collection and its
development.
2.3.2 Tools for action
2.3.2.1 Environmental policy
An environmental policy is a statement of an organization’s overall aim and principles of
action w.r.t the environment, including compliance with all relevant regulatory
requirements. It is a key tool in communicating environmental priorities of the
organization to all its employees. To ensure organization’s commitment towards a
formulated environmental policy, it is essential for the top management to be involved in
the process of formulating the policy and setting priorities. Therefore, the first step is to
get the commitment from the higher levels of management. The organization should then
conduct an initial environmental review and draft an environmental policy. This draft
should be discussed and approved by the board of directors. The approved environmental
policy statement, should then be communicated internally among all its employees and
must also be made available to the public.
2.3.2.2 Market-based economic instruments
Market based instruments are regulations that encourage behavior through market signals
rather than through explicit directives regarding pollution control levels. These policy
instruments such as tradable permits, pollution charge are often described as harnessing
market forces. Market based instruments can be categorized into the following four
major categories which are discussed below.
Pollution charge: Charge system will assess a fee or tax on the amount of pollution a
firm or source generates. It is worthwhile for the firm to reduce emissions to the
point, where its marginal abatement costs is equal to the tax rate. Thus firms control
pollution to different degrees i.e. High cost controllers – less; low-cost controllers-
more. The charge system encourages the industries to further reduce the pollutants.
The collected charges can form a fund for restoration of the environment. Another
form of pollution charge is a deposit refund system, where, consumers pay a
surcharge when purchasing a potentially polluting product, and receive a refund on
return of the product after useful life span at appropriate centers. The concept of
extended producers’ responsibility brought in to avoid accumulation of dangerous
products in the environment.
Tradable permits: Under this system, firms that achieve the emission levels below
their allotted level may sell the surplus permits. Similarly, the firms, which are
required to spend more to attain the required degree of treatment/allotted levels, can
purchase permits from others at lower costs and may be benefited.

Conceptual Facets of EIA
TGM for Pulp and Paper Industry 2-6 August 2010
Market barrier reductions: Three known market barrier reduction types are as
follows:
– Market Creation: Measures that facilitate the voluntary exchange of water rights
and thus promote more efficient allocation of scarce water supplies.
– Liability Concerns: Encourage firms to consider potential environmental damages
of their decisions
– Information Programmes: Eco-labeling and energy- efficiency product labeling
requirements
Government subsidy reduction: Subsidies are the mirror images of taxes and, in
theory, can provide incentive to address environmental problems. However, it has
been reported that the subsidies encourage economically inefficient and
environmentally unsound practices, and often leads to market distortions due to
differences in the area. However, these are important to sustain the expansion of
production, in the national interests. In such cases, the subsidy may be comparable to
the net social benefit.
2.3.2.3 Innovative funding mechanism
There are many forums under which the fund is made available for the issues which are of
global/regional concern (GEF, OECD, Deutch green fund, etc.) i.e., climate change, Basal
Convention and further fund sources are being explored for the Persistent Organic
Pollutants Convention. Besides the global funding mechanism, there needs to be
localized alternative mechanisms for boosting the investment in environmental pollution
control. For example, in India the Government has established mechanism to fund the
common effluent treatment plants, which are specifically serving the small and medium
scale enterprises i.e., 25% share by the State Government, matching grants from the
Central Government and surety for 25% soft loan. It means that the industries need to
invest only 25% initially, thus encouraging voluntary compliance.
There are some more options i.e., if the pollution tax/charge is imposed on the residual
pollution being caused by the industries, municipalities etc., fund will automatically be
generated, which in turn, can be utilized for funding the environmental improvement
programmes. The emerging concept of build-operate-transfer (BOT) is an encouraging
development, where there is a possibility to generate revenue by application of advanced
technologies. There are many opportunities which can be explored. However, what is
required is the paradigm shift and focused efforts.
2.3.2.4 EMS and ISO certification
EMS is that part of the overall management system, which includes the organizational
structure, responsibilities, practices, procedures, process and resources for determining
and implementing the forms of overall aims, principles of action w.r.t the environment. It
encompasses the totality of organizational, administrative and policy provisions to be
taken by a firm to control its environmental influences. Common elements of an EMS are
the identification of the environmental impacts and legal obligations, the development of
a plan for management & improvement, the assignment of the responsibilities and
monitoring of the performance.
2.3.2.5 Total environmental quality movement (TEQM)
Quality is regarded as

Conceptual Facets of EIA
TGM for Pulp and Paper Industry 2-7 August 2010
A product attribute that had to be set at an acceptable level and balanced against the
cost
Something delivered by technical systems engineered by experts rather than the
organization as a whole
Assured primarily through the findings and correction of mistakes at the end of the
production process
One expression of the total environment quality movement (TEQM) is a system of control
called Kaizen. The principles of Kaizen are:
Goal must be continuous improvement of quality instead of acceptable quality
Responsibility of the quality shall be shared by all members of an organization
Efforts should be focused on improving the whole process and design of the products
With some modifications, TEQM approach can be applied in the improvement of
corporate environmental performance in both process and product areas.
2.3.2.6 Eco-labeling
Eco-labeling is the practice of supplying information on the environmental characteristics
of a product or service to the general public. These labeling schemes can be grouped into
three types:
Type I: Multiple criteria base; third party (Govt. or non-commercial private
organizations) programme claims overall environmental preferability.
Type II: Specific attribute of a product; often issued by a company/industrial
association
Type III: Agreed set of indices; provide quantified information; self declaration
Among the above, Type I are more reliable because they are established by a third party
and considers the environmental impacts of a product from cradle to grave. However, the
labeling program will only be effective if linked with complementary program of
consumer education and up on restriction of umbrella claims by the producers.
2.3.2.7 Cleaner production
Cleaner production is one of the tools, which has lot of bearing on environmental
pollution control. It is also seen that the approach is changing with time i.e., dumping-to-
control-to-recycle-to-prevention. Promotion of cleaner production principles involve an
insight into the production processes not only to get desired yield but also to optimize on
raw material consumption i.e., resource conservation and implications of the waste
treatment and disposal.
2.3.2.8 4-R concept
The concept endorses utilization of wastes as a by-product to the extent possible i.e., Re-
cycle, Recover, Reuse, Recharge. Recycling refers to using wastes/by-products in the
process again as a raw material to maximize production. Recovery refers to engineering
means such as solvent extraction, distillation, precipitation etc. to separate the useful
constituents of wastes, so that these recovered materials can be used. Re-use refers to the
utilization of waste from one process as a raw material to other. Recharging is an option
in which the natural systems are used for renovation of waste for further use.

Conceptual Facets of EIA
TGM for Pulp and Paper Industry 2-8 August 2010
2.3.2.9 Eco-efficiency
The World Business Council on sustainable development (WBCSD) defines eco-
efficiency as “the delivery of competitively priced goods and services that satisfy human
needs and bring quality of life, while progressively reducing ecological impacts and
resource intensity throughout the life cycle, to a level at least in line with earth’s carrying
capacity”. The business implements the eco-efficiency on four levels i.e. optimized
processes, recycling of wastes, eco-innovation and new services. Fussler (1995) defined
six dimensions of eco efficiency, which are given below to understand/examine the
system.
Mass: There is an opportunity to significantly reduce mass burdens (raw materials,
fuels, utilities consumed during the life cycle)
Reduce Energy Use: The opportunity is to redesign the product or its use to provide
significant energy savings
Reduce Environmental Toxins: This is concern to the environmental quality and
human health. The opportunity here is to significantly control the dispersion of toxic
elements.
Recycle when Practical: Designing for recyclibility is important
Working with Mother Nature: Materials are borrowed and returned to the nature
without negatively affecting the balance of the ecosystem.
Make it Last Longer: It relates to useful life and functions of products. Increasing
the functionality of products also increase their eco efficiency.
The competitiveness among the companies and long-term survival will continue and the
successful implementation of eco efficiency will contribute to their success. There is a
need to shift towards responsible consumerism equal to the efficiency gains made by
corporations – doing more with less.
2.3.2.10 Industrial ecosystem or metabolism
Eco-industrial development is a new paradigm for achieving excellence in business and
environmental performance. It opens up innovative new avenues for managing business
and conducting economic development by creating linkages among local ’resources’,
including businesses, non-profit groups, governments, unions, educational institutions,
and communities. They can creatively foster the dynamic and responsible growth.
Antiquated business strategies based on isolated enterprises are no longer responsive
enough to market, environmental and community requirements.
Sustainable eco-industrial development looks systematically at development, business and
environment, attempting to stretch the boundaries of current practice - on one level. It is
as directly practical as making the right connections between the wastes and resources
needed for production and at the other level, it is a whole new way of thinking about
doing business and interacting with communities. At a most basic level, it is each
organization seeking higher performance within it self. However, most eco-industrial
activity is moving to a new level by increasing the inter connections between the
companies.
Strategic partnership networked manufacturing and performed supplier arrangements are
all the examples of ways used by the businesses to ensure growth, contain costs and to
reach out for new opportunities.

Conceptual Facets of EIA
TGM for Pulp and Paper Industry 2-9 August 2010
For most businesses, the two essentials for success are the responsive markets and access
to cost-effective, quality resources for production or delivering services. In absence of
these two factors, virtually every other incentive becomes a minor consideration.
Transportation issues are important at two levels, the ability to get goods to market in an
expeditious way is essential to success in this day of just in time inventories. The use of
least impact transportation with due consideration of speed and cost supports business
success and addresses the concerned in community.
Eco-industrial development works because it consciously mixes a range of targeted
strategies shaped to the contours of the local community. Most importantly, it works
because the communities want nothing less than the best possible in or near their
neighborhoods. For companies, it provides a path towards significantly higher operating
results and positive market presence. For our environment, it provides great hope that the
waste will be transformed into valued product and that the stewardship will be a joint
pledge of both businesses and communities.
2.3.2.11 Voluntary agreements
Voluntary environmental agreements among the industries, government, public
representatives, NGOs and other concerned towards attaining certain future demands of
the environment are reported to be successful. Such agreements may be used as a tool
where Government would like to make the standards stringent in future (phase-wise-
stringent). These may be used when conditions are temporary and require timely
replacement. Also these may be used as supplementary/ complimentary in
implementation of the regulation. The agreements may include:
Target objectives (emission limit values/standards)
Performance objectives (operating procedures)
R&D activities – Government and industry may have agreement to establish better
control technologies.
Monitoring & reporting of the agreement conditions by other agents (NGOs, public
participants, civil authority etc.)
In India, the MoEF has organized such programme, popularly known as the corporate
responsibility for environment protection (CREP) considering identified 17 categories of
high pollution potential industrial sectors. Publication in this regard is available with
Central Pollution Control Board (CPCB).
2.3.3 Tools for communication
2.3.3.1 State of environment
The Government of India has brought out the state of environment report for entire
country and similar reports available for many of the states. These reports are published
at regular intervals to record trends and to identify the required interventions at various
levels. These reports consider the internationally accepted DPSIR framework for the
presentation of the information. DPSIR refers to
Ü D – Driving forces – causes of concern i.e. industries, transportation etc.
Ü P – Pressures – pollutants emanating from driving forces i.e. emission
Ü S – State – quality of environment i.e. air, water & soil quality

Conceptual Facets of EIA
TGM for Pulp and Paper Industry 2-10 August 2010
Ü I – Impact – impact on health, eco-system, materials, biodiversity, economic damage
etc.
Ü R – Responses – action for cleaner production, policies (including
standards/guidelines), targets etc.
Environment reports including the above elements gives a comprehensive picture of
specific target area in order to take appropriate measures for improvement. Such reports
capture the concerns, which could be considered in EIAs.
2.3.3.2 Corporate environmental reporting
Corporate environmental reports (CERs) are only one form of environmental reporting
defined as publicly available, stand alone reports, issued voluntarily by the industries on
their environmental activities. CER is just a means of environmental improvement and
greater accountability, not an end in itself.
Three categories of environmental disclosure are:
Involuntary Disclosure: Without its permission and against its will (env. Campaign,
press etc.)
Mandatory Disclosure: As required by law
Voluntary Disclosure: The disclosure of information on a voluntary basis
2.4 Objectives of EIA
Objectives of EIA include the following:
Ü To ensure environmental considerations are explicitly addressed and incorporated
into the development decision-making process;
Ü To anticipate and avoid, minimize or offset the adverse significant biophysical, social
and other relevant effects of development proposals;
Ü To protect the productivity and capacity of natural systems and the ecological
processes which maintain their functions; and
Ü To promote development that is sustainable and optimizes resource use as well as
management opportunities.
2.5 Types of EIA
Environmental assessments could be classified into four types i.e. strategic environmental
assessment, regional EIA, sectoral EIA and project level EIA. These are precisely
discussed below:
Strategic environmental assessment
Strategic Environmental Assessment (SEA) refers to systematic analysis of the
environmental effects of development policies, plans, programmes and other proposed
strategic actions. SEA represents a proactive approach to integrate environmental
considerations into the higher levels of decision-making – beyond the project level, when
major alternatives are still open.
Conceptual Facets of EIA
TGM for Pulp and Paper Industry 2-11 August 2010
Regional EIA
EIA in the context of regional planning integrates environmental concerns into
development planning for a geographic region, normally at the sub-country level. Such
an approach is referred to as the economic-cum-environmental (EcE) development
planning. This approach facilitates adequate integration of economic development with
management of renewable natural resources within the carrying capacity limitation to
achieve sustainable development. It fulfils the need for macro-level environmental
integration, which the project-oriented EIA is unable to address effectively. Regional
EIA addresses the environmental impacts of regional development plans and thus, the
context for project-level EIA of the subsequent projects, within the region. In addition, if
environmental effects are considered at regional level, then cumulative environmental
effects of all the projects within the region can be accounted.
Sectoral EIA
Instead of project-level-EIA, an EIA should take place in the context of regional and
sectoral level planning. Once sectoral level development plans have the integrated
sectoral environmental concerns addressed, the scope of project-level EIA will be quite
minimal. Sectoral EIA helps in addressing specific environmental problems that may be
encountered in planning and implementing sectoral development projects.
Project level EIA
Project level EIA refers to the developmental activity in isolation and the impacts that it
exerts on the receiving environment. Thus, it may not effectively integrate the cumulative
effects of the development in a region.
From the above discussion, it is clear that EIA shall be integrated at all the levels i.e.
strategic, regional, sectoral and the project level. Whereas, the strategic EIA is a
structural change in the way the things are evaluated for decision-making, the regional
EIA refers to substantial information processing and drawing complex inferences. The
project-level EIA is relatively simple and reaches to meaningful conclusions. Therefore
in India, project-level EIA studies take place on an large-scale and are being considered.
However, in the re-engineered Notification, provisions have been incorporated for giving
a single clearance for the entire industrial estate for e.g., Leather parks, pharma cities etc.,
which is a step towards the regional approach.
As we progress and the resource planning concepts emerge in our decision-making
process, the integration of overall regional issues will become part of the impact
assessment studies.
2.6 Basic EIA Principles
By integrating the environmental impacts of the development activities and their
mitigation early in the project planning cycle, the benefits of EIA could be realized in all
stages of a project, from exploration and planning, through construction, operations,
decommissioning, and beyond site closure.
A properly-conducted-EIA also lessens conflicts by promoting community participation,
informing decision makers, and also helps in laying the base for environmentally sound
projects. An EIA should meet at least three core values:
Conceptual Facets of EIA
TGM for Pulp and Paper Industry 2-12 August 2010
Integrity: The EIA process should be fair, objective, unbiased and balanced
Utility: The EIA process should provide balanced, credible information for decision-
making
Sustainability: The EIA process should result in environmental safeguards
Ideally an EIA process should be:
Purposive - should inform decision makers and result in appropriate levels of
environmental protection and community well-being.
Rigorous - should apply ‘best practicable’ science, employing methodologies and
techniques appropriate to address the problems being investigated.
Practical - should result in providing information and acceptable and implementable
solutions for problems faced by proponents.
Relevant - should provide sufficient, reliable and usable information for development
planning and decision making.
Cost-effective - should impose minimum cost burdens in terms of time and finance on
proponents and participants consistent with meeting accepted requirements and
objectives of EIA.
Efficient - should achieve the objectives of EIA within the limits of available
information, time, resources and methodology.
Focused - should concentrate on significant environmental effects and key issues; i.e.,
the matters that need to be taken into account in making decisions.
Adaptive - should be adjusted to the realities, issues and circumstances of the
proposals under review without compromising the integrity of the process, and be
iterative, incorporating lessons learned throughout the project life cycle.
Participative - should provide appropriate opportunities to inform and involve the
interested and affected publics, and their inputs and concerns should be addressed
explicitly in the documentation and decision making.
Inter-disciplinary - should ensure that appropriate techniques and experts in the
relevant bio-physical and socio-economic disciplines are employed, including use of
traditional knowledge as relevant.
Credible - should be carried out with professionalism, rigor, fairness, objectivity,
impartiality and balance, and be subject to independent checks and verification.
Integrated - should address the interrelationships of social, economic and biophysical
aspects.
Transparent- should have clear, easily understood requirements for EIA content;
ensure public access to information; identify the factors that are to be taken into
account in decision making; and acknowledge limitations and difficulties.
Systematic - should result in full consideration of all relevant information on the
affected environment, of proposed alternatives and their impacts, and of the measures
necessary to monitor and investigate residual effects.
2.7 Project Cycle
The generic project cycle including that of the pulp & paper industry has six main stages:
1. Project concept

Conceptual Facets of EIA
TGM for Pulp and Paper Industry 2-13 August 2010
2. Pre-feasibility
3. Feasibility
4. Design and engineering
5. Implementation
6. Monitoring and evaluation
It is important to consider the environmental factors on an equal basis with technical and
economic factors throughout the project planning, assessment and implementation phases.
Environmental considerations should be introduced at the earliest in the project cycle and
must be an integral part of the project pre-feasibility and feasibility stage. If the
environmental considerations are given due respect in site selection process by the project
proponent, the subsequent stages of the environmental clearance process would get
simplified and would also facilitate easy compliance to the mitigation measures
throughout the project life cycle.
A project’s feasibility study should include a detailed assessment of significant impacts,
and the EIA include a detailed prediction and quantification of impacts and delineation of
Environmental Management Plan (EMP). Findings of the EIA study should preferably be
incorporated in the project design stage so that the project as well as the site alternatives
is studied and necessary changes, if required, are incorporated in the project design stage.
This practice will also help the management in assessing the negative impacts and in
designing cost-effective remedial measures. In general, EIA enhances the project quality
and improves the project planning process.
2.8 Environmental Impacts
Environmental impacts resulting from proposed actions can be grouped into following
categories:
Beneficial or detrimental
Naturally reversible or irreversible
Repairable via management practices or irreparable
Short term or long term
Temporary or continuous
Occurring during construction phase or operational phase
Local, regional, national or global
Accidental or planned (recognized before hand)
Direct (primary) or Indirect (secondary)
Cumulative or single
The category of impact as stated above, and the significance will facilitate the Expert
Appraisal Committee (EAC)/State Level EAC (SEAC) to take a look at the ToR for EIA
studies, as well as, in decision making process about the developmental activity.
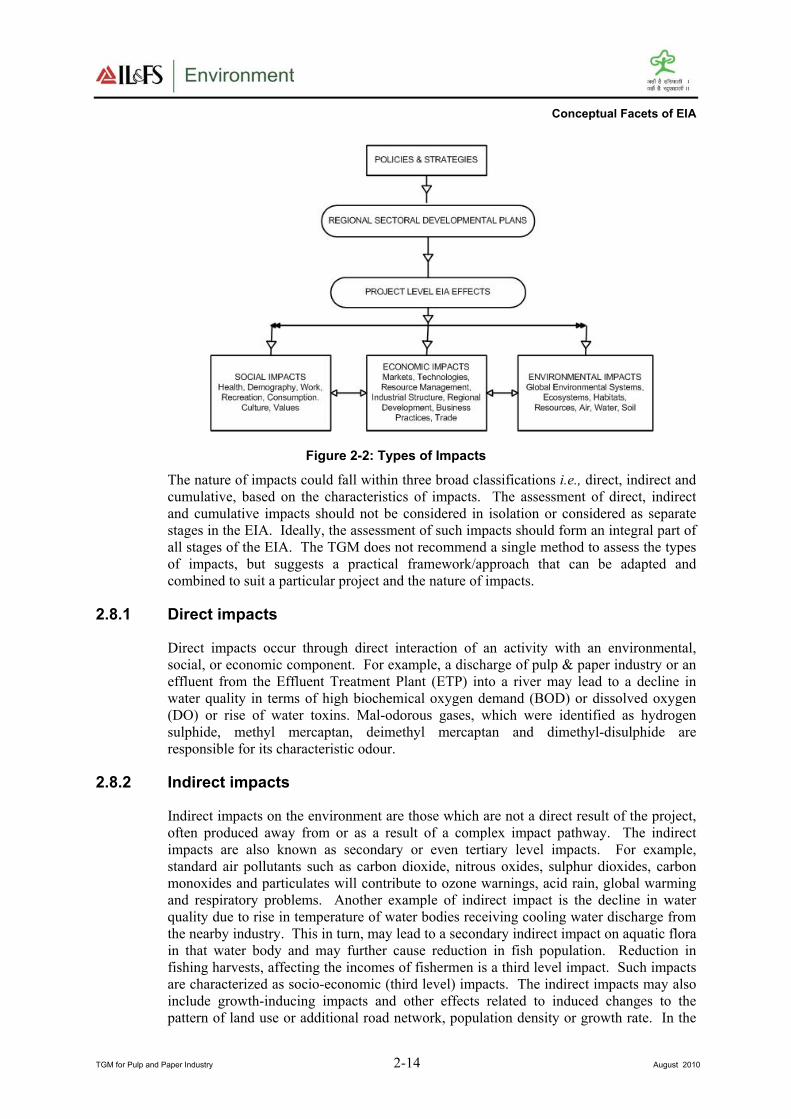
Conceptual Facets of EIA
TGM for Pulp and Paper Industry 2-14 August 2010
Figure 2-2: Types of Impacts
The nature of impacts could fall within three broad classifications i.e., direct, indirect and
cumulative, based on the characteristics of impacts. The assessment of direct, indirect
and cumulative impacts should not be considered in isolation or considered as separate
stages in the EIA. Ideally, the assessment of such impacts should form an integral part of
all stages of the EIA. The TGM does not recommend a single method to assess the types
of impacts, but suggests a practical framework/approach that can be adapted and
combined to suit a particular project and the nature of impacts.
2.8.1 Direct impacts
Direct impacts occur through direct interaction of an activity with an environmental,
social, or economic component. For example, a discharge of pulp & paper industry or an
effluent from the Effluent Treatment Plant (ETP) into a river may lead to a decline in
water quality in terms of high biochemical oxygen demand (BOD) or dissolved oxygen
(DO) or rise of water toxins. Mal-odorous gases, which were identified as hydrogen
sulphide, methyl mercaptan, deimethyl mercaptan and dimethyl-disulphide are
responsible for its characteristic odour.
2.8.2 Indirect impacts
Indirect impacts on the environment are those which are not a direct result of the project,
often produced away from or as a result of a complex impact pathway. The indirect
impacts are also known as secondary or even tertiary level impacts. For example,
standard air pollutants such as carbon dioxide, nitrous oxides, sulphur dioxides, carbon
monoxides and particulates will contribute to ozone warnings, acid rain, global warming
and respiratory problems. Another example of indirect impact is the decline in water
quality due to rise in temperature of water bodies receiving cooling water discharge from
the nearby industry. This in turn, may lead to a secondary indirect impact on aquatic flora
in that water body and may further cause reduction in fish population. Reduction in
fishing harvests, affecting the incomes of fishermen is a third level impact. Such impacts
are characterized as socio-economic (third level) impacts. The indirect impacts may also
include growth-inducing impacts and other effects related to induced changes to the
pattern of land use or additional road network, population density or growth rate. In the

Conceptual Facets of EIA
TGM for Pulp and Paper Industry 2-15 August 2010
process, air, water and other natural systems including the ecosystem may also be
affected.
2.8.3 Cumulative impacts
Cumulative impact consists of an impact that is created as a result of the combination of
the project evaluated in the EIA together with other projects in the same vicinity, causing
related impacts. These impacts occur when the incremental impact of the project is
combined with the cumulative effects of other past, present and reasonably foreseeable
future projects. Figure 2-3 depicts the same. Respective EAC may exercise their
discretion on a case-by-case basis for considering the cumulative impacts.
Figure 2-3: Cumulative Impact
2.8.4 Induced impacts
The cumulative impacts can be due to induced actions of projects and activities that may
occur if the action under assessment is implemented such as growth-inducing impacts and
other effects related to induced changes to the pattern of future land use or additional road
network, population density or growth rate (e.g., excess growth may be induced in the
zone of influence around a pulp & paper project, and in the process causing additional
effects on air, water and other natural ecosystems). Induced actions may not be officially
announced or be a part of any official announcement/plan. Increase in workforce and
nearby communities contributes to this effect.
They usually have no direct relationship with the action under assessment, and represent
the growth-inducing potential of an action. New roads leading from those constructed for
a project, increased recreational activities (e.g., hunting, fishing), and construction of new
service facilities are examples of induced actions.
However, the cumulative impacts due to induced development or third level or even
secondary indirect impacts are difficult to be quantified. Because of higher levels of
uncertainties, these impacts cannot normally be assessed over a long time horizon. An
EIA practitioner usually can only guess as to what such induced impacts may be and the
possible extent of their implications on the environmental factors. Respective EAC may
exercise their discretion on a case-by-case basis for considering the induced impacts.
2.9 Significance of Impacts
This TGM establishes the significance of impacts first and proceeds to delineate the
associated mitigation measures. So the significance here reflects the “worst-case
scenario” before mitigation is applied, and therefore provides an understanding of what
may happen if mitigation fails or is not as effective as predicted. For establishing

Conceptual Facets of EIA
TGM for Pulp and Paper Industry 2-16 August 2010
significance of different impacts, understanding the responses and interaction of the
environmental system is essential. Hence, the impact interactions and pathways are to be
understood and established first. Such an understanding will help in the assessment
process to quantify the impact as accurately as possible. Complex interactions,
particularly in the case of certain indirect or cumulative impacts, may give rise to non-
linear responses which are often difficult to understand and therefore their significance is
difficult to assess. It is hence understood that indirect or cumulative impacts are more
complex than the direct impacts. Currently the impact assessments are limited to direct
impacts. In case mitigation measures are delineated before determining significance of
the effect, the significance represents the residual effects.
However, the ultimate objective of an EIA is to achieve sustainable development. The
development process shall invariably cause some residual impacts even after
implementing an EMP effectively. Environmentalists today are faced with a vital, not-
easy-to-answer question—“What is the tolerable level of environmental impact within the
sustainable development framework?”. As such, it has been recognized that every
ecosystem has a threshold for absorbing deterioration and a certain capacity for self-
regeneration. These thresholds based on concept of carrying capacity are as follows:
Waste emissions from a project should be within the assimilative capacity of the local
environment to absorb without unacceptable degradation of its future waste
absorptive capacity or other important services.
Harvest rates of renewable resource inputs should be within the regenerative capacity
of the natural system that generates them; depletion rates of non-renewable inputs
should be equal to the rate at which renewable substitutes are developed by human
invention and investment.
The aim of this model is to curb over-consumption and unacceptable environmental
degradation. But because of limitation in available scientific basis, this definition
provides only general guidelines for determining the sustainable use of inputs and
outputs. To establish the level of significance for each identified impact, a three-stage
analysis may be referred:
First, an impact is qualified as being either negative or positive.
Second, the nature of impacts such as direct, indirect, or cumulative is determined
using the impact network
Third, a scale is used to determine the severity of the effect; for example, an impact is
of low, medium, or high significance.
It is not sufficient to simply state the significance of the effect. This determination must
be justified, coherent and documented, notably by a determination methodology, which
must be described in the methodology section of the report. There are many recognized
methodologies to determine the significance of effects.
2.9.1 Criteria/methodology to determine the significance of the identified impacts
The criteria can be determined by answering some questions regarding the factors
affecting the significance. This will help the EIA stake-holders, the practitioner in
particular, to determine the significance of the identified impacts eventually. Typical
examples of such factors include the following:

Conceptual Facets of EIA
TGM for Pulp and Paper Industry 2-17 August 2010
Exceeding of threshold limit: Significance may increase if a threshold is exceeded.
e.g., particulate matter emissions exceed the permissible threshold.
Effectiveness of mitigation: Significance may increase as the effectiveness of
mitigation measures decreases. e.g., control technologies, which may not assure
consistent compliance to the requirements.
Size of study area: Significance may increase as the zone of effects increases.
Incremental contribution of effects from action under review: Significance may
increase as the relative contribution of an action increases.
Relative contribution of effects of other actions: Significance may decrease as the
significance of nearby larger actions increase.
Relative rarity of species: Significance may increase as species becomes increasingly
rare or threatened.
Significance of local effects: Significance may increase as the significance of local
effects is high.
Magnitude of change relative to natural background variability: Significance may
decrease if effects are within natural assimilative capacity or variability.
Creation of induced actions: Significance may increase as induced activities also
highly significant
Degree of existing disturbance: Significance may increase if the surrounding
environment is pristine:
For determining significance of impacts, it is important to remember that secondary and
higher order effects can also occur as a result of a primary interaction between a project
activity and the local environment. Wherever a primary effect is identified, the
practitioner should always think if secondary or tertiary effects on other aspects of the
environment could also arise.
The EIA should also consider the effects that could arise from the project due to induced
developments, which take place as a consequence of the project. Ex. Population density
and associated infrastructure and jobs for people attracted to the area by the project. It
also requires consideration of cumulative effects that could arise from a combination of
the effects due to other projects with those of other existing or planned developments in
the surrounding area. So the necessity to formulate a qualitative checklist is suggested to
test significance, in general.
TGM for Pulp and Paper Industry 3-1 August 2010
3. ABOUT PULP AND PAPER INDUSTRY INCLUDING
PROCESS AND POLLUTION CONTROL TECHNOLOGIES
3.1 Introduction
Pulp and paper are manufactured from raw materials containing cellulose fibres, which generally include wood, recycled paper, and agricultural residues. There are several methods of pulp production to make different strengths and grades of paper. In the 1800s, there was a shift away from using cotton rags for paper production and wood became the most important source of fibre. The global pulp and paper industry consists of about 5000 industrial pulp and paper mills and an equal number of very small companies. Pulp mills separate the fibres from wood or from other materials, such as rags, wastepaper or straw in order to create pulp. Paper mills primarily are engaged in manufacturing paper from pulp and may also manufacture converted paper products. Indian paper mills can be categorized based on raw materials viz. wood/forest based mills, agro-based mills and wastepaper based mills. The major products from these mills are paper, paper boards and newsprints.
Pulp and Paper industry plays a vital role in socio-economic development, while it is associated with significant environmental concerns due to its large footprints on environmental resources.
3.1.1 Pulp and paper industry in India
The first paper mill in India was set up in 1812 at Serampur, West Bengal and now India is home for the 15th largest pulp and paper industry in the world. It provides employment both directly and indirectly to millions of people and contributes to government exchequer. The per capita consumption of paper is generally considered as a benchmark and is directly related to the level of literacy, education and cultural development of the country’s quality of life. In India, the per capita consumption of 5.5 kg is 10 times lower, in comparison to the global average of 50 kilograms (kg) per annum. However, rise in per capita consumption and literacy are pushing the demand for paper at a very fast pace.
Paper manufacturing is a highly capital, energy and water intensive industry and is also considered as one of the high pollution potential industry within the Indian economy. Adoption of more efficient and cleaner technologies in the manufacturing the products are most effective in increasing the productivity and also integrate economic, environmental, and social development objectives.
The Indian paper industry, in its modern context, is century old and accommodates a combination of units that vary in size, production volume, ownership, technology, and input and product type. In India, paper and board types produced (Table 3-1) are classified into the following broad categories on the basis of intended use:
1. Printing and writing (graphic) papers

Pulp and Paper Industry
TGM for Pulp and Paper Industry 3-2 August 2010
Printing and writing papers comprise one of the largest categories of paper products. Examples include copier paper, stationery, computer printout, offset paper, and notepads. This paper is broadly classified into those containing wood and those not containing wood pulp. The former is mainly used in mass-produced papers, while the latter is used for high quality and special applications. Each category can again be either coated or uncoated.
2. Industrial papers
Industrial paper is a term used to describe paper manufactured for industrial uses. Industrial paper, therefore, includes building papers, insulating papers, wrapping papers, packaging papers, etc. Packaging paper may include high-quality packaging materials for food and luxury goods, in some cases surface treated, multi-layer or coated for costly print processes. Corrugated board, made from fresh unbleached pulp or recycled corrugated board (a rising trend) depending on quality, also accounts for a portion of industrial papers in quantity terms.
3. Special papers
These cover a wide range of paper types which cannot be specifically allocated to the two product groups described above, e.g.:
papers for hygiene applications (tissues, kitchen rolls, toilet paper) filter papers for use in industry, the home, the laboratory etc. transparent papers for drawing photographic papers base paper for parchment, vulcanized fibre cigarette paper capacitor paper, etc.
Table 3-1: Consumption Pattern of Paper and Paper Boards in India
Type of Paper Main Varieties % of Total
Consumptions
Cultural paper Cream woven, maplitho, bond paper, Chromo paper 41%
Industrial paper Kraft paper, paper board – paper board – single layer board, multilayer board, duplex board
43%
Specialty paper Security paper, grease proof paper, electrical grades of paper
4%
Newsprint Glazed, non-glazed 12%
(Source: Estimated by CSE based on the wastewater discharged data published by CPCB in
“Water quality in India (Status and trends) 1990 – 2001”
3.1.2 Size of the Industry
In India, the industry is classified into following categories based on its production capacity:
1. Large scale : Greater than 33,000 tonnes per annum (TPA) of production
2 Medium scale : between 10,000 and 33,000 TPA
Pulp and Paper Industry
TGM for Pulp and Paper Industry 3-3 August 2010
3 Small scale : Less than 10,000 TPA
Most of the large scale mills are either wood based or integrated based. Some large scale newsprint manufacturing mills also manufacture high-grade paper and paperboard while some produce newsprint only. The large scale mills have undergone modernization which reduced water consumption as well as the air emissions. All medium scale mills are either agro-based and/or only waste paper-based mills primarily involved in industrial grade paper production. There are a few agro-based medium-scale mills with chemical recovery plant. The technological status is similar to that of large-scale and small-scale mills in case the unit is based on waste paper mills.
There are about 600 paper mills in the country out of which about 66 per cent (%) are small scale, 24% are medium scale and only 10% fall under large scale mills. However, going by global scale, only about 10-15 Indian paper mills would fall into the large scale category. The average capacity of an Indian Paper mill is about 1500 tons per annum, which is less than one seventh of the average capacity of European mills and about one fifteenth the size of average US mill.
One of the major constraints in the environmental performance of the Indian paper industry is the small size of its plants which usually makes technology upgrades unfavorable resulting in distancing itself from the international standards in production process. As per the latest survey, currently about 60 % of total paper production in the country is from large scale mills while the balance 40 % is produced by medium and small scale mills.
3.2 Scientific Aspects of the Industrial Process
3.2.1 Raw materials
Wood, the world over, is the main fibrous raw material used to produce pulp, and accounts for more than 70% of paper production. After wood, contribution of wastepaper to paper making is highest in the world. Waste paper is reportedly used as the most important raw material, especially for the production of newsprint, certain tissues, writing paper, magazines and boxboard. Fibre-containing agricultural residues also form the major chunk of raw material used in pulp and paper production. Bagasse, wheat straw and rice straw are the major agro residues used though other agro residues like Kenaf/mesta, jute sticks, grasses and cotton stalks are used in small quantities.
The type of raw material used in India is largely dependent on locally available resources. Mills in the northern and western regions of India depend heavily on agricultural residues and waste paper as their raw material. More than 50 percent of the total paper produced from wastepaper is produced in western India.
Pulp & paper production in southern and eastern regions uses wood and bamboo as raw materials. South India has 11 large scale forest-based mills producing all of the rayon grade pulp and 50 percent of the wood and bamboo pulp.
Pulp & paper industry in India cannot be divided on the basis of the raw materials used as it may lead to erroneous generalizations. Indian mills rarely limit themselves to a particular raw material. Majority of pulp and paper mills integrate the options of raw materials like wood, bamboo, agro-residues, wastepaper and market pulp. Most agro-

Pulp and Paper Industry
TGM for Pulp and Paper Industry 3-4 August 2010
residue mills also use waste paper and wood pulp and most waste paper mills rely on wood pulp to improve furnish characteristics. Companies often alter their fibre furnish according to the availability and prevailing raw material price. An agro-residue mill in one year can easily be transformed into a waste paper mill in the next year. Overturns like this are fairly common in industry, especially in its small-scale segment.
There are two facets to the use of multiple raw materials. On the positive side, this promotes the best and most sagacious utilization of available resources (waste products) in a fibre-scarce country like India. Multiple raw material utilization also makes eminent sense from economic perspective, as sourcing and collection of materials provides livelihood to a large section of traders. On the flip side, such use leads to critical problems and is one of the causes for eroding the production efficiency.
An observation of the pulp & paper production of the past four decades provides the emergence of a clear picture with respect to (w.r.t) the proportion of raw materials used in pulp and paper production. The use of forest-based raw materials has reportedly dwindled from 84 % in 1970 to 36 % in 2002. Consequently, the use of agro-based raw material has increased from 9 % in 1970 to about 29 % in 2002. Similarly, the share of paper produced from waste paper has increased from seven percent in 1970 to 35 % currently.
3.2.1.1 Sustainable sources of raw material for paper industry in India
Sustainability aims at meeting today’s needs without abridging the rights of tomorrow’s generation to meet their needs. In other words any development strategy that is socially desirable, economically viable & ecologically sustainable fulfils the criterion of sustainability.
In this context, it may be pertinent to quote Jonathan Porritt, Chairman UK Sustainability Development Commission — “There are not many industries around the world that can aspire to become genuinely sustainable. The pulp & paper industry, however, is one of them. It is inherently sustainable.”
India has undergone considerable economic reforms towards liberalisation and is attracting investments which began in early 1990. The process continues to have an all-round impact resulting in appreciable GDP growth over past few years. GDP growth in the ‘2002-07’ period was 8.9% as against 2% in 1950s while population growth slowed down from 2.2% in 1951-1980 period to 1.5% in 2001-2010 period. India is now the fourth largest economy and is expected to become the third largest by 2012-14, overtaking Japan. (Source -IPPTA)
Paper industry has an important role to play in the Indian economy. The Associated Chambers of Commerce and Industry of India (ASSOCHAM) has published a paper on "Growth of Paper Industry in India" which reveals that the per capita paper consumption has increased to 9.18 kg in 2009-10 as compared to 8.3 kg during 2008-09. Still, it is considerably lower when compared to 42 kg in China and 312 kg plus in US & developed countries.
However, India has emerged as the fastest growing market when it comes to consumption, posting 10.6% growth in per capita consumption of paper in 2009-10 (Source- ASSOCHAM). Consumption of paper and board is expected to grow up to 10 million tonnes (MT) by 2010 and to 14 MT by 2015 – a huge jump from 7.2 MT in 2004. (Source: JP Consulting). Projections made by ASSOCHAM indicate growth in

Pulp and Paper Industry
TGM for Pulp and Paper Industry 3-5 August 2010
consumption to touch 11.5 MT in 2011-12 from 9.18 MT in 2009-10 at the rate of 8% per annum. Demand for all paper grades is expected to grow but the biggest capacity increase will be seen in uncoated, wood-free and containerboard. An increase of this magnitude represents a significant challenge to the country’s pulp and papermakers.
Latest data from Indian Pulp and Paper Technical Association (IPPTA) indicates operating capacity of Indian Paper mills producing paper, paperboard and newsprint as 9.3 MT with production of 8.0 MT while consumption is 8.9 MT. Further rise in overall paper consumption is expected to be considerable due to increasing per capita consumption as a result of all round economic development with rising literacy, higher education levels and also due to the huge population with booming middle class. This increasing demand for paper puts enormous pressure on supply of papermaking fibres through more efficient recovery of recycled paper, increase in usage of non-wood raw material resources; the need to further develop and expand sustainable wood resource through social forestry/plantation
Papermaking fibre in India is sourced from the following:
Forests which include Bamboo & mixed hardwoods from forest felling, & Eucalyptus wood from organised plantations & farmers fields/ agro-forestry plots.
Agricultural residues such as bagasse, rice & wheat straw , cotton stalks
Recycled waste paper including domestic & imported waste paper
At present, paper production in India is 39% wood based, 31% is based from agro residues & 30% from recycled waste paper as against world average of 55% from wood based, 10% from non-wood based and 35% from recycled fibre based.
Forest-based fibre sources
India has a total land area of 328.8 million hectares, out of which agricultural land occupies 154.7 million ha (47%) & uncultivated/non agricultural/barren lands account for 99.3 ha (30%) while forests & woodlands occupy balance about 65 million ha. (20%).
38.6 million ha of the total forest area is considered as dense forest with a crown density of over 40% while the rest, about 31 million ha. is considered as degraded forest lands. The tree species vary from tropical rain forests in the south & the east to dry alpine in the Himalayas. Eucalyptus and Acacia species constitute 25% & 20% of the above forests respectively, while coniferous and other broad leaves constitute 10% & 35% respectively with miscellaneous species like Tectona & Hevea as 8% & 2% respectively.
It is worthwhile to note that in spite of population pressure, forest coverage has increased by 38 million ha. by 2000 but fuel wood continues to remain the major competitor for native & plantation grown wood. As per the latest statistics wood based paper industry utilises only 5.8 MT of wood which works out to about 3.5% of total wood felled; Sawn wood/plywood etc. consumes about 6.5%, while bulk 90% is utilised for fuel wood applications. A large proportion of above forest area is commonly utilised for grazing purposes.
Plantations comprise about 32.5 million ha of above forest area, of which hardwoods constitutes 90% of the species. Additionally, there are 400 million ha. of bamboo plantations that are also theoretically available for utilisation for chemical pulping (Source- JP Consulting )

Pulp and Paper Industry
TGM for Pulp and Paper Industry 3-6 August 2010
Bamboos found in most of forests in India are also widely utilised for pulp making. Its availability from both state forest lands & private sources is estimated to be 1.6 million tonnes per annum (MTPA). However, the recent trend is use of mixed hardwoods from natural forests & Eucalyptus/Subabool from farmers’ fields and plantations. This has resulted due to increasing bamboo scarcity & increased availability of Eucalyptus wood for pulp making along with technological developments in hardwood pulp making. It may be noted that despite increased usage of hardwoods the relative share of wood fibre in papermaking furnish has been declining over the years due to the rapid growth in the technological developments in pulp making of agricultural residues & recycled fibres. (Source- JP Consulting)
In India, forests are mostly property of the state & its resources are either directly managed by the Govt. or given for use to communities under various arrangements. Harvesting is usually carried out by the State Forest Development Corporations while the private sector is mainly engaged in transportation & processing. Private trees are mostly grown on farms or community lands. Forests also provide direct employment to more than 300 000 people.
In 1988 India adopted a new national forest policy in which supply of wood raw material to Industry is considered on the basis of the following guidelines:
Precedence of fuel fodder & timber requirements of the local community over raw material requirement of industry
Non allotment of natural forest areas for timber harvesting & plantations
Liberalisation of wood import to reduce “industry pressure” on forests
Establishment of industry-farmer/community partnership for procurement of raw material through private sources.
However Paper Industry in India has taken its own initiative through cooperation with private landowners & farmers by motivating the farmers to participate in agro forestry by providing them with supporting services such as technological inputs, good quality planting material, harvesting technology & marketing support. This has resulted in appreciable increase in tree planting on private lands.
Paper industry’s wood demand is expected to grow from 5.8 MT currently to 9 MT by 2010 and to over13.2 MT by 2020. However, India has a vast potential of waste and degraded forest land that could be utilised for tree growing operations. About 0.6 million hectares (ha) of land for plantations (out of India’s 100 million ha of waste land and 32 million ha of degraded forest land) would be required to meet the paper industry’s wood demand.)
3.2.1.2 Agricultural Residues resources
Utilisation of agricultural residues as an alternate resource for papermaking has grown since 1970’s partly due to dwindling bamboo availability & partly due to Government policy of encouraging agro- based paper production. Of late these agro- residues are emerging as significant alternative raw material resource resulting in their share going up to 29% of the total fibre used in Indian Paper industry.
Main agricultural residues utilised in Indian paper industry are bagasse, cereal straws (wheat & rice), kenaf/mesta, jute sticks, grasses & cotton stalks but predominant dependence currently is on bagasse & cereal straws only.

Pulp and Paper Industry
TGM for Pulp and Paper Industry 3-7 August 2010
Theoretical availability of wheat & rice straw is 22 MT & 15.0 MT respectively which translates into 7.0 MT & 5.0 MTPA of pulp, while that of bagasse is 10 MT, which is equivalent to 2.0 MT of pulp per annum. With 2 MT of jute/mesta/kenaf added to above, total pulp potential works out to 14+ tonnes of pulp per annum. (Above calculations are based on 0.65 tonnes straw per tonne for rice & 1.47 tonnes of straw per tonne of wheat while bagasse is considered at 30% of sugarcane crushed). Despite high theoretical availability of bagasse and straw, their use is very limited due to seasonal availability, high transportation costs for long distances, quality deterioration over longer storage and various technical constraints such as poor strength & drainage properties, low opacity bulk & porosity, problems of chemical recovery & pollution control measures. Despite the above shortcomings, usage of bagasse as compared to wood continues to be an important raw material for pulp making in India especially for printing/writing, and newsprint applications
Bagasse is an industrial waste obtained from processing of sugarcane for which India is world’s largest producer with close to 280 MTPA.
Paper mills in India obtain bagasse from sugar mills through either of the following two routes:
Surplus bagasse which is released after meeting the energy needs of the sugar mills.
Substitute bagasse, which becomes available after replacement by alternate fuels such as coal, natural gas, fuel oil etc. in modern boilers set up in the sugar mills to meet its energy requirements.
Average bagasse content in sugarcane varies from 32% to 34% while average fibre content varies from about 14% to 16%. Considering the limited availability of surplus bagasse from old sugar mills, the potential of surplus bagasse is estimated at about 10 MTPA since its total supply cannot be increased beyond 5% to 8% of the total cane crushed in the organised sugar mills. Availability of bagasse for paper industry is further limited due to energy use of bagasse being currently subsidised for power generation.
3.2.1.3 Recycled fibre (waste paper) sources
Waste paper based paper mills account for about 35% of Indian paper mill production capacity. Recovery of waste paper has increased from 650,000 tonnes in 1995 to 850,000 tonnes in 2000 but due to alternative uses the recovery rate for paper industry is still about 20 % as against China’s 33% & Germany’s 71 % .
Waste paper recovery & trading are still unorganised in India. The collection is being carried out by individual dealers with unsophisticated sorting systems. Utilisation of waste paper is also restricted due to multiple end uses of paper products such as wrapping & packaging applications common in India which fetch better price than paper industry. The trend in imports is continuously increasing & touched 850,000 tonnes in 2000 due to domestic recycled paper wastes being unable to cope up with the demand.
Main grades of waste paper commonly utilised in India are old corrugated containers (40 %), office refuse (20%), old newspaper & magazines (20 %) & mixed papers (20%). India imports about 2 MT of pulp (soft wood and hardwood) and waste paper (sack waste) for unbleached grades, “Envelopes waste & cup stock” for white grades and “Magazine waste” for newsprint (ASSOCHAM).

Pulp and Paper Industry
TGM for Pulp and Paper Industry 3-8 August 2010
Some of the key drivers for the increasing recovery of recycled paper in India are:
Increasing total & per capita consumption of paper & paperboards. Increasing urbanisation leading to concentration of paper consumption. Increasing demand arising out of severe shortage of papermaking fibre Govt. Incentives for use of non conventional fibres in papermaking. Risk of an International shortage/price rise of waste paper due to increasing recycling
levels in North America & Western Europe as also increasing dependence of Asia Pacific & Latin American paper industries on off shore waste paper supply.
In India, sorting of imported low priced waste paper could be a feasible solution to increased availability of waste paper at lower costs. Separation of long and short fibres by fibre fractionation from waste paper at paper mills could also help in improving supply of long fibre for papermaking. Likewise, segregation of “white & brown” parts of mixed waste paper could be a cost-effective solution for utilisation in different paper product applications.
Though it is difficult to increase collection of old newspapers/ magazines & mixed wastes sourced from “Households” yet there is sufficient potential to increase supplies of OCC & packaging wastes from “Supermarkets/ shops” & OCC/ good quality converting /printing & packaging, wastes/high quality printing cuttings from “Publishers/printers/ Paper converters/ Packaging Industries” by having long term contracts and/or by having forward integration. Likewise sourcing office wastes directly from offices by a long term tie-up could work out to be a potentially win-win proposition.
To sum up, future fibre supply in India depends very much on the following factors:
Increase in availability of domestic wood: Hardwood pulp production is expected to increase from 0.90 MT in 2000 to1.5 MT by 2015 & 1.8 MT by 2020, depending on further development of plantations. However most of softwood pulp and shortfall in hardwood pulp may still have to be imported. The cost of wood to Indian players is $50 per tonne compared to around $30 internationally.
Growth in non-wood pulp production which is expected to increase from 1.3 MT in 2000 to 3.2 MT by 2020. Even though the non-wood fibres required are expected to be available in India, the actual utilisation may be lower due to technical/ environmental/logistical reasons.
Improvement in waste paper recovery rate in India which is expected to increase to 38% by 2020
3.2.1.4 Auxiliaries
Water: The availability of fresh water is the next basic requirement for pulp and paper production. The water demand may exceed 150 cubic metre per tonne (m3/tonne) of product, but in very modern mills it may reduce to 7 m3/tonne for waste paper based best international mills or 43 m3/tonne in case of best integrated wood based international mills but the demand depends on so many factors such as final paper product quality requirement, raw material available, processes deployed, etc besides the quality of the process and environment management.
Energy: Energy is required in the form of mechanical energy (electricity) and heat (steam). Where no hydraulic power is available, electrical energy is obtained either from the national grid or generated by a captive power plant. Fossil fuels (heating oil, natural gas, coal), and also wood and wood waste (bark) are some other waste substances which

Pulp and Paper Industry
TGM for Pulp and Paper Industry 3-9 August 2010
are also used for producing steam. The spent liquor from chemical pulp production is an important "waste" for energy. It is burnt in special boilers ("recovery boilers") to produce steam to cover process energy needs besides recovering spent chemicals from it.
Chemicals and Auxiliary materials: There are number of chemicals to be added, particularly pulping and bleaching agents, such as chlorine, sodium chlorate, caustic soda, sodium sulphate, sodium sulphite, pulping aids, chlorine dioxide, oxygen, calcium hypochlorite, persulphate, ozone and Hydrogen peroxide, etc. The other auxiliary materials, such as dyes, starch, clay and resin, are less significant because of the relatively small quantities of usage. The concerns here are their use and resultant environmental hazards.
Raw material used in paper making process, its chemical nature and composition is tabulated in Table 3-2 below. Use of additives and product aids are given in Table 3-3.
Table 3-2: Major Raw Materials: Nature of Chemicals and Characteristics
Raw Material/
Function
Chemical Nature/ Composition Retention Characteristics
Mineral fillers for opacity, surface smoothness
Kaolin clay, calcium carbonate, talc, titanium dioxide
Moderate on wire (40-70%), but high overall (>90%) dependent on filler flocculation
Sizes for water resistance
Rosin with alum or PAC, Alkyll ketene dimmer, Alkenyl succinic, anhydride (ASA) plus emulsifiers/ promoters
High overall (>90%), dependent on charge balance and degree of flocculation
Dry strength additives Natural and modified starches, Polyacrylamides
100% at size press, but loss on broke repulping, high for wet end cationics
Wet strength additives Urea and melamine, Formaldeyde resins, Ployamidoamineepichlorhydrin
High (>90%), but dependent on charge balance
Dyes for coloration Azo-based dyes and auxiliaries like urea and cationic fixatives
Variable at wet end 70-98%
Fluorescent brighteners Diaminostilbenesulphonic acid derivatives, polyehtyleneimine
Variable at wet end
Retention/ drainage aids to reduce losses
Alum, polyacrylamides, polyamines, silica, bentonite
High (>95%) over all retention
Biocides to control slime
Inorganics like CIO2 and peroxides to organics like isothiazolones
Additives for control of deposits like pitch
Alum and talk for pitch, organic detackifiers for stickies
Deliberately not retained
Defoamers Hydrocarbons, silicones, ethoxylates, fatty acid esters
Deliberately not retained
System cleaners Caustic soda, surfactants Deliberately not retained
Auxiliaries Pulping and bleaching agents such as chlorine, sodium chlorate, caustic soda, sodium sulphate, sodium sulphite,
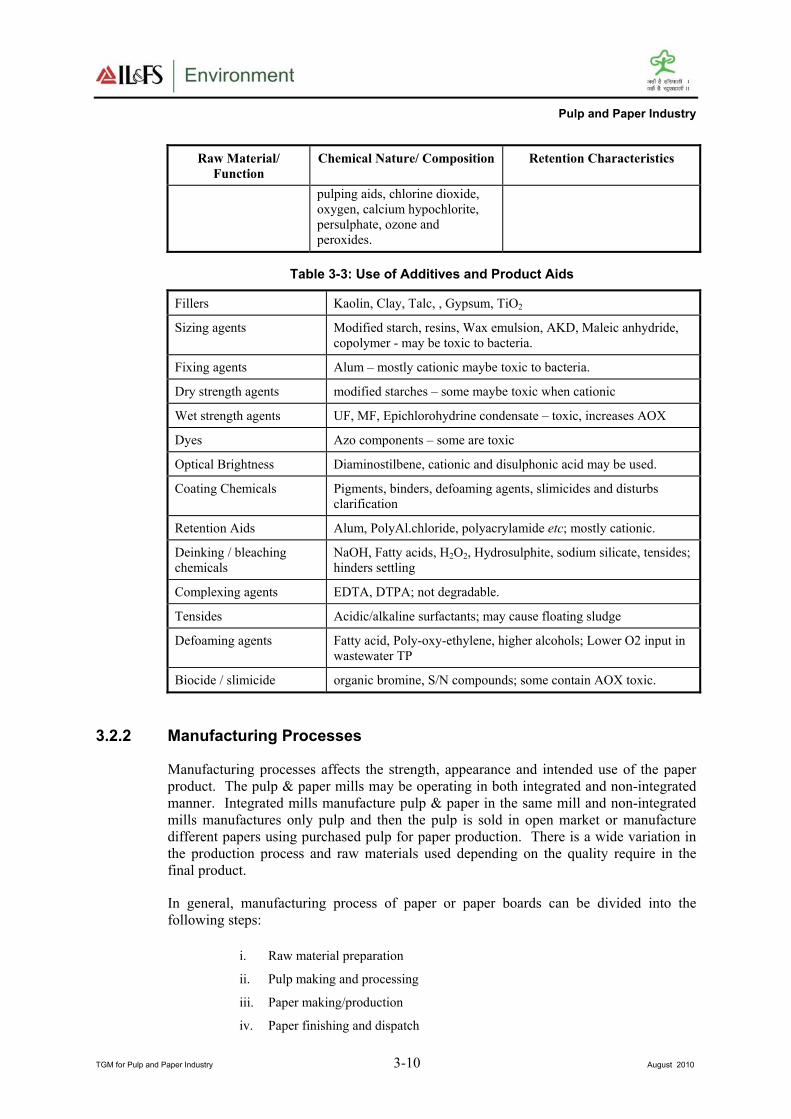
Pulp and Paper Industry
TGM for Pulp and Paper Industry 3-10 August 2010
Raw Material/
Function
Chemical Nature/ Composition Retention Characteristics
pulping aids, chlorine dioxide, oxygen, calcium hypochlorite, persulphate, ozone and peroxides.
Table 3-3: Use of Additives and Product Aids
Fillers Kaolin, Clay, Talc, , Gypsum, TiO2
Sizing agents Modified starch, resins, Wax emulsion, AKD, Maleic anhydride, copolymer - may be toxic to bacteria.
Fixing agents Alum – mostly cationic maybe toxic to bacteria.
Dry strength agents modified starches – some maybe toxic when cationic
Wet strength agents UF, MF, Epichlorohydrine condensate – toxic, increases AOX
Dyes Azo components – some are toxic
Optical Brightness Diaminostilbene, cationic and disulphonic acid may be used.
Coating Chemicals Pigments, binders, defoaming agents, slimicides and disturbs clarification
Retention Aids Alum, PolyAl.chloride, polyacrylamide etc; mostly cationic.
Deinking / bleaching chemicals
NaOH, Fatty acids, H2O2, Hydrosulphite, sodium silicate, tensides; hinders settling
Complexing agents EDTA, DTPA; not degradable.
Tensides Acidic/alkaline surfactants; may cause floating sludge
Defoaming agents Fatty acid, Poly-oxy-ethylene, higher alcohols; Lower O2 input in wastewater TP
Biocide / slimicide organic bromine, S/N compounds; some contain AOX toxic.
3.2.2 Manufacturing Processes
Manufacturing processes affects the strength, appearance and intended use of the paper product. The pulp & paper mills may be operating in both integrated and non-integrated manner. Integrated mills manufacture pulp & paper in the same mill and non-integrated mills manufactures only pulp and then the pulp is sold in open market or manufacture different papers using purchased pulp for paper production. There is a wide variation in the production process and raw materials used depending on the quality require in the final product.
In general, manufacturing process of paper or paper boards can be divided into the following steps:
i. Raw material preparation
ii. Pulp making and processing
iii. Paper making/production
iv. Paper finishing and dispatch

Pulp and Paper Industry
TGM for Pulp and Paper Industry 3-11 August 2010
Pulping processes
All raw materials used in papermaking, except chemicals, fuels and additives, contain fibres. Wood, one of the important raw materials has two components viz. cellulose and lignin. Cellulose is the fibrous component of wood which constitute approximately 50% of the dry-weight of raw materials and lignin is the “glue” that holds wood fibres together. Pulping is the process, which reduces wood to a fibrous mat by separating the cellulose from the lignin. The remaining components (hemicellulose and lignin) will be treated, which constitutes the major potential sources of pollution in chemical pulping. Pulping processes are generally classified into three groups i.e., chemical, mechanical, or semi-chemical.
i. Mechanical Pulp (yield 90%)
Mechanical pulp uses mechanical abrasion to separate cellulose fibres which are held together by lignin. In the process called “Groundwood”, wet wood is ground by large stones. In Thermo mechanical pulping (TMP), metallic plates rub steam heated chips at high speeds, separating fibres. Mechanically produced pulp has a higher proportion of broken cell fragments (called 'fines') among the fibres. Thus, when used to make paper, the long fibres form the matrix of the sheet within which the fines are trapped. Paper derived from mechanical pulps, therefore, tends to be denser and is often a component of newsprint and other printing papers. However, because mechanical pulps are not chemically processed they still contain lignin and other natural wood substances, and paper with a high component of mechanical pulp tends to yellow quickly in sunlight. Mechanical pulping processes all use a lot of electrical energy and water. However, they also provide 80-90% recovery of total fibre. Mechanical pulp processes are cheaper to operate than more sophisticated chemical based systems. There are also fewer environmental issues, such as chemical contamination of sites and unpleasant smells.
ii. Chemical Pulp (yield 50%)
Chemical pulping is most common used method. Chemical pulping achieves fibre separation by dissolving the lignin that cements the fibres together. In chemical pulping, fibres are less likely to be damaged than in other pulping processes. Chemical pulp is more expensive then mechanical pulp, but it has better strength and brightness properties. There are three chemical pulping methods known as Soda, Kraft (or Sulphate), and Sulphite. The choice of the chemical pulping method depends upon the type of raw material available and the product end use.
1. Soda Pulping: Soda pulp is the original chemical pulp and is produced by cooking chips of (usually) deciduous woods in a solution of caustic soda under pressure. This leaves a relatively pure cellulose pulp which is then washed and bleached. Soda pulp produces relatively soft, bulky papers (as a filler with other pulps) used in books, magazines and envelopes. Caustic soda dissolves most of the lignin in wood while having little effect on the cellulose. Cooking liquor is recovered during the washing process. Currently this process is primarily used for agro residue based material pulping.
2. Kraft / Sulphate Pulping: In a chemical pulping process, heat and chemicals are added to wood chips in a pressure cooker called the digester. In the kraft process, an aqueous solution of sodium hydroxide and sodium sulphide, known as white liquor, selectively dissolve the lignin and make it soluble in the cooking

Pulp and Paper Industry
TGM for Pulp and Paper Industry 3-12 August 2010
liquid. After 2 to 4 hours, the mixture of pulp spent pulping chemicals and wood waste is discharged from the digester. The pulp is washed to separate it from the black liquor - the pulping chemicals and wood waste. Kraft pulping is a low yield process - only 45% of the wood used becomes pulp. The pulp, called brownstock at this point in the process, is ready to be bleached. Softwood pulp from a conventional cooking process contains about 4.5% lignin. This lignin will be removed and the pulp will be brightened during the bleaching process. In response to concerns about the amount of organic waste in the effluent, as conventional pulping processes remove only about 95% of the lignin from the pulp, there are few mills that have started extended / oxygen de-lignification for further lignin removal. Today, a well run oxygen de-lignification system can remove 55% of the lignin from the unbleached pulp. The kraft process is applicable to almost any wood and produces a pulp with strong fibres, but which also takes more bleaching that other chemical pulps. It is suitable for even quite resinous pine species. Kraft pulp is used where strength, wear and tear resistance and color are less important. The most obvious examples are brown paper bags, cement sacks and similar sorts of wrapping paper.
3. Continuous Digestor: The most spectacular improvement in kraft cooking machinery is the development of continuous digester, carried out during the 1950s and 1960s. This allows units of more than 1000 tonnes per day to be built, facilitates instrumentation and automation and gives an operation which can be more easily observed and controlled from all aspects, including pollution. It has been found that the formation of obnoxious gases, which constitutes the main air pollution problem of the kraft mill, is only a fraction of that caused by batch cooking and is more easily collected for destruction in a manner to be described subsequently. Continuous digesters now dominate over the batch digesters in industry, and still more so in the new capacities.
4. Rapid Displacement Heating (RDH) Kraft Pulping: In the operating cycle of RDH system, the batch digester is charged with chips and packed with liquor or steam. The technique increases packing density to 10%, thereby increasing pulp production per digester. The digester is filled with warm liquor of high sulphidity (low active alkali) at 100oC. The elevated pressure in the digester serves to uniformly impregnate the chips. The warm liquor is displaced with hot, white and black cooking liquors. The digester is heated, and the cook continues to the desired H-factor. At the end of the cook, displacement continues with washer filtrate until the pulp temperature is below boiling point. The displaced liquor is collected in an accumulator. The digester is discharged either with compressed air or by using pumping machine. Special heat exchangers are employed to preheat the white liquor for the next cook to about 155oC.
5. Super Batch Kraft Pulping: “Super Batch” is a cooking process based on the principles of extended delignification. This technology was developed to reduce chlorinated compounds in bleach plant effluent. Super Batch cooking system was originally developed to make batch cooking more energy efficient. The system was modified to achieve extended delignification. The drawbacks of delignification have been overcome by coupling this technology with Super Batch cooking.

Pulp and Paper Industry
TGM for Pulp and Paper Industry 3-13 August 2010
6. Sulphite Pulping: Sulphite pulping uses sulphurous acid and an alkali to produce pulps of lower physical strength and bulk, but exhibits better sheet formation properties. The yield on the basis of chipped wood is again about 45%. These pulps are blended with ground wood for newsprint and are used in printing, bond papers, and tissue. Sulphite pulping was originally designed with a recovery system similar to the older soda process still used in some plants. Environmental pressures have often forced these plants to develop a recovery process. The pulp produced is made up of longer, stronger and more pliable fibres and is favoured where strength properties are particularly important. Chemical pulping requires significant quantities of energy, mostly for process heat but uses less electrical energy than mechanical processes. However, many modern kraft pulp mills are totally self-sufficient in energy, with combustion of residues and waste products meeting all heat and electrical energy needs.
iii. Semi-Chemical Pulps
Semi-chemical pulps are essentially mechanical pulps that have been pre-treated with a sulphite or sodium hydroxide liquor to improve breakdown and reduce energy requirements during processing. Pulps tend to retain some of the properties of mechanical pulp, including good yields of fibre, but are also suitable for better classes of paper manufacture.
Selection of pulping method depends on the type of raw material used and type of end products use. Pulping process specific fibre separation method, fibre quality, common processes, raw material and yielding products are summarized in Table 3-4.
Table 3-4: Pulping Processes – Raw material and End products
Process
Category
Fibre
Separation
Method
Fibre Quality Common Processes Raw
Material
Types of Product
Produced
Mechanical Mechanical energy
Short, weak, unstable, impure fibres
Stone groundwood (SGW)
Refiner mechanical pulp (RMP)
Thermo-mechanical pulp (TMP),
Chemi-mechnanical pulp (CMP)
Defibrated or exploded pulping
Recycled paper pulping
All types of raw material. Wood (soft and hardwood), agro-residues, bamboo and waste paper
Newsprint, packaging like fluting, sack and folding boxboard, mechanical pulp can also be used till 50 percent in wood containing printing paper in combination with chemical pulp
Chemical Chemicals and thermal energy
Long, strong and stable fibres
Kraft pulping
Sulphite pulping
Soda pulping
Dissolving grade pulping
Softwood and hardwood agro-residues and bamboo
Writing and printing paper, newsprints, kraft paper, tissue, liner, other specialty paper
Semi Chemical
Combination of chemical and mechanical
Intermediate pulp properties (some unique
Neutral sulphite semi chemical
Softwood and hardwood agro-
Newsprint, packaging like sack, kraft liner and folding
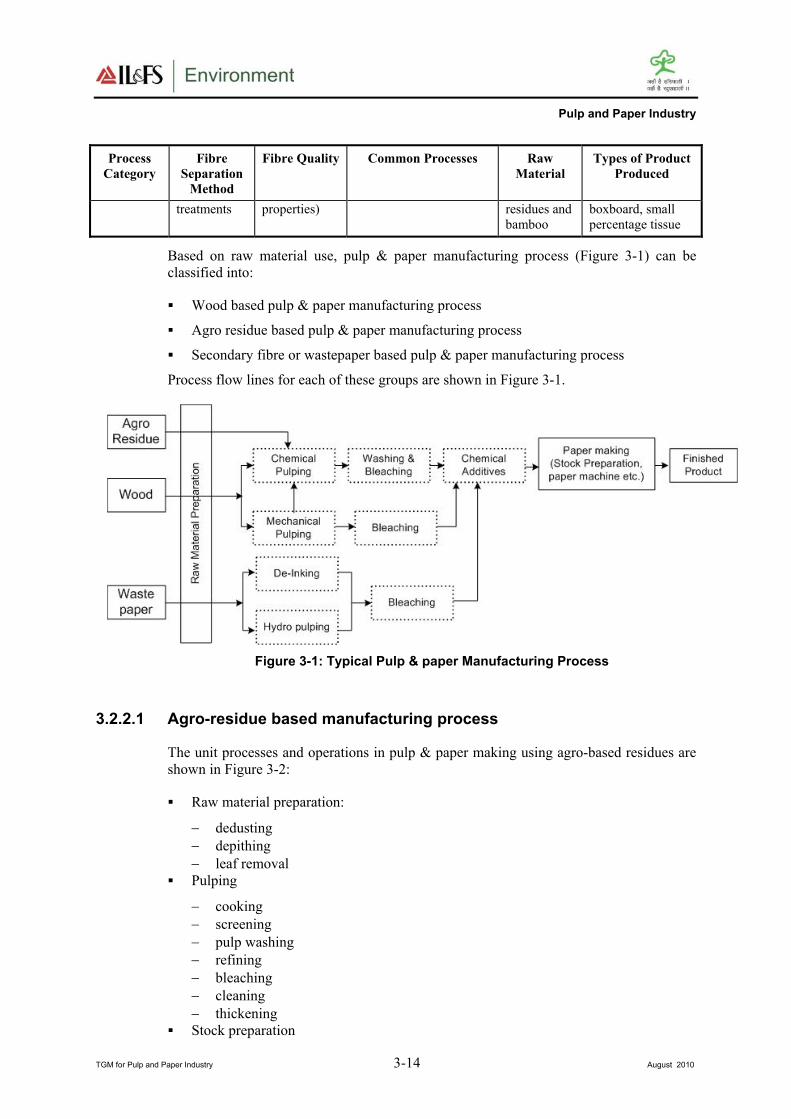
Pulp and Paper Industry
TGM for Pulp and Paper Industry 3-14 August 2010
Process
Category
Fibre
Separation
Method
Fibre Quality Common Processes Raw
Material
Types of Product
Produced
treatments properties) residues and bamboo
boxboard, small percentage tissue
Based on raw material use, pulp & paper manufacturing process (Figure 3-1) can be classified into:
Wood based pulp & paper manufacturing process
Agro residue based pulp & paper manufacturing process
Secondary fibre or wastepaper based pulp & paper manufacturing process
Process flow lines for each of these groups are shown in Figure 3-1.
Figure 3-1: Typical Pulp & paper Manufacturing Process
3.2.2.1 Agro-residue based manufacturing process
The unit processes and operations in pulp & paper making using agro-based residues are shown in Figure 3-2:
Raw material preparation:
− dedusting
− depithing
− leaf removal Pulping
− cooking
− screening
− pulp washing
− refining
− bleaching
− cleaning
− thickening Stock preparation

Pulp and Paper Industry
TGM for Pulp and Paper Industry 3-15 August 2010
− blending
− pulp conditioning Paper machine
− refining
− centricleaning
− dewatering
− drying of paper Chemical recovery
Figure 3-2: Agro-residue based Manufacturing Process
Pulp and Paper Industry
TGM for Pulp and Paper Industry 3-16 August 2010
i. Raw material preparation
The agro residue based raw material is procured by the mills from nearby farms.
In some mills raw material is screened at the site itself. The dust from the screening section is disposed of as solid waste along with municipal waste.
In very small mills, bagasse is not depithed. The prepared agro raw material is then conveyed to spherical digesters.
ii. Pulping
Pulping process comprises of cooking or digestion followed by washing, bleaching and centricleaning.
Cooking: There are two types of digestion processes employed similar to wood pulping; Batch digestion carried out in spherical digesters and Continuous digestion process carried out in a pandia type digester. Also unlike wood pulping two different chemical pulping processes are employed, namely, Kraft process and soda process.
The agro residue is chemically digested in a digester at 150 – 160oC and 6 – 7 atm pressure for about six hours. Charging and discharging takes 1.5 hours and 0.5 hours respectively. The cooking in small agro-based mills is done with caustic soda (NaOH) and steam. The quantity of NaOH charged, varies from 6 to 14 percent of raw material, depending on the type of agro residue. For every tonne of agro residue, about 1.5 – 2.0 tonnes of steam is used, depending on the pulp required (hard cooked or soft cooked). During digestion, solid to liquid (bath ratio) in the range of 1:3 to 1:4 is maintained.
Blow tank: After cooking, the content of the digester is discharged, under pressure, either into a blow tank where the pressure is released or directly into potchers. Water is added to reduce the pulp consistency from an inlet value of 12 – 14 percent to about 3 – 4 percent, so that it can be pumped to the washing and cleaning section.
Washing: The pulp is then pumped to the washers for washing with fresh water in the final stage and backwater in the previous stages. The washing operation takes about four to six hours. The wash water called black liquor, which has total solids content of around 7-10% due to residual alkali and lignin. This liquor is mostly discharged to drains as chemical recovery has so far been economically unviable.
Screening: The washed pulp contains sand and uncooked agro residue as impurities. The impurities are removed through screening and centricleaning. The rejects from the screening (Johnson and / or Hill screen) are normally drained out. After screening, which is carried out at 1% consistency, the pulp is thickened to about 4% for next operation, namely bleaching. The filtrate, called back water, generated during thickening operation, is generally collected and used for pulp washing (previous operation). The pulp for making unbleached kraft paper (for packaging purpose) is not bleached and is taken directly for stock preparation.
Bleaching: The bleaching in small mills is carried out using calcium hypochlorite (hypo), which is added in two stages in order to provide sufficient retention time for hypo and to minimize the fibre degradation. Fifty percent of the hypo is added in the screened pulp storage chest and the rest is added in the bleacher. A retention time of about two hours is provided in the storage chest. After bleaching, the pulp is washed, partly with fresh water and partly with white water (paper machine back water). The wash water from bleaching
Pulp and Paper Industry
TGM for Pulp and Paper Industry 3-17 August 2010
operation contains chloro-lignates and residual chlorine preventing the wash water from direct reuse. The mills may follow CEH or HH bleaching sequence
Chemical recovery: To recover chemicals from black liquor, the slurry goes through a chemical recovery process, such as Kraft pulping chemical recovery. The liquor passes through evaporators, recovery boilers, and causticizers to eventually produce white liquor. The first step of chemical recovery is evaporation process, which increases concentration of solids from approximately 15% to more than 60%. The concentrated slurry contains approximately 50% organic solids and 6% total sulphur in the form of sodium sulphate (Na2SO4) and sodium thiosulphate (Na2S2O3) and is placed into a recovery boiler. The organic solids are burnt for energy while the inorganic process chemicals, also known as smelt, flow through the floor of recovery boiler to be recausticized. Mills with high levels of closure operate at high levels of sodium chloride (NaCl). Typically, the NaCl concentration in black liquor is approximately 12% in closed systems.
iii. Stock preparation
Bleached pulp is mixed with long fibre pulp, comprising mainly rags and wastepaper pulp. The mix depends upon the agro residue being processed and the type of paper to be manufactured. The mix pulp is blended with additives and fillers in the blending chest. The chemicals added to the blending chest are rosin, alum, talc, dye (optional), optical whitener and high gum. The chemicals (additives, fillers etc) solutions are prepared and added manually in every batch.
iv. Paper machine
The blended pulp is again centricleaned to remove impurities and finally fed to the paper machine through a head box. From the dewatering and paper making angle, the machine has three principal stages:
- The gravitational and vacuum dewatering stage (wire part) - The mechanical dewatering stage (press rolls part) - The thermal drying stage (indirect steam dryers)
On the wire part of the paper machine, the dewatering of pulp takes place by gravity and vacuum. The water from the wire mesh is collected in a fan pump pit and is continuously recycled to dilute the pulp fed into the paper machine centricleaner. In some mills, the wire is continuously washed with fresh water showers. The water is collected and fibre is recovered through Krofta save-all. The clear water from save-all is recycled back to different consumption points. Excess is discharged to drain. After the wire part, the edge cutting operation is carried out to obtain paper of a definite width. The edge cuts of the pulp web falls in the couch pit and are recycled to the machine chest.
Towards the end of the wire part of the machine, the consistency of pulp rises to about 20 per cent. Further dewatering is carried out by press rolls to raise the consistency to about 55%. The paper is finally dried through an indirect steam dryer to about 94% solids and is collected in rolls as the final product.

Pulp and Paper Industry
TGM for Pulp and Paper Industry 3-18 August 2010
3.2.2.2 Wood based manufacturing process
Typical wood based pulp & paper manufacturing process is shown in Figure 3-3.
Figure 3-3: Typical Wood based Pulp & Paper Manufacturing Process
Unit processes and the operations are discussed below:

Pulp and Paper Industry
TGM for Pulp and Paper Industry 3-19 August 2010
i. Raw material preparation
The wood logs are fed to a log chain conveyor and then fed to the chipper by means of a belt conveyor. The wood after chipping goes to a cyclone. The chips from the cyclone are fed on the vibrating screen where oversize chips are removed and the accepted chips go to the silo via a conveyor belt. The oversized chips are fed back to the crusher.
The chips from the silo are fed into the digester through a belt conveyor. Two types of digestion processes are employed i.e., batch digestion carried out in spherical digesters and continuous digestion process carried out in a pandia type digester. A shuttle conveyor helps in filling up the digester. The chips in a vertical digester provided with liquor circulation pumps and pre heaters. In this process, wood is cooked in a “digester” at elevated pressure (up to 11 bars) with a solution of the appropriate chemicals, which dissolve the lignin and leave behind the cellulose. The cooking process results in emissions of a variety of hazardous air pollutants, which may include formaldehyde, methanol, acetaldehyde, and methyl ethyl ketone. The cooked material is blown into a blow tank provided with blow heat recovery system. The blown material from the blow tank is taken into the unbleached knotters where the uncooked chips are removed.
ii. Pulp making and processing
Pulp washing
After the wood is pulped, the pulp that is created is washed to remove the dissolved lignin and chemicals. In the washing process, pulp is passed through a series of washers and screens. The washing process occurs at high temperatures (above room temperature), which generates a large volume of exhaust gases containing air pollutants which are released to the atmosphere. The liquid that results from the washing process contains lignin as well as the chemicals used to separate the lignin from the cellulose. The chemical recovery processes are used to recover these chemicals.
Pulp bleaching
After washing, if a white product is desired, the pulp must be bleached to remove color associated with remaining residual lignin. The three general approaches to bleaching are elemental chlorine bleaching, elemental chlorine free bleaching and totally chlorine free bleaching.
Elemental Chlorine Bleaching is the process currently in place at some existing bleaching plants, and uses chlorine (Cl2) and twice hypochlorite to brighten the pulp. In addition, Sodium hydroxide with or without peroxide is used for extraction of chlorine from the pulp. When elemental chlorine and hypochlorite react with the lignin, they form chlorinated pollutants such as chloroform, dioxins, and furans in the wastewater stream. Extraction or oxidative extraction follows chlorination (E or Eo Stage)
Elemental Chlorine Free Bleaching (ECF) replaces chlorine with chlorine dioxide as a bleaching agent and hypochlorite is no longer used. The use of ECF bleaching results in reduced levels of chlorinated pollutants in the wastewater stream.
Totally Chlorine Free (TCF) bleaching uses no chlorinated bleaching agents to bleach the pulp. Instead, bleaching agents such as oxygen and peroxide are used. TCF bleaching eliminates chlorinated pollutants in the wastewater stream.

Pulp and Paper Industry
TGM for Pulp and Paper Industry 3-20 August 2010
Typically, in the bleaching process, the bleaching chemicals are injected into the pulp, and the resulting mixture is washed with water. This process occurs several times and generates a large volume of liquid waste. Additionally, vents from the bleaching sections emit hazardous air pollutants including chloroform, methanol, formaldehyde, and methyl ethyl ketone.
Common chemicals used for bleaching pulp are given in Table 3-5. Depending on the bleaching chemicals used, the waste stream from the bleaching process may contain chlorine compounds and organics. The mixture of chemicals may result in the formation of a number of toxic chemicals (such as dioxins, furans, and chlorinated organics).
Table 3-5: Common Chemicals used for Bleaching of Pulp
Bleaching Chemical Chemical Formula
Sodium Hydroxide NaOH
Elemental Chlorine CI2
Chlorine Dioxide CIO2
Hypochlorite HCIO, NaOC1, Ca(OCI)2
Oxygen O2
Ozone O3
Hydrogen Peroxide H2O2
Nitrogen dioxide NO2
Sulphur dioxide SO2
Suphuric Acid H2SO4
Different types of equipments/technologies used for bleaching are:
Batch process
Continuous countercurrent processes
− Hydraulic drum washing
− Vacuum drum washing
− Pressure washing
− Diffusion washing
− Chemical or belt washing
− Twin roll press washer
iii. Paper making
Papermaking process (stock preparation and paper machine) is similar to that described in agro-based process.
3.2.2.3 Secondary fibre or wastepaper based manufacturing process
Recycled paper, newsprint and magazine is charged in Hydraulic pulper with addition of water and same is processed till waste paper is converted into slurry form with high consistency pulp. The hydro pulped pulp is cleaned in high density cleaner followed by turbo separator for heavy weight and light weight impurities respectively. Then it is continuously forwarded to centricleaner after passing through screen. At centricleaner,
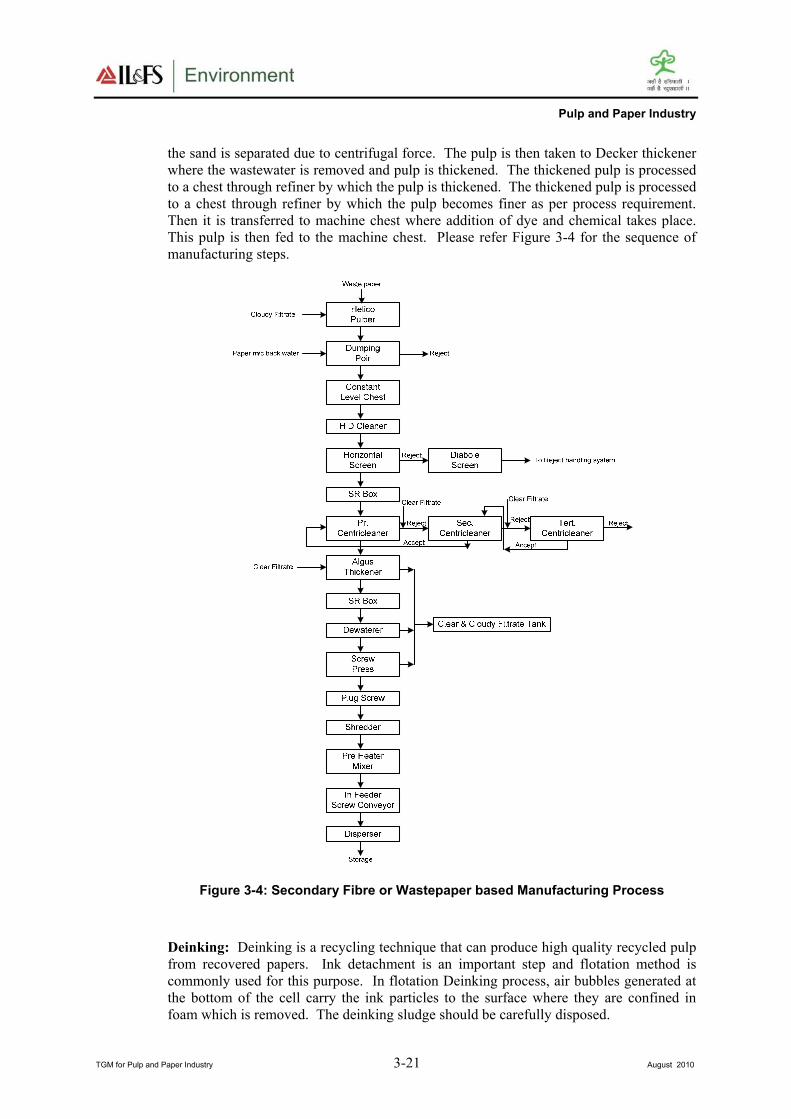
Pulp and Paper Industry
TGM for Pulp and Paper Industry 3-21 August 2010
the sand is separated due to centrifugal force. The pulp is then taken to Decker thickener
where the wastewater is removed and pulp is thickened. The thickened pulp is processed
to a chest through refiner by which the pulp is thickened. The thickened pulp is processed
to a chest through refiner by which the pulp becomes finer as per process requirement.
Then it is transferred to machine chest where addition of dye and chemical takes place.
This pulp is then fed to the machine chest. Please refer Figure 3-4 for the sequence of
manufacturing steps.
Figure 3-4: Secondary Fibre or Wastepaper based Manufacturing Process
Deinking: Deinking is a recycling technique that can produce high quality recycled pulp
from recovered papers. Ink detachment is an important step and flotation method is
commonly used for this purpose. In flotation Deinking process, air bubbles generated at
the bottom of the cell carry the ink particles to the surface where they are confined in
foam which is removed. The deinking sludge should be carefully disposed.

Pulp and Paper Industry
TGM for Pulp and Paper Industry 3-22 August 2010
Papermaking process is similar to that described in agro-based process.
3.2.3 Recovery during manufacturing processes
3.2.3.1 Chemical recovery from black liquor
Another very important process in line with the chemical pulping mills is the recovery of
the pulping chemicals from the concentrated black liquor generated from the pulp
washing process. The entire chemical recovery process from spent cooking liquor of
Kraft and Soda process is described separately in the following section. The recovery of
chemicals in the spent cooking liquor in general is described below.
The weak black liquor from brown stock washers goes through the following steps:
Concentration in multiple effect evaporators
Incineration in recovery furnaces/boiler with addition of salt cake to make up loss
Dissolving smelt from furnace in water to form green liquor.
Causticising of green liquor with lime to form white liquor which, after settling and
filtering is ready for next cooking cycle.
Burning of lime mud to recover lime.
With recent developments such as increase in concentration of black liquor in multiple
evaporation system, the resultant steam economy is very high with black liquor
concentrations increasing from 60% to as much as 80%. However, NOx problems
increase with higher concentration of black liquor which may be partially mitigated by
effective odour control measures.
The sequence of steps is depicted in Figure 3-5.
Figure 3-5: Schematic Diagram of Chemical Recovery Flow Process
Chemical recovery by Kraft process
Conventional chemical recovery process comprises of mainly soda recovery, causticising
and lime kiln plant.
Weak black liquor generated from the brown-stock washing is concentrated to 70%
solids in multiple effect evaporators and is mixed with flue gas residue from soda
recovery boiler. The thick concentrated black liquor is then preheated in super heater
and is injected via high-pressure spray guns into the soda recovery boiler.

Pulp and Paper Industry
TGM for Pulp and Paper Industry 3-23 August 2010
Hot air is injected into the boiler.
Combustion process is initiated by fuel oil to raise the temperature to the required
level.
The heat generated by the combustion reaction of black Liquor is used for generation
of steam. Flue gases from the boiler pass through super heater, economizer and ESP
and are then let off to atmosphere.
Molten sodium carbonate is tapped from the bottom section of boiler and sent to the
recausticising plant for production of white liquor.
Molten sodium carbonate is dissolved in weak white liquor generated by washing of
lime mud. The resultant green liquor is clarified and is mixed with lime in a slaker.
The slurry is clarified through slaker clarifier, from where clear white liquor
overflows and the underflow, lime mud is washed in four-stage counter current
washer with Process condensate (vapour condensate from multi effect evaporator).
Weak white liquor is generated from the first stage washer.
Lime mud sludge generated from the recausticising plant is either utilized in cement
industries or sent to landfill facility or to lime kilns. In lime sludge burning process
(lime kilns), lime i.e. CaO is regenerated from CaCO3.
Soda recovery process and re-causticisation process are shown in Figure 3-6 and 3-7
respectively.
Figure 3-6: Soda Recovery Process

Pulp and Paper Industry
TGM for Pulp and Paper Industry 3-24 August 2010
Figure 3-7: Re-causticisation Process
Non-conventional chemical recovery
Black Liquors from agro residue based mills pose problem in chemical recovery process
in conventional system due to following reasons:
High viscosity of the liquor resulting in low heat transfer
Low concentration of black liquor (7 – 10%) compared to wood based (14 – 17%)
Higher silica content causing fouling and sealing at evaporators
Low combustibility
In order to overcome these limitations, conventional recovery process has been modified
and instead of chemical recovery boiler, fluidized bed reactor is used. Also, the non-
conventional recovery process does not generate power. A typical non-conventional
chemical recovery plant installed and being operated successfully in one of the agro
residue based pulp & paper mill in India. The process of chemical recovery from a non-
conventional process is shown in Figure 3-8 and same is briefly described below.
The black liquor generated from brown stock washing operation, also called weak black
liquor (WBL) contains 8% solids and has a residual alkali of 4.5 gpl. This weak black
liquor is concentrated to 25% solids in a multiple effect evaporator called semi
concentrated black liquor (SBL). The semi concentrated black liquor is then burnt in a
fluidized bed reactor at a temperature of 650oC to produce soda ash. In order to maintain
a temperature of 650oC, fresh water is injected through three cooling guns at top chamber
of the fluidized bed reactor. The flue gases containing considerable amount of heat is
used for preheating the strong black liquor. The product is cooled by passing it through a
double sludge water-jacketed product cooler and passing part of fluidizing air through it.

Pulp and Paper Industry
TGM for Pulp and Paper Industry 3-25 August 2010
Figure 3-8: Process flow sheet for Non Conventional Recovery process
3.2.4 Environmental pollution during manufacturing process
3.2.4.1 Raw Materials
In pulp & paper industry major raw materials and their principal environmental
characteristics are given in Table 3-6.
Table 3-6: Environmental Characteristics for Raw Materials Used in Pulp & Paper Industry
Raw Material/ Function Principal Environmental Characteristics
Mineral fillers for opacity, surface
smoothness
Potential dust when dry, light-scattering and deposition
in water courses
Sizes for water resistance Aquatic toxicity but biodegradable
Dry strength additives Some biodegradable and some non-biodegradable
Wet strength additives Presence of some free formaldehyde(VOC), presence of
chlorinated organics like DCP and poor degradability
Dyes for coloration Poor degradability, aquatic toxicity in few cases.
Auxiliaries largely biodegradable or inorganic
Fluorescent brighteners Poor biodegradability
Retention/ drainage aids to reduce
losses
Aquatic toxicity from cationic polymers, poor
biodegradability, Sulphate (alum) as a source of H2S
Biocides to control slime Poor biodegradability and aquatic toxicity but very
substance specific
Additives for control of deposits
like pitch
Aquatic toxicity from cationics

Pulp and Paper Industry
TGM for Pulp and Paper Industry 3-26 August 2010
Raw Material/ Function Principal Environmental Characteristics
Defoamers Slow biodegradability, affect oxygenation of water
System cleaners High pH, poor biodegradability
Environmental performance of various pulping processes in Indian mills is given in Table
3-7.
Table 3-7: Environmental Performance of Various Pulping Processes in Indian Mills
Process
Category
Pulp
Yield (in
%)
Water
consumption
(m3/BDMT
unbleached
pulp)
Energy
consumption
(GJ/BDMT
unbleached
pulp)
Wastewater
discharge and
pollution load
(m3/BDMT
product)
Air emissions
(kg/BDMT
product)
Solid and
hazardous
waste
generation
(kg/ BDMT
produced)
Chemical Kraft
wood:
46.2
Kraft wood:
34
Kraft wood:
5.3
Kraft wood:
150
Kraft wood:
-Particulates:
3.9
-Malodorous
gases: 12.3
Kraft wood:
-Lime sludge:
525
-Fly ash: 544
Kraft
bagasse:
47.7
Kraft
bagasse: 42
Kraft
bagasse: 6
Kraft bagasse:
118
Kraft bagasse
- Particulates:
2.3
- Malodorous
gases: 9.7
Solid waste:
Kraft bagasse
– Lime Sludge
& Fly Ash
Agro-
residue
based
soda
pulping:
43
Agro-residue
based soda
pulping: 46
Agro-residue
based soda
pulping: 8.2
Agro-residue
based soda
pulping: 158
Agro-residue
based soda
pulping
-Particulates:
3.9
-Malodorous
gases: 1.6
Agro-residue
based soda
pulping (no
chemical
recovery)
-Fly ash : 283
RGP: 34
RGP: 44
RGP: 12 RGP: 154
RGP
-Particulates:
3.1
-Malodorous
gases: 13.7
RGP
-Lime sludge:
38
- Fly ash : 362
Chemi-
Mechanical
CMP
Wood: 81
CMP Wood:
17
CMP Wood:
8.0
CMP Wood:
149
CMP Wood:
Particulates:
3.3
CMP Wood:
Fly ash: 283
CMP
Bagasse:
61
CMP
Bagasse: 26
CMP
Bagasse: 6.0
CMP Bagasse:
75
CMP bagasse:
Particulates:
1.4
CMP bagasse:
Fly ash: 637
Wastepaper 80 8 2.2 47 Particulates:
10.0
Fly ash: 283
Advantages and disadvantages of common chemicals used for bleaching pulp are given in
Table 3-8.
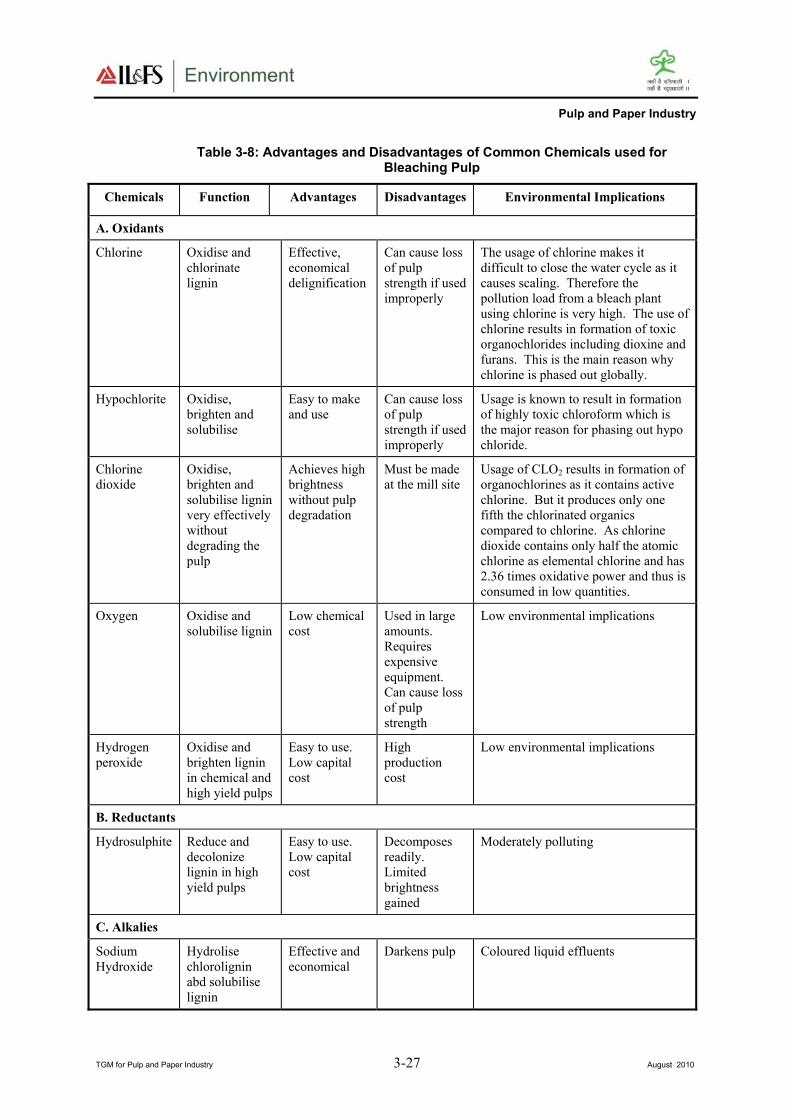
Pulp and Paper Industry
TGM for Pulp and Paper Industry 3-27 August 2010
Table 3-8: Advantages and Disadvantages of Common Chemicals used for Bleaching Pulp
Chemicals Function Advantages Disadvantages Environmental Implications
A. Oxidants
Chlorine Oxidise and
chlorinate
lignin
Effective,
economical
delignification
Can cause loss
of pulp
strength if used
improperly
The usage of chlorine makes it
difficult to close the water cycle as it
causes scaling. Therefore the
pollution load from a bleach plant
using chlorine is very high. The use of
chlorine results in formation of toxic
organochlorides including dioxine and
furans. This is the main reason why
chlorine is phased out globally.
Hypochlorite Oxidise,
brighten and
solubilise
Easy to make
and use
Can cause loss
of pulp
strength if used
improperly
Usage is known to result in formation
of highly toxic chloroform which is
the major reason for phasing out hypo
chloride.
Chlorine
dioxide
Oxidise,
brighten and
solubilise lignin
very effectively
without
degrading the
pulp
Achieves high
brightness
without pulp
degradation
Must be made
at the mill site
Usage of CLO2 results in formation of
organochlorines as it contains active
chlorine. But it produces only one
fifth the chlorinated organics
compared to chlorine. As chlorine
dioxide contains only half the atomic
chlorine as elemental chlorine and has
2.36 times oxidative power and thus is
consumed in low quantities.
Oxygen Oxidise and
solubilise lignin
Low chemical
cost
Used in large
amounts.
Requires
expensive
equipment.
Can cause loss
of pulp
strength
Low environmental implications
Hydrogen
peroxide
Oxidise and
brighten lignin
in chemical and
high yield pulps
Easy to use.
Low capital
cost
High
production
cost
Low environmental implications
B. Reductants
Hydrosulphite Reduce and
decolonize
lignin in high
yield pulps
Easy to use.
Low capital
cost
Decomposes
readily.
Limited
brightness
gained
Moderately polluting
C. Alkalies
Sodium
Hydroxide
Hydrolise
chlorolignin
abd solubilise
lignin
Effective and
economical
Darkens pulp Coloured liquid effluents

Pulp and Paper Industry
TGM for Pulp and Paper Industry 3-28 August 2010
3.2.4.2 Effluent Generation and Characteristics
In pulp & paper industry, considerable quantity of water is used in papermaking
processes. The quantity of water consumption varies according to a quality and kind of
paper to be manufactured. The process stage-specific sources of wastewater generation in
an integrated pulp & paper industry are given in Table 3-9:
Table 3-9: Sources of Effluent Generation
Process Stage Sources of Effluent Generation
Raw Material Preparation Washing wooden chips in large-scale pulp & paper mills
using wood as raw material
Washing of bagasse for separation of pith.
Washing of rice/wheat straw before pulping
Pulping and bleaching Washing of chemically cooked pulp.
Washing of pulp during bleaching
Pulp cleaning equipments (centri-cleaners, Johnson screen
etc.)
Stock preparation and paper
machine
Cleaning of pulp in cleaning equipments
Filtrate for wire section of paper machine
Paper machine presses
Chemical recovery Foul condensate from evaporation and steam surface
condenser
Boiler Blowdown
Note: Besides above major sources of wastewater generation there may be frequent leakages of
black liquor from pump glands and its improper handling, which contribute to significant color
and pollution to the stream. These can be mitigated to considerable extent by devising central
collection system for recycling and recovery.
Typical wastewater production rate and characteristics
Wastewater effluent is produced at a rate of 20–250 m3/tonne of dried pulp, which
consists high in BOD, COD, SS as well as many toxic compounds. The typical indicator
of wastewater characteristics of pulp & paper industry effluents are discussed below:
Suspended Solids (SS): Main components of SS are parts of the wood-like fibres or bark
particles or losses from the process additives, dirt, fillers and coating substances. Higher
quantities of SS are dangerous for fish, particularly if this supply is high and regular. In
addition, if the water body’s self-cleaning capacity is not sufficient, the SS are deposited
on the river bed and anaerobic decomposition takes place, which releases both BOD and
H2S.
Biochemical Oxygen Demand (BOD): Aerobic organisms living in water need oxygen
to develop. If large quantities of effluents with higher BOD are discharged into
insufficient quantities of natural water, the dissolved oxygen contained in the natural
water can be rapidly used to degrade biodegradable substances. Aerobic organisms
present in this water are thus starved of oxygen and can be affected and, in worst cases,
eventually die. If the water body regeneration capacity is overtaken, anaerobic conditions
are permanent which lead to the emission of olfactory nuisances and the destruction of all
the aerobic fauna, including fish.
Toxicity: Pulp & paper industry effluents are mixtures of known and unknown
complexes. Changing compounds and receiving environmental conditions (like dissolved

Pulp and Paper Industry
TGM for Pulp and Paper Industry 3-29 August 2010
oxygen, pH, temperature) can widely alter the sensitivity of organisms and it could turn to
be an ecological concern due to toxicity effects.
The toxicity is, in fact, relatively difficult to evaluate due to the evolution of knowledge
on toxic substances. It has been discovered that pulp & paper mill effluents contained
dioxin, which has been demonstrated as “most potent carcinogen known to man”.
Bleaching plant effluents were found to contain dioxin but the concentrations were low.
The chemical recovery procedures are now a part of the pulp & paper units, which can
significantly decrease the amount of toxic discharge.
Toxicity can also appear several years after effluents are discharged, because it settles in
the sediments for example: persistent organics (i.e., DDT or PCBs) or toxic mineral (i.e.,
Zn), compounds which can be stored for a long time in river beds, and gets released when
environmental conditions change (i.e., variation in temperature, salinity).
Temperature: Increase in water body temperature can produce various effects on aquatic
organisms. If the increases are too great (i.e., if the receiving water body is small), fish
can be affected and in worst cases die. An indirect effect on the organisms is that an
increase in temperature involves the depletion of dissolved oxygen rate which can also be
a cause of death for aquatic organisms.
Taste, odour and color: Some compounds can give water an undesirable taste, odour or
color. This is particularly the case with chemical pulping. In some cases, the fish flesh
can be colored. If these problems do not constitute the major harmful effects caused by
the pulp & paper operations, it is nonetheless the role of an EIA to study how to eliminate
or reduce these problems
The typical ranges of such pollution indicators are BOD: 10–40 kg/tonne of ADP; (COD),
20–200 kg/tonne of ADP, TSS: 10– 50 kg/tonne of ADP, with different toxic compounds
including chlorinated organic compounds, dioxins, furans, and other adsorbable organic
halides, (AOX: 0–4 kg/tonne of ADP.Wastewater), nutrients are nitrogen, and phosphorus
compounds in raw material pulping such as wood. Whereas for mechanical pulping the
wastewater characteristics are less polluted by even more than 5-10 times e.g. BOD: 15–
25 kg/tonne of ADP. The pollution loads for non-wood based pulping would be very less
and of different characteristics.
The eco-toxicity of pulp & paper effluents is due to certain other compounds such as
pulping liquors which contain:
VOCs ( terpenees, alcohols, phenols, methanol, acetone)
Bleaching effluents
− chlorinated hydrocarbons like dioxins and furans
− chloroform
− other chlorinated compounds (chlorolignin in case of chlorine or hypochlorite
bleaching)
Nonyl phenol ethoxylates (NPE)
− used as nonionic surfactants in some papermaking processes
− break down to nonylphenol (NP), a suspected endocrine disrupter discharge
color.
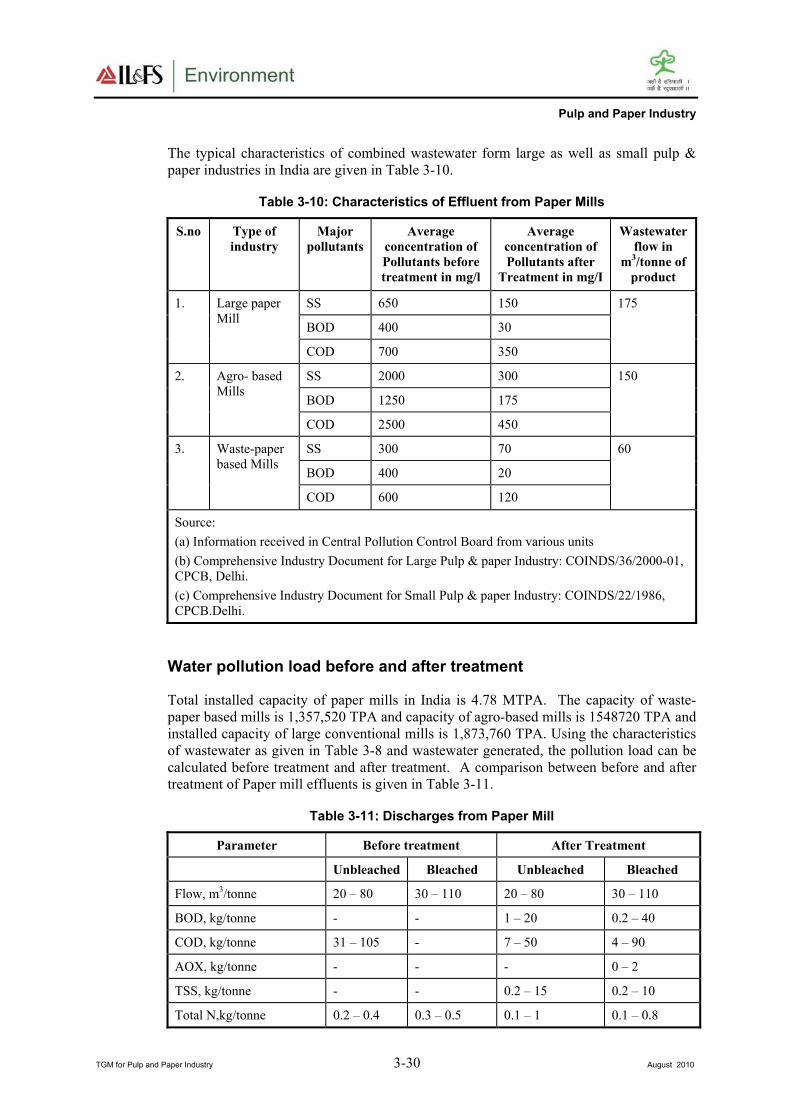
Pulp and Paper Industry
TGM for Pulp and Paper Industry 3-30 August 2010
The typical characteristics of combined wastewater form large as well as small pulp &
paper industries in India are given in Table 3-10.
Table 3-10: Characteristics of Effluent from Paper Mills
S.no Type of
industry
Major
pollutants
Average
concentration of
Pollutants before
treatment in mg/l
Average
concentration of
Pollutants after
Treatment in mg/I
Wastewater
flow in
m3/tonne of
product
1. Large paper
Mill
SS 650 150 175
BOD 400 30
COD 700 350
2. Agro- based
Mills
SS 2000 300 150
BOD 1250 175
COD 2500 450
3. Waste-paper
based Mills
SS 300 70 60
BOD 400 20
COD 600 120
Source:
(a) Information received in Central Pollution Control Board from various units
(b) Comprehensive Industry Document for Large Pulp & paper Industry: COINDS/36/2000-01,
CPCB, Delhi.
(c) Comprehensive Industry Document for Small Pulp & paper Industry: COINDS/22/1986,
CPCB.Delhi.
Water pollution load before and after treatment
Total installed capacity of paper mills in India is 4.78 MTPA. The capacity of waste-
paper based mills is 1,357,520 TPA and capacity of agro-based mills is 1548720 TPA and
installed capacity of large conventional mills is 1,873,760 TPA. Using the characteristics
of wastewater as given in Table 3-8 and wastewater generated, the pollution load can be
calculated before treatment and after treatment. A comparison between before and after
treatment of Paper mill effluents is given in Table 3-11.
Table 3-11: Discharges from Paper Mill
Parameter Before treatment After Treatment
Unbleached Bleached Unbleached Bleached
Flow, m3/tonne 20 – 80 30 – 110 20 – 80 30 – 110
BOD, kg/tonne - - 1 – 20 0.2 – 40
COD, kg/tonne 31 – 105 - 7 – 50 4 – 90
AOX, kg/tonne - - - 0 – 2
TSS, kg/tonne - - 0.2 – 15 0.2 – 10
Total N,kg/tonne 0.2 – 0.4 0.3 – 0.5 0.1 – 1 0.1 – 0.8

Pulp and Paper Industry
TGM for Pulp and Paper Industry 3-31 August 2010
Parameter Before treatment After Treatment
Unbleached Bleached Unbleached Bleached
Total P, kg/t 10 – 40 40 – 60 3 – 40 5 – 90
Metals, g/tonne
(Cd, Pb, Cu, Ni, Zn)
6.5 18.1 - -
3.2.4.3 Solid waste
In pulp & paper industry solid waste is generated in the form of sludge, ash, wood waste,
screening rejects, centricleaner rejects, sand and grit. The main source of solid waste is
wastewater sludge from primary and secondary clarifier. Ash from boilers is also
significant. Table 3-12 shows sources and environmental concerns of solid waste.
Table 3-12: Typical Solid Waste Generation from Pulp & paper Mills
Sources/causes
typical in
sector
Substances
Emitted
Environmental
Concerns
Raw material transport and
preparation: Wood
Bark Wood shavings Space required
Straw Binding wire Space required
Pulp cleaning Knots, bundles of fibre, sand Space required
Quality Control Rejected product Space required
Chemical recovery, removal of
foreign ions
Lime sludge*or lime
Sulphate soap**
Ground water pollution
Process problems
Waste paper treatment Iron wire, plastic film, string Space required
Waste paper de-inking Printing ink sludge (may
contain heavy metals)
Ground water
contamination
Water and wastewater
treatment
Fibre sludge, inorganic sludge,
biological sludge
Space required
Wear of consumables Metal, plastic screens, synthetic
textiles (felts), lubricants,
cleaning agents
Space required
Mill maintenance Defective machine parts
Packaging material
As far as hazardous waste is concerned, the pulp & paper industries can fall into the risk
class category because of use of wide range of materials which are inflammable,
corrosive, reactive, toxic, pathogenic, mutagenic etc., but not severe. The principal
hazardous wastes of concern include wastewater treatment sludges (50–150 kg/tonne of
ADP). Lime sludge and ash falling in this category may need to be disposed of in an
appropriate landfill.
Besides, there are general hazards associated with industrial facilities like: electrical,
structural, mechanical, or general conditions like: ergonomy, temperature, noise, oxygen
deficiency, which can lead to accidents warranting risk assessment and DMP.

Pulp and Paper Industry
TGM for Pulp and Paper Industry 3-32 August 2010
3.2.4.4 Air and Noise
Pulp & paper industries have a wide range of air polluting sources and their emissions are
affected by large number of factors because of highly complex reactions occurring in
different technical processes. They range from dust produced in raw material crushing, to
vapors and gases escaping from reaction vessels and liquor tanks to flue gases from
recovery, bark, sludge and oil/coal boilers, the waste gases from lime burning and
degassing systems of bleach tanks and bleaching towers. The typical pulp & paper
industry emissions (particularly pulping process) are sulphur dioxide (SO2), reduced
organic sulphur compounds, chlorine/chlorine dioxide gas (Cl2, ClO2), certain
hydrocarbons (HC). These air emissions are likely from the recovery boiler, evaporators,
lime kiln, auxiliary boilers, and malodorous gases, chlorine compounds from bleaching
and bleaching chemical preparation.
Though, the pulp & paper plants are not classified as highly air (except odour) intensive
entities, the odour, smokes, vapours and dust are emissions that impact people most in the
immediate vicinity. Kraft pulping process emits highly malodorous emissions of reduced
sulphur compounds, measured as total reduced sulphur (TRS) and including hydrogen
sulphide, methyl mercaptan, dimethyl sulphide, and dimethyl disulphide, are emitted
typically at a rate of 0.3–3 kg/tonne of ADP. (Air dried pulp is defined as 90% bone-dry
fibre and 10% water.)
Black liquor oxidation process generates particulate emissions up to 75–150 kg/t; sulphur
oxides, 0.5–30 kg/t; and nitrogen oxides, 1–3 kg/t. Another important concern is the
VOC emission (15 kg/t) from this process. In comparison the sulphite pulping process
emits less sulphur oxides (15 kg/tonne to 30 kg/tonne +). Other pulping processes
namely –Thermo-mechanical or even mechanical pulping generates much lower
quantities of air emissions.
Typical air pollution mainly occurs from digesters blow tanks, steam boilers, chemical
recovery boilers and limekiln. The major air pollution concerns are as given below:
Hazardous air pollutants (HAPs) and other toxic substances, including:
reduced sulphur compounds (hydrogen sulphide, mercaptans, and alkyl disulphides)
VOCs (acetaldehyde, methanol, propionaldehyde, methyl ethyl ketone, phenols,
terpenes, etc.)
odour (including sulphides generated during chemical recovery of kraft process
"black liquors")
acid gases (sulphuric, hydrochloric, hydrofluoric)
emissions from boilers and lime kilns (including particulates, and sulphur and
nitrogen oxides) repercussions because of low thresholds.
In paper production, the situation is less complex, with fewer factors involved, the main
source being waste air from dryers.
In kraft mills the sources of reduced sulphur compounds are mainly the following units
Digester and Blow tank
Evaporator pulp blow tank.
Smelt dissolving tank
Recovery furnace
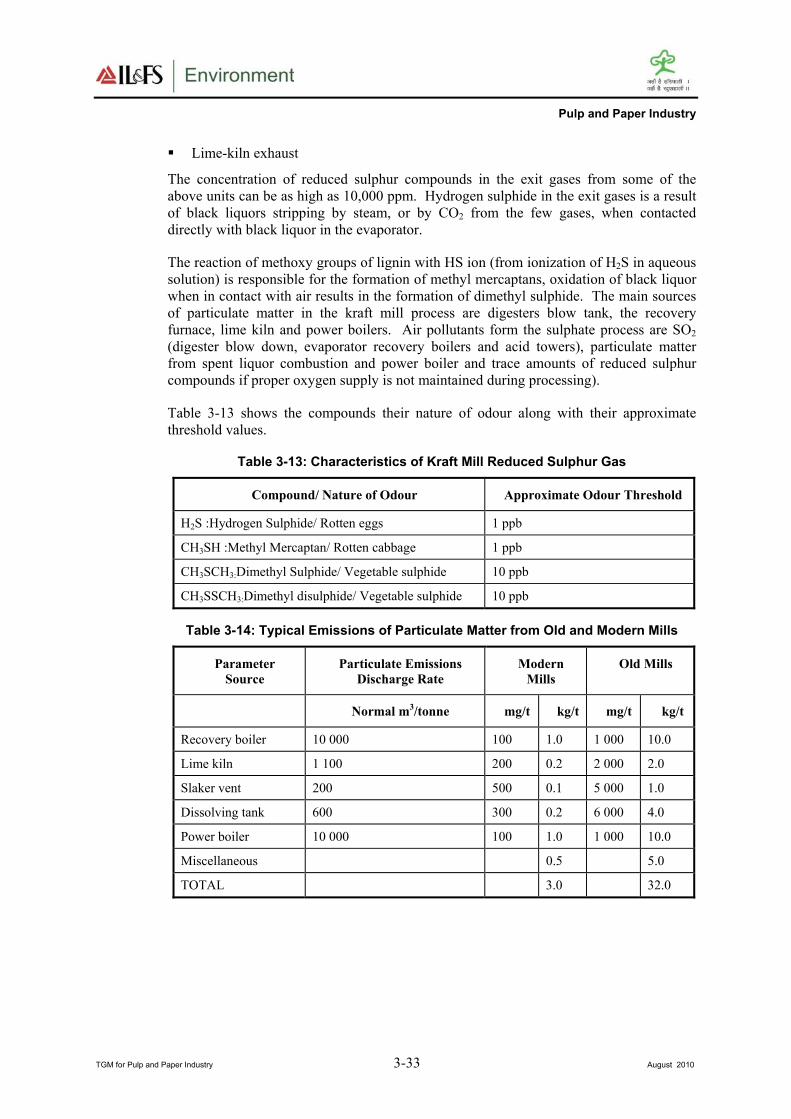
Pulp and Paper Industry
TGM for Pulp and Paper Industry 3-33 August 2010
Lime-kiln exhaust
The concentration of reduced sulphur compounds in the exit gases from some of the
above units can be as high as 10,000 ppm. Hydrogen sulphide in the exit gases is a result
of black liquors stripping by steam, or by CO2 from the few gases, when contacted
directly with black liquor in the evaporator.
The reaction of methoxy groups of lignin with HS ion (from ionization of H2S in aqueous
solution) is responsible for the formation of methyl mercaptans, oxidation of black liquor
when in contact with air results in the formation of dimethyl sulphide. The main sources
of particulate matter in the kraft mill process are digesters blow tank, the recovery
furnace, lime kiln and power boilers. Air pollutants form the sulphate process are SO2
(digester blow down, evaporator recovery boilers and acid towers), particulate matter
from spent liquor combustion and power boiler and trace amounts of reduced sulphur
compounds if proper oxygen supply is not maintained during processing).
Table 3-13 shows the compounds their nature of odour along with their approximate
threshold values.
Table 3-13: Characteristics of Kraft Mill Reduced Sulphur Gas
Compound/ Nature of Odour Approximate Odour Threshold
H2S :Hydrogen Sulphide/ Rotten eggs 1 ppb
CH3SH :Methyl Mercaptan/ Rotten cabbage 1 ppb
CH3SCH3:Dimethyl Sulphide/ Vegetable sulphide 10 ppb
CH3SSCH3:Dimethyl disulphide/ Vegetable sulphide 10 ppb
Table 3-14: Typical Emissions of Particulate Matter from Old and Modern Mills
Parameter
Source
Particulate Emissions
Discharge Rate
Modern
Mills
Old Mills
Normal m3/tonne mg/t kg/t mg/t kg/t
Recovery boiler 10 000 100 1.0 1 000 10.0
Lime kiln 1 100 200 0.2 2 000 2.0
Slaker vent 200 500 0.1 5 000 1.0
Dissolving tank 600 300 0.2 6 000 4.0
Power boiler 10 000 100 1.0 1 000 10.0
Miscellaneous 0.5 5.0
TOTAL 3.0 32.0

Pulp and Paper Industry
TGM for Pulp and Paper Industry 3-34 August 2010
Table 3-15: Typical Emissions of Total Reduced Sulphur from Old and Modern Mills
Parameter
Source
Discharge rate TRS emissions
Old mill Modern mill
Normal (m3/ADT) kg/t kg/t
Digester area - 0.80 0
Washing and screening 2 500 0.30 0.10
Evaporators 10 2.00 0.05
Recovery boiler 10 000 5.00 0.05
Dissolving tank 600 0.20 0.02
Lime kiln 1 100 0.20 0.07
Miscellaneous - 0.80 0.06
TOTAL 9.30 0.35
Table 3-16: Typical Uncontrolled Emission Rates for SOx and NOx from Kraft Pulp Mill Combustion Sources
Parameter Emission Source Emission Rate (kg/tonne of air dried pulp)
SO2 SO3 NOX (as NO2)
Recovery furnace
No auxiliary fuel 0–40 0–4 0.7–5
+ Auxiliary fuel 0–50 0–6 1–10
Lime kiln exhaust 0–2 - -
Smelt dissolving tank 0–0.2 - 10–30
Power boiler*
2% Sulphur FO 6–20
2% Sulphur coal 7–30
Source: World Bank
Note: * with captive electrical power plant that would be higher.
The other air pollution sources from pulp & paper plants include captive power and steam
generation. Steam-and-electricity-generating units using coal or fuel oil emit fly ash,
sulphur oxides, and nitrogen oxides. Coal based plants emit very high fly-ash but
relatively low sulphur dioxide.
Gaseous emissions (Table 3-17) from pulp & paper mills can be broadly classified into
the following categories.
Gases from digesters, blow tank
Gases from multiple-effect evaporators
Gases from recovery, liquor storage tank, causticisers and lime kiln

Pulp and Paper Industry
TGM for Pulp and Paper Industry 3-35 August 2010
Table 3-17: Air Emissions
Parameter Recovery Boiler Limekiln
SO2 kg/tonne 1 – 4 + 0.003 – 0.002 *
(without scrubber) (0.2 – 0.5)++ (0.1 – 0.6) **
(with scrubber) 0.1 – 0.4 -
H2S < 0.05 < 0.03
Nox (as NO2) 0.6 – 1.8 0.2 – 0.3
SS (after ESP) 0.1 – 1.8 0.01 – 0.1 ^
(0.1 – 0.4)^^
+ - 63 – 65 BLS; ++ - 72 – 80 % BLS firing; * - Oil firing without NCG; ** - Oil firing with
NCG;
^ - With ESP; ^^ - With Scrubber
Air Pollution load generation
Major pollutants emitted from paper mills are PM, SO2, CO and total reduced sulphur
(TRS). Emission factors used for estimating air pollution load from small paper mills are
as follows:
PM = 123 kg/tonne of product.
SO2 = 2.5 kg/tonne of product.
CO = 35 kg/tonne of product. (Source: - Rapid Assessment of Sources of Air, Water,
and Land Pollution, World Health Organization, Geneva, 1982).
Total reduced sulphur (TRS) = 0.31 kg/tonne of pulp
PM removal efficiency is considered as 99.9 % in the large paper mills that have installed
ESPs and are complying with emission norms. The PM removal efficiency is considered
as 95 % in the large paper mills that are not complying with emission norms and have
installed ESPs. The PM removal efficiency is considered as 70% in agro-based and waste
paper-based paper mills that have installed multi-clones.
Noise Pollution
Noise is measured and assessed as noise exposure. The unit of measure used is the
dB(A). Exposure limits vary according to the type of area, ranging from 90-95 dB(A) for
purely industrial zones to 40 dB(A) for health resort and residential areas as a night limit.
No special measures are required to comply with a noise exposure level of around 50
dB(A) in the immediate surroundings of modern pulp & paper mills, provided that the
mills are housed inside buildings and noise sources are enclosed in acoustic chambers and
meet the state-of-the-art sound-emission controls. Besides, a green belt can be very
effective in noise control.
If the relatively large amount of land required to build a paper mill is available, the noise
restrictions do not in many cases represent a major barrier to such projects. In fact, the
noise exposure levels may be conformed to even outdoor design of mills, as is frequently
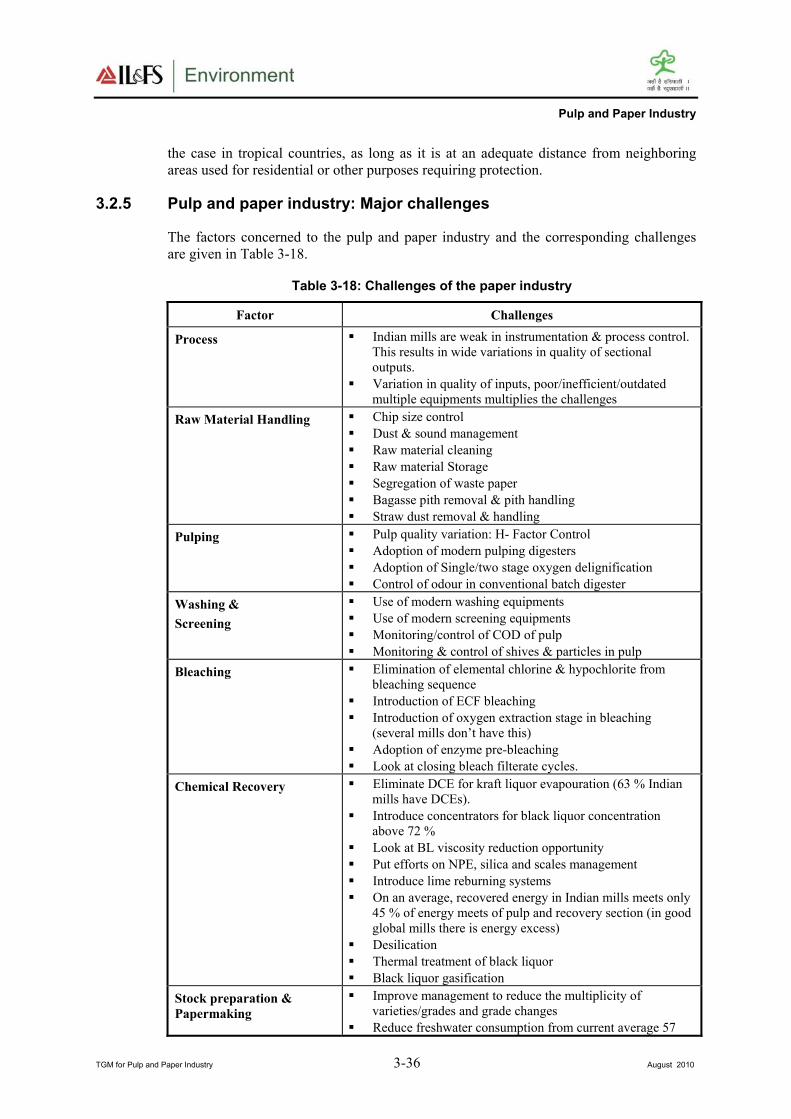
Pulp and Paper Industry
TGM for Pulp and Paper Industry 3-36 August 2010
the case in tropical countries, as long as it is at an adequate distance from neighboring
areas used for residential or other purposes requiring protection.
3.2.5 Pulp and paper industry: Major challenges
The factors concerned to the pulp and paper industry and the corresponding challenges
are given in Table 3-18.
Table 3-18: Challenges of the paper industry
Factor Challenges
Process Indian mills are weak in instrumentation & process control.
This results in wide variations in quality of sectional
outputs.
Variation in quality of inputs, poor/inefficient/outdated
multiple equipments multiplies the challenges
Raw Material Handling Chip size control
Dust & sound management
Raw material cleaning
Raw material Storage
Segregation of waste paper
Bagasse pith removal & pith handling
Straw dust removal & handling
Pulping Pulp quality variation: H- Factor Control
Adoption of modern pulping digesters
Adoption of Single/two stage oxygen delignification
Control of odour in conventional batch digester
Washing &
Screening
Use of modern washing equipments
Use of modern screening equipments
Monitoring/control of COD of pulp
Monitoring & control of shives & particles in pulp
Bleaching Elimination of elemental chlorine & hypochlorite from
bleaching sequence
Introduction of ECF bleaching
Introduction of oxygen extraction stage in bleaching
(several mills don’t have this)
Adoption of enzyme pre-bleaching
Look at closing bleach filterate cycles.
Chemical Recovery Eliminate DCE for kraft liquor evapouration (63 % Indian
mills have DCEs).
Introduce concentrators for black liquor concentration
above 72 %
Look at BL viscosity reduction opportunity
Put efforts on NPE, silica and scales management
Introduce lime reburning systems
On an average, recovered energy in Indian mills meets only
45 % of energy meets of pulp and recovery section (in good
global mills there is energy excess)
Desilication
Thermal treatment of black liquor
Black liquor gasification
Stock preparation &
Papermaking
Improve management to reduce the multiplicity of
varieties/grades and grade changes
Reduce freshwater consumption from current average 57

Pulp and Paper Industry
TGM for Pulp and Paper Industry 3-37 August 2010
Factor Challenges
m3/tonne (European average 10 m3/tonne)
Improve filler loading (Indian average – 140 kg/t; Global
330 kg/t)
Water Increase water system closure
Define internal ecological footprint for water as monitoring
benchmark
Increase:
Whitewater recycle
Recovery of condensate
Reuse of foul condensate
Bleach filter recycle
Rainwater harvesting
Improve monitoring of water use in different sections
Relook at sectional discharges & monitor against set
benchmarks
Evaluate ETP performance & check on colour reduction,
sludge use/disposal
Monitor receiving media
3.3 Technological Aspects
3.3.1 Cleaner technologies
It is an approach to better environmental performance, increased production efficiency
with economic benefits. Often in economic analysis the true economic value of
environmental benefits (or damages), particularly intangibles are poorly reflected.
Environmental economics is not well appreciated resulting in improper economic
evaluation of cleaner production technology options. Newer technology options
evaluation must include the costs (intangibles included) to find economic benefits
The three main cleaner production technologies include:
Source reduction
Recycling
Product modification
Good house keeping and process parameter optimization are the first two steps to source
reduction. The technology upgrade includes process control, changes in input materials,
equipment modification and technology change.
Cleaner production indicators
The indicators are the tools for assessing the potential of a cleaner production option and
thus include.
Process technology (sets limits on performance)
Process efficiency (fibre loss, yield, washing, recovery efficiency etc.)
Specific consumption of inputs (raw materials, energy, water etc.)
Degree of system closure (for water, condensate, chemicals)
Degree of sustainability (ecological foot prints, green house gas emissions, rain water
harvesting, bio-fuel / renewable fuel use, energy self sufficiency).

Pulp and Paper Industry
TGM for Pulp and Paper Industry 3-38 August 2010
Specific pollution load generation (COD, TS, AOX, VOC, SS, DS, Color, odourous
gases emissions, solid waste generation etc).
Economic benefits including environmental advantages (RIO, payback)
Aesthetics and good will
Pulp & paper industries are complex in nature that consists of quite many process
emissions guided by the quality and type of paper required and raw material used besides
on the prevailing management practices. Implementation of cleaner production processes
and pollution prevention measures can yield both economic and environmental benefits.
Preventive technologies
The focus of cleaner technologies in pulp & paper production is summarized as follows:
Adopt various measures to reduce water requirement for different production
processes
Adopt dry debarking processes. Minimize the generation of effluents through process
modifications and recycle wastewaters, aiming for total recycling.
Prevention and control of spills of black liquor and also minimize unplanned or non-
routine discharges of wastewater and black liquor, caused by equipment failures,
human error, and faulty maintenance procedures through EMS in the plant, by
training operators, establishing good operating practices, and providing sumps and
other facilities to recover liquor losses from the process.
Reduce emissions of chlorinated compounds to the environment by reducing the
lignin content in the pulp
Reduce bleaching requirements by process design and operation. Use the following
measures to reduce emissions of chlorinated compounds to the environment: before
bleaching, reduce the lignin content in the pulp (Kappa number of 10) for hardwood
by extended cooking and by oxygen delignification under elevated pressure; optimize
pulp washing prior to bleaching; use TCF or at a minimum, ECF bleaching systems;
use oxygen, ozone, peroxides (hydrogen peroxide), peracetic acid, or enzymes
(cellulose-free xylanase) as substitutes for chlorine-based bleaching chemicals;
recover and incinerate maximum material removed from pulp bleaching; where
chlorine bleaching is used, reduce the chlorine charge on the lignin by controlling pH
and by splitting the addition of chlorine
Total chlorine-free processes are desirable. However, while bleaching at least
elemental chlorine-free bleaching systems should be adopted.
Minimize use of hazardous bleaching chemicals by extended cooking and oxygen
delignification.
Minimize the generation of effluents through process modifications and recycle
wastewaters aiming for total recycling.
Reduce effluent volume and treatment requirements by using dry instead of wet
debarking recovering pulping chemicals by concentrating black liquor and burning
the concentrate in a recovery furnace; recovering cooking chemicals by recausticizing
the smelt from the recovery furnace; and using high-efficiency washing and bleaching
equipment.
Minimize unplanned or non-routine discharges of wastewater and black liquor,
caused by equipment failures, human error, and faulty maintenance procedures, by
Pulp and Paper Industry
TGM for Pulp and Paper Industry 3-39 August 2010
training operators, establishing good operating practices, and providing sumps and
other facilities to recover liquor losses from the process.
Aim for zero-effluent discharge by reducing wastewater discharges at source,
adopting segregation and applying effective waste treatment for reuse in the process,
in case reuse is not possible the wastes could be incinerated.
Minimize odour from reduced sulphur emissions by using modern, low-odour
recovery boilers fired at over 75% concentration of black liquor and then collection
and incineration of left over.
Dewater all sludge and then either recycle or incinerate the unusable part or safely
landfill as ultimate option.
Minimize sulphur emissions to the atmosphere by using a low-odour design black
liquor recovery furnace.
Use energy-efficient processes and equipments such as steam and utility boilers, for
black liquor chemical recovery for a high solid content up to 70%.
3.3.1.1 Improvements in manufacturing process
The most significant environmental issues are the discharge of chlorine-based organic
compounds (from bleaching) and of other toxic organics. The unchlorinated material is
essentially black liquor that escapes the mill recovery process. Some mills are
approaching 100% recovery. Industry developments demonstrate that total chlorine free
bleaching is feasible for many pulp & paper products but cannot produce certain grades of
paper. The adoption of these modern process developments, wherever feasible, is
encouraged. Pollution prevention programs should focus on reducing wastewater
discharges and on minimizing air emissions. Major process recommendations include the
following:
Dry debarking of wood
RDH and Super batch cooking, a pretreatment with BL is done to reduce heat demand,
maintain high initial sulphide concentration and decrease EA charge. The kappa number
is reduced to 14 – 16 for HW against 18 – 22 for conventional cooking. (1 kappa 0.15 %
lignin in pulp). Extended delignification/modified cooking results in less heat demand in
cooking, lower emission (gaseous & wastewater) reduced bleach chemical demand,
marginal increase in BLS. Closed screening of BSW is a reality the knots/ Shives level in
modern cooking is less than 0.5%. Countercurrent approach with washing (integrated
washing and screening) can reduce organic discharges to wastewater.
New generation washing equipments (like DD washers, wash press, horizontal washer)
are a common practice in washer. This gives high discharge consistency, reduces organic
carryover, reduces bleach chemical demand and increases BLS to recovery.
Cooking
Alkali pulping (Kraft /soda) is popular. For wood, Kraft pulping in batch digesters with
hot blow is popular. This results in high thermal energy demand, higher emissions and
relatively higher chemical consumption and lower yield. Better option is to go for
RDH/Super batch cooking with extended delignification, better alkali profile, better
selectivity, higher yield, cold blow, lesser energy demand and no emissions. (700 / 800 kg
steam/ton pulp). Better control is essential in digester operation to ensure proper H
Factor. Conventional batch cooking with hot blow has to adopt techniques to reduce
emissions (blow heat recovery, stripping of NCG’s, incineration). Direct steaming

Pulp and Paper Industry
TGM for Pulp and Paper Industry 3-40 August 2010
digesters need to be phased out. Continuous digesters need to replace them for agro
residues. For conventional cooking use of chemicals for better selectivity are needed (e.g.
polysulphide). Usage of cooking catalysts/ cooking aids like enzymes, AQ.
Washing and screening
The main purpose of washing and cleaning process is to give clean pulp with least carry
over of BL and Shives using minimum dilution. The emission from this section includes
discharges from screens and black liquor if not processed properly. Washing results are
influenced by type of pulp and washing equipments. Integrated washing and screening
(closed screening with refining/recooking) is necessary to reduce screen room discharges.
Great care is essential to reduce discharges from conventional rotary vacuum washers
(leakage, spills, foam, vacuum/level, over loading, hoods).
Non wood pulps, are slow draining & need careful design/selection of equipment for
reduced environmental discharges. In digester washing must be proper in continuous
digesters to ensure lower environmental impacts. Wash plants should never be used as a
buffer between cooking and bleaching department. New generation screen equipments
(like Pressure screen Delta combi screens) for better separation of knots and fines are
needed. Tail screens can remove Shives. Modern concept is to use high consistency (3-
4%) pressure screens.
Bark effluents are toxic. Condensates from cooking and evaporator are Volume (8 – 10
m3/tonne), COD (20 –30 kg/tonne) and BOD (7 – 10 kg/tonne). Foul condensates include
methanol/ ethanol, TRS, turpentine, ketones, phenolics, resin /fatty acids, N are high in
hardwood. Strong condensates (1 m3/tonne) can be steam stripped and gases are
incinerated. Weak condensates (7-8 m3/tonne), 0.5 – 2 kg COD/ m3, free of metal, can be
directly utilized in washing.
Spills
Spills occur from digestion plant, screen room, wash plant, evaporation plant and tanks.
They must be collected and reprocessed. Leakages occur from pumps, seals, gland,
valves, pipelines and mating surfaces and proper maintenance can reduce this.
Conductivity measurements and fibre content of wastewater must be benchmarked and
checked. Spill account for 10 kg/tonne of COD. Black liquor residues (washing losses)
in unbleached pulp press washing at last stage can reduce amount of water going with
pulp from 6 – 10 m3/tonne to 2 – 3 m3/tonne. The values should be benchmarked as
cod pulp. (Typically 7 – 12 kg/tonne hardwood pulp).
AOX release
Use of elemental chlorine and Hypochlorite result in high AOX releases (almost 0.1 kg
AOX/kg elemental Cl2 and 0.05 kg AOX/kg Hypo as active chlorine). Chlorinated
phenolics degrade very slowly and their values (Penta and Tri) should be less than 1
g/tonne pulp. Full/ partial elimination of Cl2 and hypo by chlorine dioxide reduces AOX
release. This with oxygen delignification can substantially reduce AOX levels.
Enzyme prebleaching (Xylanase) can reduce bleach consumption by 10 – 20%. AOX
generation in conventional cook with CEHH type sequence for HW is 5 – 8 kg/tonne.
This can be reduced to 2 kg by ECF, less than 1 kg by oxygen/ECF, less than 0.5 kg by
modified cook / oxygen/ ECF. Use of enzymes will further reduce AOX.

Pulp and Paper Industry
TGM for Pulp and Paper Industry 3-41 August 2010
ECF bleaching
The ECF bleaching sequence for Hardwood include D (EOP)D(EP)D, D(EO)D(EP)D,
D(EOP)DD, D(EO)DD, QOPZP. Chlorine and hypo are eliminated to improve
environmental situation of bleach plants. Initially partially chlorine replacement (as C/D
or D/C) and full Hypo replacement are tried in Indian mills to reduce AOX generation in
bleach plant. Dioxide bleaching is carried out at 10% consistency, 60ºC, for 30 minutes
at pH of 3.5.
Alkaline extraction reinforced with O and P (EOP) is done around 12% consistency, 60 -
70ºC, for 60 minutes. Alkali, oxygen and peroxide changes are 10 – 20, 3 – 6 and 2 – 4
kg/tonne. Peroxide can be applied at several positions (in extraction, for final brightness
adjustment, separate delignification/ bleaching. These bleaching changes eliminate 2378
TCDD and 2378 TCDF formation to non-detectable limits. Chloroform generation is
decreased; chlorinated organics generation level is decreased to 0.2 – 1.0 kg AOX/tonne
before ETP.
The Hexauronic acid is produced during Kraft pulping of HW contributes to higher
Kappa number and brightness reversion. This can be removed by acidic conditions in
bleaching (pH ~ 2) and high temperature in bleaching or by ozone bleaching.
Bleach plant closure
Partial / full closing of bleach plant mill result in reduced wastewater discharges. This
can be done counter currently with ODL and BSW. This will be associated with
accumulation of DS affecting plant operation, besides needing pH adjustments. There
could be possibility of Ca-oxalate precipitation, increased built up calcium chlorides may
enhance corrosion of equipment. The current levels of bleach plant discharges at lower
level are 25 – 40 m3/tonne which can be reduced to 20 – 25 m3/tonne volume The COD
discharge can be reduced to 10 m3/tonne and 30 kg COD with better closure. Generally
first acid stage filtrate with highest Ca is purged to contain mill operations.
Spill collection
Greater in plant measures reduce discharges, Pulping liquors lost from BSW, pumps,
valves, from knotters and screens, sewered evaporator boil out solutions. Spilled liquors
should be collected at highest possible concentration and returned to appropriate
locations. Adequate buffer tank capacity can reduce spills. Monitoring conductivity and
pH can detect losses. A single line Kraft mill can have 5 collection sumps. Evaporator
plant should have 5 – 10% extra capacity to deal with sump liquors.
Technologies for kappa number reduction
The pulp & paper industries normally use kraft process in batch or continuous digesters to
remove the lignin as much as possible during pulping of wood based fibrous raw material
but the process has limitation that the wood based fibrous raw material can not be
delignified to a low kappa number. Since the kappa number is the main factor which
governs the demand of chemicals for bleaching of the pulp the process was modified to
achieve maximum possible delignification during cooking of raw materials. Pulp & paper
industries have incorporated various measures to reduce the kappa number and also to
minimize the carry over of organic matter along with pulp as it governs the bleach
chemical demand during the bleaching process before bleaching. The reduction of the
lignin content in the pulp (Kappa number of 10) for hardwood can be carried out using
cleaner technologies such as extension of cooking and carrying out oxygen delignification
under elevated pressure; optimizing the pulp washing prior to bleaching; use TCF or at a

Pulp and Paper Industry
TGM for Pulp and Paper Industry 3-42 August 2010
minimum, ECF bleaching systems; use oxygen, ozone, peroxides (hydrogen peroxide),
peracetic acid, or enzymes (cellulose-free xylanase) as substitutes for chlorine-based
bleaching chemicals; recover and incinerate maximum material removed from pulp
bleaching; where chlorine bleaching is used, reduce the chlorine charge on the lignin by
controlling pH and by splitting the addition of chlorine.
Extended delignification: Most of the industries in developed countries are employing
RDH, modified continuous cooking, super batch process etc to reduce the kappa number
of the unbleached pulp. Modified pulping processes are energy efficient, require fewer
chemicals for cooking of raw materials and produce the pulp of low kappa number with
better strength properties as compared to conventional pulping processes. However, the
high capital investment and high level of operation restrict the adoption of these
technologies in Indian pulp & paper industries
Improved pulp washing: The pulp & paper industries can use the modified washing
systems such as belt filter press, double wire washer etc, to minimize the carry over of the
black liquor with pulp entering the bleaching section.
Oxygen delignification: Oxygen delignification is a well established technology and
most of the pulp mill abroad is using this process to reduce the kappa number of pulp
before bleaching stage. Single stage oxygen pre bleaching of the pulp reduces the pulp
kappa number by 50-60 % and two-stage oxygen pre-bleaching reduces the pulp kappa
number by 80%.
Recycled fibre processing
Recycled fibres are indispensable raw materials for the industry. The processing varies
depending on grade to be produced and the quality of waste paper. RCF processes are
essentially of two main categories:
Process with exclusive mechanical cleaning (no deinking) like for test liner,
corrugating medium, board or carton board.
Processes with mechanical and chemical unit processes (deinking) for products like
NP, tissue, printing, and copy paper, magazine paper (SC/LWC).
3.3.1.2 Improvements in effluent treatment process
The effluent generation during the manufacturing process may be controlled in following
ways.
− Segregation / separation of water loops of each machine.
− Shower waters are treated with micro screens.
− Sealing waters are properly collected and recycled.
− Using of pinch technology to ensure proper quality of recycle.
− Using well washed pulp in paper machine.
− Ensuring chemicals are of right quality.
− Well Monitoring
− Understanding wet end chemistry well.
Reduction of fibre and filler losses
− Proper refining and screening
− Efficient control of paper machine headbox
− Proper use of retention aids
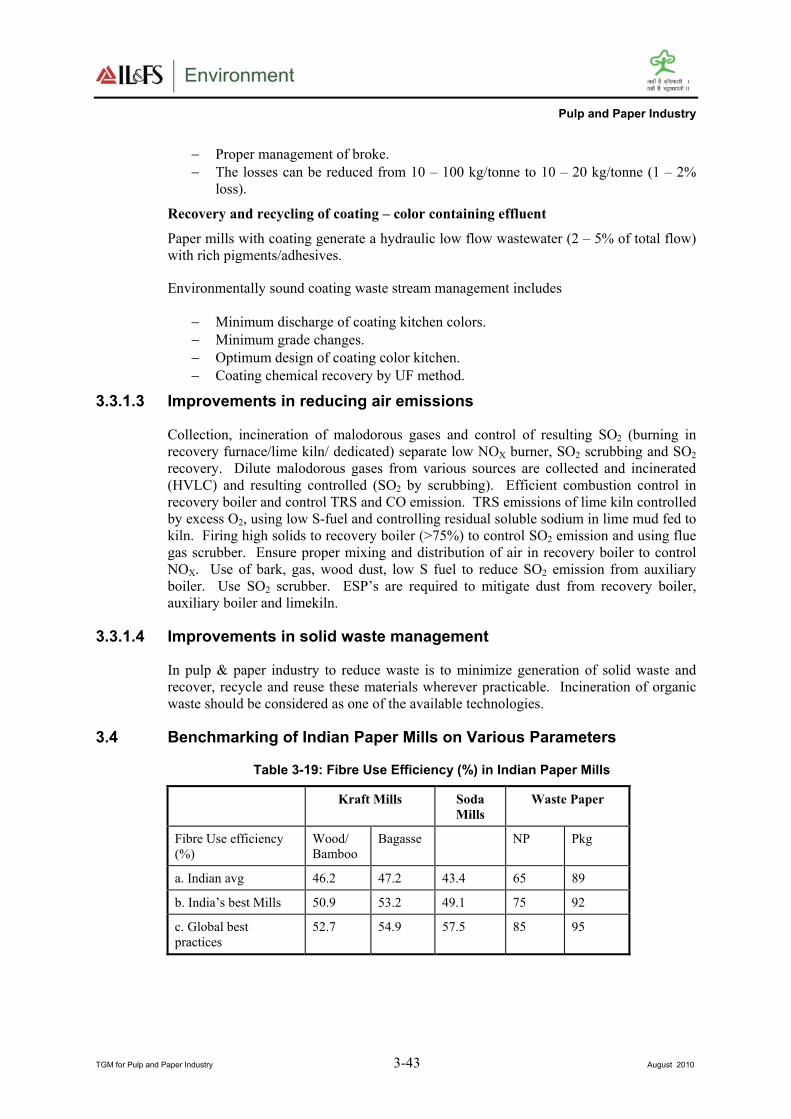
Pulp and Paper Industry
TGM for Pulp and Paper Industry 3-43 August 2010
− Proper management of broke.
− The losses can be reduced from 10 – 100 kg/tonne to 10 – 20 kg/tonne (1 – 2%
loss).
Recovery and recycling of coating – color containing effluent
Paper mills with coating generate a hydraulic low flow wastewater (2 – 5% of total flow)
with rich pigments/adhesives.
Environmentally sound coating waste stream management includes
− Minimum discharge of coating kitchen colors.
− Minimum grade changes.
− Optimum design of coating color kitchen.
− Coating chemical recovery by UF method.
3.3.1.3 Improvements in reducing air emissions
Collection, incineration of malodorous gases and control of resulting SO2 (burning in
recovery furnace/lime kiln/ dedicated) separate low NOX burner, SO2 scrubbing and SO2
recovery. Dilute malodorous gases from various sources are collected and incinerated
(HVLC) and resulting controlled (SO2 by scrubbing). Efficient combustion control in
recovery boiler and control TRS and CO emission. TRS emissions of lime kiln controlled
by excess O2, using low S-fuel and controlling residual soluble sodium in lime mud fed to
kiln. Firing high solids to recovery boiler (>75%) to control SO2 emission and using flue
gas scrubber. Ensure proper mixing and distribution of air in recovery boiler to control
NOX. Use of bark, gas, wood dust, low S fuel to reduce SO2 emission from auxiliary
boiler. Use SO2 scrubber. ESP’s are required to mitigate dust from recovery boiler,
auxiliary boiler and limekiln.
3.3.1.4 Improvements in solid waste management
In pulp & paper industry to reduce waste is to minimize generation of solid waste and
recover, recycle and reuse these materials wherever practicable. Incineration of organic
waste should be considered as one of the available technologies.
3.4 Benchmarking of Indian Paper Mills on Various Parameters
Table 3-19: Fibre Use Efficiency (%) in Indian Paper Mills
Kraft Mills Soda
Mills
Waste Paper
Fibre Use efficiency
(%)
Wood/
Bamboo
Bagasse NP Pkg
a. Indian avg 46.2 47.2 43.4 65 89
b. India’s best Mills 50.9 53.2 49.1 75 92
c. Global best
practices
52.7 54.9 57.5 85 95
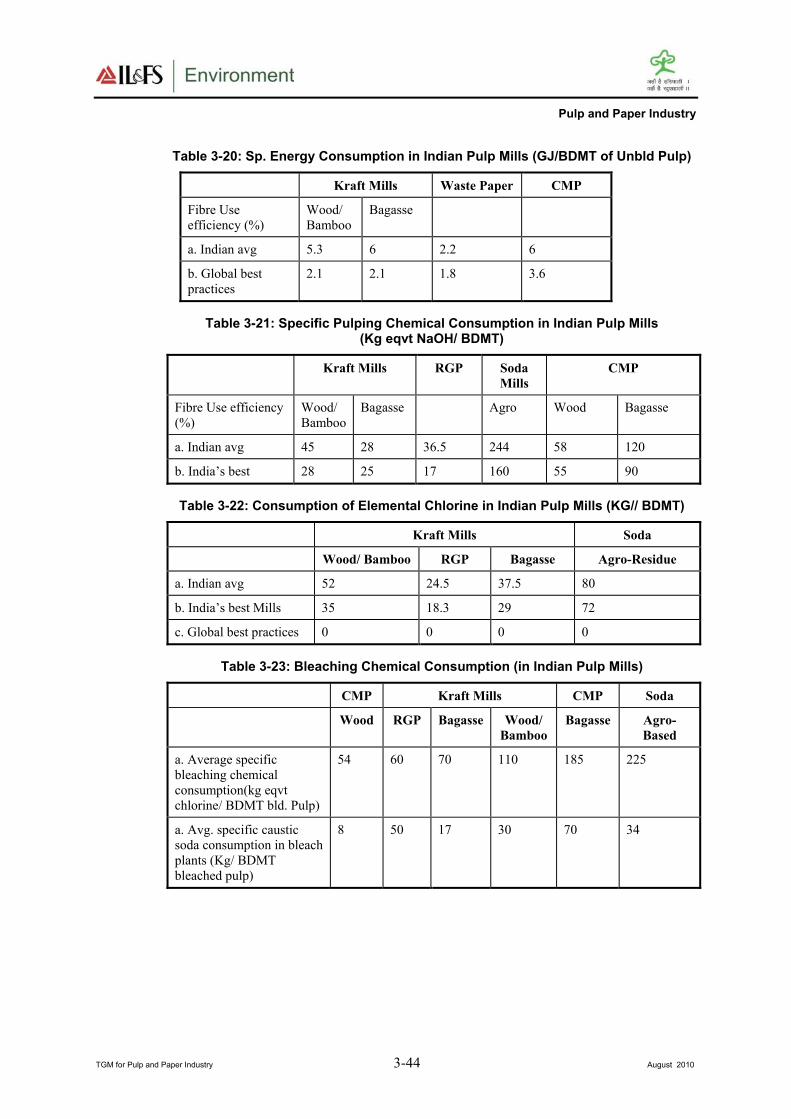
Pulp and Paper Industry
TGM for Pulp and Paper Industry 3-44 August 2010
Table 3-20: Sp. Energy Consumption in Indian Pulp Mills (GJ/BDMT of Unbld Pulp)
Kraft Mills Waste Paper CMP
Fibre Use
efficiency (%)
Wood/
Bamboo
Bagasse
a. Indian avg 5.3 6 2.2 6
b. Global best
practices
2.1 2.1 1.8 3.6
Table 3-21: Specific Pulping Chemical Consumption in Indian Pulp Mills (Kg eqvt NaOH/ BDMT)
Kraft Mills RGP Soda
Mills
CMP
Fibre Use efficiency
(%)
Wood/
Bamboo
Bagasse Agro Wood Bagasse
a. Indian avg 45 28 36.5 244 58 120
b. India’s best 28 25 17 160 55 90
Table 3-22: Consumption of Elemental Chlorine in Indian Pulp Mills (KG// BDMT)
Kraft Mills Soda
Wood/ Bamboo RGP Bagasse Agro-Residue
a. Indian avg 52 24.5 37.5 80
b. India’s best Mills 35 18.3 29 72
c. Global best practices 0 0 0 0
Table 3-23: Bleaching Chemical Consumption (in Indian Pulp Mills)
CMP Kraft Mills CMP Soda
Wood RGP Bagasse Wood/
Bamboo
Bagasse Agro-
Based
a. Average specific
bleaching chemical
consumption(kg eqvt
chlorine/ BDMT bld. Pulp)
54 60 70 110 185 225
a. Avg. specific caustic
soda consumption in bleach
plants (Kg/ BDMT
bleached pulp)
8 50 17 30 70 34
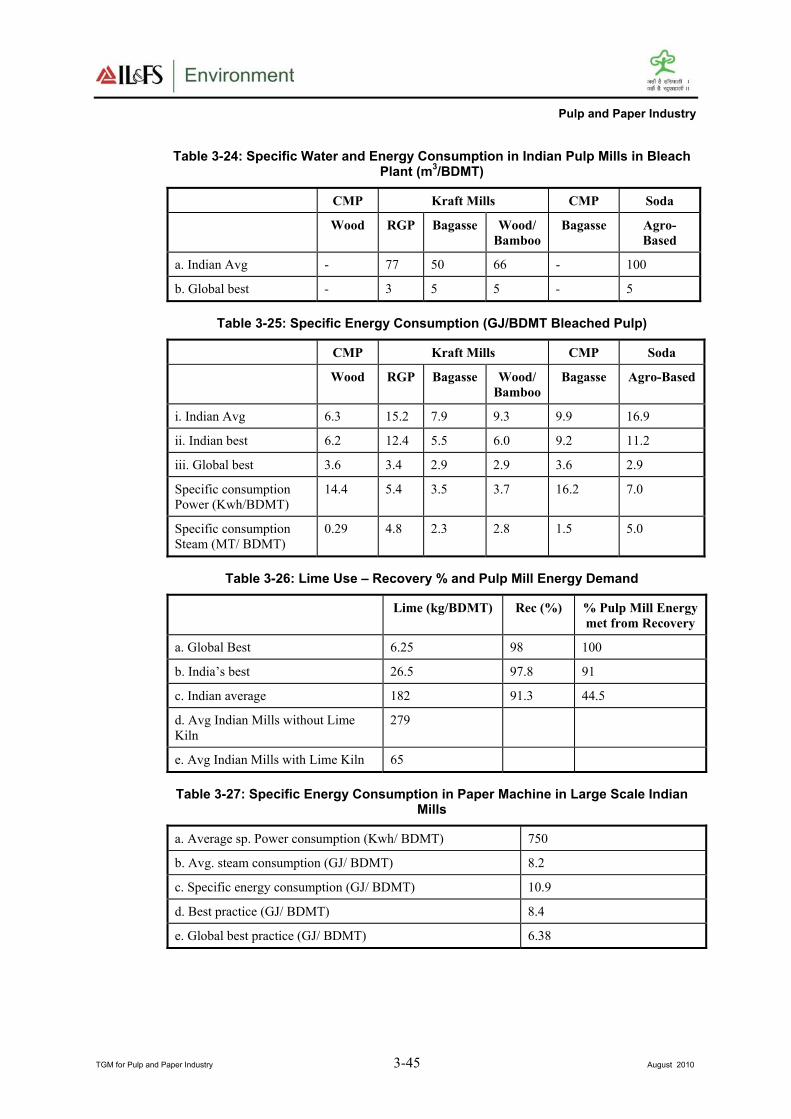
Pulp and Paper Industry
TGM for Pulp and Paper Industry 3-45 August 2010
Table 3-24: Specific Water and Energy Consumption in Indian Pulp Mills in Bleach Plant (m
3/BDMT)
CMP Kraft Mills CMP Soda
Wood RGP Bagasse Wood/
Bamboo
Bagasse Agro-
Based
a. Indian Avg - 77 50 66 - 100
b. Global best - 3 5 5 - 5
Table 3-25: Specific Energy Consumption (GJ/BDMT Bleached Pulp)
CMP Kraft Mills CMP Soda
Wood RGP Bagasse Wood/
Bamboo
Bagasse Agro-Based
i. Indian Avg 6.3 15.2 7.9 9.3 9.9 16.9
ii. Indian best 6.2 12.4 5.5 6.0 9.2 11.2
iii. Global best 3.6 3.4 2.9 2.9 3.6 2.9
Specific consumption
Power (Kwh/BDMT)
14.4 5.4 3.5 3.7 16.2 7.0
Specific consumption
Steam (MT/ BDMT)
0.29 4.8 2.3 2.8 1.5 5.0
Table 3-26: Lime Use – Recovery % and Pulp Mill Energy Demand
Lime (kg/BDMT) Rec (%) % Pulp Mill Energy
met from Recovery
a. Global Best 6.25 98 100
b. India’s best 26.5 97.8 91
c. Indian average 182 91.3 44.5
d. Avg Indian Mills without Lime
Kiln
279
e. Avg Indian Mills with Lime Kiln 65
Table 3-27: Specific Energy Consumption in Paper Machine in Large Scale Indian Mills
a. Average sp. Power consumption (Kwh/ BDMT) 750
b. Avg. steam consumption (GJ/ BDMT) 8.2
c. Specific energy consumption (GJ/ BDMT) 10.9
d. Best practice (GJ/ BDMT) 8.4
e. Global best practice (GJ/ BDMT) 6.38

Pulp and Paper Industry
TGM for Pulp and Paper Industry 3-46 August 2010
Table 3-28: Product Wise sp. Energy and Water Consumption during Papermaking in Indian Paper Mills
Product wise average NP WP NP+WP Industrial
papers
WP +
Industrial
papers+
Specialty
Avg. sp energy consumption
(GJ/ BDMT)
9.2 11.2 11.8 12.5 13.3
Avg. sp water consumption (m3/
BDMT)
33.0 58.0 59.0 43.0 81.0
Table 3-29: Specific Water Consumption (m3/ BDMT) in Indian mills – Basis Raw
Material
Wood Based Non wood based Waste paper based
a. Indian avg 183 203 59
b. Indian best 105 115 28
c. Global best 37 38 8
Table 3-30: Specific Water Consumption with Various Pulping Technologies in Indian Paper Mills (m
3/BDMT)
Kraft RGP CMP
+ CP
WP WP+Chem
a. Indian average 182 173 139 105 129
b. Indian best 131 150 105 59 28
c. Global best 41.8 36.3 25.1 8 21.2
Table 3-31: Sp Water Consumption in Indian Mills with Different Product Profiles (m3/ BDMT)
WP+N Industrial WP NP All3
a. Indian average 159 101.5 166 73 176
b. Indian best 115.5 27.65 29.9 57 123.6
c. Global best 29.1 15.2 38 11.3 35.5
Table 3-32: Water Closure in Indian Paper Mills using Different Raw Materials (%)
Integrated based on
Wood Bagasse Wastepaper WB
based
RGP
a. Closure of process water cycle 56 63 38 72 39
b. Closure of DM water cycle 51 53 59 53 24
c. Closure of overall water cycle 55 62 39 72 38

Pulp and Paper Industry
TGM for Pulp and Paper Industry 3-47 August 2010
Table 3-33: Percentage of Total Energy Generated from the Biomass Wastes Internally in Indian Mills (%)
Integrated Pulp & Paper RGP
a. Indian average 35.4 66.8
b. Indian best 47.9 78.2
c. Global best 80 150
Table 3-34: Specific Energy Consumption (GJ/BDMT) in Indian Mills
WPP
based
Paper
Mill
NP
Mills
RGP
Mills
Integrated
non-wood
based pulp &
paper mills
Integrated B/HW
based pulp &
paper mills
a. Specific Primary energy consumption (GJ/ BDMT)
30.7-
35.9
44.4 51.0 52.3 60.0
b. Avg Steam, power and energy consumption
i. Sp Power
consumption (Kwh/
BDMT)
1666.5
ii. Sp steam
consumption
(MT/BDMT)
9.0
iii. SP. Energy (GJ/
BDMT)
30.6
iv. Best practice 16.3
Table 3-35: Specific Energy Consumption in Indian Mills (GJ/ BDMT) – Process Wise
Specific energy consumption
Kraft
process
RGP CMP & chem.
Pulping
Waste
Paper
Waste paper &
Chem pulp
i. Indian average 38 34.5 31 16 20
ii. Indian best 30 29 25 13.9 14.2
iii. Global best 20 13 14 7.9 14
Table 3-36: Specific Energy Consumption in Indian Mills (GJ/BDMT) – Product Wise
Specific energy consumption
NP WP NP+WP Pkg &
Board
Cultural +
Industrial
All 3 types
i. Indian average 20.2 35.3 26.7 14.5 26.1 38.2
ii. Indian best 15.9 20.3 14.2 13.8 16.9 27.5
iii. Global best 9.3 18.1 13.9 7.3 17.7 18.1

Pulp and Paper Industry
TGM for Pulp and Paper Industry 3-48 August 2010
Table 3-37: Wastewater Characteristics from Wastepaper Pulping
Wastepaper grade BOD (Kg/ ton of
pulp)
COD (Kg/ ton
of pulp)
Comments
Mixed domestic
wastepaper
5-15 10-40 Depends on contaminants
Commercial waste
paper
5-10 10-30 Little contaminants
depends on starch content
Old Newspaper 20-40 40-90 Increase pollution due to
de-inking
Old Corrugated
containers
5-15 10-40 Depends on starch & glue
content
Selected wood free
news paper
5-50 10-100 Wide range; depends on
starch content
Table 3-38: Benchmarking Specific Average Wastewater Discharge of Large Scale Indian Pulp & Paper Mills (m
3/ BDMT)
a. European pulp & paper industry 47
b. Large scale Indian mills 127
c. Indian pulp & paper industry 180
d. Indian RGP mills 160
e. Rayon pulp mill Sweden 5
Table 3-39: Benchmarking Specific Pollution Load of Indian Mills with European Mills (Kg/BDMT product)
BOD Load COD Load AOX Load
a. Large scale Indian
mills
2.7 27.5 0.8
b. European pulp &
Paper mills
1.7 12.2 0.04
Table 3-40: Benchmarking Pollution Load (Kg/BDMT) of Large Scale Indian Paper Mills
BOD COD TSS AOX
Avg Indian mills 3.3 30.0 8.9 0.9
Best Indian paper
mills
0.4 6.7 0.6 0.2
Table 3-41: Best Practice in Water Pollution Load of European Mills for Soft Wood Mills
BOD load
(Kg/ BDMT)
COD load
(Kg/ BDMT)
TSS Load
(Kg/ BDMT)
AOX Load
(Kg/ BDMT)
Chemi-mech
pulp process
0.70 11.50 0.70 0.01
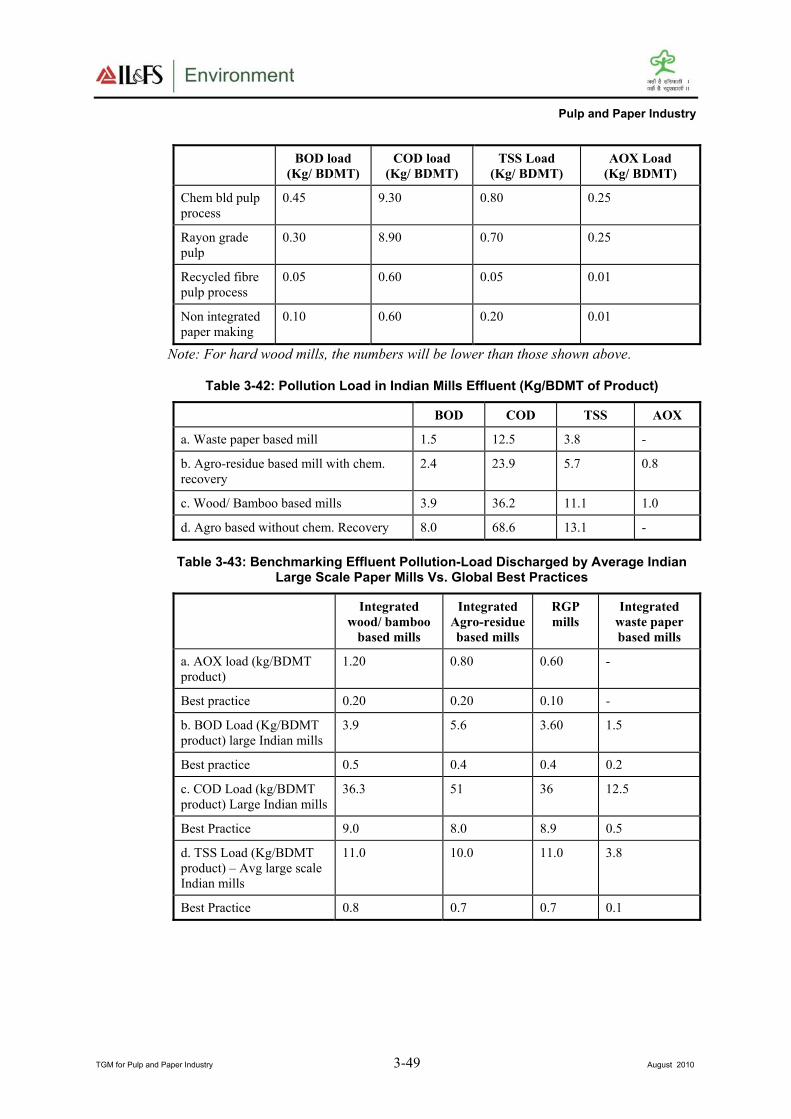
Pulp and Paper Industry
TGM for Pulp and Paper Industry 3-49 August 2010
BOD load
(Kg/ BDMT)
COD load
(Kg/ BDMT)
TSS Load
(Kg/ BDMT)
AOX Load
(Kg/ BDMT)
Chem bld pulp
process
0.45 9.30 0.80 0.25
Rayon grade
pulp
0.30 8.90 0.70 0.25
Recycled fibre
pulp process
0.05 0.60 0.05 0.01
Non integrated
paper making
0.10 0.60 0.20 0.01
Note: For hard wood mills, the numbers will be lower than those shown above.
Table 3-42: Pollution Load in Indian Mills Effluent (Kg/BDMT of Product)
BOD COD TSS AOX
a. Waste paper based mill 1.5 12.5 3.8 -
b. Agro-residue based mill with chem.
recovery
2.4 23.9 5.7 0.8
c. Wood/ Bamboo based mills 3.9 36.2 11.1 1.0
d. Agro based without chem. Recovery 8.0 68.6 13.1 -
Table 3-43: Benchmarking Effluent Pollution-Load Discharged by Average Indian Large Scale Paper Mills Vs. Global Best Practices
Integrated
wood/ bamboo
based mills
Integrated
Agro-residue
based mills
RGP
mills
Integrated
waste paper
based mills
a. AOX load (kg/BDMT
product)
1.20 0.80 0.60 -
Best practice 0.20 0.20 0.10 -
b. BOD Load (Kg/BDMT
product) large Indian mills
3.9 5.6 3.60 1.5
Best practice 0.5 0.4 0.4 0.2
c. COD Load (kg/BDMT
product) Large Indian mills
36.3 51 36 12.5
Best Practice 9.0 8.0 8.9 0.5
d. TSS Load (Kg/BDMT
product) – Avg large scale
Indian mills
11.0 10.0 11.0 3.8
Best Practice 0.8 0.7 0.7 0.1

Pulp and Paper Industry
TGM for Pulp and Paper Industry 3-50 August 2010
Table 3-44: Benchmarking Air Emissions by Indian Mills
Large
Indian
mills
Lowest emitting
Indian mills
Avg Swedish
mills
Avg
European
mills
a. Specific H2S
emissions from the
recovery section
(kg/BDMT
product)
0.086 0.017 0.05 -
b. Specific SO2
emissions
(kg/BDMT
product)
4.1 0.2 1.23 0.6
Integrated Least
emitting
Indian
mills
All
large
scale
mills
avg
Avg
Europ
ean
mills Wood/
Bambo
o
Agro residues Waste
paper
c. Specific
particulate
emissions
(kg/BDMT
product)
4.2 2.3 6.0 1.1 40 -
d. Specific Co2
emissions (tons/
BDMT product)
3.6 2.9 2.5 - 2.9 0.30
Table 3-45: Solid Waste Generation & their Utilization in Indian Pulp & Paper Industry
Wood//
Bamboo
based
mills
Agro-
residue
based
mills
Waste
paper
based
mills
All large
sale
Indian
mills
India’s
best
mills
Global
best
practice
a. Raw material wastes of total
raw material consumed (%)
6 27 22.5 12.3
b. Raw material wastes used of
total raw water consumed (%)
4.1 9.7 1.1 4.3
c. Raw material wastes land filled
of total raw material consumed
(%)
2.1 17.3 21.4 8.0
d. Specific lime sludge generation
(Kg/tonne paper)
- - - 425 25 10
e. Specific Fly ask generation
(Kg/tonne paper)
- - - 470 170 -
f. Specific solid waste generated
(Ton/ Ton product)
1.25 1.6 1.0 1.2 - -
g. Total solid wastes utilized
internally (%)
8 12 7 9.5 50
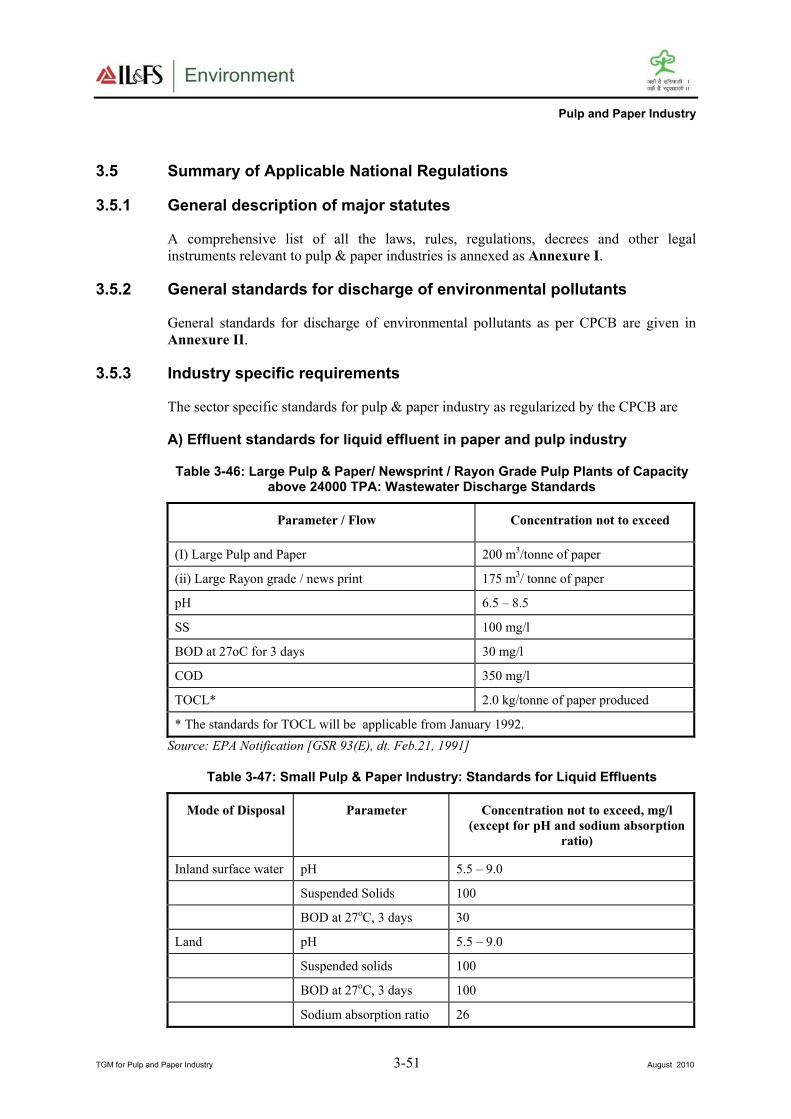
Pulp and Paper Industry
TGM for Pulp and Paper Industry 3-51 August 2010
3.5 Summary of Applicable National Regulations
3.5.1 General description of major statutes
A comprehensive list of all the laws, rules, regulations, decrees and other legal
instruments relevant to pulp & paper industries is annexed as Annexure I.
3.5.2 General standards for discharge of environmental pollutants
General standards for discharge of environmental pollutants as per CPCB are given in
Annexure II.
3.5.3 Industry specific requirements
The sector specific standards for pulp & paper industry as regularized by the CPCB are
A) Effluent standards for liquid effluent in paper and pulp industry
Table 3-46: Large Pulp & Paper/ Newsprint / Rayon Grade Pulp Plants of Capacity above 24000 TPA: Wastewater Discharge Standards
Parameter / Flow Concentration not to exceed
(I) Large Pulp and Paper 200 m3/tonne of paper
(ii) Large Rayon grade / news print 175 m3/ tonne of paper
pH 6.5 – 8.5
SS 100 mg/l
BOD at 27oC for 3 days 30 mg/l
COD 350 mg/l
TOCL* 2.0 kg/tonne of paper produced
* The standards for TOCL will be applicable from January 1992.
Source: EPA Notification [GSR 93(E), dt. Feb.21, 1991]
Table 3-47: Small Pulp & Paper Industry: Standards for Liquid Effluents
Mode of Disposal Parameter Concentration not to exceed, mg/l
(except for pH and sodium absorption
ratio)
Inland surface water pH 5.5 – 9.0
Suspended Solids 100
BOD at 27oC, 3 days 30
Land pH 5.5 – 9.0
Suspended solids 100
BOD at 27oC, 3 days 100
Sodium absorption ratio 26
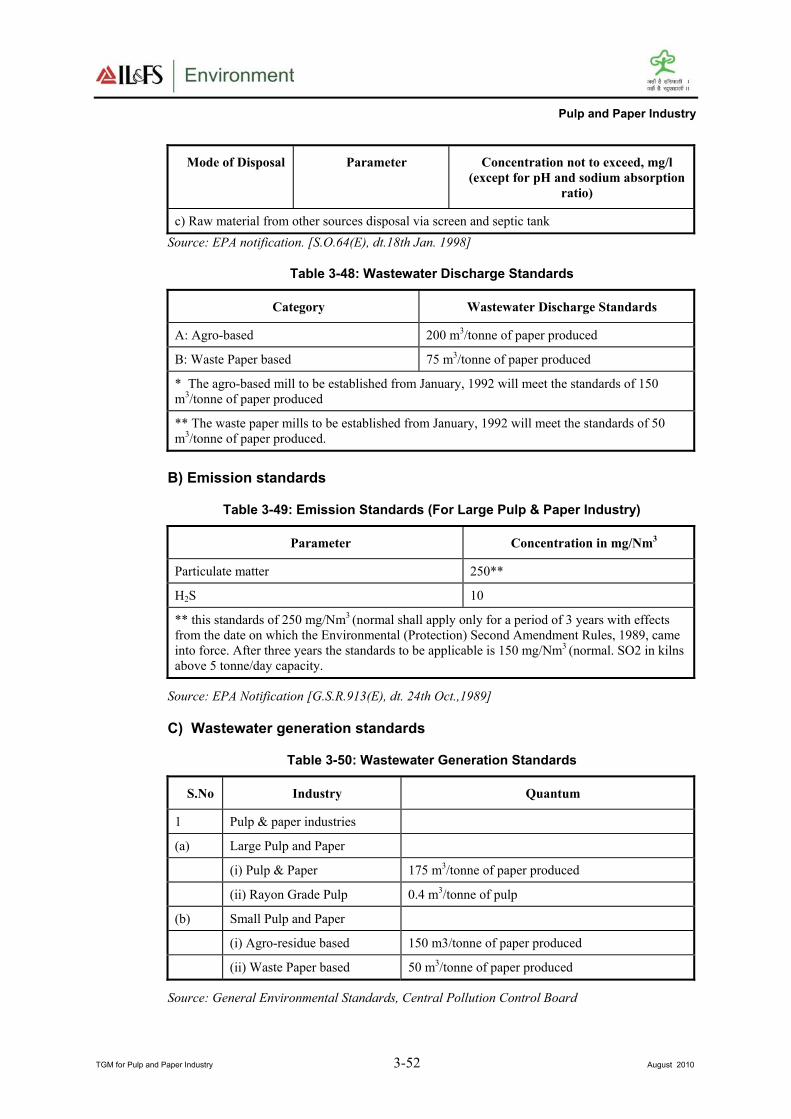
Pulp and Paper Industry
TGM for Pulp and Paper Industry 3-52 August 2010
Mode of Disposal Parameter Concentration not to exceed, mg/l
(except for pH and sodium absorption
ratio)
c) Raw material from other sources disposal via screen and septic tank
Source: EPA notification. [S.O.64(E), dt.18th Jan. 1998]
Table 3-48: Wastewater Discharge Standards
Category Wastewater Discharge Standards
A: Agro-based 200 m3/tonne of paper produced
B: Waste Paper based 75 m3/tonne of paper produced
* The agro-based mill to be established from January, 1992 will meet the standards of 150
m3/tonne of paper produced
** The waste paper mills to be established from January, 1992 will meet the standards of 50
m3/tonne of paper produced.
B) Emission standards
Table 3-49: Emission Standards (For Large Pulp & Paper Industry)
Parameter Concentration in mg/Nm3
Particulate matter 250**
H2S 10
** this standards of 250 mg/Nm3 (normal shall apply only for a period of 3 years with effects
from the date on which the Environmental (Protection) Second Amendment Rules, 1989, came
into force. After three years the standards to be applicable is 150 mg/Nm3 (normal. SO2 in kilns
above 5 tonne/day capacity.
Source: EPA Notification [G.S.R.913(E), dt. 24th Oct.,1989]
C) Wastewater generation standards
Table 3-50: Wastewater Generation Standards
S.No Industry Quantum
1 Pulp & paper industries
(a) Large Pulp and Paper
(i) Pulp & Paper 175 m3/tonne of paper produced
(ii) Rayon Grade Pulp 0.4 m3/tonne of pulp
(b) Small Pulp and Paper
(i) Agro-residue based 150 m3/tonne of paper produced
(ii) Waste Paper based 50 m3/tonne of paper produced
Source: General Environmental Standards, Central Pollution Control Board

Pulp and Paper Industry
TGM for Pulp and Paper Industry 3-53 August 2010
D) Load based Standards
Large Pulp and Paper, Newsprint / Rayon grade plants of capacity above 24,000 TPA
Table 3-51: Load Based Standards
Parameter Quantum
Total Organic Chloride (TOCl) 2 kg/tonne of product
Source: General Environmental Standards, Central Pollution Control Board
3.5.4 Pending & proposed regulatory requirements
Following are the CREP agreed action points which needs to be implemented.
Large Pulp and Paper
Discharge of AOX <1.0 kg/tonne of paper
Installation of lime kiln
Wastewater discharge <100 m3/tonne of paper
Odour control by burning the reduced sulphur emissions in the boiler/lime-kiln
Utilization of treated effluent for irrigation wherever possible
Colour removal be insisted only for mills discharging effluent into surface water
Small Pulp and Paper
Installation of chemical recovery plant for bleached grade of paper for compliance of
standard of BOD, COD & AOx
ETPs to be upgraded so as to meet discharge standards
Mills to shift to brown stock washer for water conservation
Utilization of treated effluent for irrigation wherever possible
Colour removal be insisted only for mills discharging into surface water

TGM for Pulp and Paper Industry 4-1 August 2010
4. OPERATIONAL ASPECTS OF EIA
Prior environmental clearance process has been revised in the Notification issued on 14th
September, 2006, into following four major stages i.e., screening, scoping, public
consultation and appraisal. Each stage has certain procedures to be followed. This
section deals with all the procedural and technical guidance, for conducting objective-
oriented EIA studies, their review and decision-making. Besides, the Notification also
classifies projects into Category A, which requires prior environmental clearance from
MoEF and Category B from SEIAA/UTEIAA.
Consistency with other requirements
Clearance from other regulatory bodies is not a pre-requisite for obtaining the prior
environmental clearance and all such clearances will be treated as parallel statutory
requirements.
Consent for Establishment (CFE) and Prior Environmental Clearance are two
different legal requirements a project proponent should acquire. Therefore, these two
activities can be initiated and proceeded with simultaneously.
If a project falls with in the purview of CRZ and EIA Notifications, then the project
proponent is required to take separate clearances from the concerned Authorities.
Rehabilitation and Resettlement (R&R) issues need not be dealt under the EIA
Notification as other statutory bodies deal with these issues. However, socio-
economic studies may be considered while taking environmental decisions.
4.1 Coverage of Pulp & Paper Industry under the Purview of Notification
All new Pulp & Paper industry excluding manufacturing of paper from waste paper and
manufacture of paper from ready pulp with out bleaching and/or deinking, including
expansion and modernization require prior environmental clearance. Based on pollution
potential, these projects are classified in to Category A and Category B i.e.
Category A: Pulp manufacturing and Pulp & Paper manufacturing industry
Category B: Paper manufacturing industry without Pulp manufacturing
Besides there are general conditions, when it applies, a Category B project will be treated
as Category A project. These conditions are discussed in subsequent sections.
The sequence of steps in the process of prior environmental clearance for Category A
projects and the Category B projects are shown in Figure 4.1 and Figure 4.2 respectively.
The time lines indicated against each stage are the maximum permissible time lines set in
the Notification for said task. In case the said task is not cleared/objected by the
concerned Authority, within the specified time, said task is deemed to be cleared, in
accordance tot eh proposal submitted by the proponent. Each stage in the process of prior
environmental clearance for the Pulp & Paper industries is discussed in subsequent
sections.

Operational Aspects of EIA
TGM for Pulp and Paper Industry 4-2 August 2010
In case of Expansion or Modernization of the developmental Activity:
Any developmental activity, which has an EIA clearance (existing plant), when
undergoes expansion or modernization (change in process or technology) with
increase in production capacity or any change in product mix beyond the list of
products cleared in the issued clearance is required to submit new application for EIA
clearance.
Any developmental activity, which is listed in Schedule of the EIA Notification and
due to expansion of its total capacity, if falls under the purview of either Category B
or Category A, then such developmental activity requires clearance from respective
Authorities.
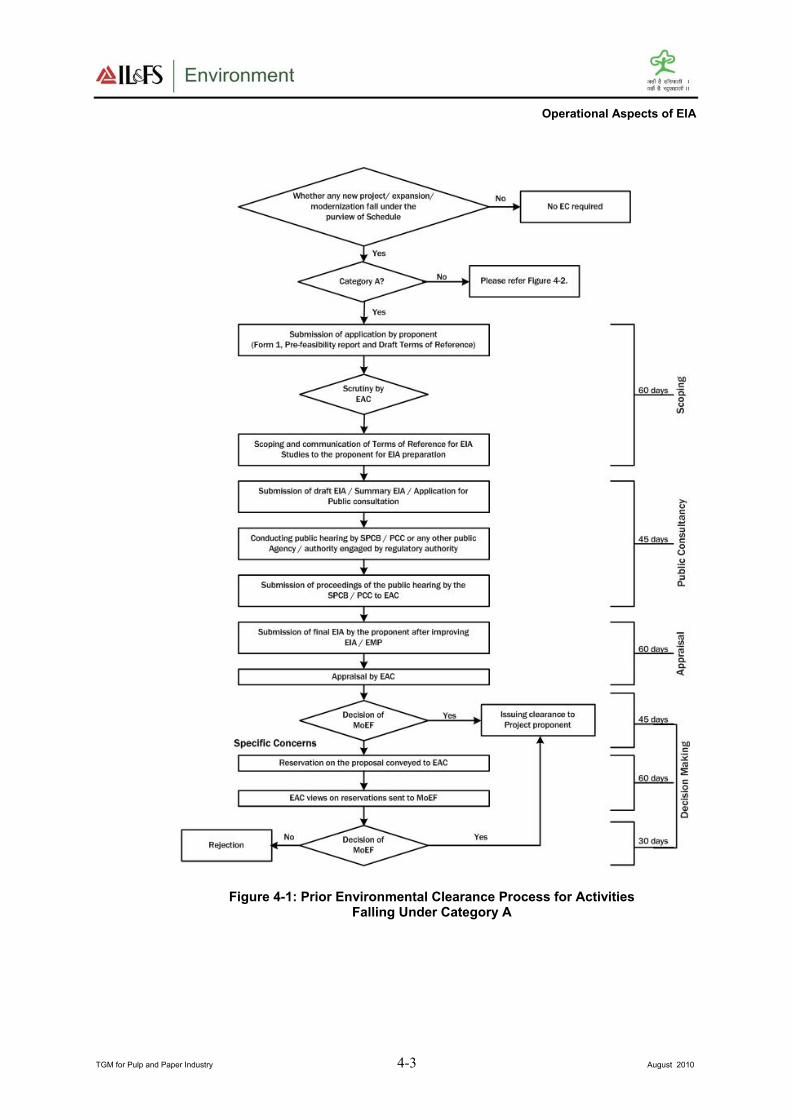
Operational Aspects of EIA
TGM for Pulp and Paper Industry 4-3 August 2010
Figure 4-1: Prior Environmental Clearance Process for Activities Falling Under Category A
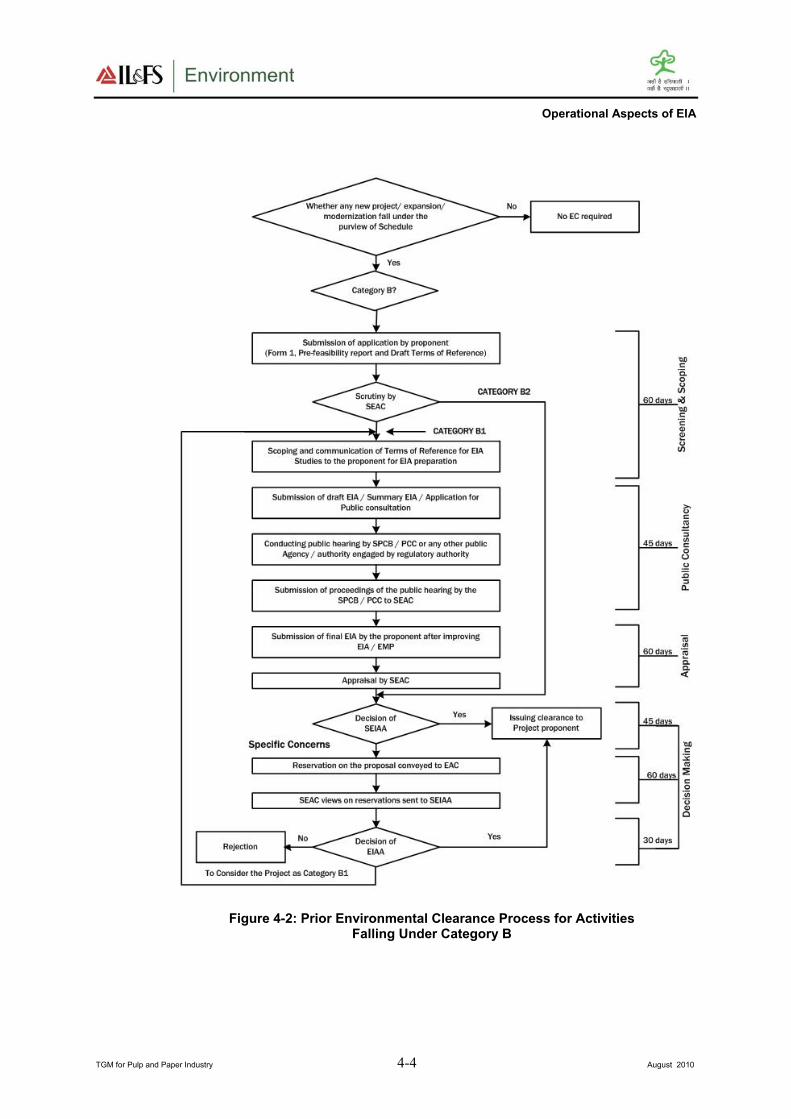
Operational Aspects of EIA
TGM for Pulp and Paper Industry 4-4 August 2010
Figure 4-2: Prior Environmental Clearance Process for Activities Falling Under Category B

Operational Aspects of EIA
TGM for Pulp and Paper Industry 4-5 August 2010
4.2 Screening
Screening of the project shall be performed at the initial stage of the project development
so that proponents are aware of their obligations before deciding on the budget, project
design and execution plan.
This stage is applicable only for Category ‘B’ developmental activity i.e. if general
conditions are applicable for a Category B project, then it will be treated as Category A
project. Besides, screening also refers to the classification of Category B projects into
either Category B1 or Category B2. Category B1 projects require to follow all stages
applicable for a Category A project, but are processed at the SEIAA/UTEIAA. Category
B2 projects, on the other hand, do not require either EIA or public consultation.
As per the Notification, classification of the Category B projects falls under the purview
of the SEAC. This manual provides certain guidelines to the stakeholders for
classification of Category B1 and Category B2.
4.2.1 Applicable conditions for Category B projects
Generic condition:
Any Paper manufacturing industry without pulp manufacturing (usually falling under
Category B) will be treated as Category A, if located in whole or in part within 10 km
from the boundary of:
− Protected areas notified under the Wild Life (Protection) Act, 1972,
− Critically polluted areas as notified by the CPCB from time to time
− Eco-sensitive areas notified under section 3 of the E(P) Act, 1986, such as
Mahabaleshwar Panchgani, Matheran, Panchmarhi, Dahanu, Doon valley and
− Inter-State boundaries and international boundaries - provided that the
requirement regarding distance of 10 km of the inter-state boundaries can be
reduced or completely done away with by an agreement between the respective
States/UTs sharing the common boundary in case the activity does not fall within
10 km of the areas mentioned above.
If any of the conditions listed in above general condition applies, then a Category B
project will be treated as Category A.
The SEIAA shall base its decision on the recommendations of a State/UT level EAC
for the purpose of prior environmental clearance.
In absence of a duly constituted SEIAA or SEAC, a Category B project shall be
appraised at the Central level i.e. at the MoEF.
The EAC at the State/UT level shall screen the projects or activities in Category B.
SEAC shall meet at least once every month.
If any Category B Paper manufacturing industry without pulp manufacturing
industry, after proposed expansion of capacity/production or raw material change,
falls under the purview of Category A in terms of production capacity, then clearance
is required from the Central Government.
4.2.2 Criteria for classification of Category B1 and B2 projects
The classification of Category B projects or activities into B1 or B2 (except the project or
activities listed in item 8(b) in the schedule to the EIA Notification, 2006) will be
Operational Aspects of EIA
TGM for Pulp and Paper Industry 4-6 August 2010
determined based on whether or not the project or activity requires further environmental
studies for preparation of an EIA for its appraisal prior to the grant of environmental
clearance. The necessity of which will be decided, depending upon the nature and
location specificity of the project, by SEAC after scrutiny of the applications seeking
environmental clearance for Category B projects or activities.
The projects requiring an EIA report shall be included in Category B1 and remaining
projects will fall under Category B2 and will not require an EIA report and public
consultation.
Situations which could be considered for Category B2 are:
The mills that do not involve in bleaching and/or deinking and consume water less
than 10 m3/tonne of paper produced.
4.2.3 Application for prior environmental clearance
The project proponent, after identifying the site and carrying out a pre-feasibility
study, is required to apply for the prior environmental clearance using Form 1 given
in Annexure III. The proponent has to submit the filled in Form 1 along with the
pre-feasibility report and draft ToR for EIA studies to the concerned Authority i.e.
MoEF, Government of India for Category A projects and the SEIAA in case of
Category B projects. Please refer subsequent sections for the information on how to
fill the Form 1, contents of pre-feasibility report and draft ToR for sector-specific
ToRs.
Prior environmental clearance is required before starting any construction work, or
preparation of land on the identified site/project or activity by the project
management, except for securing the land.
If the application is made for a specific developmental activity, which has an inherent
area development component as a part of its project proposal and the same project
also attracts the construction and area development provisions under 8a and 8b of the
Schedule, then the project will be seen as a developmental activity other than 8a and
8b of the Schedule.
4.2.4 Siting guidelines
These are the guidelines, stake holders may consider while siting the developmental
projects, to minimize the associated possible environmental impacts. In some situations,
adhering to these guidelines is difficult and unwarranted. Therefore, these guidelines may
be kept in the background, as far as possible, while taking the decisions.
Areas preferably be avoided
While siting industries, care should be taken to minimize the adverse impact of the
industries on the immediate neighborhood as well as distant places. Some of the natural
life sustaining systems and some specific landuses are sensitive to industrial impacts
because of the nature and extent of fragility. With a view to protect such sites, the
industries may maintain the following distances, as far as possible, from the specific areas
listed:
Ecologically and/or otherwise sensitive areas: Preferably 5 km; depending on the geo-
climatic conditions the requisite distance may be decided appropriately by the agency.
Coastal Areas: Preferably ½ km away from high tide line (HTL).

Operational Aspects of EIA
TGM for Pulp and Paper Industry 4-7 August 2010
Flood Plain of the Riverine System: Preferably ½ km away from flood plain or
modified flood plain affected by dam in the upstream or flood control systems.
Transport/Communication System: Preferably ½ km away from highway and railway
line.
Major Settlements (3,00,000 population): Distance from major settlements is difficult
to maintain because of urban sprawl. At the time of siting of the industry, if the
notified limit of any major settlement is found to be within 50 km from the project
boundary, the spatial direction of growth of the settlement for at least a decade must
be assessed. Subsequently, the industry may be sited at least 25 km from the
projected growth boundary of the settlement.
Critically polluted areas are identified by MoEF from time-to-time. Current list of
critically polluted areas is given in Annexure IV
Note:
Ecological and/or otherwise sensitive areas include (i) Religious and Historic Places; (ii)
Archaeological Monuments (e.g. identified zone around Taj Mahal); (iii) Scenic Areas; (iv) Hill
Resorts; (v) Beach Resorts; (vi) Health Resorts; (vii) Coastal Areas rich in Corals, Mangroves,
Breeding Grounds of Specific Species; (viii) Estuaries rich in Mangroves, Breeding grounds of
Specific Species; (ix) Gulf Areas; (x) Biosphere Reserves; (xi) National Parks and Sanctuaries;
(xii) Natural lakes, Swamps; (xiii) Seismic Zones; (xiv) Tribal Settlements; (xv) Areas of Scientific
and Geological Interest; (xvi) Defence Installations, specially those of security importance and
sensitive to pollution; (xvii) Border Areas (International) and (xviii) Air Ports.
Pre-requisite: State and Central Governments are required to identify such areas on a priority
basis.
General siting factors
In any particular selected site, the following factors must also be recognized.
No forest land shall be converted into non-forest activity for the sustenance of the
industry (Ref: Forest Conversation Act, 1980).
No prime agricultural land shall be converted into industrial site.
Land acquired shall be sufficiently large to provide space for appropriate green cover
including green belt, around the battery limit of the industry.
Lay out of the industry that may come up in the area must conform to the landscape
of the area without affecting the scenic features of that place.
Associated township of the industry may be created at a space having physiographic
barrier between the industry and the township.
4.3 Scoping for EIA Studies
Scoping exercise is taken up soon after the project contours are defined. The primary
purpose of scoping is to identify the concerns and issues which may affect the project
decisions. Besides, scoping defines the requirements and boundaries of an EIA study.
Scoping refers to the process by which the EAC, in case of Category ‘A’ projects or
activities, and SEAC in case of Category ‘B1’ projects, including applications for
expansion and/or modernization of existing projects, determine ToR for EIA studies

Operational Aspects of EIA
TGM for Pulp and Paper Industry 4-8 August 2010
addressing all relevant environmental concerns for preparation of an EIA Report for a
particular project.
Project proponent shall submit application to concerned Authority. The application
(Form 1 as given in Annexure III) shall be attached with pre-feasibility report and
proposed ToR for EIA Studies. The proposed sequence to arrive at the draft ToR is
discussed below:
– Pre-feasibility report summarizes the project details and also the likely
environmental concerns based on secondary information, which will be availed
for filling Form 1.
– From pre-feasibility report and Form 1, valued environmental components
(VECs) may be identified for a given project (the receiving environment/social
components, which are likely to get affected due to the project
operations/activities).
– Once the project details from the pre-feasibility report & Form 1; and VECs are
identified, a matrix establishing the interactions which can lead to the
effects/impacts could be developed (Qualitative analysis).
– For each identified possible effect in the matrix, significance analysis could be
conducted to identify the impacts, which needs to be studied further (quantitative
analysis) in the subsequent EIA studies. All such points will find a mention in
the draft ToR to be proposed by the project proponent along with the application
form. The draft ToR shall include applicable baseline parameters (refer annexure
VII) and impact prediction tools (refer annexure IX) proposed to be applied.
– The information to be provided in pre-feasibility report, guidelines for filling
Form 1 and guidelines for developing draft ToR is summarized in the subsequent
sections.
– Authority consults the respective EAC/SEAC to reply to the proponent. The
EAC/SEAC concerned reviews the application form, pre-feasibility report and
proposed draft ToR by the proponent and make necessary additions/deletions to
make it a comprehensive ToR that suits the statutory requirements for conducting
the EIA studies.
The concerned EAC/SEAC may constitute a sub-committee for a site visit, if
considered necessary. The sub-committee will act up on receiving a written approval
from chairperson of the concerned EAC/SEAC. Project proponent shall facilitate
such site visits of the sub-committees
A site visit by sub-committees of EAC/SEAC concerned will be planned, only if
considered necessary by the EAC/SEAC concerned with the written approval of the
chairperson of EAC/SEAC concerned. Project proponent will facilitate such site
visits of the sub-committees.
EAC/SEAC shall provide an opportunity to the project proponent for presentation and
discussions on the proposed project and related issues as well as the proposed ToR for
EIA studies. If the State Government desires to present its views on any specific
project in the scoping stage, it can depute an officer for the same at the scoping stage
to EAC, as an invitee but not as a member of EAC. However, non-appearance of the
project proponent before EAC/SEAC at any stage will not be a ground for rejection of
the application for the prior environmental clearance.

Operational Aspects of EIA
TGM for Pulp and Paper Industry 4-9 August 2010
If a new or expansion project is proposed in a problem area as identified by the
CPCB, then the Ministry may invite a representative of SEIAA to present their views,
if any at the stage of scoping, to the EAC.
The final set of ToR for EIA Studies shall be conveyed to the proponent by the EAC/
SEAC within sixty days of the receipt of Form 1 and pre-feasibility report. If the
finalized ToR for EIA studies is not conveyed to the proponent within sixty days of
the receipt of Form 1, the ToR suggested by the proponent shall be deemed as the
final and will be approved for the EIA studies.
Final ToR for EIA Studies shall be displayed on the websites of the MoEF/SEIAA.
Applications for prior environmental clearance may be rejected by the concerned
Authority based on the recommendations by the concerned EAC or SEAC at the
scoping stage itself. In case of such rejection, the decision together with reasons for
the same shall be communicated to the proponent in writing within sixty days of the
receipt of the application.
The final EIA report and other relevant documents submitted by the applicant shall be
scrutinized by the concerned Authority strictly with reference to the approved ToR
for EIA studies.
4.3.1 Pre-feasibility report
The pre-feasibility report should include, but not limited to highlight the proposed project
information, keeping in view the environmental sensitivities of the selected site, raw
material, technology options and its availability. Information required in pre-feasibility
report varies from case to case even in the same sector depending upon the local
environmental setting within which the plant is located/proposed. However, the
environmental information which may be furnished in the pre-feasibility report may
include as under:
I. Executive summary
II. Project details: Description of the project including in particular;
a description of the main characteristics of the production processes, for instance,
nature and quantity of materials used,
an estimate, by type and quantity, of expected residues and emissions (water, air and
soil pollution, noise, vibration, light, heat, radiation, etc.) resulting from the operation
of the proposed project.
a description of the physical characteristics of the whole project and the land-use
requirements during the construction and operational phases
III. Selection of site based on least possible impacts
An outline of the main alternatives studied by the developer and an indication of the
main reasons for this choice, taking into account the environmental effects.
IV. Anticipated impacts based on project operations on receiving environment
A description of the aspects of the environment likely to be significantly affected by
the proposed project, including, in particular, population, fauna, flora, soil, water, air,
climatic factors, material assets, including the architectural and archaeological
heritage, landscape and the inter-relationship between the above factors.
A description of the likely significant effects of the proposed project on the
environment resulting from:
Operational Aspects of EIA
TGM for Pulp and Paper Industry 4-10 August 2010
− the existence of the project,
− the use of natural resources
− the emission of pollutants, the creation of nuisances and the elimination of waste
− project proponent’s description of the forecasting methods used to assess the
effects on the environment
V. Proposed broad mitigation measures which could effectively be internalized as
project components to have environmental and social acceptance of the proposed
site
A description of key measures envisaged to prevent, reduce and where possible offset
any significant adverse effects on the environment
VI. An indication of any difficulties (technical deficiencies or lack of know-how)
encountered by the developer in compiling the required information
Details of the above listed points which may be covered in pre-feasibility report are listed
in Annexure V.
4.3.2 Guidance for providing information in Form 1
The information given in specifically designed pre-feasibility report for this
developmental activity may also be availed for filling Form 1.
Form 1 is designed to help users identify the likely significant environmental effects of
proposed projects right at the scoping stage. There are two stages for providing
information under two columns:
First - identifying the relevant project activities from the list given in column 2 of
Form 1. Start with the checklist of questions set out below and complete Column 3
by answering:
− Yes - if the activity is likely to occur during implementation of the project
− No - if it is not expected to occur
− May be - if it is uncertain at this stage whether it will occur or not
Second - Each activity for which the answer in Column 3 is “Yes” the next step is to
refer to the fourth column which quantifies the volume of activity which could be
judged as significant impact on the local environmental characteristics, and identify
the areas that could be affected by that activity during construction /operation /
decommissioning of the project. Form 1 requires information within 15 km around
the project, whereas actual study area for EIA studies will be as prescribed by
respective EAC/SEAC. Project proponent will need information about the
surrounding VECs in order to complete this Form 1.
4.3.3 Identification of appropriate valued environmental components
VECs are components of natural resources and human world that are considered valuable
and are likely to be affected by the project activities. Value may be attributed for
economic, social, environmental, aesthetic or ethical reasons. VECs represent the
investigative focal point for further EIA process. The indirect and/or cumulative effects
can be concerned with indirect, additive or even synergistic effects due to other projects
or activities or even induced developments on the same environmental components as
would be considered direct effects. But such impacts tend to involve larger scale VECs
such as within entire region, river basins or watersheds; and, broad social and economic

Operational Aspects of EIA
TGM for Pulp and Paper Industry 4-11 August 2010
VECs such as quality of life and the provincial economy. Once VECs are identified then
appropriate indicators are selected for impact assessments on the respective VECs.
4.3.4 Methods for identification of impacts
There are various factors which influence the approach adopted for the assessment of
direct, indirect, cumulative impacts, etc. for a particular project. The method should be
practical and suitable for the project given the data, time and financial resources available.
However, the method adopted should be able to provide a meaningful conclusion from
which it would be possible to develop, where necessary, mitigation measures and
monitoring. Key points to consider when choosing the method(s) include:
Nature of the impact(s)
Availability and quality of data
Availability of resources (time, finance and staff)
The method chosen should not be complex, but should aim at presenting the results in a
way that can be easily understood by the developer, decision maker and the public. A
comparative analysis of major impact identification methods is given in the following
table:
Table 4-1: Advantages and Disadvantages of Impact Identification Methods
Description Advantages Disadvantages
Checklists Annotate the
environmental features that
need to be addressed when
identifying the impacts of
activities in the project
Simple to
understand and
use
Good for site
selection and
priority setting
Simple ranking
and weighting
Do not distinguish
between direct and
indirect impacts
Do not link action
and impact
The process of
incorporating values
can be controversial Matrices Identify the interaction
between project activities
(along one axis) and
environmental
characteristics (along other
axis) using a grid like table
Entries are made in the
cells which highlights
impact severity in the form
of symbols or numbers or
descriptive comments
Link action to
impact
Good method
for displaying
EIA results
Difficult to
distinguish direct
and indirect impacts
Significant potential
for double-counting
of impacts
Networks Illustrate cause effect
relationship of project
activities and
environmental
characteristics
Useful in identifying
secondary impacts
Useful for establishing
impact hypothesis and
other structured science
Link action to
impact
Useful in
simplified form
for checking for
second order
impacts
Handles direct
and indirect
impacts
Can become very
complex if used
beyond simplified
version
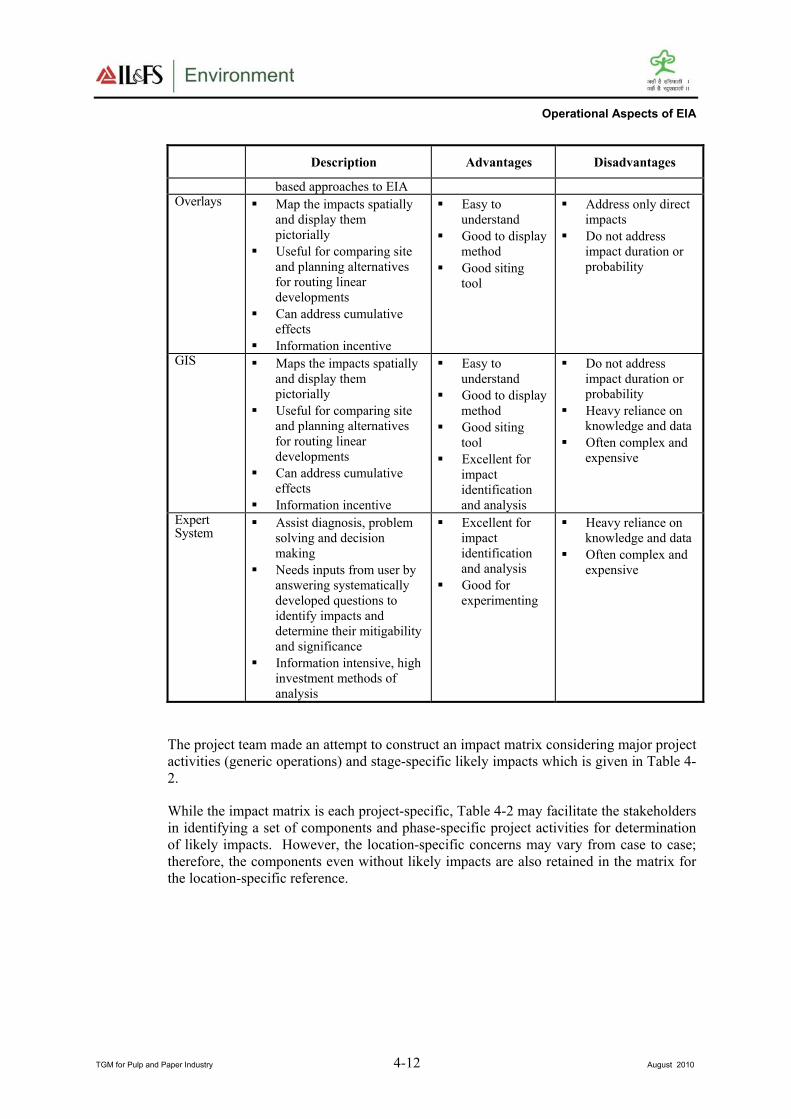
Operational Aspects of EIA
TGM for Pulp and Paper Industry 4-12 August 2010
Description Advantages Disadvantages
based approaches to EIA Overlays Map the impacts spatially
and display them
pictorially
Useful for comparing site
and planning alternatives
for routing linear
developments
Can address cumulative
effects
Information incentive
Easy to
understand
Good to display
method
Good siting
tool
Address only direct
impacts
Do not address
impact duration or
probability
GIS Maps the impacts spatially
and display them
pictorially
Useful for comparing site
and planning alternatives
for routing linear
developments
Can address cumulative
effects
Information incentive
Easy to
understand
Good to display
method
Good siting
tool
Excellent for
impact
identification
and analysis
Do not address
impact duration or
probability
Heavy reliance on
knowledge and data
Often complex and
expensive
Expert System
Assist diagnosis, problem
solving and decision
making
Needs inputs from user by
answering systematically
developed questions to
identify impacts and
determine their mitigability
and significance
Information intensive, high
investment methods of
analysis
Excellent for
impact
identification
and analysis
Good for
experimenting
Heavy reliance on
knowledge and data
Often complex and
expensive
The project team made an attempt to construct an impact matrix considering major project
activities (generic operations) and stage-specific likely impacts which is given in Table 4-
2.
While the impact matrix is each project-specific, Table 4-2 may facilitate the stakeholders
in identifying a set of components and phase-specific project activities for determination
of likely impacts. However, the location-specific concerns may vary from case to case;
therefore, the components even without likely impacts are also retained in the matrix for
the location-specific reference.

Operational Aspects of an EIA
4-13
Table 4-2: Impact Matrix
PHASE I PHASE II PHASE III
Pre -Construction Construction/ Installation Operation and Maintenance
1 2 3 4 5 6 7 8 9 10 11 12 13 14 15 16 17 18 19 20 21
EN
VIR
ON
ME
NT
Component
D
etail
ed t
op
ogra
ph
ic s
urv
ey
La
nd
acq
uis
itio
n
Sit
e cl
eari
ng
Bu
rnin
g o
f w
ast
es, re
fuse
an
d
clea
red
veg
etati
on
Sit
e p
rep
ara
tio
n /
ch
an
ge
in
top
og
rap
hy
Civ
il w
ork
s su
ch a
s ea
rth
mov
ing a
nd
bu
ild
ing
of
Hea
vy e
qu
ipm
ent
op
erati
on
s
Dis
posa
l o
f co
nst
ruct
ion
wast
es
Gen
erati
on
of
sew
age
Infl
ux o
f co
nst
ruct
ion
work
ers
Def
ore
stati
on
Tra
nsp
ort
ati
on
of
ma
teri
al
Inst
all
ati
on
of
equ
ipm
ent
Raw
mate
ria
l T
ran
spo
rtati
on
,
sto
rag
e, p
ilin
g a
nd
ha
nd
lin
g
Pre
pa
rati
on
of
raw
ma
teri
al
(Wo
od
, V
irg
in F
ibre
)
Pu
lpin
g,
Ble
ach
ing
, C
hem
ica
l
Rec
ov
ery
, C
oa
tin
g,
Pk
i
Pu
lpin
g, ev
ap
ora
tion
hea
t
gen
era
tio
n b
y p
rod
uct
s,
chem
ical
reco
ver
y,
coars
e
scre
enin
g, w
ash
ing a
nd
fin
e
scre
enin
g,
thic
ken
ing,
bl
hi
ld
Sto
ck p
rep
ara
tio
n,
pa
per
ma
chin
e, f
inis
hin
g a
nd
ti
Wast
e m
an
agem
ent
(slu
dge
fro
m w
ate
r tr
eatm
ent
pla
nts
,
cooli
ng t
ow
er,
boil
er,
ET
P e
tc.
Ph
ysi
cal
Soil Erosion Risks * * *
Contamination * * * * * *
Soil Quality * * * * * * *
Resources Fuels/ Electricity * *
Raw materials * *
Land especially
undeveloped or
agricultural land
* * * *
Water *
Water Interpretation or
Alteration of River
Beds
* *
Project
Activities
Parameter/
Factor
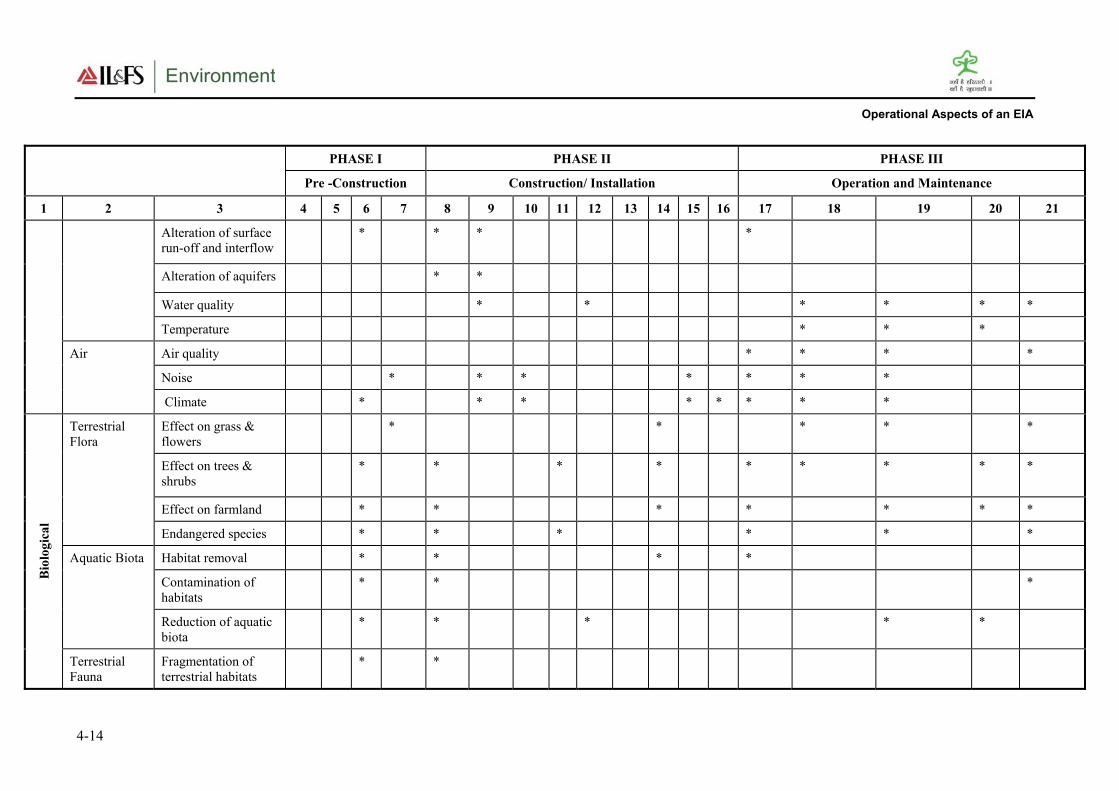
Operational Aspects of an EIA
4-14
PHASE I PHASE II PHASE III
Pre -Construction Construction/ Installation Operation and Maintenance
1 2 3 4 5 6 7 8 9 10 11 12 13 14 15 16 17 18 19 20 21
Alteration of surface
run-off and interflow
* * * *
Alteration of aquifers * *
Water quality * * * * * *
Temperature * * *
Air Air quality * * * *
Noise * * * * * * *
Climate * * * * * * * *
Bio
log
ica
l
Terrestrial
Flora
Effect on grass &
flowers
* * * * *
Effect on trees &
shrubs
* * * * *
* * * *
Effect on farmland * * * * * * *
Endangered species * * * * * *
Aquatic Biota Habitat removal * * * *
Contamination of
habitats
* * *
Reduction of aquatic
biota
* * * * *
Terrestrial
Fauna
Fragmentation of
terrestrial habitats
* *

Operational Aspects of an EIA
4-15
PHASE I PHASE II PHASE III
Pre -Construction Construction/ Installation Operation and Maintenance
1 2 3 4 5 6 7 8 9 10 11 12 13 14 15 16 17 18 19 20 21
Disturbance of
habitats by noise or
vibration
* * * * *
Reduction of
Biodiversity
* * *
* *
So
cia
l
Economy Creation of new
economic activities
* * * * *
Commercial value of
properties
* * * * * *
Conflict due to
negotiation and/
compensation
payments
* *
* * * *
Generation of
temporary and
permanent jobs
* * * * * *
Effect on crops * * * * * * * *
Reduction of
farmland productivity
* * * *
Income for the state
and private sector
*
Savings in foreign
currency for the state
Education Training in new * * * * * *
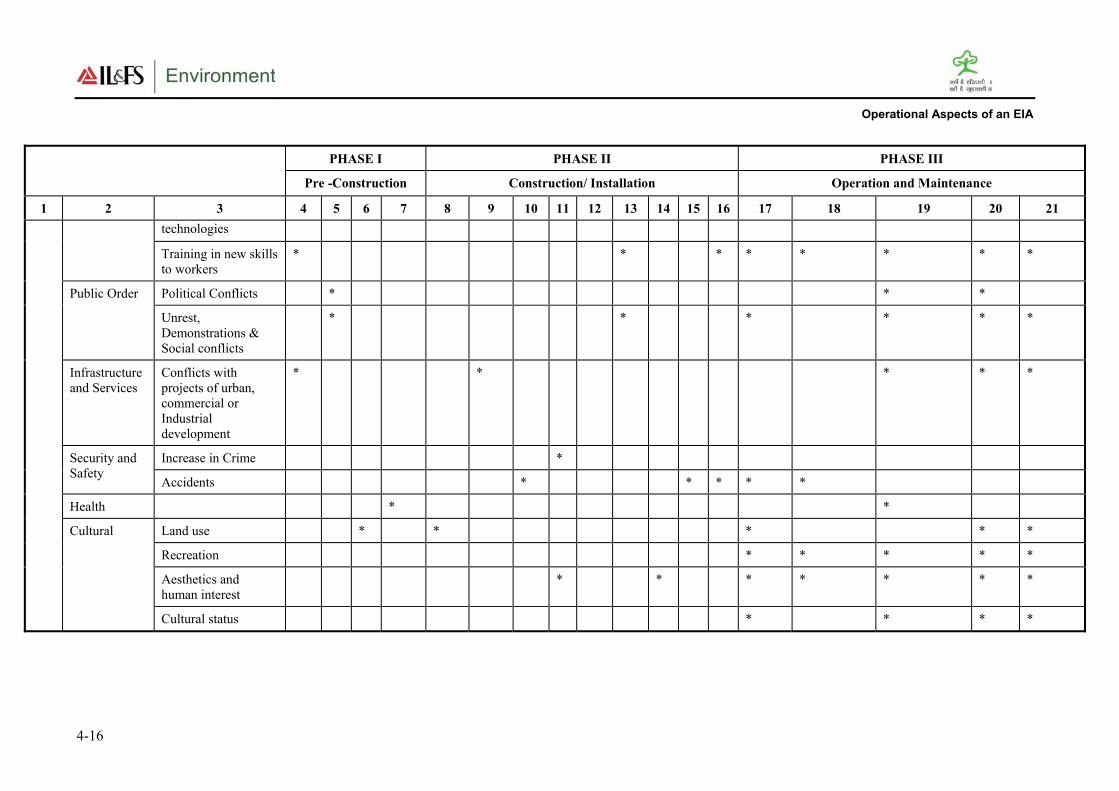
Operational Aspects of an EIA
4-16
PHASE I PHASE II PHASE III
Pre -Construction Construction/ Installation Operation and Maintenance
1 2 3 4 5 6 7 8 9 10 11 12 13 14 15 16 17 18 19 20 21
technologies
Training in new skills
to workers
* * * * * * * *
Public Order Political Conflicts * * *
Unrest,
Demonstrations &
Social conflicts
* * * * * *
Infrastructure
and Services
Conflicts with
projects of urban,
commercial or
Industrial
development
* * * * *
Security and
Safety
Increase in Crime *
Accidents * * * * *
Health * *
Cultural Land use * * * * *
Recreation * * * * *
Aesthetics and
human interest
* * * * * * *
Cultural status * * * *

Operational Aspects of an EIA
TGM for Pulp and Paper Industry 4-17 August 2010
Note:
1. The above table represents a model for likely impacts, which will have to be arrived case-to-
case basis considering VECs and significance analysis (Ref Section 2.9).
2. Project activities are shown as indicative. However, in Form 1 (application for EIA Clearance),
for any question for which answer is ‘Yes’, then the corresponding activity shall reflect in project
activities. Similarly ‘parameters’/’factors’ will also be changed within a component in order to
reflect the target species of prime concern in the receiving local environment.
4.3.5 Testing the Significance of Impacts
The following set of conditions may be used as the checklist for testing the significance of
the impacts and also to provide information in Column IV of Form 1.
Will there be a large change in environmental conditions?
Will new features be out-of-scale with the existing environment?
Will the effect be unusual in the area or particularly complex?
Will the effect extend over a large area?
Will there be any potential for trans-frontier impact?
Will many people be affected?
Will many receptors of other types (fauna and flora, businesses, facilities) be
affected?
Will valuable or scarce features or resources be affected?
Is there a risk that environmental standards will be breached?
Is there a risk that protected sites, areas, and features will be affected?
Is there a high probability of the effect occurring?
Will the effect continue for a long time?
Will the effect be permanent rather than temporary?
Will the impact be continuous rather than intermittent?
If it is intermittent will it be frequent rather than rare?
Will the impact be irreversible?
Will it be difficult to avoid, or reduce or repair or compensate for the effect?
For each “Yes” answer in column 3, the nature of effects and reasons for it should be
recorded in the column 4. The questions are designed so that a “Yes” answer in column 3,
will generally point towards the need for analyzing for the significance and requirement
for conducting impact assessment for the effect.
4.3.6 Terms of reference for EIA studies
ToR for EIA studies in respect of the proposed pulp & paper industry may include, but
not limited to the following:
1. Executive summary of the project – giving a prima facie idea of the objectives of the
proposal, use of resources, justification, etc. In addition, it should provide a
compilation of EIA report, including EMP and the post-project monitoring plan in
brief.
Project Description
2. Justification for selecting the proposed unit size.
3. Land requirement for the project including its break up for various purposes, its
availability and optimization.

Operational Aspects of EIA
TGM for Pulp and Paper Industry 4-18 August 2010
4. Details on integrated (pulp & paper manufacturing within the same site) and non-
integrated (manufacturing only pulp) facilities in the site.
5. Details of proposed layout clearly demarcating all the proposed units within the
facility.
6. Sources of raw material (wood, energy, steam, water, agro-residue, wastepaper,
chemicals, auxiliary materials, etc.) used in the manufacturing process, availability of
compatible land and water resources in the region to support the proposed capacity of
the plant and future expansions. Strategies for sustainable supply of raw material
7. Source of water, total requirement and authorization from the concerned department.
Details of water consumption per Ton of paper.
8. Details on water balance cycle including quantity of effluent generated, recycled and
reused and discharged in receiving body which has adequate assimilative capacity
and efforts to maintain quality of receiving water body and to minimize effluent
discharge. Additional water conservation measures, if any, proposed for the project.
9. Details on selection of type of manufacturing process (wood, agro-residue, waste
paper) based on raw materials and end products use.
10. Complete process flow diagram describing each unit, its processes and operations,
along with material and energy inputs and outputs (material and energy balance).
Raw material preparation
Pulping
Bleaching
- Bleaching sequences
- Sources of bleaching chemicals
- Characteristics of bleaching plant effluent
- Bleach plant filtrate closure
- Details on black liquor handling
- Details of oxygen delignification
Chemical recovery (compulsory)
- Recovery efficiency make up salt cake
- Closure of lime cycle
- Disposal of lime sludge and solid making
- Fibre recovery in peb mechanized waste paper processing
- Management of de-inking sludge
Stock preparation and paper making
- Source of raw material
- Initiative to obtain sustainable supply of raw material
Water cycle closure - movement towards zero discharge
Initiative for colour reduction from effluent bleach plant & chemical recovery
Chlorine dioxide generation
Oxygenate generation
11. Details on toxicity in the effluent due to discharge of organo-chloro compounds from
bleaching process of grey pulp
12. Details on proposed waste minimization measures.
Operational Aspects of EIA
TGM for Pulp and Paper Industry 4-19 August 2010
13. Design details of chemical recovery plant for bleached grade of paper for compliance
of standard of BOD, COD & AOx and measures for control of emissions from the
recovery plant.
14. Details on solid waste, particularly lime sludge generated from the causticizing
section of chemical recovery system.
15. Proposed points for odour control (by burning the reduced sulphur emissions in the
boiler/lime-kiln)
16. Examine the feasibility of zero discharge. In case of any proposed discharge, its
quantity, quality and point of discharge, users downstream, etc.
17. Details of the proposed methods of water conservation and recharging.
18. Details regarding infrastructure facilities such as sanitation, fuel storage, restroom,
etc., to the workers during construction and operation phase.
19. Detailed statement on factoring the CREP recommendations (please refer section 3.5)
in the designing of the project.
20. In case of expansion of existing industries, remediation measures adopted to restore
the environmental quality if the groundwater, soil, crop, air, etc., are affected and a
detailed compliance to the prior environmental clearance/consent conditions.
21. Any legal cases pending against the existing plant related to the environmental
pollution and impacts in the last three years.
Description of the Environment
22. The study area shall be up to a distance of 10 km from the boundary of the proposed
project site.
23. Location of the project site, township and nearest villages with distances from the
facility to be demarcated on a toposheet (1: 50000 scale).
24. Topography details of the project area.
25. Landuse based on satellite imagery including location specific sensitivities such as
residential/institutional/commercial, national parks/wildlife sanctuary, villages,
industries, etc. for the study area.
26. Demography details of all the villages falling in the study area.
27. The baseline data to be collected from the study area w.r.t. different components of
environment viz. air, noise, water, land, and biology and socio-economic (please refer
Section 4.4.2 for guidance for assessment of baseline components and identify the
attributes of concern). Actual monitoring of baseline environmental components shall
be strictly according to the parameters prescribed in the ToR after considering the
proposed coverage of parameters by the proponent in draft ToR and shall commence
after finalization of ToR by the competent Authority.
28. Details on surface and ground water quality. Permission for the drawl of ground
water from SGWB/CGWA and irrigation department.
29. Information regarding surface hydrology and water regime and impact due to the
project, if any, on the same.
30. Details on ground water and surface water quality of nearby water sources and other
surface drains. Water quality parameters may include pH, SS, BOD, COD, TOCL,
AOX, TDS, toxicity, etc. (* - as applicable)
Operational Aspects of EIA
TGM for Pulp and Paper Industry 4-20 August 2010
31. Details on existing ambient air quality and expected emissions for Chlorine, SO2*,
NOX*, PM10*, PM2.5*, CO*, odorous compounds* like CH3, SH, CH3, 2S, H2S,
CH3, 2S2, etc., and evaluation of the adequacy of the proposed pollution control
devices to meet standards for point sources and to meet AAQ standards. (* - As
applicable)
32. The air quality contours may be plotted on a location map showing the location of
project site, habitation nearby, sensitive receptors, if any and wind roses.
33. Site-specific micro-meteorological data including mixing height.
34. One season site-specific data excluding monsoon season.
35. Proposed baseline monitoring network for the consideration and approval of the
Competent Authority.
36. Details of flora and fauna.
37. Details of traffic density vis-à-vis impact on the ambient air, wherever applicable.
38. Noise level monitoring data collected from locations from all the four sides
surrounding the project area and also at sensitive receptors. If any incompatible land-
use attributes fall within the study area, proponent shall describe the sensitivity
(distance, area and significance) and propose the additional points based on
significance for review and acceptance by the EAC/SEAC. Incompatible land-use
attributes include:
− Public water supply areas from rivers/surface water bodies, from ground water
− Scenic areas/tourism areas/hill resorts
− Religious places, pilgrim centers that attract over 10 lakh pilgrims a year
− Protected tribal settlements (notified tribal areas where industrial activity is not
permitted)
− CRZ
− Monuments of national significance, World Heritage Sites
− Cyclone, Tsunami prone areas (based on last 25 years);
− Airport areas
− Any other feature as specified by the State or local government and other features
as locally applicable, including prime agricultural lands, pastures, migratory
corridors, etc.
39. If ecologically sensitive attributes fall within the study area, proponent shall describe
the sensitivity (distance, area and significance) and propose the additional points
based on significance for review and acceptance by the EAC/SEAC. A map marking
the location of such areas (existing or proposed) duly authenticated by the Chief
Wildlife Warden. Ecological sensitive attributes include:
− National parks
− Wild life sanctuaries Game reserve
− Tiger reserve/elephant reserve/turtle nesting ground
− Mangrove area
− Wetlands
− Reserved and Protected forests
− Any other closed/protected area under the Wild Life (Protection) Act, 1972,
− Any other eco – sensitivity area etc.,
40. If the location falls in a valley, studies on specific issues connected to the
management of natural resources.

Operational Aspects of EIA
TGM for Pulp and Paper Industry 4-21 August 2010
41. If the location is on Seashore:
− Identification of CRZ area: A CRZ map duly authenticated by one of the
authorized agencies demarcating LTL, HTL, CRZ area, location of the project
and associate facilities w.r.t. CRZ, coastal features such as mangroves, if any.
− Provide the CRZ map in 1:10000 scale in general cases and in 1:5000 scale for
specific observations.
− Proposed site for disposal of dredged material and environmental quality at the
point of disposal/impact areas.
− Environmental parameters – Temperature, sea level pressure, wind speed, mean
relative humidity, visibility, salinity, density, rainfall, fog, frequency and intensity
of cyclones, sediment transport, seismic characteristics, fresh water influx.
− Details on marine biological parameters – microbiological population, pathogenic
bacteria, plankton distribution, fish spawning grounds in the adjoining waters,
commercial fisheries potential, vegetation including inter tidal, flora and fauna in
the marine, benthal quality assessment for biological species and heavy metals
and estuarine environment.
Anticipated Environmental Impacts and Mitigation Measures
42. Anticipated generic environmental impacts due to this project are indicated in Table
4-2, which may be evaluated for significance and based on corresponding likely
impacts VECs may be identified. Baseline studies may be conducted for all the
concerned VECs and likely impacts will have to be assessed for their magnitude in
order to identify mitigation measures (please refer Chapter 4 of the manual for
guidance).
43. Tools as given in Section 4.4.3 may be referred for the appropriate assessment of
environmental impacts and same may be submitted in draft ToR for consideration and
approval by EAC/SEAC.
44. While identifying the likely impacts, also include the following for analysis of
significance and required mitigation measures:
− impacts due to transportation of raw materials and end products on the
surrounding environment
− impacts on surface water, soil and groundwater
− impacts due to air pollution
− impacts due to odour pollution
− impacts due to noise
− impacts due to fugitive emissions
− impact on health of workers due to proposed project activities
45. Proposed odour control measures
46. Action plan for the greenbelt development – species, width of plantations, planning
schedule etc, in accordance to CPCB published guidelines.
47. In case of likely impact from the proposed project on the surrounding reserve forests,
Plan for the conservation of wild fauna in consultation with the State Forest
Department.
48. For identifying the mitigation measures, please refer Chapter III for source control
and treatment. Besides typical mitigation measures which may also be considered are
discussed in Table 4-5.

Operational Aspects of EIA
TGM for Pulp and Paper Industry 4-22 August 2010
Analysis of alternative resources and technologies
49. Details on proposed measures to ensure Compliance to the environmental regulatory
requirements, specifically the lignin handling and colour removal.
50. Details on alternative measures proposed to address the possible fugitive air
emissions and odour from the process operations.
51. Comparison of alternate sites considered and the reasons for selecting the proposed
site. Conformity of the site with the prescribed guidelines in terms of Coastal
Regulatory Zone (CRZ), river, highways, railways etc.
52. Details on improved technologies.
Environmental Monitoring Program
53. Monitoring programme for pollution control at source (in the plant).
54. Monitoring of pollutants at the receiving environment for all the appropriate notified
parameters.
55. Specific programme to monitor safety and health protection of workers.
56. Appropriate monitoring network has to be designed and proposed, to assess the
possible residual impacts.
57. Stack and fugitive emissions may be monitored for SPM, PM10, PM2.5, SO2, NOx,
HC, CO, VOC and evaluation of the adequacy of the proposed pollution control
devices to meet gaseous emissions
58. Monitoring of carbon foot print
59. Details of in-house monitoring capabilities and the recognized agencies if proposed
for conducting monitoring.
Additional Studies
60. Details on risk assessment and damage control during different phases of the project
and proposed safeguard measures.
61. Details on socio-economic development activities such as commercial property
values, generation of jobs, education, social conflicts, cultural status, accidents, etc.
62. Proposed plan to handle the socio-economic influence on the local community. The
plan should include quantitative dimension as far as possible.
63. Impact of the project on local infrastructure of the area such as road network and
whether any additional infrastructure would need to be constructed and the agency
responsible for the same with timeframe.
64. Details on compensation package for the people affected by the project, considering
the socio-economic status of the area, homestead oustees, land oustees, and landless
laborers.
65. Details on plan for corporate social responsibility including the villages, population
spread, SC/ST/backward communities, upgradation of existing schools, establishing
new schools with facilities (such as laboratories, toilets, etc.), link roads, community
halls, primary health facilities, health camps, etc.

Operational Aspects of EIA
TGM for Pulp and Paper Industry 4-23 August 2010
Environmental Management Plan
66. Administrative and technical organizational structure to ensure proposed post-project
monitoring programme for approved mitigation measures.
67. EMP devised to mitigate the adverse impacts of the project should be provided along
with item-wise cost of its implementation (Capital and recurring costs).
68. Allocation of resources and responsibilities for plan implementation.
69. Details of the emergency preparedness plan and on-site and off-site disaster
management plan.
70. Details on compliance to the recommendations mentioned in the CREP guidelines.
Note:
Above points shall be adequately addressed in the EIA report at corresponding chapters, in
addition to the contents given in the reporting structure (Table: 4-6).
4.4 Environmental Impact Assessment
The generic approach for accomplishing EIA studies is shown in Figure 4-3. Each stage is
discussed, in detail in subsequent sections.
Figure 4-3: Approach for EIA Study

Operational Aspects of EIA
TGM for Pulp and Paper Industry 4-24 August 2010
4.4.1 EIA team
The success of a multi-functional activity like an EIA primarily depends on constitution
of a right team at the right time (preferable at the initial stages of an EIA) in order to
assess the significant impacts (direct, indirect as well as cumulative impacts).
The professional Team identified for a specific EIA study should consist of qualified and
experienced professionals from various disciplines in order to address the critical aspects
identified for the specific project. Based on the nature and the environmental setting,
following professionals may be identified for EIA studies:
Environmental management specialist/regulator
Air and noise quality specialist
Water quality specialist
Ecologist
Chemical engineer
Pulp & paper technologist
Safety and health specialist
Social scientist, etc.
4.4.2 Baseline quality of the environment
EIA Notification 2006 specifies that an EIA Report should contain a description of the
existing environment that would be or might be affected directly or indirectly by the
proposed project. Environmental Baseline Monitoring (EBM) is a very important stage of
EIA. On one hand EBM plays a very vital role in EIA and on the other hand it provides
feedback about the actual environmental impacts of a project. EBM, during the
operational phase, helps in judging the success of mitigation measures in protecting the
environment. Mitigation measures, in turn are used to ensure compliance with
environmental standards, and to facilitate the needed project design or operational
changes.
Description of the existing environment should include natural, cultural, socio-economic
systems and their interrelationships. The intention is not to describe all baseline
conditions, but to focus the collection and description of baseline data on those VECs that
are important and are likely to be affected by the proposed industrial activity.
4.4.2.1 Objective of EBM in the EIA context
The term ‘baseline’ refers to conditions existing before development. EBM studies are
carried out to:
identify environmental conditions which might influence project design decisions
(e.g., site layout, structural or operational characteristics);
identify sensitive issues or areas requiring mitigation or compensation;
provide input data to analytical models used for predicting effects;
provide baseline data against which the results of future monitoring programs can be
compared.
At this stage of EIA process, EBM is primarily discussed in the context of first purpose
wherein feedback from EBM programs may be used to:

Operational Aspects of EIA
TGM for Pulp and Paper Industry 4-25 August 2010
determine available assimilative capacity of different environmental components
within the designated impact zone and whether more or less stringent mitigation
measures are needed
improve predictive capability of EIAs
There are many institutional, scientific, quality control, and fiscal issues that must be
addressed in implementation of an environmental monitoring program. Careful
consideration of these issues in the design and planning stages will help avoid many of
the pitfalls associated with environmental monitoring programs. Such major issues are as
under:
4.4.2.2 Environmental monitoring network design
Monitoring refers to the collection of data through a series of repetitive measurements of
environmental parameters (or, more generally, to a process of systematic observation).
Design of the environmental quality monitoring programme depends up on the
monitoring objectives specified for the selected area of interest. Types of monitoring and
network design considerations are discussed in Annexure VI.
4.4.2.3 Baseline data generation
List of important physical environmental components and indicators of EBM are given in
Table 4-3.
Table 4-3: List of Important Physical Environment Components and Indicators of EBM
Environmental Component Environmental Indicators
Climatic variables Rainfall patterns – mean, mode, seasonality
Temperature patterns
Extreme events
Climate change projections
Prevailing wind - direction, speed, anomalies
Relative humidity
Stability conditions and mixing height, etc.
Coastal dynamics and
morphology
Wave patterns
Currents
Shoreline morphology – near shore, foreshore
Sediment – characteristics and transport, etc.
Topography
Slope form
Landform and terrain analysis
Specific landform types, etc.
Drainage Surface hydrology
Natural drainage pattern and network
Rainfall runoff relationships
Hydrogeology
Groundwater characteristics – springs, etc.
Soil Type and characteristics
Porosity and permeability
Sub-soil permeability
Run-off rate
Infiltration capacity
Effective depth (inches/centimeters)

Operational Aspects of EIA
TGM for Pulp and Paper Industry 4-26 August 2010
Environmental Component Environmental Indicators
Inherent fertility
Suitability for method of sewage disposal, etc.
Geology Underlying rock type, texture
Surgical material
Geologic structures (faults, shear zones, etc.)
Geologic resources (minerals, etc.)
Water Raw water availability
Water quality
Surface water (Terrestrial - rivers, lakes, ponds, gullies)
– quality, water depths, flooding areas, etc.
Ground water – water table, local aquifer storage
capacity, specific yeild, specific retention, water level
depths and fluctuations, etc.
Coastal
Floodplains
Wastewater discharges
Thermal discharges
Waste discharges, etc.
Air Ambient
Respirable
Airshed importance
Odour levels, etc.
Noise Identiyfing sources of noise
Noise due to traffic/transportation of vehicles
Noise due to heavy euipment operations
Duration and variations in noise over time, etc.
Biological Species composition of flora and fauna
Flora – type, density, exploitation, etc.
Fauna – distribution, abundance, rarity, migratory,
species diversity, habitat requirements, habitat
resilience, economic significance, comemrcial value, etc.
Species
Habitats
Fisheries – migratory species, species with commercial/
recreational value, etc.
Landuse Landuse pattern, etc.
Guidance for assessment of baseline components and attributes describing sampling
network, sampling frequency, method of measurement is given in Annexure VII.
Infrastructure requirements for EBM
In addition to devising a monitoring network design and monitoring plans/program, it is
also necessary to ensure adequate resources in terms of staffing, skills, equipment,
training, budget, etc., for its implementation. Besides assigning institutional
responsibility, reporting requirements, QA/QC plans and its enforcement capability are
essential. A monitoring program that does not have an infrastructural support and
QA/QC component will have little chance of success.

Operational Aspects of EIA
TGM for Pulp and Paper Industry 4-27 August 2010
Defining data statistics/analyses requirements
The data analyses to be conducted are dictated by the objectives of environmental
monitoring program. Statistical methods used to analyze data should be described in
detail prior to data collection. This is important because repetitive observations are
recorded in time and space. Besides, the statistical methods could also be chosen so that
uncertainty or error estimates in the data can be quantified. For e.g., statistical methods
useful in an environmental monitoring program include: 1) frequency distribution
analysis; 2) analysis of variance; 3) analysis of covariance; 4) cluster analysis; 5) multiple
regression analysis; 6) time series analysis; 7) the application of statistical models.
Use of secondary data
The EBM program for EIA can at best address temporal and/or spatial variations limited
to a limited extent because of cost implications and time limitations. Therefore analysis
of all available information or data is essential to establish the regional profiles. So all the
relevant secondary data available for different environmental components should be
collated and analyzed.
To facilitate stakeholders, IL&FS Ecosmart Ltd., has made an attempt to compile the list
of information required for EIA studies and sources of secondary data, which are given in
Annexure VIIIA and Annexure VIIIB.
4.4.3 Impact prediction tools
The scientific and technical credibility of an EIA relies on the ability of EIA practitioners
to estimate the nature, extent, and magnitude of change in environmental components that
may result from project activities. Information about predicted changes is needed for
assigning impact significance, prescribing mitigation measures, and designing &
developing EMPs and monitoring programs. The more accurate the predictions, the more
confident the EIA practitioner will be in prescribing specific measures to eliminate or
minimize the adverse impacts of development project.
Choice of models/methods for impact predictions in respect to air, noise, water, land,
biological and socio-economic environment are precisely tabulated in Annexure IX.
4.4.4 Significance of the impacts
Evaluating the significance of environmental effects is perhaps the most critical
component of impact analysis. The interpretation of significance bears directly on the
subsequent EIA process and also during environmental clearance on project approvals
and condition setting. At an early stage, it also enters into screening and scoping
decisions on what level of assessment is required and which impacts and issues will be
addressed.
Impact significance is also a key to choosing among alternatives. In total, the attribution
of significance continues throughout the EIA process, from scoping to EIS review, in a
gradually narrowing “cone of resolution” in which one stage sets up the next. But at this
stage it is the most important as better understanding and quantification of impact
significance is required.
One common approach is based on determination of the significance of predicted changes
in the baseline environmental characteristics and compares these w.r.t. regulatory

Operational Aspects of EIA
TGM for Pulp and Paper Industry 4-28 August 2010
standards, objective criteria and similar ‘thresholds’ as eco-sensitivity, cultural /religious
values. Often, these are outlined in guidance. A better test proposed by the CEAA
(1995) is to determine if ‘residual’ environmental effects are adverse, significant, and
likely (given under). But at this stage, the practice of formally evaluating significance of
residual impacts, i.e., after predicting the nature and magnitude of impacts based on
before-versus-after-project comparisons, and identifying measures to mitigate these
effects is not being followed in a systematic way.
i. Step 1: Are the environmental effects adverse?
Criteria for determining if effects are “adverse” include:
effects on biota health
effects on rare or endangered species
reductions in species diversity
habitat loss
transformation of natural landscapes
effects on human health
effects on current use of lands and resources for traditional purposes by aboriginal
persons; and
foreclosure of future resource use or production
ii. Step 2: Are the adverse environmental effects significant?
Criteria for determining ‘significance’ are to judge that the impacts:
are extensive over space or time
are intensive in concentration or proportion to assimilative capacity
exceed environmental standards or thresholds
do not comply with environmental policies, landuse plans, sustainability strategy
adversely and seriously affect ecologically sensitive areas
adversely and seriously affect heritage resources, other landuses, community lifestyle
and/or indigenous peoples traditions and values
iii. Step 3: Are the significant adverse environmental effects likely?
Criteria for determining ‘likelihood’ include:
probability of occurrence, and
scientific uncertainty
4.5 Social Impact Assessment
Social Impact Assessment (SIA) is an instrument used to analyze social issues and solicit
stakeholder views for the design of projects. SIA helps in making the project responsive
to social development concerns, including options that enhance benefits for poor and
vulnerable people while mitigating risk and adverse impacts. It analyzes distributional
impacts of intended project benefits on different stakeholder groups, and identifies
differences in assets and capabilities to access the project benefits.
The scope and depth of SIA should be determined by the complexity and importance of
the issues studied, taking into account the skills and resources available. SIA should
include studies related to involuntary resettlement, compulsory land acquisition, impact of

Operational Aspects of EIA
TGM for Pulp and Paper Industry 4-29 August 2010
imported workforces, job losses among local people, damage to sites of cultural, historic
or scientific interest, impact on minority or vulnerable groups, child or bonded labour, use
of armed security guards. However, SIA may primarily include the following:
Description of the socio-economic, cultural and institutional profile
Conduct a rapid review of available sources of information to describe the socio-
economic, cultural and institutional interface in which the project operates.
Socio-economic and cultural profile: Describe the most significant social, economic and
cultural features that differentiate social groups in the project area. Describe their
different interests in the project, and their levels of influence. Explain specific effects that
the project may have on the poor and underprivileged. Identify any known conflicts
among groups that may affect project implementation.
Institutional profile: Describe the institutional environment; consider both the presence
and function of public, private and civil society institutions relevant to the operation. Are
there important constraints within existing institutions e.g. disconnect between
institutional responsibilities and the interests and behaviors of personnel within those
institutions? Or are there opportunities to utilize the potential of existing institutions, e.g.
private or civil society institutions, to strengthen implementation capacity.
Legislative and regulatory considerations
To review laws and regulations governing the project’s implementation and access of
poor and excluded groups to goods, services and opportunities provided by the project. In
addition, review the enabling environment for public participation and development
planning. SIA should build on strong aspects of legal and regulatory systems to facilitate
program implementation and identify weak aspects while recommending alternative
arrangements.
Key social issues
SIA provides baseline information for designing the social development strategy. The
analysis should determine the key social and Institutional issues which affect the project
objectives; identify the key stakeholder groups in this context and determine how
relationships between stakeholder groups will affect or be affected by the project; and
identify expected social development outcomes and actions proposed to achieve those
outcomes.
Data collection and methodology
Describe the design and methodology for social analysis. In this regard:
Build on existing data;
Clarify the units of analysis for social assessment: intra-household, household level,
as well as communities/settlements and other relevant social aggregations on which
data is available or will be collected for analysis;
Choose appropriate data collection and analytical tools and methods, employing
mixed methods wherever possible; mixed methods include a mix of quantitative and
qualitative methods.

Operational Aspects of EIA
TGM for Pulp and Paper Industry 4-30 August 2010
Strategy to achieve social development outcomes
Identify the likely social development outcomes of the project and propose a Social
development strategy, including recommendations for institutional arrangements to
achieve them, based on the findings of the social assessment. The social development
strategy could include measures that:
that strengthen social inclusion by ensuring inclusion of both poor and excluded
groups and intended beneficiaries are included in the benefit stream; offer access to
opportunities created by the project
that empower stakeholders through their participation in design and implementation
of the project, their access to information, and their increased voice and
accountability (i.e. a participation framework); and
that enhance security by minimizing and managing likely social risks and increasing
the resilience of intended beneficiaries and affected persons to socioeconomic shocks
Implications for analysis of alternatives
Review the proposed approaches for the project, and compare them in terms of their
relative impacts and social development outcomes. Consider what implications the
findings of the social assessment might have on those approaches. Should some new
components be added to the approach, or other components be reconsidered or modified?
If SIA and consultation processes indicate that alternative approaches may have better
development outcomes, such alternatives should be described and considered, along with
the likely budgetary and administrative effects these changes might have.
Recommendations for project design and implementation arrangements
Provide guidance to project management and other stakeholders on how to integrate
social development issues into project design and implementation arrangements. As
much as possible, suggest specific action plans or implementation mechanisms to address
relevant social issues and potential impacts. These can be developed as integrated or
separate action plans, for example, as Resettlement Action Plans, Indigenous Peoples
Development Plans, Community Development Plans, etc.
Developing a monitoring plan
Through SIA process, a framework for monitoring and evaluation should be developed.
To the extent possible, this should be done in consultation with key stakeholders,
especially beneficiaries and affected people.
The framework shall identify expected social development indicators, establish
benchmarks, and design systems and mechanisms for measuring progress and results
related to social development objectives. The framework shall identify organizational
responsibilities in terms of monitoring, supervision, and evaluation procedures. Wherever
possible, participatory monitoring mechanisms shall be incorporated. The framework
should establish:
a set of monitoring indicators to track the progress achieved. The benchmarks and
indicators should be limited in number, and should combine both quantitative and
qualitative types of data. The indicators for outputs to be achieved by the social

Operational Aspects of EIA
TGM for Pulp and Paper Industry 4-31 August 2010
development strategy should include indicators to monitor the process of stakeholder
participation, implementation and institutional reform
indicators to monitor social risk and social development outcomes; and indicators to
monitor impacts of the project’s social development strategy. It is important to
suggest mechanisms through which lessons learnt from monitoring and stakeholder
feedback can result in changes to improve the operation of the project. Indicators
should be of such a nature that results and impacts can be disaggregated by gender
and other relevant social groups;
define transparent evaluation procedures. Depending on context, these may include a
combination of methods, such as participant observation, key informant interviews,
focus group discussions, census and socio-economic surveys, gender analysis,
Participatory Rural Appraisal (PRA), Participatory Poverty Assessment (PPA)
methodologies, and other tools. Such procedures should be tailored to the special
conditions of the project and to the different groups living in the project area;
Estimate resource and budget requirements for monitoring and evaluation activities,
and a description of other inputs (such as institutional strengthening and capacity
building) needs to be carried out.
4.6 Risk Assessment
Industrial accidents results in great personal and financial loss. Managing these
accidental risks in today’s environment is the concern of every industry including pulp &
paper industries, because either real or perceived incidents can quickly jeopardize the
financial viability of a business. Many facilities involve various manufacturing processes
that have the potential for accidents which may be catastrophic to the plant, work force,
environment, or public.
The main objective of risk assessment study is to propose a comprehensive but simple
approach to carry out risk analysis and conducting feasibility studies for industries,
planning and management of industrial prototype hazard analysis study in Indian context.
Risk analysis and risk assessment should provide details on Quantitative Risk
Assessment (QRA) techniques used world-over to determine risk posed to people who
work inside or live near hazardous facilities, and to aid in preparing effective emergency
response plans by delineating a DMP to handle onsite and offsite emergencies. Hence,
QRA is an invaluable method for making informed risk-based process safety and
environmental impact planning decisions, as well as being fundamental to any decision
while siting a facility. QRA whether, site-specific or risk-specific for any plant is
complex and needs extensive study that involves process understanding, hazard
identification, consequence modeling, probability data, vulnerability models/data, local
weather and terrain conditions and local population data. QRA may be carried out to
serve the following objectives.
Identification of safety areas
Identification of hazard sources
Generation of accidental release scenarios for escape of hazardous materials from the
facility
Identification of vulnerable units with recourse to hazard indices
Estimation of damage distances for the accidental release scenarios with recourse to
Maximum Credible Accident (MCA) analysis
Hazard and Operability studies (HAZOP) in order to identify potential failure cases of
significant consequences

Operational Aspects of EIA
TGM for Pulp and Paper Industry 4-32 August 2010
Estimation of probability of occurrences of hazardous event through fault tree
analysis and computation of reliability of various control paths
Assessment of risk on basis of above evaluation against the risk acceptability criteria
relevant to the situation
Suggest risk mitigation measures based on engineering judgment, reliability and risk
analysis approaches
Delineation / upgradation of DMP
Safety Reports: with external safety report/ occupational safety report.
The risk assessment (Figure 4-4) report may cover the following in terms of the extent of
damage with resource to MCA analysis and delineation of risk mitigations measures with
an approach to DMP.
Hazard identification – identification of hazardous activities, hazardous materials,
past accident records, etc.
Hazard quantification – consequence analysis to assess the impacts
Risk Presentation
Risk Mitigation Measures
DMPs
Figure 4-4: Risk Assessment – Conceptual Framework
Methods of risk prediction should cover all the design intentions and operating
parameters to quantify risk in terms of probability of occurrence of hazardous events and
magnitude of its consequence. Table 4-4 shows the prediction models for risk
assessment.
Table 4-4: Choice of Models for Impact Predictions: Risk Assessment
Name Application Remarks
EFFECT
WHAZAN
Consequence Analysis for
Visualization of accidental chemical
release scenarios & its consequence
Consequence Analysis for
Visualization of accidental chemical
release scenarios & its consequence
Heat load, press wave &
toxic release exposure
neutral gas dispersion
EGADIS Consequence Analysis for
Visualization of accidental chemical
release scenarios & its consequence
Dense gas dispersion
HAZOP and Fault Tree
Assessment
For estimating top event probability Failure frequency data is
required

Operational Aspects of EIA
TGM for Pulp and Paper Industry 4-33 August 2010
Pathways reliability and
protective system hazard
analysis
For estimating reliability of
equipments and protective systems
Markov models
Vulnerability Exposure
models
Estimation of population exposure Uses probit equation for
population exposure
F-X and F-N curves Individual / Societal risks Graphical Representation
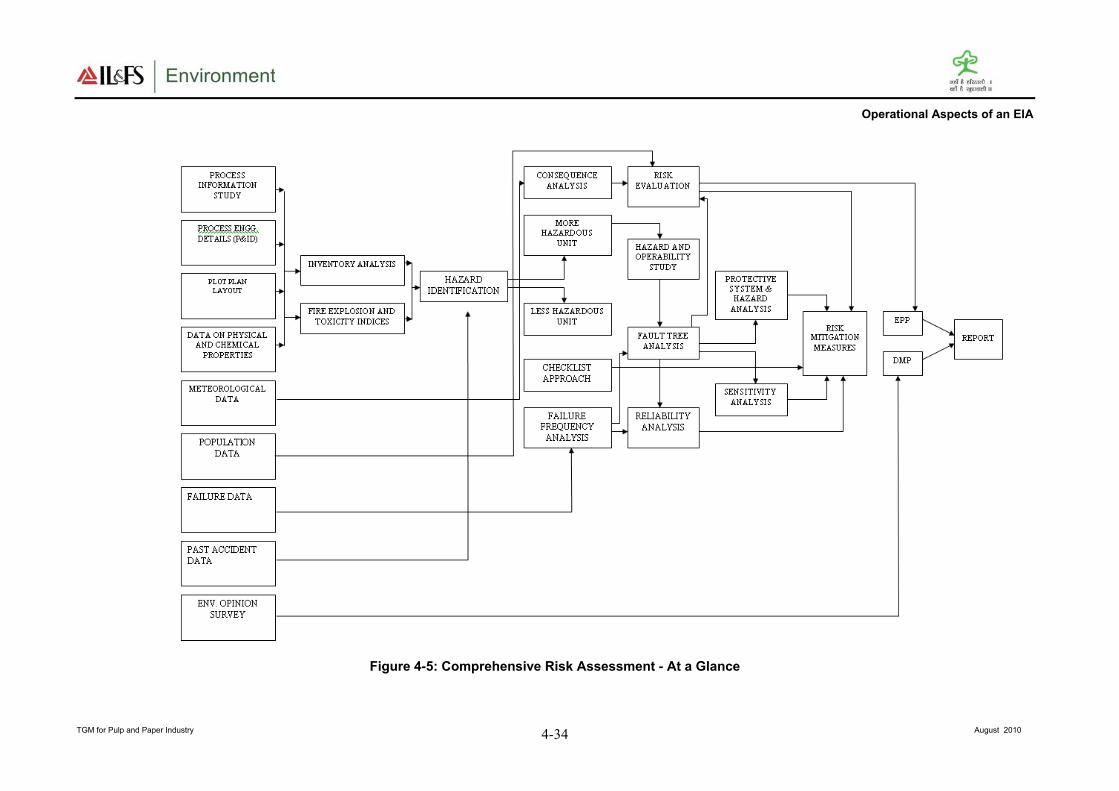
Operational Aspects of an EIA
TGM for Pulp and Paper Industry August 2010 4-34
Figure 4-5: Comprehensive Risk Assessment - At a Glance

Operational Aspects of an EIA
TGM for Pulp and Paper Industry 4-35 August 2010
4.6.1 Storage and handling of hazardous materials
Both hazardous and non-hazardous materials generated within the project facility shall be
temporarily accommodated in appropriate units placed within the project facility
built/made in line with the safety, health and environmental standards.
The size of these temporary units would depend on the quantity and type of hazardous
waste materials like asbestos, PCB, oils, fuels, etc., with appropriate storage capacities
placed in the project facility in compliance with the Hazardous Waste Management and
Handling Rules. In case of radioactive wastes, storage and handling should be based on
Rules for Management of Radioactive Waste under AERB. Also, if gas cylinders must be
stored in the facility, rules applicable for gas cylinders under the Explosives Act shall be
followed. Later, these materials must be disposed off at a centralized disposal facility
with utmost care following safety norms. Each unit in the facility should be have fire
hydrant system to handle fire hazards.
4.6.2 Hazard identification
Hazard is the characteristic of any system or process which has the potential for accident.
Identification of hazards, in presence of any hazardous waste generating units within the
project facility is of primary significance in the analysis, quantification and cost-effective
control of accidents involving chemicals and process.
Hence, all components of a system/unit need to be thoroughly examined to assess their
potential for initiating or propagating an unplanned event/sequence of events, which can
be termed as an accident.
Typical methods for hazard identification employed are:
Identification of major hazardous units based on Manufacture, Storage and Import of
Hazardous Chemicals Rules, 1989 of Government of India (as amended in 2000)
Identification of hazardous units and segments of plants and storage units based on
relative ranking technique, viz. Fire-Explosion and Toxicity Index (FE&TI).
Hazardous substances may be classified into three main categories namely flammable,
unstable and toxic substances. Flammable substances require interaction with air for their
hazard to be realized. Under certain circumstances, vapours arising from flammable
substances when mixed with air may become explosive, especially in confined spaces.
However, if present in sufficient quantity, such clouds may explode in open air also.
Unstable substances are liquids or solids, which may decompose with such violence
giving rise to blast waves. Besides, toxic substances are dangerous and cause substantial
damage to life when released into the atmosphere. The ratings for a large number of
chemicals based on flammability, reactivity and toxicity are provided in NFPA Codes 49
and 345 M.
4.6.3 Hazard assessment and evaluation
A preliminary hazard analysis shall be carried out to identify major hazards associated
with storages in the facility. This is followed by consequence analysis to quantify these
hazards. Finally the vulnerable zones are plotted for which risk reducing measures are
deduced and implemented

Operational Aspects of EIA
TGM for Pulp and Paper Industry 4-36 August 2010
Frequent causes of accidents
Fire and explosion: explosives, flammable materials
Being struck by falling objects
Caught in/compressed
Snapping of cables, ropes, chains, slings
Handling heavy objects
Electricity (electrocution)
Poor illumination
Falls from height inside industrial units or on the ground
Struck by moving objects
Slipping on wet surfaces
Sharp objects
Oxygen deficiency in confined spaces
Lack of personal protective equipment (PPE), housekeeping practices, safety signs
Hackles, hooks, chains
Cranes, winches, hoisting and hauling equipment;
Hazardous substances and wastes
Heavy and toxic metals (lead, mercury, cadmium, copper, zinc, etc)
Organometallic substances (tributyltin, etc)
Lack of hazard communication (storage, labelling, material safety data sheets)
Batteries, fire-fighting liquids
PCBs and PVC (combustion products)
Welding fumes
Volatile organic compounds (solvents)
Inhalation in confined and enclosed spaces
Physical hazards
Noise
Extreme temperatures
Vibration
Radiation (UV, radioactive materials)
Physical hazards
Noise
Extreme temperatures
Vibration
Radiation (UV, radioactive materials)
Mechanical Hazards
Trucks and transport vehicles
Scaffolding, fixed and portable ladders
Impact by tools, sharp-edged tools
Power-driven hand tools, saws, grinders and abrasive cutting wheels
Failure of machinery and equipment
Poor maintenance of machinery and equipment
Lack of safety guards in machines
Structural failure
Operational Aspects of EIA
TGM for Pulp and Paper Industry 4-37 August 2010
Biological hazards
Toxic marine organisms (In case if the IEs are in Coastal Regions)
Risk of communicable diseases transmitted by pests, vermin, rodents, insects and
other animals that may infest in the IEs.
Animal bites
Vectors of infectious diseases (TB, malaria, dengue fever, hepatitis, respiratory
infections, others)
Ergonomic and psychosocial hazards
Repetitive strain injuries, awkward postures, repetitive and monotonous work,
excessive workload
Long working hours, shift work, night work, temporary employment
Mental stress, human relations (aggressive behaviour, alcohol and drug abuse,
violence)
Poverty, low wages, minimum age, lack of education and social environment
General concerns
Lack of safety and health training
Poor work organization
Inadequate housing and sanitation
Inadequate accident prevention and inspection
Inadequate emergency, first-aid and rescue facilities
Lack of medical facilities and social protection
4.6.4 Disaster management plan
A disaster is a catastrophic situation in which suddenly, people are plunged into
helplessness and suffering and, as a result, need protection, clothing, shelter, medical &
social care and other necessities of life.
The Disaster Management Plan (DMP) is aimed to ensure safety of life, protection of
environment, protection of installation, restoration of production and salvage operations
in this same order of priorities. For effective implementation of DMP, it should be
widely circulated and a personnel training is to be provided through rehearsals/drills.
To tackle the consequences of a major emergency inside the plant or immediate vicinity
of the plant, a DMP has to be formulated and this planned emergency document is called
DMP.
The objective of the DMP is to make use of the combined resources of the plant and the
outside services to achieve the following:
Effect the rescue and medical treatment of casualties
Safeguard other people
Minimize damage to property and the environment
Initially contain and ultimately bring the incident under control
Operational Aspects of EIA
TGM for Pulp and Paper Industry 4-38 August 2010
Identify any dead
Provide for the needs of relatives
Provide authoritative information to the news media
Secure the safe rehabilitation of affected area
Preserve relevant records and equipment for the subsequent inquiry into the cause and
circumstances of the Emergency
In effect, it is to optimize operational efficiency to rescue rehabilitation and render
medical help and to restore normalcy.
The DMP should include Emergency Preparedness Plan, Emergency Response Team,
Emergency Communication, Emergency Responsibilities, Emergency Facilities, and
Emergency Actions
4.6.4.1 Emergency preparedness plan
Incidents, accidents and contingency preparedness should be accounted during
construction and operation process. This shall be a part of EMS. Emergency
Preparedness Plan (EPP) should be prepared following the national environmental
Emergency plan and OSHA guidelines. According to these guidelines, an environmental
emergency plan would essentially provide the following information:
Assignment of the duties and responsibilities among the authorities, participating
agencies, the response team and coordinators and/or those responsible for the
pollution incident;
Relationship with other emergency plans;
A reporting system that ensures rapid notification in the event of a pollution incident;
The establishment of a focal point for co-ordination and directions connected to the
implementation of the plan;
Response operations; should always cover these four phases:
– Discovery and alarm
– Evaluation, notification and plan invocation
– Containment and countermeasures
– Cleanup and disposal
Identification of expertise and response resources available for assistance for the
implementation of the plan;
Directions on the necessary emergency provisions applicable to the handling,
treatment or disposal of certain pollutants;
Link to the local community for assistance, if necessary;
Support measures, such as procedures for providing public information, carrying out
surveillance, issuing post incident reports, review and updating of the plan, and
periodic exercising of the plan.
Emergency response
Various activities within the project facility are always subjected to accidents and
incidents of many kinds. Therefore, a survey of potential incidents and accidents is to be
carried out. Based on this, a plan for response to incidents, injuries and emergencies
should be prepared. Response to emergencies should ensure that:

Operational Aspects of EIA
TGM for Pulp and Paper Industry 4-39 August 2010
During the operation the exposure of workers should be limited as much as possible
Contaminated areas should be cleaned and if necessary disinfected
Limited impact on the environment to the extent possible
Written procedures for different types of emergencies should be prepared and the entire
workforce should be trained in emergency response. All relevant emergency response
equipment should also be readily available.
With regard to dangerous spills, associated clean-up and fire-fighting operations should
be carried out by specially allocated and trained personnel.
Response team
It is important to setup an Emergency Organization. A senior executive who has control
over the affairs of the plant would be heading the Emergency Organization. He would be
designated at Site Controller. Manager (Safety) would be designated as the Incident
Controller. In case of stores, utilities, open areas, which are not under the control of the
Production Heads, Senior Executive responsible for maintenance of utilities would be
designated as Incident Controller. All the Incident Controllers would be reporting to the
Site Controller.
Each Incident Controller organizes a team responsible for controlling the incidence with
the personnel under his control. Shift In charge would be the reporting officer, who
would bring the incidence to the notice of the Incidence Controller and Site Controller.
Emergency Coordinators would be appointed who would undertake the responsibilities
like fire fighting, rescue, rehabilitation, transport and provide essential and support
services. For this purposes, Security In-charge, Personnel Department, Essential services
personnel would be engaged. All these personnel would be designated as Key personnel.
In each shift, electrical supervisor, electrical fitters, pump house in-charge, and other
maintenance staff would be drafted for emergency operations. In event of power or
communication system failure, some of staff members in the office/facility would be
drafted and their services would be utilized as messengers for quick passing of
communications. All these personnel would be declared as essential personnel.
Response to injuries
Based on a survey of possible injuries, a procedure for response to injuries or exposure to
hazardous substances should be established. All staff should have a minimum of training
to such response and the procedure ought to include the following:
Immediate first aid, such as eye splashing, cleansing of wounds and skin, and
bandaging
Immediate reporting to a responsible designated person
If possible, retention of the item and details of its source for identification of possible
hazards
Rapid additional medical care from medical personnel
Medical surveillance
Recording of the incident
Investigation, determination and implementation of remedial action
It is vital that incident reporting should be straightforward so that reporting is actually
carried out.

Operational Aspects of EIA
TGM for Pulp and Paper Industry 4-40 August 2010
Emergency communication
Whoever notices an emergency situation such as fire, growth of fire, leakage, etc. would
inform his immediate superior and Emergency Control Center. The person on duty in the
Emergency Control Center, would appraise the Site Controller. Site Controller verifies
the situation from the Incident Controller of that area or the Shift In-charge and takes a
decision about an impending On-site Emergency. This would be communicated to all the
Incident Controllers, Emergency Coordinators. Simultaneously, the emergency warning
system would be activated on the instructions of the Site Controller.
Emergency responsibilities
The responsibilities of the key personnel should be defined for the following:
Site controller
Incident controller
Emergency coordinator - rescue, fire fighting
Emergency coordinator-medical, mutual aid, rehabilitation, transport and
communication
Emergency coordinator - essential services
Emergency facilities
Emergency Control Center – with access to important personnel, telephone, fax, telex
facility, safe contained breathing apparatus, hand tools, emergency shut down
procedures, duties and contact details of key personnel and government agencies,
emergency equipments, etc.
Assembly Point – with minimum facilities for safety and rescue
Emergency Power Supply – connected with diesel generator, flame proof emergency
lamps, etc.
Firefighting Facilities – first aid firefighting equipments, fire alarms, etc.
Location of wind stock – located at appropriate location to indicate the direction of
wind for emergency escape
Emergency Medical Facilities – Stretchers, gas masks, general first aid, emergency
control room, breathing apparatus, other emergency medical equipment, ambulance
Emergency actions
Emergency warning
Evacuation of personnel
All clear signal
Public information and warning
Coordination with local authorities
Mutual aid
Mock drills

Operational Aspects of EIA
TGM for Pulp and Paper Industry 4-41 August 2010
4.7 Mitigation Measures
The purpose of mitigation is to identify measures that safeguard the environment and the
community affected by the proposal. Mitigation is both a creative and practical phase of
the EIA process. It seeks to find the best ways and means of avoiding, minimizing and
remedying impacts. Mitigation measures must be translated into action in right way and
at the right time, if they are to be successful. This process is referred to as impact
management and takes place during project implementation. A written plan should be
prepared for this purpose, and should include a schedule of agreed actions. Opportunities
for impact mitigation will occur throughout the project cycle.
4.7.1 Important considerations for mitigation methods
The responsibility of project proponents to ‘internalize’ the full environmental costs of
development proposals is now widely accepted under “Polluter Pay” principle. In
addition, many proponents have found that good design and impact management can
result in significant savings applying the principles of cleaner production to improve their
environmental performance.
The predicted adverse environmental as well as social impacts for which mitigation
measures are required should be identified and briefly summarized along with cross
referencing them to the significance, prediction components of the EIA report or
other documentation.
Each mitigation measure should be briefly described w.r.t. the impact of significances
to which it relates and the conditions under which it is required (for example,
continuously or in the event of contingencies). These should also be cross-referenced
to the project design and operating procedures which elaborate on the technical
aspects of implementing the various measures.
Cost and responsibilities for mitigation and monitoring should be clearly defined,
including arrangements for coordination among various Authorities responsible for
mitigation.
The proponent can use the EMP to develop environmental performance standards and
requirements for the project site as well as supply chain. An EMP can be
implemented through EMS for the operational phase of the project.
Prior to selecting mitigation plans it is appropriate to study the mitigation alternatives for
cost-effectiveness, technical and socio-political feasibility. Such mitigation measures
could include:
avoiding sensitive areas such as eco-sensitive area e.g. fish spawning areas, dense
mangrove areas or areas known to contain rare or endangered species
adjusting work schedules to minimize disturbance
engineered structures such as berms and noise attenuation barriers
pollution control devices, such as scrubbers and electrostatic precipitators
changes in fuel feed, manufacturing, process, technology use, or waste management
practices, etc.

Operational Aspects of EIA
TGM for Pulp and Paper Industry 4-42 August 2010
4.7.2 Hierarchy of elements of mitigation plan
Figure 4-6: Elements of Mitigation
A good EIA practice requires technical understanding of relevant issues and the
measures that work in such given circumstances. The priority of selection of mitigation
measures should be in the order:
Step One: Impact avoidance
This step is most effective when applied at an early stage of project planning. It can be
achieved by:
not undertaking certain projects or elements that could result in adverse impacts
avoiding areas that are environmentally sensitive
putting in place the preventative measures to stop adverse impacts from occurring, for
example, release of water from a reservoir to maintain a fisheries regime
Step Two: Impact minimization
This step is usually taken during impact identification and prediction to limit or reduce
the degree, extent, magnitude, or duration of adverse impacts. It can be achieved by:
scaling down or relocating the proposal
redesigning elements of the project
taking supplementary measures to manage the impacts
Step Three: Impact compensation
This step is usually applied to remedy unavoidable residual adverse impacts. It can be
achieved by:
rehabilitation of the affected site or environment, for example, by habitat
enhancement and restocking fish
restoration of the affected site or environment to its previous state or better, as
typically required for mine sites, forestry roads and seismic lines
replacement of the same resource values at another location. For example, by
wetland engineering to provide an equivalent area to that lost to drainage or infill

Operational Aspects of EIA
TGM for Pulp and Paper Industry 4-43 August 2010
Important compensation elements
Resettlement Plans: Special considerations apply to mitigation of proposals that displace
or disrupt people. Certain types of projects, such as reservoirs and irrigation schemes and
public works, are known to cause involuntary resettlement. This is a contentious issue
because it involves far more than re-housing people; in addition, income sources and
access to common property resources are likely to be lost. Almost certainly, a
resettlement plan will be required to ensure that no one is worse off than before, which
may not be possible for indigenous people whose culture and lifestyle is tied to a locality.
This plan must include the means for those displaced to reconstruct their economies and
communities and should include an EIA of the receiving areas. Particular attention
should be given to indigenous, minority and vulnerable groups who are at higher risk
from resettlement.
In-kind compensation
When significant or net residual loss or damage to the environment is likely, in kind
compensation is appropriate. As noted earlier, environmental rehabilitation, restoration or
replacement have become standard practices for many proponents. Now, increasing
emphasis is given to a broader range of compensation measures to offset impacts and
assure the sustainability of development proposals. These include impact compensation
‘trading’, such as offsetting CO2 emissions by planting forests to sequester carbon.
4.7.3 Typical mitigation measures
Choice of location for the developmental activity plays an important role in preventing
adverse impacts on surrounding environment. Detailed guidelines on siting of industries
are provided in Section 4.2. However, if the developmental activity produces any more
adverse impacts, mitigation measures should be taken.
Previous subsections of the Section 4.7 could be precisely summarized into following:
Impacts from a developmental project could have many dimensions. As most of the
direct impacts are caused by releases from developmental projects, often impact
control at source is the best opportunity to either eliminate or mitigate the impacts. In
other words, the best way to mitigate impacts is to prevent them from occurring.
Choice of raw materials/technologies/processes which produce least impact would be
one of the options to achieve it.
In case it is not feasible to control impacts at source, various interventions to
minimize the adverse impacts may be considered. These interventions, primarily aim
at reducing the residual impacts on the valued environmental components of the
receiving environment to the acceptable concentrations.
Degree of control at source and external interventions differs from situation-to -
situation and is largely governed by techno-economic feasibility. While the
regulatory bodies stress for further source control (due to high reliability), the project
proponents bargain for other interventions which may be relatively cost-effective than
further control at source (in any case project authority is required to meet the
industry-specific standards by adopting the best practicable technologies. However,
if the location demands further control at source, then the proponents are required to
adopt further advanced control technologies, i.e., towards best available control
technologies). After having discussions with the project proponent, EAC/SEAC
reaches to an agreed level of source control + other interventions (together called as

Operational Aspects of EIA
TGM for Pulp and Paper Industry 4-44 August 2010
mitigation measures in the given context) that achieve the targeted protection levels
for the VECs in the receiving environment. These levels will become the principal
clearance conditions.
Chapter 3 of this technical EIA Guidance Manual offers elaborate information on
cleaner technologies, waste minimization opportunities, and control technologies for
various kinds of polluting parameters that emanate from this developmental activity.
This information may be used to draw appropriate source control measures applicable
at source.
The choice of interventions for mitigation of impacts may be numerous and depend on
various factors. Mitigation measures based on location-specific suitability and some
other factors are discussed in sub-sections 4.7.1 and 4.7.2. A few other measures which
may also be explored for mitigation of impacts are listed in Table 4-5.
Table 4-5: Typical Mitigation Measures
Impacts Typical Mitigation Measures
Soil Avoid land clearing,
Avoid logging in the rainy season and clearly mark areas that should
not be harvested (i.e., steep slopes),
Use low impact harvesting equipment and methods and reduce skid
trail distances,
Restore disturbed areas,
Implement a monitoring plan.
Windscreens, maintenance, and installation of ground cover
Installation of drainage ditches
Runoff and retention ponds, rainwater harvesting structures
Minimize disturbances and scarification of the surface
Construction of water retaining structures and overflow control, etc.
Resources – raw
material/fuel/
construction
material, etc.
Availing the resources which could be replenished by natural
systems, etc.
Provide solid waste management plan in detail explaining how
different classes of wastes are segregated and treated.
Toxic substances and all special industrial refuse must be treated
separately like oil and domestic refuse, etc.
Deforestation Plant or create similar areas
Initiate a tree planning program in other areas
Donate land to conservationalist groups
Avoid causing forest fires, etc.
Water Maintain vegetation along all bodies of water,
Provide waste disposal facilities,
Implement procedures for use and storage of chemicals, oil and fuel
and to minimize potential pollution effects and implement a
monitoring plan to verify the efficiency of the system regularly,
Implement a monitoring plan.
Conjunctive use of ground/surface water, to prevent flooding/water
logging/depletion of water resources. Included are land use pattern,
land filling, lagoon/reservoir/garland canal construction, and
rainwater harvesting and pumping rate.
Minimise flow variation from the mean flow
Storing of oil wastes in lagoons should be minimised in order to
avoid possible contamination of the ground water system.
All effluents containing acid/alkali/organic/toxic wastes should be
properly treated.

Operational Aspects of EIA
TGM for Pulp and Paper Industry 4-45 August 2010
Impacts Typical Mitigation Measures
Collection and treatment of, sewage and storm water run-off
Monitoring of ground waters
Use of biodegradable or otherwise readily treatable additives
Neutralization and sedimentation of wastewaters, where applicable
Dewatering of sludges and appropriate disposal of solids
Construction of liners before disposing waste
In case of oil waste, oil separation before treatment and discharge
into the environment
By controlling discharge of sanitary sewage and industrial waste into
the environment
By avoiding the activities that increases erosion or that contributes
nutrients to water (thus stimulating alga growth)
For wastes containing high TDS, treatment methods include removal
of liquid and disposal of residue by controlled landfilling to avoid
any possible leaching of the fills
All surface runoffs around mines or quarries should be collected
treated and disposed.
Treated wastewater (such as sewage, industrial wastes, or stored
surface runoffs) can be used as cooling water makeup.
Wastewater carrying radioactive elements should be treated
separately by means of de-watering procedures, and solids or brine
should be disposed of with special care.
Develop spill prevention plans in case of chemical discharges and
spills
Develop traps and containment system and chemically treat
discharges on site
Water harvesting proposals to recharge the ground water
Include plans to construct storage basins where effluents can be
cooled and neutralized before discharge in order to control
temperature and pH of the effluent.
Include end-of-pipe treatment with a sedimentation clarifier for
primary clarification/an aerated lagoon/activated sludge, or anaerobic
treatment for secondary treatment in case the coloured effluents.
Implement a monitoring plan, etc.
Air Reduce burning,
Limit operations when dust and fire are a problem and plan
transportation routes to avoid population centres.
The Total Reduced Sulphur (TRS) that generates foul smelling
emissions and sulphur dioxide are should be incinerated after various
operations to collect them.
Attenuation of pollution/protection of receptor through green
belts/green cover
Use of particulate removal devices such as cyclones, setting
chambers, scrubbers, electrostatic precipitators, bag houses, etc.
Use of gas removal devices using absorption (liquid as a media),
adsorption (molecular sieve), and catalytic converters
Use of protected, controlled equipments such as oxygen masks, etc.
Control of stationary source emission (including evapouration,
incineration, absorption, condensation, and material substitution)
Dilution of odourant (dilution can change the nature as well as
strength of an odour), odour counteraction or neutralise (certain pairs
of odours in appropriate concentrations may neutralise each other),
odour masking or blanketing (certain weaker malodours may be
suppressed by a considerably stronger good odour).
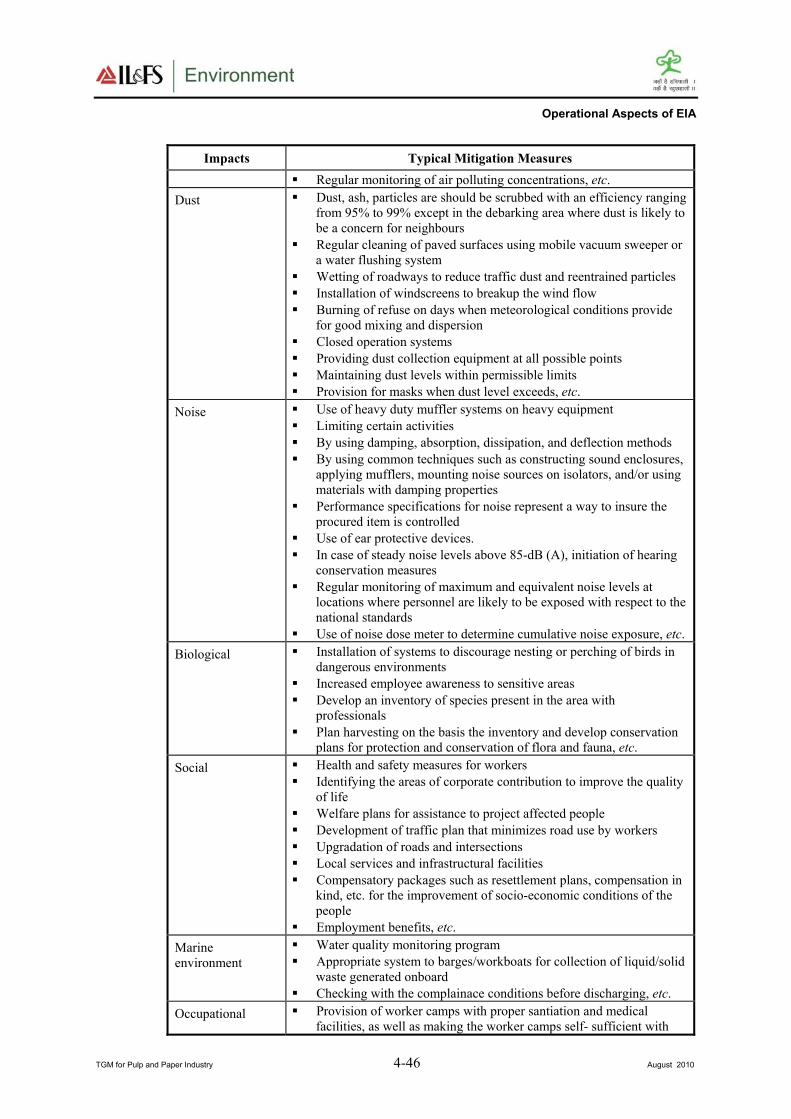
Operational Aspects of EIA
TGM for Pulp and Paper Industry 4-46 August 2010
Impacts Typical Mitigation Measures
Regular monitoring of air polluting concentrations, etc.
Dust Dust, ash, particles are should be scrubbed with an efficiency ranging
from 95% to 99% except in the debarking area where dust is likely to
be a concern for neighbours
Regular cleaning of paved surfaces using mobile vacuum sweeper or
a water flushing system
Wetting of roadways to reduce traffic dust and reentrained particles
Installation of windscreens to breakup the wind flow
Burning of refuse on days when meteorological conditions provide
for good mixing and dispersion
Closed operation systems
Providing dust collection equipment at all possible points
Maintaining dust levels within permissible limits
Provision for masks when dust level exceeds, etc.
Noise Use of heavy duty muffler systems on heavy equipment
Limiting certain activities
By using damping, absorption, dissipation, and deflection methods
By using common techniques such as constructing sound enclosures,
applying mufflers, mounting noise sources on isolators, and/or using
materials with damping properties
Performance specifications for noise represent a way to insure the
procured item is controlled
Use of ear protective devices.
In case of steady noise levels above 85-dB (A), initiation of hearing
conservation measures
Regular monitoring of maximum and equivalent noise levels at
locations where personnel are likely to be exposed with respect to the
national standards
Use of noise dose meter to determine cumulative noise exposure, etc.
Biological Installation of systems to discourage nesting or perching of birds in
dangerous environments
Increased employee awareness to sensitive areas
Develop an inventory of species present in the area with
professionals
Plan harvesting on the basis the inventory and develop conservation
plans for protection and conservation of flora and fauna, etc.
Social Health and safety measures for workers
Identifying the areas of corporate contribution to improve the quality
of life
Welfare plans for assistance to project affected people
Development of traffic plan that minimizes road use by workers
Upgradation of roads and intersections
Local services and infrastructural facilities
Compensatory packages such as resettlement plans, compensation in
kind, etc. for the improvement of socio-economic conditions of the
people
Employment benefits, etc.
Marine
environment
Water quality monitoring program
Appropriate system to barges/workboats for collection of liquid/solid
waste generated onboard
Checking with the complainace conditions before discharging, etc.
Occupational Provision of worker camps with proper santiation and medical
facilities, as well as making the worker camps self- sufficient with

Operational Aspects of EIA
TGM for Pulp and Paper Industry 4-47 August 2010
Impacts Typical Mitigation Measures
health and safety resources like water supply, power supply, etc
Arrangement of periodic health check-ups for early detection and
control of communicatble diseases.
Arrangement to dispose off the wastes at approved disposal sites.
Provide preventive measures for potentital fire hazards with requisite
fire detection, fire-fighting facilities and adequate water storage
Construction Have a Transport Management Plan in place in order to
prevent/minimize the disturbance on surrounding habitats
Initiate traffic density studies
Solid/hazardous
waste
Proper handling of excavated soil
Proper plan to collect and dispose off the solid waste generated
onsite.
Identify an authorized waste handler for segregation of construction
and hazardous waste and its removal on a regular basis to minimise
odour, pest and litter impacts
Prohibit buring of refuse onsite.
4.8 Environmental Management Plan
A typical EMP shall be composed of the following:
1. summary of potential impacts of the proposal
2. description of recommended mitigation measures
3. description of monitoring programme to ensure compliance with relevant standards
and residual impacts
4. allocation of resources and responsibilities for plan implementation
5. implementation schedule and reporting procedures
6. contingency plan when impacts are greater than expected
Summary of impacts: The predicted adverse environmental and social impacts for which
mitigation measures are identified in earlier sections to be briefly summarized with cross
referencing to the corresponding sections in EIA report.
Description of mitigation measures: Each mitigation measure should be briefly
described w.r.t the impact to which it relates and the conditions under which it is required.
These should be accompanied by/referenced to, project design and operating procedures
which elaborate on the technical aspects of implementing various measures.
Description of monitoring programme to ensure compliance with relevant standards
and residual impacts: Environmental monitoring refers to compliance monitoring and
residual impact monitoring. Compliance monitoring refers to meeting the industry-
specific statutory compliance requirements (Ref. Applicable National regulations as
detailed in Chapter 3).
Residual impact monitoring refers to monitoring of identified sensitive locations with
adequate number of samples and frequency. The monitoring programme should clearly
indicate the linkages between impacts identified in the EIA report, measurement
indicators, detection limits (where appropriate), and definition of thresholds that signal
the need for corrective actions.
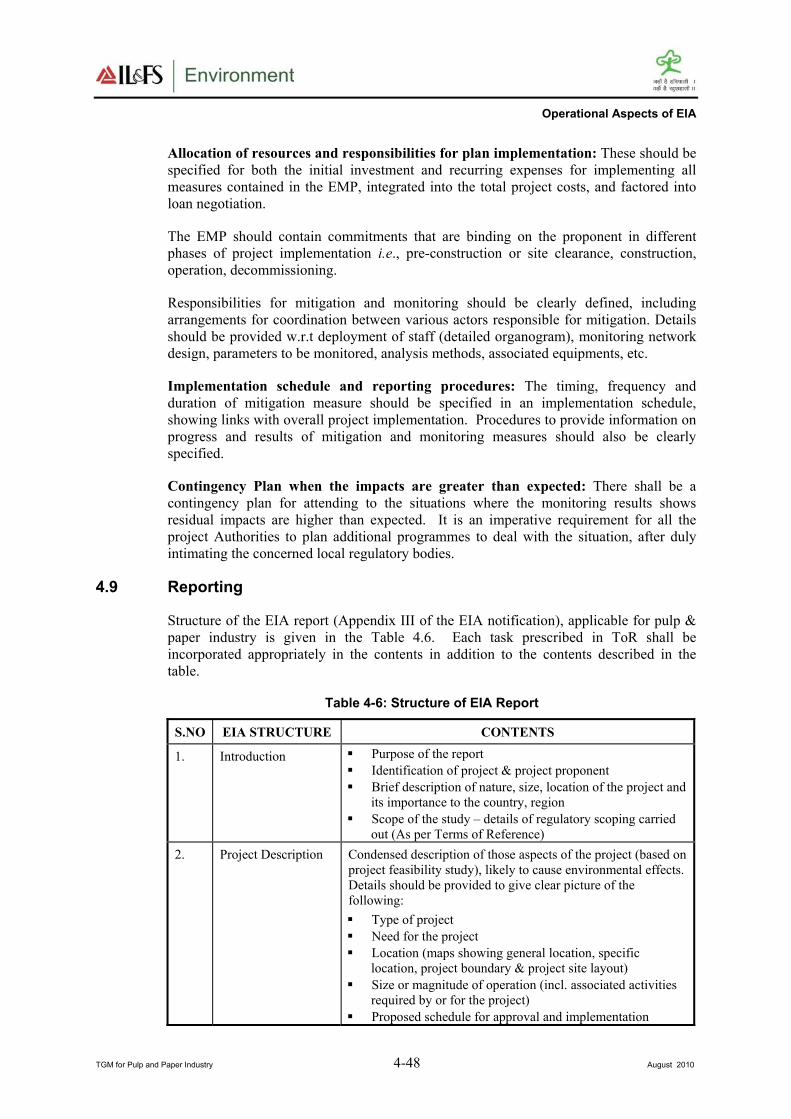
Operational Aspects of EIA
TGM for Pulp and Paper Industry 4-48 August 2010
Allocation of resources and responsibilities for plan implementation: These should be
specified for both the initial investment and recurring expenses for implementing all
measures contained in the EMP, integrated into the total project costs, and factored into
loan negotiation.
The EMP should contain commitments that are binding on the proponent in different
phases of project implementation i.e., pre-construction or site clearance, construction,
operation, decommissioning.
Responsibilities for mitigation and monitoring should be clearly defined, including
arrangements for coordination between various actors responsible for mitigation. Details
should be provided w.r.t deployment of staff (detailed organogram), monitoring network
design, parameters to be monitored, analysis methods, associated equipments, etc.
Implementation schedule and reporting procedures: The timing, frequency and
duration of mitigation measure should be specified in an implementation schedule,
showing links with overall project implementation. Procedures to provide information on
progress and results of mitigation and monitoring measures should also be clearly
specified.
Contingency Plan when the impacts are greater than expected: There shall be a
contingency plan for attending to the situations where the monitoring results shows
residual impacts are higher than expected. It is an imperative requirement for all the
project Authorities to plan additional programmes to deal with the situation, after duly
intimating the concerned local regulatory bodies.
4.9 Reporting
Structure of the EIA report (Appendix III of the EIA notification), applicable for pulp &
paper industry is given in the Table 4.6. Each task prescribed in ToR shall be
incorporated appropriately in the contents in addition to the contents described in the
table.
Table 4-6: Structure of EIA Report
S.NO EIA STRUCTURE CONTENTS
1. Introduction Purpose of the report
Identification of project & project proponent
Brief description of nature, size, location of the project and
its importance to the country, region
Scope of the study – details of regulatory scoping carried
out (As per Terms of Reference)
2. Project Description Condensed description of those aspects of the project (based on
project feasibility study), likely to cause environmental effects.
Details should be provided to give clear picture of the
following:
Type of project
Need for the project
Location (maps showing general location, specific
location, project boundary & project site layout)
Size or magnitude of operation (incl. associated activities
required by or for the project)
Proposed schedule for approval and implementation

Operational Aspects of EIA
TGM for Pulp and Paper Industry 4-49 August 2010
S.NO EIA STRUCTURE CONTENTS
Technology and process description
Project description including drawings showing project
layout, components of project etc. Schematic
representations of the feasibility drawings which give
information important for EIA purpose
Description of mitigation measures incorporated into the
project to meet environmental standards, environmental
operating conditions, or other EIA requirements (as
required by the scope)
Assessment of New & untested technology for the risk of
technological failure
3. Description of the
Environment
Study area, period, components & methodology
Establishment of baseline for VECs, as identified in the
scope
Base maps of all environmental components
4. Anticipated
Environmental
Impacts &
Mitigation Measures
Details of investigated environmental impacts due to
project location, possible accidents, project design, project
construction, regular operations, final decommissioning or
rehabilitation of a completed project
Measures for minimizing and / or offsetting adverse
impacts identified
Irreversible and irretrievable commitments of
environmental components
Assessment of significance of impacts (Criteria for
determining significance, assigning significance)
Mitigation measures
5. Analysis of
Alternatives
(Technology & Site)
Incase, the scoping exercise results in need for
alternatives:
Description of each alternative
Summary of adverse impacts of each alternative
Mitigation measures proposed for each alternative and
selection of alternative
6. Environmental
Monitoring Program
Technical aspects of monitoring the effectiveness of
mitigation measures (incl. Measurement methodologies,
frequency, location, data analysis, reporting schedules,
emergency procedures, detailed budget & procurement
schedules)
7. Additional Studies Public consultation
Risk assessment
Social impact assessment, R&R Action Plans
8. Project Benefits Improvements in physical infrastructure
Improvements in social infrastructure
Employment potential –skilled; semi-skilled and unskilled
Other tangible benefits
9. Environmental Cost
Benefit Analysis
If recommended at the Scoping stage
10. EMP Description of the administrative aspects that ensures
proper implementaion of mitigative measures are
implemented and their effectiveness monitored, after
approval of the EIA
11. Summary &
Conclusion (This
will constitute the
Overall justification for implementation of the project
Explanation of how, adverse effects have been mitigated

Operational Aspects of EIA
TGM for Pulp and Paper Industry 4-50 August 2010
S.NO EIA STRUCTURE CONTENTS
summary of the EIA
Report)
12. Disclosure of
Consultants engaged
Names of the Consultants engaged with their brief resume
and nature of Consultancy rendered
4.10 Public Consultation
Public consultation refers to the process by which the concerns of local affected people
and others who have plausible stake in the environmental impacts of the project or
activity are ascertained.
Public consultation is not a decision taking process, but is a process to collect views
of the people having plausible stake. If the SPCB/Public agency conducting public
hearing is not convinced with the plausible stake, then such expressed views need not
be considered.
Public consultation involves two components, one is public hearing, and other one is
inviting written responses/objections through Internet/by post, etc., by placing the
summary of EIA report on the web site.
All Category A and Category B1 projects require public hearing except the following:
− Once environmental clearance is granted to an industrial estates/SEZs/EPZs etc.,
for a given composition (type and capacity) of industries, then individual units
will not require public hearing
− Expansion of roads and highways, which do not involve any further acquisition of
land.
− Maintenance dredging, provided the dredged material shall be disposed within
port limits
− All building/ construction projects/ area development projects/townships
− All Category B2 projects
− All projects concerning national defense and security or involving other strategic
considerations as determined by the Central Government
Public hearing shall be carried out at the site or in its close proximity, district-wise,
for ascertaining concerns of local affected people.
Project proponent shall make a request through a simple letter to the
MemberSecretary of the SPCB or UTPCC to arrange public hearing.
Project proponent shall enclose with the letter of request, at least 10 hard copies and
10 soft copies of the draft EIA report including the summary EIA report in English
and in official language of the state/local language prepared as per the approved
scope of work, to the concerned Authority.
Simultaneously, project proponent shall arrange to send, one hard copy and one soft
copy, of the above draft EIA report along with the summary EIA report to the
following Authorities within whose jurisdiction the project will be located:
− District magistrate/District Collector/Deputy Commissioner (s)
− Zilla parishad and municipal corporation or panchayats union
− District industries office
− Urban local bodies (ULBs)/PRIs concerned/development authorities
− Concerned regional office of the MoEF/SPCB

Operational Aspects of EIA
TGM for Pulp and Paper Industry 4-51 August 2010
Above mentioned Authorities except concerned regional office of MoEF shall arrange
to widely publicize the draft EIA report within their respective jurisdictions
requesting the interested persons to send their comments to the concerned regulatory
Authorities. They shall also make draft EIA report for inspection electronically or
otherwise to the public during normal office hours till the public hearing is over.
Concerned regulatory Authority (MoEF/SEIAA/UTEIA) shall display the summary
of EIA report on its website and also make full draft EIA report available for
reference at a notified place during normal office hours at their head office.
SPCB or UTPCC concerned also shall make similar arrangements for giving publicity
about the project within the State/UT and make available the summary of draft EIA
report for inspection in select offices, public libraries or any other suitable location,
etc. They shall also additionally make available a copy of the draft EIA report to the
above five authorities/offices as mentioned above.
The MemberSecretary of the concerned SPCB or UTPCC shall finalize the date,
time and exact venue for the conduct of public hearing within seven days of the date
of the receipt of the draft EIA report from the project proponent and advertise the
same in one major National Daily and one Regional vernacular Daily/official State
language.
A minimum notice period of 30 (thirty) days shall be provided to the public for
furnishing their responses.
No postponement of the date, time, venue of the public hearing shall be undertaken,
unless some untoward emergency situation occurs. Only in case of emergencies and
up on recommendation of the concerned District Magistrate/District Collector/Deputy
Commissioner, the postponement shall be notified to the public through the same
National and Regional vernacular dailies and also prominently displayed at all the
identified offices by the concerned SPCB or UTPCC
In the above exceptional circumstances fresh date, time and venue for the public
consultation shall be decided by the Member–Secretary of the concerned SPCB or
UTPCC only in consultation with the District Magistrate/District Collector/Deputy
Commissioner and notified afresh as per the procedure.
The District Magistrate/District Collector/Deputy Commissioner or his or her
representative not below the rank of an Additional District Magistrate assisted by a
representative of SPCB or UTPCC, shall supervise and preside over the entire public
hearing process.
The SPCB or UTPCC shall arrange to video film the entire proceedings. A copy of
the videotape or a CD shall be enclosed with the public hearing proceedings while
forwarding it to the Regulatory Authority concerned.
The attendance of all those who are present at the venue shall be noted and annexed
with the final proceedings
There shall be no quorum required for attendance for starting the proceedings
Persons present at the venue shall be granted the opportunity to seek information or
clarifications on the project from the Proponent. The summary of the public hearing
proceedings accurately reflecting all the views and concerns expressed shall be
recorded by the representative of the SPCB or UTPCC and read over to the audience
at the end of the proceedings explaining the contents in the local/vernacular language
and the agreed minutes shall be signed by the District Magistrate/District
Collector/Deputy Commissioner or his or her representative on the same day and
forwarded to the SPCB/UTPCC concerned.

Operational Aspects of EIA
TGM for Pulp and Paper Industry 4-52 August 2010
A statement of the issues raised by the public and the comments of the proponent
shall also be prepared in the local language or the official State language, as the case
may be and in English and annexed to the proceedings.
The proceedings of the public hearing shall be conspicuously displayed at the office
of the Panchayats within whose jurisdiction the project is located, office of the
concerned Zilla Parishad, District Magistrate/District Collector/Deputy
Commissioner, and the SPCB or UTPCC. The SPCB or UTPCC shall also display
the proceedings on its website for general information. Comments, if any, on the
proceedings, may be sent directly to the concerned regulatory authorities and the
Applicant concerned.
The public hearing shall be completed within a period of 45 (forty five) days from
date of receipt of the request letter from the Applicant. Therefore the SPCB or
UTPCC concerned shall send the public hearing proceedings to the concerned
regulatory authority within eight (8) days of the completion of the public hearing.
Simultaneously, a copy will also be provided to the project proponent. The
proponent may also directly forward a copy of the approved public hearing
proceedings to the regulatory authority concerned along with the final EIA report or
supplementary report to the draft EIA report prepared after the public hearing and
public consultations incorporating the concerns expressed in the public hearing along
with action plan and financial allocation, item-wise, to address those concerns.
Upon receipt of the same, the Authority will place executive summary of the report
on the website to invite responses from other concerned persons having a plausible
stake in the environmental aspects of the project or activity.
If SPCB/UTPCC is unable to conduct public hearing in the prescribed time, the
Central Government incase of Category A projects and State Government or UT
administration in case of Category B projects at the request of the SEIAA may engage
any other agency or Authority for conducting the public hearing process within a
further period of 45 days. The respective governments shall pay the appropriate fee
to the public agency for conducting public hearing.
A public agency means a non-profit making institution/ body such as
technical/academic institutions, government bodies not subordinate to the concerned
Authority.
If SPCB/Public Agency authorized for conducting public hearing informs the
Authority, stating that it is not possible to conduct the public hearing in a manner,
which will enable the views of the concerned local persons to be freely expressed,
then Authority may consider such report to take a decision that in such particular
case, public consultation may not have the component of public hearing.
Often restricting the public hearing to the specific district may not serve the entire
purpose, therefore, NGOs who are local and registered under the Societies Act in the
adjacent districts may also be allowed to participate in public hearing, if they so
desire.
Confidential information including non-disclosable or legally privileged information
involving intellectual property right, source specified in the application shall not be
placed on the website.
The Authority shall make available on a written request from any concerned person
the draft EIA report for inspection at a notified place during normal office hours till
the date of the public hearing.

Operational Aspects of EIA
TGM for Pulp and Paper Industry 4-53 August 2010
While mandatory requirements will have to be adhered to, utmost attention shall be
given to the issues raised in the public hearing for determining the modifications
needed in the project proposal and the EMP to address such issues.
Final EIA report after making needed amendments, as aforesaid, shall be submitted
by the applicant to the concerned Authority for prior environmental clearance.
Alternatively, a supplementary report to draft EIA and EMP addressing all concerns
expressed during the public consultation may be submitted.
4.11 Appraisal
Appraisal means the detailed scrutiny by the EAC/SEAC of the application and the other
documents like the final EIA report, outcome of the public consultation including public
hearing proceedings submitted by the applicant for grant of environmental clearance.
The appraisal shall be made by EAC to the Central Government or SEAC to SEIAA.
Project proponent either personally or through consultant can make a presentation to
EAC/SEAC for the purpose of appraising the features of the project proposal and also
to clarify the issues raised by the members of the EAC/SEAC.
On completion of these proceedings, concerned EAC/SEAC shall make categorical
recommendations to the respective Authority, either for grant of prior environmental
clearance on stipulated terms & conditions, if any, or rejection of the application with
reasons.
In case EAC/SEAC needs to visit the site or obtain further information before being
able to make categorical recommendations, EAC/SEAC may inform the project
proponent accordingly. In such an event, it should be ensured that the process of
environmental clearance is not unduly delayed to go beyond the prescribed
timeframe.
Up on the scrutiny of the final report, if EAC/SEAC opines that ToR for EIA studies
finalized at the scoping stage are covered by the proponent, then the project
proponent may be asked to provide such information. If such information is declined
by the project proponent or is unlikely to be provided early enough so as to complete
the environmental appraisal within prescribed time of 60 days, the EAC/SEAC may
recommend for rejection of the proposal with the same reason.
Appraisal shall be strictly in terms of ToR for EIA studies finalized at the scoping
stage and the concerns expressed during public consultation.
This process of appraisal shall be completed within 60 days from the receipt of the
updated EIA and EMP reports, after completing public consultation.
The EIA report will be typically examined for following:
– Project site description supported by topographic maps & photographs – detailed
description of topography, land use and activities at the proposed project site and
its surroundings (buffer zone) supported by photographic evidence.
– Clarity in description of drainage pattern, location of eco-sensitive areas,
vegetation characteristics, wildlife status - highlighting significant environmental
attributes such as feeding, breeding and nesting grounds of wildlife species,
migratory corridor, wetland, erosion and neighboring issues.
– Description of the project site – how well the interfaces between the project
related activities and the environment have been identified for the entire project
Operational Aspects of EIA
TGM for Pulp and Paper Industry 4-54 August 2010
cycle i.e. construction, operation and decommissioning at the end of the project
life.
– How complete and authentic are the baseline data pertaining to flora and fauna
and socio economic aspects?
– Citing of proper references, with regard to the source(s) of baseline data as well
as the name of the investigators/ investigating agency responsible for collecting
the primary data.
– How consistent are the various values of environmental parameters with respect
to each other?
– Is a reasonable assessment of the environmental and social impact made for the
identified environmental issues including project affected people?
– To what extent the proposed environmental plan will mitigate the environmental
impact and at what estimated cost, shown separately for construction, operation
and closure stages and also separately in terms of capital and recurring expenses
along with details of agencies that will be responsible for the implementation of
environmental plan/conservation plan.
– How well the concerns expressed/highlighted during the public hearing have been
addressed and incorporated in the EMP giving item wise financial provisions and
commitments (in quantified terms)?
– How far the proposed environmental monitoring plan will effectively evaluate the
performance of EMP? Are details for environmental monitoring plan provided in
the same manner as the EMP?
– Identification of hazard and quantification of risk assessment and whether
appropriate mitigation plan has been included in the EMP?
– Does the proposal include a well formulated time bound green belt development
plan for mitigating environmental problems such as fugitive emission of dust,
gaseous pollutants, noise, odour, etc.
– Does EIA makes a serious attempt to guide the project proponent for minimizing
the requirement of natural resources including land, water energy and other non
renewable resources?
– How well has the EIA statement been organized and presented so that the issues,
their impact and environmental management strategies emerge clearly from it and
how well organized was the power point presentation made before the expert
committee?
– Is the information presented in the EIA adequately and appropriately supported
by maps, imageries and photographs highlighting site features and environmental
attributes?
4.12 Decision Making
The Chairperson reads the sense of the Committee and finalizes the draft minutes of the
meeting, which are circulated by the Secretary to all expert members invited to the
meeting. Based on the response from the members, the minutes are finalized and signed
by the Chairperson. This process for finalization of the minutes should be so organized
that the time prescribed for various stages is not exceeded.
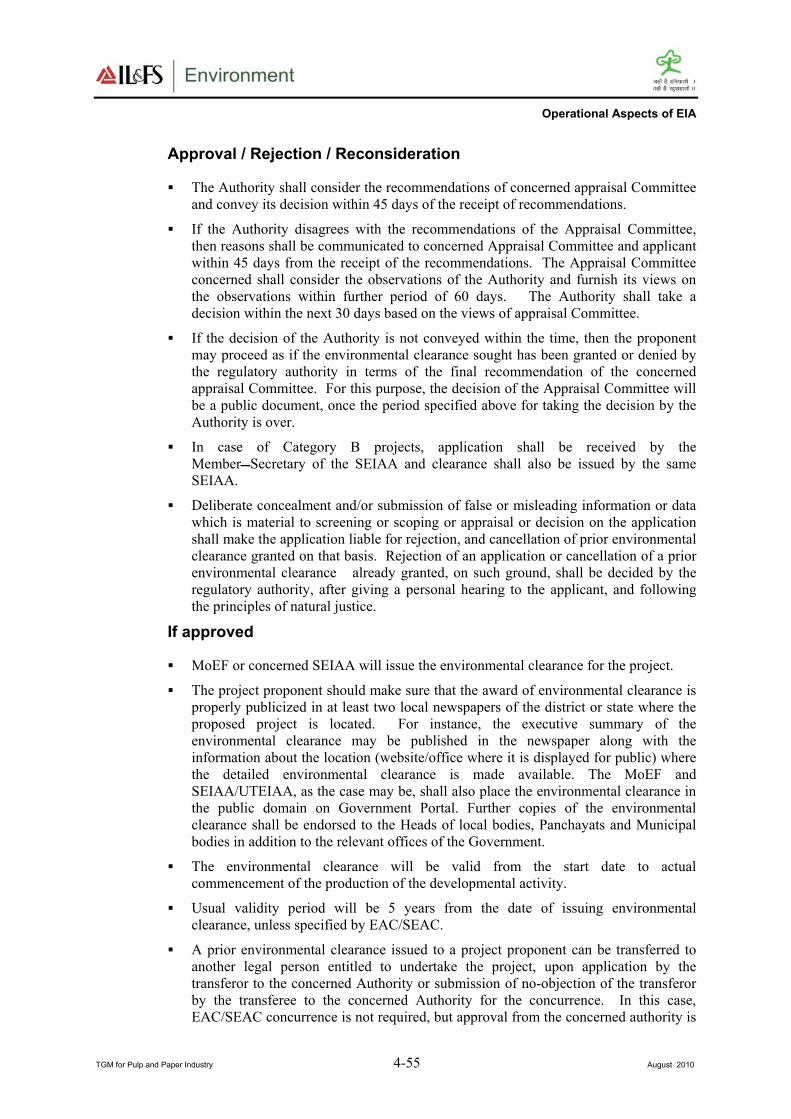
Operational Aspects of EIA
TGM for Pulp and Paper Industry 4-55 August 2010
Approval / Rejection / Reconsideration
The Authority shall consider the recommendations of concerned appraisal Committee
and convey its decision within 45 days of the receipt of recommendations.
If the Authority disagrees with the recommendations of the Appraisal Committee,
then reasons shall be communicated to concerned Appraisal Committee and applicant
within 45 days from the receipt of the recommendations. The Appraisal Committee
concerned shall consider the observations of the Authority and furnish its views on
the observations within further period of 60 days. The Authority shall take a
decision within the next 30 days based on the views of appraisal Committee.
If the decision of the Authority is not conveyed within the time, then the proponent
may proceed as if the environmental clearance sought has been granted or denied by
the regulatory authority in terms of the final recommendation of the concerned
appraisal Committee. For this purpose, the decision of the Appraisal Committee will
be a public document, once the period specified above for taking the decision by the
Authority is over.
In case of Category B projects, application shall be received by the
MemberSecretary of the SEIAA and clearance shall also be issued by the same
SEIAA.
Deliberate concealment and/or submission of false or misleading information or data
which is material to screening or scoping or appraisal or decision on the application
shall make the application liable for rejection, and cancellation of prior environmental
clearance granted on that basis. Rejection of an application or cancellation of a prior
environmental clearance already granted, on such ground, shall be decided by the
regulatory authority, after giving a personal hearing to the applicant, and following
the principles of natural justice.
If approved
MoEF or concerned SEIAA will issue the environmental clearance for the project.
The project proponent should make sure that the award of environmental clearance is
properly publicized in at least two local newspapers of the district or state where the
proposed project is located. For instance, the executive summary of the
environmental clearance may be published in the newspaper along with the
information about the location (website/office where it is displayed for public) where
the detailed environmental clearance is made available. The MoEF and
SEIAA/UTEIAA, as the case may be, shall also place the environmental clearance in
the public domain on Government Portal. Further copies of the environmental
clearance shall be endorsed to the Heads of local bodies, Panchayats and Municipal
bodies in addition to the relevant offices of the Government.
The environmental clearance will be valid from the start date to actual
commencement of the production of the developmental activity.
Usual validity period will be 5 years from the date of issuing environmental
clearance, unless specified by EAC/SEAC.
A prior environmental clearance issued to a project proponent can be transferred to
another legal person entitled to undertake the project, upon application by the
transferor to the concerned Authority or submission of no-objection of the transferor
by the transferee to the concerned Authority for the concurrence. In this case,
EAC/SEAC concurrence is not required, but approval from the concerned authority is

Operational Aspects of EIA
TGM for Pulp and Paper Industry 4-56 August 2010
required to avail the same project configurations, validity period transferred to the
new legally entitled person to undertake the project.
4.13 Post-clearance Monitoring Protocol
The MoEF, Government of India will monitor and take appropriate action under the EP
Act, 1986.
In respect of Category A projects, it shall be mandatory for the project proponent to
make public the environmental clearance granted for their project along with the
environmental conditions and safeguards at their cost by advertising it at least in two
local newspapers of the district or State where the project is located and in addition,
this shall also be displayed in the project proponents website permanently.
In respect of Category B projects, irrespective of its clearance by MoEF/SEIAA, the
project proponent shall prominently advertise in the newspapers indicating that the
project has been accorded environment clearance and the details of MoEF website
where it is displayed.
MoEF and the SEIAA/UTEIAA, as the case may be, shall also place the
environmental clearance in the public domain on Government Portal.
Copies of environmental clearance shall be submitted by the project proponents to the
Heads of the local bodies, Panchayats and Municipal bodies in addition to the
relevant offices of the Government who in turn have to display the same for 30 days
from the date of receipt.
The project proponent must submit half-yearly compliance reports in respect of the
stipulated prior environmental clearance terms and conditions in hard and soft copies to
the regulatory authority concerned, on 1st June and 1st December of each calendar year.
All such compliance reports submitted by the project management shall be public
documents. Copies of the same shall be given to any person on application to the
concerned regulatory authority. Such latest compliance report shall also be displayed on
the web site of the concerned regulatory Authority.
The SPCB shall incorporate EIA clearance conditions into consent conditions in respect
of Category A and Category B projects and in parallel shall monitor and enforce the
same.

Stakeholders’ Roles and Responsibilities
TGM for Pulp and Paper Industry 5-1 August 2010
5. STAKEHOLDERS’ ROLES AND RESPONSIBILITIES
Prior environmental clearance process involves many stakeholders i.e., Central
Government, State Government, SEIAA, EAC at the National Level, SEAC, Public
Agency, SPCB, the project proponent, and the public.
Roles and responsibilities of the organizations involved in different stages of prior
environmental clearance are listed in Table 5-1.
Organization-specific functions are listed in Table 5-2.
In this Chapter, constitution, composition, functions, etc., of the Authorities and the
Committees are discussed in detail.
Table 5-1: Roles and Responsibilities of Stakeholders Involved in Prior Environmental Clearance
STAGE MoEF/
SEIAA
EAC/
SEAC
PROJECT
PROPONENT
EIA
CONSULTANT
SPCB/
PUBLIC
AGENCY
PUBLIC
AND
INTEREST
GROUP
Screening Receives
application
and takes
advice of
EAC/
SEAC
Advises the
MoEF/
SEIAA
Submits
application
(Form 1) and
provides
necessary
information
Advises and
assists the
proponent by
providing
technical
information
Scoping Approves
the ToR,
communic
ates the
same to
the project
proponent
and places
the same
in the
website
Reviews
the ToR,
visits the
proposed
site, if
required
and
recommend
s the ToR
to the
MoEF/
SEIAA
Submits the
draft ToR to
SEIAA and
facilitates the
visit of the
EAC/SEAC
members to the
project site
Prepares ToR
EIA Report
& Public
Hearing
Reviews
and
forwards
copies of
the EIA
report to
SPCB
/public
agency for
conducting
public
hearing
Submits
detailed EIA
report as per the
finalized ToR
Facilitates the
public hearing
by arranging
presentation on
the project, EIA
and EMP –
takes note of
objections and
Prepares the EIA
report
Presents and
appraises the
likely impacts
and pollution
control measures
proposed in the
public hearing
Reviews
EIA report
and
conducts
public
hearing in
the manner
prescribed
Submits
proceeding
s and
views of
Participates
in public
hearings and
offers
comments
and
observations
.
Comments
can be sent
directly to
SEIAA

Stakeholders’ Roles and Responsibilities
TGM for Pulp and Paper Industry 5-2 August 2010
Places the
summary
of EIA
report in
the website
Conveys
objections
to the
project
proponent
for update,
if any
updates the
EMP
accordingly
SPCB, to
the
Authority
and the
project
proponent
as well
through
Internet in
response to
the summary
placed in the
website
Appraisal
and
Clearance
Receives
updated
EIA
Takes
advice of
EAC/
SEAC,
approves
EIA and
attaches
the terms
and
conditions
Critically
examines
the reports,
presentation
of the
proponent
and
appraises
MoEF/
SEIAA
(recommen
dations are
forwarded
to MoEF/
SEIAA)
Submits
updated EIA,
EMP reports to
MoEF/SEIAA.
Presents the
overall EIA and
EMP including
public concerns
to EAC/SEAC
Provides
technical advise
to the project
proponent and if
necessary
presents the
proposed
measures for
mitigation of
likely impacts
(terms and
conditions of
clearance)
Post-
clearance
Monitoring
Implements
environmental
protection
measures
prescribed and
submits
periodic
monitoring
results
Conducts
periodic
monitoring
Incorporate
s the
clearance
conditions
into
appropriate
consent
conditions
and
ensures
implement
ation
Table 5-2: Organization-specific Functions
Organization Functions
Central
Government
Constitutes the EAC
Considering recommendations of the State Government, constitutes the SEIAA &
SEAC
Receives application from the project proponent in case of Category A projects or
Category B projects attracting general condition
Communicates the ToR finalized by the EAC to the project proponent.
Receives EIA report from the project proponent and soft copy of summary of the
report for placing in the website
Summary of EIA report will be placed in website. Forwards the received responses
to the project proponent
Engages other public agency for conducting public hearings in cases where the

Stakeholders’ Roles and Responsibilities
TGM for Pulp and Paper Industry 5-3 August 2010
Organization Functions
SPCB does not respond within time
Receives updated EIA report from project proponent incorporating the
considerations from the proceedings of public hearing and responses received
through other media
Forwards updated EIA report to the EAC for appraisal
Either accepts the recommendations of EAC or asks for reconsideration of specific
issues for review by the EAC.
Takes the final decision – acceptance/ rejection – of the project proposal and
communicates the same to the project proponent
State Government Identifies experts as per the composition specified in the Notification and
subsequent guidelines to recommend to the the Central Government.
Extends funding support to fulfill the functions of SEIAA/SEAC
Engages other public agency for conducting public hearings in cases where the
SPCB does not respond within time
State Governments will suitably pay the public agency for conducting such activity
EAC Reviews Form 1 and its attachments
Visits site(s), if necessary
Finalizes ToR and recommends to the Central Government, which in turn
communicates the finalized ToR to the project proponent, if not exempted by the
Notification
Reviews EIA report, proceedings and appraises their views to the Central
government
If the Central Government has any specific views, then the EAC reviews again for
appraisal
SEIAA Receives application from the project proponent
Considers SEAC’s views for finalization of ToR
Communicates the finalized ToR to the project proponent
Receives EIA report from project proponent
Uploads the summary of EIA report in the website in cases of Category B projects
Forwards the responses received to the project proponent
Receives updated EIA report from project proponent incorporating the
considerations from the proceedings of public hearing and responses received
through other media
Forwards updated EIA report to SEAC for appraisal
Either accepts the recommendations of SEAC or asks for reconsideration of
specific issues for review by SEAC.
Takes the final decision and communicates the same to the project proponent
SEAC Reviews Form 1
If necessary visits, site(s) for finalizing the ToR
Reviews updated EIA - EMP report and
Appraises the SEIAA
SPCB Receives request from project proponent and conducts public hearing in the manner
prescribed.
Conveys proceedings to concerned authority and project proponent
Public Agency Receives request from the respective Governments to conduct public hearing
Conducts public hearing in the manner prescribed.
Conveys proceedings to the concerned Authority/EAC /Project proponent

Stakeholders’ Roles and Responsibilities
TGM for Pulp and Paper Industry 5-4 August 2010
5.1 SEIAA
SEIAA is constituted by the MoEF to take final decision regarding the
acceptance/rejection of prior environmental clearance to the project proposal for all
Category ‘B’ projects.
The state government may decide whether to house them at the Department of
Environment or at any other Board for effective operational support.
State Governments can decide whether the positions are permanent or part-time. The
Central Government (MoEF) continues to follow the model of paying fee (TA/DA,
accommodation, sitting fee) to the Chairperson and the members of EAC. As such,
the State Government is to fund SEIAA & SEAC and decide the appropriate
institutional support for them.
A. Constitution
SEIAA is constituted by the Central Government comprising of three members
including a Chairperson and MemberSecretary to be nominated by the State
Government or UT Administration concerned.
The Central Government will notify as and when the nominations (in order) are
received from the State Governments, within 30 days from the date of receipt.
The Chairperson and the non-official member shall have a fixed term of three years,
from the date of Notification by the Central Government constituting the Authority.
The form used by the State Governments to submit nominations for Notification by the
Central Government is provided in Annexure X.
B. Composition
Chairperson shall be an expert in the EIA process
MemberSecretary shall be a serving officer of the concerned State Government/ UT
Administration familiar with the environmental laws.
MemberSecretary may be of a level equivalent to the Director, Dept. of
Environment or above – a full time member.
All the members including the Chairperson shall be the experts as per the criteria set
in the Notification.
The Government servants can only serve as the MemberSecretary to SEIAA and the
Secretary to SEAC. All other members including Chairperson of the SEIAA and
SEAC shall not be comprised of serving Government Officers; industry
representatives; and the activists.
Serving faculty (academicians) is eligible for the membership in the Authority and/or
the Committees, if they fulfill the criteria given in Appendix VI to the Notification.
This is to clarify that the serving Government officers shall not be nominated as
professional/expert member of SEIAA/SEAC/EAC.
Professionals/Experts in the SEIAA and SEAC shall be different.
Summary regarding the eligibility criteria for Chairperson and Members of the SEIAA is
given in Table 5-3.

Stakeholders’ Roles and Responsibilities
TGM for Pulp and Paper Industry 5-5 August 2010
C. Decision-making process
The decision of the Authority shall be arrived through consensus.
If there is no consensus, the Authority may either ask SEAC for reconsideration or
may reject the approval.
All decisions of the SEIAA shall be taken in a meeting and shall ordinarily be
unanimous. In case a decision is taken by majority, the details of views, for and
against the decision, shall be clearly recorded in the minutes of meeting and a copy
thereof shall be sent to MoEF
Table 5-3: SEIAA: Eligibility Criteria for Chairperson/ Members/ Secretary
S. No.
Attribute
Requirement
Members MemberSecretary Chairperson
1 Professional qualification as
per the Notification
Compulsory Compulsory Compulsory
2
Experience
(Fulfilling any one of a,
b, c)
a Professional
Qualification + 15
years of experience in
one of the expertise
area mentioned in the
Appendix VI
Professional
Qualification + 15
years of experience in
one of the expertise
area mentioned in the
Appendix VI
Professional
Qualification + 15
years of experience in
one of the expertise
area mentioned in the
Appendix VI
b Professional
Qualification +PhD+10
years of experience in
one of the expertise
area mentioned in
Appendix VI
Professional
Qualification
+PhD+10 years of
experience in one of
the expertise area
mentioned in the
Appendix VI
Professional
Qualification
+PhD+10 years of
experience in one of
the expertise area
mentioned in the
Appendix VI
c Professional
Qualification +10 years
of experience in one of
the expertise area
mentioned in the
Appendix VI + 5 years
interface with
environmental issues,
problems and their
management
Professional
Qualification +10
years of experience in
one of the expertise
area mentioned in the
Appendix VI + 5 years
interface with
environmental issues,
problems and their
management
-------------
3
Test of independence (conflict
of interest) and minimum
grade of the Secretary of the
Authority
Shall not be a serving
government officer
Shall not be a person
engaged in industry
and their associations
Shall not be a person
associated with
environmental activism
Only serving officer
from the State
Government (DoE)
familiar with
environmental laws
not below the level of
Director
Shall not be a serving
government officer
Shall not be a person
engaged in industry
and their associations
Shall not be a person
associated with
environmental
activism
4 Age Below 67 years at the
time of Notification of
the Authority
As per State
Government Service
Rules
Below 72 Years at
the time of the
Notification of the
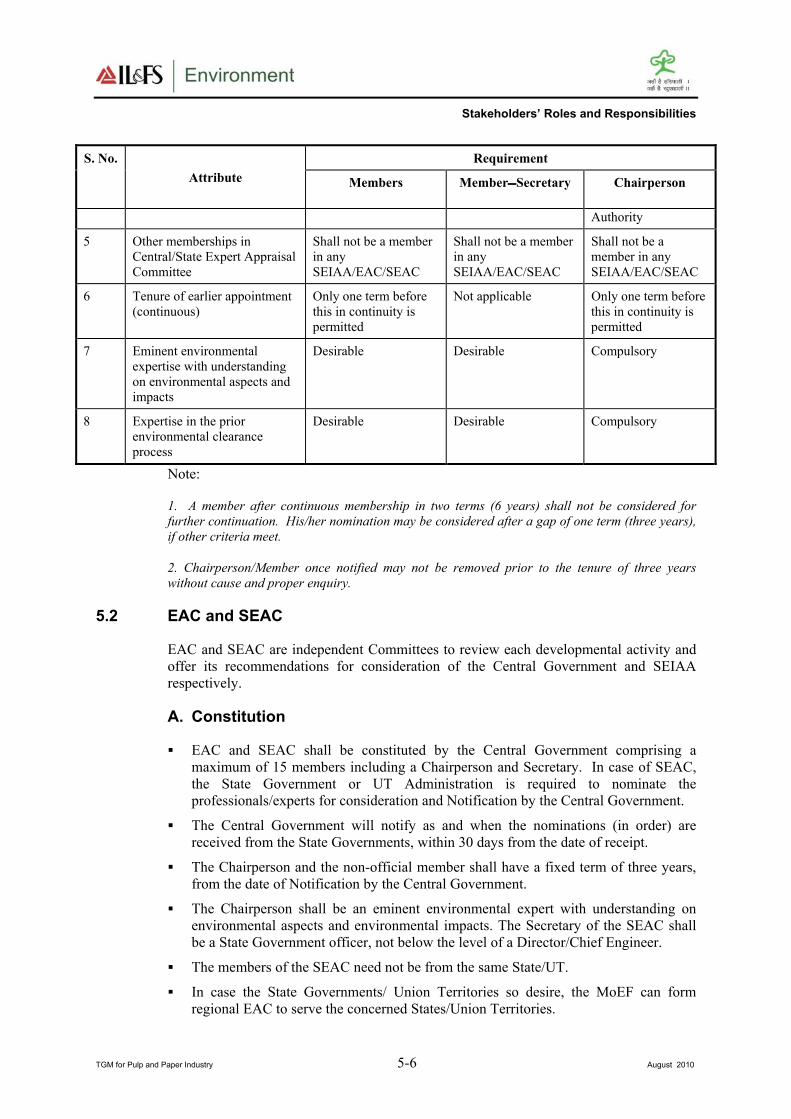
Stakeholders’ Roles and Responsibilities
TGM for Pulp and Paper Industry 5-6 August 2010
S. No.
Attribute
Requirement
Members MemberSecretary Chairperson
Authority
5 Other memberships in
Central/State Expert Appraisal
Committee
Shall not be a member
in any
SEIAA/EAC/SEAC
Shall not be a member
in any
SEIAA/EAC/SEAC
Shall not be a
member in any
SEIAA/EAC/SEAC
6 Tenure of earlier appointment
(continuous)
Only one term before
this in continuity is
permitted
Not applicable Only one term before
this in continuity is
permitted
7 Eminent environmental
expertise with understanding
on environmental aspects and
impacts
Desirable Desirable Compulsory
8 Expertise in the prior
environmental clearance
process
Desirable Desirable Compulsory
Note:
1. A member after continuous membership in two terms (6 years) shall not be considered for
further continuation. His/her nomination may be considered after a gap of one term (three years),
if other criteria meet.
2. Chairperson/Member once notified may not be removed prior to the tenure of three years
without cause and proper enquiry.
5.2 EAC and SEAC
EAC and SEAC are independent Committees to review each developmental activity and
offer its recommendations for consideration of the Central Government and SEIAA
respectively.
A. Constitution
EAC and SEAC shall be constituted by the Central Government comprising a
maximum of 15 members including a Chairperson and Secretary. In case of SEAC,
the State Government or UT Administration is required to nominate the
professionals/experts for consideration and Notification by the Central Government.
The Central Government will notify as and when the nominations (in order) are
received from the State Governments, within 30 days from the date of receipt.
The Chairperson and the non-official member shall have a fixed term of three years,
from the date of Notification by the Central Government.
The Chairperson shall be an eminent environmental expert with understanding on
environmental aspects and environmental impacts. The Secretary of the SEAC shall
be a State Government officer, not below the level of a Director/Chief Engineer.
The members of the SEAC need not be from the same State/UT.
In case the State Governments/ Union Territories so desire, the MoEF can form
regional EAC to serve the concerned States/Union Territories.

Stakeholders’ Roles and Responsibilities
TGM for Pulp and Paper Industry 5-7 August 2010
State Governments may decide to their convenience to house SEAC at the
Department of Environment or at SPCB or at any other department, to extend support
to the SEAC activities.
B. Composition
Composition of EAC/SEAC as per the Notification is given in Annexure XI.
Secretary to EAC/SEAC may invite a maximum of two professionals/experts with the
prior approval of the Chairperson, if desired, for taking the advisory inputs for
appraisal. In such case, the invited experts will not take part in the decision making
process.
The Secretary of each EAC/SEAC preferably be an officer of the level equivalent to
or above the level of Director, MoEF, GoI.
C. Decision making
The EAC and SEAC shall function on the principle of collective responsibility. The
Chairperson shall endeavour to reach a consensus in each case, and if consensus cannot
be reached, the view of the majority shall prevail.
D. Operational issues
Secretary may deal with all correspondence, formulate agenda and prepare agenda
notes. Chairperson and other members may act only for the meetings.
Chairperson of EAC/SEAC shall be one among the expert members having
considerable professional experience with proven credentials.
EAC/SEAC shall meet at least once every month or more frequently, if so needed, to
review project proposals and to offer recommendations for the consideration of the
Authority.
EAC/SEAC members may inspect the site at various stages i.e. during screening,
scoping and appraisal, as per the need felt and decided by the Chairperson of the
Committee.
The respective Governments through the Secretary of the Committee may
pay/reimburse the participation expenses, honorarium etc., to the Chairperson and
members.
i. Tenure of EAC/SEIAA/SEAC
The tenure of Authority/Committee(s) shall be for a fixed period of three years. At the
end of the three years period, the Authority and the committees need to be re-constituted.
However, staggered appointment dates may be adopted to maintain continuity of
members at a given point of time.
ii. Qualifying criteria for nomination of a member to EAC/SEIAA/SEAC
While recommending nominations and while notifying the members of the Authority and
Expert Committees, it shall be ensured that all the members meet the following three
criteria:
Professional qualification
Relevant experience/Experience interfacing with environmental management
Absence of conflict of interest

Stakeholders’ Roles and Responsibilities
TGM for Pulp and Paper Industry 5-8 August 2010
These are elaborated subsequently.
a) Professional qualification
The person should have at least (i) 5 years of formal University training in the concerned
discipline leading to a MA/MSc Degree, or (ii) in case of Engineering/Technology/
Architecture disciplines, 4 years formal training in a professional training course together
with prescribed practical training in the field leading to a B.Tech/B.E./B.Arch. Degree, or
(iii) Other professional degree (e.g. Law) involving a total of 5 years of formal University
training and prescribed practical training, or (iv) Prescribed apprenticeship/articleship and
pass examinations conducted by the concerned professional association (e.g.
MBA/IAS/IFS). In selecting the individual professionals, experience gained by them in
their respective fields will be taken note of.
b) Relevant experience
Experience shall be related to professional qualification acquired by the person and be
related to one or more of the expertise mentioned for the expert members. Such
experience should be a minimum of 15 years.
When the experience mentioned in the foregoing sub-paragraph interfaces with
environmental issues, problems and their management, the requirement for the length
of the experience can be reduced to a minimum of 10 years.
c) Absence of conflict of interest
For the deliberations of the EAC/SEAC to be independent and unbiased, all possibilities
of potential conflict of interests have to be eliminated. Therefore, serving government
officers; persons engaged in industry and their associations; persons associated with the
formulation of development projects requiring prior environmental clearance, and persons
associated with environmental activism shall not be considered for membership of
SEIAA/ SEAC/ EAC.
iii. Age
Below 70 years for the members and below 72 years for the Chairperson of the
SEIAA/SEAC/EAC. The applicability of the age is at the time of the Notification of the
SEIAA/SEAC/EAC by the Central Government.
Summary regarding the eligibility criteria for Chairperson and Members of the
EAC/SEAC is given in Table 5-4.
Table 5-4: EAC/SEAC: Eligibility Criteria for Chairperson / Members / Secretary
S.
No.
Attribute
Requirement
Expert members Secretary Chairperson
1 Professional
qualification as per
the Notification
Compulsory Compulsory Compulsory
2
Experience
(Fulfilling any
one of a, b, c)
a Professional
Qualification + 15
years of experience in
one of the expertise
area mentioned in the
Appendix VI
Professional
Qualification + 15 years
of experience in one of
the expertise area
mentioned in the
Appendix VI
Professional
Qualification + 15
years of experience in
one of the expertise
area mentioned in the
Appendix VI
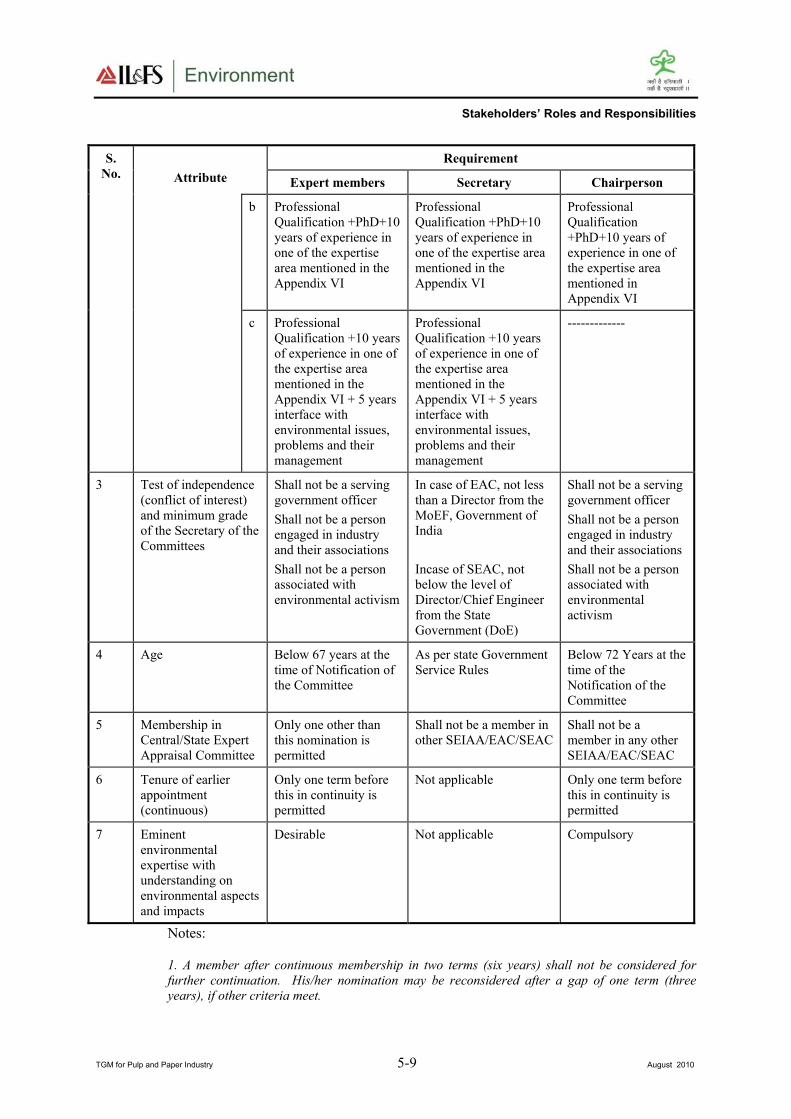
Stakeholders’ Roles and Responsibilities
TGM for Pulp and Paper Industry 5-9 August 2010
S.
No.
Attribute
Requirement
Expert members Secretary Chairperson
b Professional
Qualification +PhD+10
years of experience in
one of the expertise
area mentioned in the
Appendix VI
Professional
Qualification +PhD+10
years of experience in
one of the expertise area
mentioned in the
Appendix VI
Professional
Qualification
+PhD+10 years of
experience in one of
the expertise area
mentioned in
Appendix VI
c Professional
Qualification +10 years
of experience in one of
the expertise area
mentioned in the
Appendix VI + 5 years
interface with
environmental issues,
problems and their
management
Professional
Qualification +10 years
of experience in one of
the expertise area
mentioned in the
Appendix VI + 5 years
interface with
environmental issues,
problems and their
management
-------------
3
Test of independence
(conflict of interest)
and minimum grade
of the Secretary of the
Committees
Shall not be a serving
government officer
Shall not be a person
engaged in industry
and their associations
Shall not be a person
associated with
environmental activism
In case of EAC, not less
than a Director from the
MoEF, Government of
India
Incase of SEAC, not
below the level of
Director/Chief Engineer
from the State
Government (DoE)
Shall not be a serving
government officer
Shall not be a person
engaged in industry
and their associations
Shall not be a person
associated with
environmental
activism
4 Age Below 67 years at the
time of Notification of
the Committee
As per state Government
Service Rules
Below 72 Years at the
time of the
Notification of the
Committee
5 Membership in
Central/State Expert
Appraisal Committee
Only one other than
this nomination is
permitted
Shall not be a member in
other SEIAA/EAC/SEAC
Shall not be a
member in any other
SEIAA/EAC/SEAC
6 Tenure of earlier
appointment
(continuous)
Only one term before
this in continuity is
permitted
Not applicable Only one term before
this in continuity is
permitted
7 Eminent
environmental
expertise with
understanding on
environmental aspects
and impacts
Desirable Not applicable Compulsory
Notes:
1. A member after continuous membership in two terms (six years) shall not be considered for
further continuation. His/her nomination may be reconsidered after a gap of one term (three
years), if other criteria meet.

Stakeholders’ Roles and Responsibilities
TGM for Pulp and Paper Industry 5-10 August 2010
2. Chairperson/Member once notified may not be removed prior to the tenure of 3 years with out
cause and proper enquiry. A member after continuous membership in two terms (6 years) shall not
be considered for further continuation. The same profile may be considered for nomination after a
gap of three years, i.e., one term, if other criteria are meeting.
E. Other conditions that may be considered
An expert member of one State/UT, can have at the most another State/UT
Committee membership, but in no case more than two Committees at a given point of
time.
An expert member of a Committee shall not have membership continuously in the
same committee for more than two terms, i.e., six years. They can be nominated after
a gap of three years, i.e., one term. When a member of Committee has been
associated with any development project, which comes for prior environmental
clearance, he/she may not participate in the deliberations and the decisions in respect
to that particular project.
At least four members shall be present in each meeting to fulfill the quorum
If a member does not consecutively attend six meetings, without prior intimation to
the Committee his/her membership may be terminated by the Notifying Authority.
Prior information for absence due to academic pursuits, career development and
national/state-endorsed programmes may be considered as genuine grounds for
retention of membership.

ANNEXURE I A Compilation of Legal Instruments
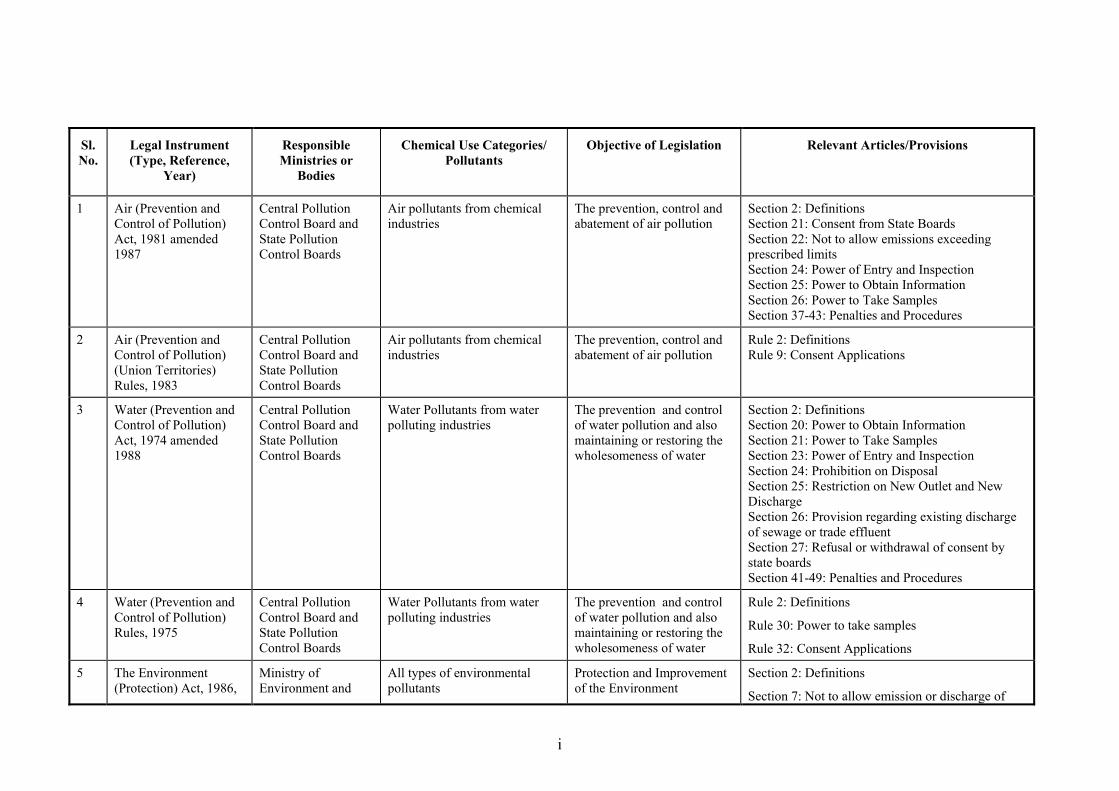
i
Sl.
No.
Legal Instrument
(Type, Reference,
Year)
Responsible
Ministries or
Bodies
Chemical Use Categories/
Pollutants
Objective of Legislation Relevant Articles/Provisions
1 Air (Prevention and
Control of Pollution)
Act, 1981 amended
1987
Central Pollution
Control Board and
State Pollution
Control Boards
Air pollutants from chemical
industries
The prevention, control and
abatement of air pollution
Section 2: Definitions
Section 21: Consent from State Boards
Section 22: Not to allow emissions exceeding
prescribed limits
Section 24: Power of Entry and Inspection
Section 25: Power to Obtain Information
Section 26: Power to Take Samples
Section 37-43: Penalties and Procedures
2 Air (Prevention and
Control of Pollution)
(Union Territories)
Rules, 1983
Central Pollution
Control Board and
State Pollution
Control Boards
Air pollutants from chemical
industries
The prevention, control and
abatement of air pollution
Rule 2: Definitions
Rule 9: Consent Applications
3 Water (Prevention and
Control of Pollution)
Act, 1974 amended
1988
Central Pollution
Control Board and
State Pollution
Control Boards
Water Pollutants from water
polluting industries
The prevention and control
of water pollution and also
maintaining or restoring the
wholesomeness of water
Section 2: Definitions
Section 20: Power to Obtain Information
Section 21: Power to Take Samples
Section 23: Power of Entry and Inspection
Section 24: Prohibition on Disposal
Section 25: Restriction on New Outlet and New
Discharge
Section 26: Provision regarding existing discharge
of sewage or trade effluent
Section 27: Refusal or withdrawal of consent by
state boards
Section 41-49: Penalties and Procedures
4 Water (Prevention and
Control of Pollution)
Rules, 1975
Central Pollution
Control Board and
State Pollution
Control Boards
Water Pollutants from water
polluting industries
The prevention and control
of water pollution and also
maintaining or restoring the
wholesomeness of water
Rule 2: Definitions
Rule 30: Power to take samples
Rule 32: Consent Applications
5 The Environment
(Protection) Act, 1986,
Ministry of
Environment and
All types of environmental
pollutants
Protection and Improvement
of the Environment
Section 2: Definitions
Section 7: Not to allow emission or discharge of
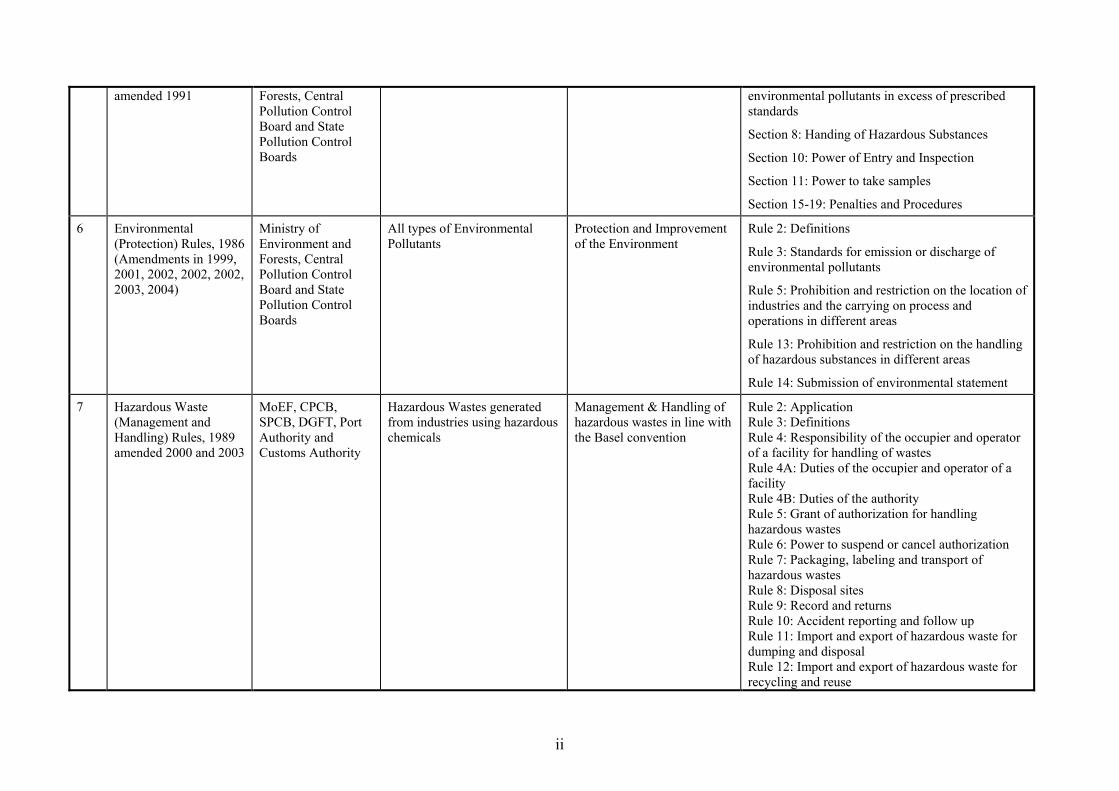
ii
amended 1991 Forests, Central
Pollution Control
Board and State
Pollution Control
Boards
environmental pollutants in excess of prescribed
standards
Section 8: Handing of Hazardous Substances
Section 10: Power of Entry and Inspection
Section 11: Power to take samples
Section 15-19: Penalties and Procedures
6 Environmental
(Protection) Rules, 1986
(Amendments in 1999,
2001, 2002, 2002, 2002,
2003, 2004)
Ministry of
Environment and
Forests, Central
Pollution Control
Board and State
Pollution Control
Boards
All types of Environmental
Pollutants
Protection and Improvement
of the Environment
Rule 2: Definitions
Rule 3: Standards for emission or discharge of
environmental pollutants
Rule 5: Prohibition and restriction on the location of
industries and the carrying on process and
operations in different areas
Rule 13: Prohibition and restriction on the handling
of hazardous substances in different areas
Rule 14: Submission of environmental statement
7 Hazardous Waste
(Management and
Handling) Rules, 1989
amended 2000 and 2003
MoEF, CPCB,
SPCB, DGFT, Port
Authority and
Customs Authority
Hazardous Wastes generated
from industries using hazardous
chemicals
Management & Handling of
hazardous wastes in line with
the Basel convention
Rule 2: Application
Rule 3: Definitions
Rule 4: Responsibility of the occupier and operator
of a facility for handling of wastes
Rule 4A: Duties of the occupier and operator of a
facility
Rule 4B: Duties of the authority
Rule 5: Grant of authorization for handling
hazardous wastes
Rule 6: Power to suspend or cancel authorization
Rule 7: Packaging, labeling and transport of
hazardous wastes
Rule 8: Disposal sites
Rule 9: Record and returns
Rule 10: Accident reporting and follow up
Rule 11: Import and export of hazardous waste for
dumping and disposal
Rule 12: Import and export of hazardous waste for
recycling and reuse
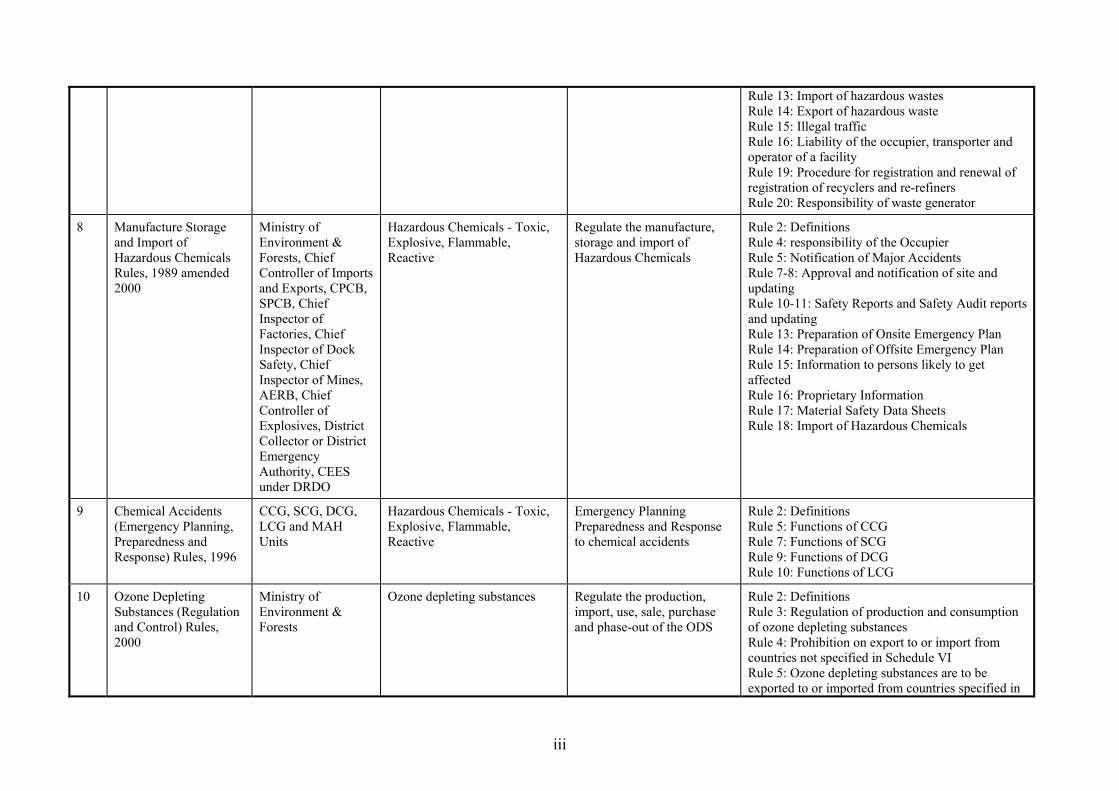
iii
Rule 13: Import of hazardous wastes
Rule 14: Export of hazardous waste
Rule 15: Illegal traffic
Rule 16: Liability of the occupier, transporter and
operator of a facility
Rule 19: Procedure for registration and renewal of
registration of recyclers and re-refiners
Rule 20: Responsibility of waste generator
8 Manufacture Storage
and Import of
Hazardous Chemicals
Rules, 1989 amended
2000
Ministry of
Environment &
Forests, Chief
Controller of Imports
and Exports, CPCB,
SPCB, Chief
Inspector of
Factories, Chief
Inspector of Dock
Safety, Chief
Inspector of Mines,
AERB, Chief
Controller of
Explosives, District
Collector or District
Emergency
Authority, CEES
under DRDO
Hazardous Chemicals - Toxic,
Explosive, Flammable,
Reactive
Regulate the manufacture,
storage and import of
Hazardous Chemicals
Rule 2: Definitions
Rule 4: responsibility of the Occupier
Rule 5: Notification of Major Accidents
Rule 7-8: Approval and notification of site and
updating
Rule 10-11: Safety Reports and Safety Audit reports
and updating
Rule 13: Preparation of Onsite Emergency Plan
Rule 14: Preparation of Offsite Emergency Plan
Rule 15: Information to persons likely to get
affected
Rule 16: Proprietary Information
Rule 17: Material Safety Data Sheets
Rule 18: Import of Hazardous Chemicals
9 Chemical Accidents
(Emergency Planning,
Preparedness and
Response) Rules, 1996
CCG, SCG, DCG,
LCG and MAH
Units
Hazardous Chemicals - Toxic,
Explosive, Flammable,
Reactive
Emergency Planning
Preparedness and Response
to chemical accidents
Rule 2: Definitions
Rule 5: Functions of CCG
Rule 7: Functions of SCG
Rule 9: Functions of DCG
Rule 10: Functions of LCG
10 Ozone Depleting
Substances (Regulation
and Control) Rules,
2000
Ministry of
Environment &
Forests
Ozone depleting substances Regulate the production,
import, use, sale, purchase
and phase-out of the ODS
Rule 2: Definitions
Rule 3: Regulation of production and consumption
of ozone depleting substances
Rule 4: Prohibition on export to or import from
countries not specified in Schedule VI
Rule 5: Ozone depleting substances are to be
exported to or imported from countries specified in

iv
Schedule VI under a license
Rule 6: Regulation of the sale of ozone depleting
substances
Rule 7: Regulation on the purchase of ozone
depleting substances
Rule 8: Regulation on the use of ozone depleting
substance
Rule 9: Prohibition on new investments with ozone
depleting substances
Rule 10: Regulation of import, export and sale of
products made with or containing ozone depleting
substances
Rule 11: Regulation on reclamation and destruction
of ozone depleting substances
Rule 12: Regulation on manufacture, import and
export of compressors
Rule 13: Procedure for registration, cancellation of
registration and appeal against such orders
Rule 14: Monitoring and reporting requirements
11 EIA Notification, 2006 MoEF, SPCB For all the identified
developmental activities in the
notification
Requirement of
environmental clearance
before establishment of or
modernization / expansion of
identified developmental
projects.
Requirements and procedure for seeking
environmental clearance of projects
12 Batteries (Management
and Handling) Rules,
2001.
SPCB, CPCB and
MoEF
Lead Acid Batteries To control the hazardous
waste generation (lead waste)
from used lead acid batteries
Rule 2: Application
Rule 3: Definitions
Rule 4: Responsibilities of manufacturer, importer,
assembler and re-conditioner
Rule 5: Registration of Importers
Rule 7: Responsibilities of dealer
Rule 8: Responsibilities of recycler
Rule 9: Procedure for registration / renewal of
registration of recyclers
Rule 10: Responsibilities of consumer or bulk
consumer
Rule 11: Responsibilities of auctioneer
Rule 14: Computerization of Records and Returns

v
13 Public Liability
Insurance Act, 1991
amended 1992
Ministry of
Environment &
Forests, District
Collector
Hazardous Substances To provide immediate relief
to persons affected by
accident involving hazardous
substances
Section 2: Definitions
Section 3: Liability to give relief in certain cases on
principle of no fault
Section 4: Duty of owner to take out insurance
policy
Section 7A: Establishment of Environmental Relief
Fund
Section 14-18: Penalties and Offences
14 Public Liability
Insurance Rules, 1991
amended 1993
Ministry of
Environment &
Forests, District
Collector
Hazardous Substances To provide immediate relief
to persons affected by
accident involving hazardous
substances and also for
Establishing an
Environmental Relief fund
Rule 2: Definitions
Rule 6: Establishment of administration of fund
Rule 10: Extent of liability
Rule 11: Contribution of the owner to
environmental relief fund
15 Factories Act, 1948 Ministry of Labour,
DGFASLI and
Directorate of
Industrial Safety and
Health/Factories
Inspectorate
Chemicals as specified in the
Table
Control of workplace
environment, and providing
for good health and safety of
workers
Section 2: Interpretation
Section 6: Approval, licensing and registration of
factories
Section 7A: General duties of the occupier
Section 7B: General duties of manufacturers etc., as
regards articles and substances for use in factories
Section 12: Disposal of wastes and effluents
Section 14: Dust and fume
Section 36: Precautions against dangerous fumes,
gases, etc.
Section 37: Explosion or inflammable dust, gas, etc.
Chapter IVA: Provisions relating to Hazardous
processes
Section 87: Dangerous operations
Section 87A: Power to prohibit employment on
account of serious hazard
Section 88: Notice of certain accident
Section 88A: Notice of certain dangerous
occurrences
Chapter X: Penalties and procedures
16 The Calcium Carbide
Rules, 1987
Ministry of
Petroleum and
Natural Gas, Chief
Controller of
Calcium Carbide To regulate the import,
production, storage,
transportation, sale, use and
handling and disposal of
Rule 2: Definitions
Chapter II: General provisions
Chapter III: Importation of Carbide
Chapter IV: Transportation of carbide

vi
Explosives, Customs
Collector, Port
Conservator, DGCA,
District Authority
Calcium carbide with a view
to prevent accidents
Chapter V: Storage of carbide
Chapter VI: Licensing
Chapter VII: Notice of accident
17 The Explosives Act,
1884
Ministry of
Commerce and
Industry
(Department of
Explosives)
Explosive substances as defined
under the Act
To regulate the manufacture,
possession, use, sale,
transport, export and import
of explosives with a view to
prevent accidents
Section 4: Definition
Section 6: Power for Central government to prohibit
the manufacture, possession or importation of
especially dangerous explosives
Section 6B: Grant of Licenses
18 The Explosive Rules,
1983
Ministry of
Commerce and
Industry and Chief
Controller of
Explosives, port
conservator, customs
collector, railway
administration
Explosive substances as defined
under the Act
To regulate the manufacture,
possession, use, sale,
transport, export and import
of explosives with a view to
prevent accidents
Rule 2: Definition
Chapter II: General Provisions
Chapter III: Import and Export
Chapter IV: Transport
Chapter V: Manufacture of explosives
Chapter VI: Possession sale and use
Chapter VII: Licenses
19 The Static and Mobile
Pressure Vessels
(Unfired) Rules, 1981
Ministry of
Commerce and
Industry and Chief
Controller of
Explosives, port
conservator, customs
collector, DGCA,
DC, DM, Police (sub
inspector to
commissioner)
Gases (Toxic, non toxic and
non flammable, non toxic and
flammable, Dissolved
Acetylene Gas, Non toxic and
flammable liquefiable gas other
than LPG, LPG
Regulate the import,
manufacture, design,
installation, transportation,
handling, use and testing of
mobile and static pressure
vessels (unfired) with a view
to prevent accidents
Rule 2: Definition
Chapter III: Storage
Chapter IV: Transport
Chapter V: Licenses
20 The Motor Vehicle Act,
1988
Ministry of
Shipping, Road
Transport and
Highways
Hazardous and Dangerous
Goods
To consolidate and amend
the law relating to motor
vehicles
Section 2: Definition
Chapter II: Licensing of drivers of motor vehicle
Chapter VII: Construction equipment and
maintenance of motor vehicles
21 The Central Motor
Vehicle Rules, 1989
Ministry of
Shipping, Road
Transport and
Highways
Hazardous and Dangerous
Goods
To consolidate and amend
the law relating to motor
vehicles including to regulate
the transportation of
dangerous goods with a view
to prevent loss of life or
Rule 2: Definition
Rule 9: Educational qualification for driver’s of
goods carriages carrying dangerous or hazardous
goods
Rule 129: Transportation of goods of dangerous or
hazardous nature to human life
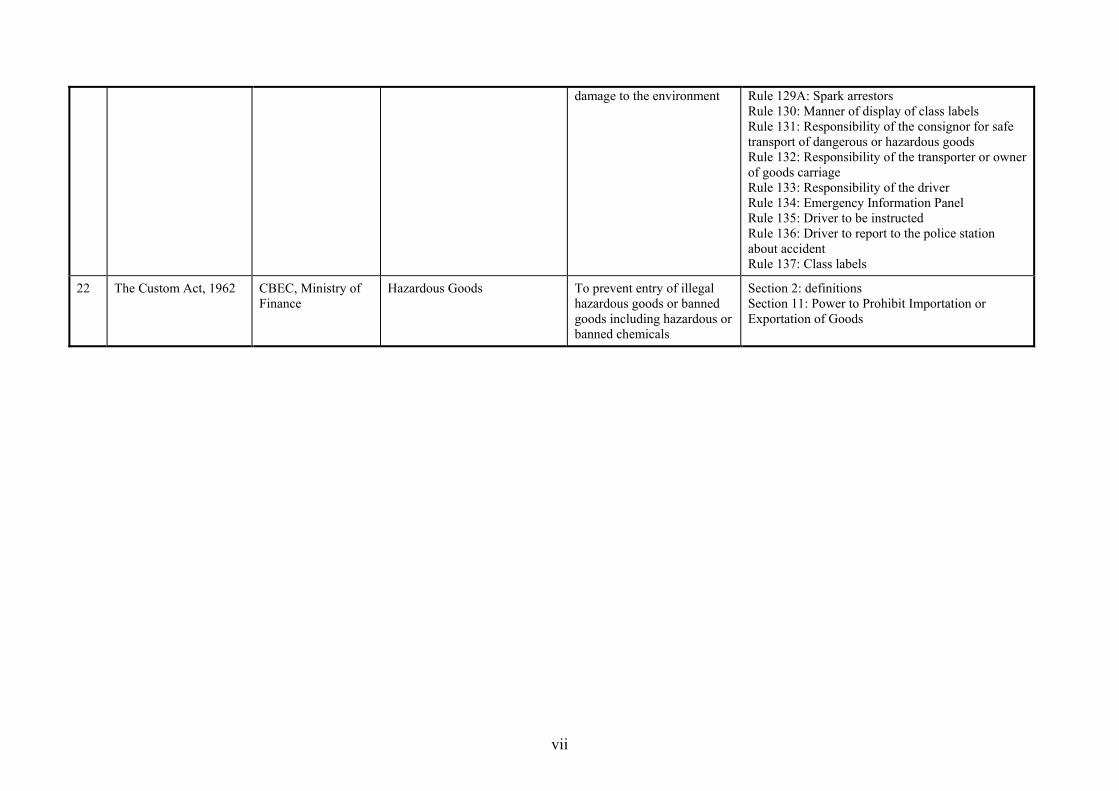
vii
damage to the environment Rule 129A: Spark arrestors
Rule 130: Manner of display of class labels
Rule 131: Responsibility of the consignor for safe
transport of dangerous or hazardous goods
Rule 132: Responsibility of the transporter or owner
of goods carriage
Rule 133: Responsibility of the driver
Rule 134: Emergency Information Panel
Rule 135: Driver to be instructed
Rule 136: Driver to report to the police station
about accident
Rule 137: Class labels
22 The Custom Act, 1962 CBEC, Ministry of
Finance
Hazardous Goods To prevent entry of illegal
hazardous goods or banned
goods including hazardous or
banned chemicals
Section 2: definitions
Section 11: Power to Prohibit Importation or
Exportation of Goods
ANNEXURE II General Standards for Discharge of Environmental Pollutants as per
CPCB

i
Table: Water Quality Standards
1. Colour and odour See Note-1 --- See Note-1 See Note-1
2. Suspended Solids, mg/l, Max 100 600 200 (a) For process waste water-100
(b) For cooling water effluent-10 per cent
above total suspended matter of influent
cooling water.
3. Particle size of suspended solids Shall pass 850 micron IS Sieve
--- --- (a) Floatable solids, Max 3 mm
(b) Settleable solids Max 850 microns.
4. Dissolved solids (inorganic), mg/a, mac 2100 2100 2100 ---
5. pH value 5.5 to 9.0 5.5 to 9.0 5.5 to 9.0 5.5 to 9.0
6. Temperature oC, Max Shall not exceed 40 in any section of the stream within 15
meters down stream from the effluent
outlet
45 at the point of discharge
--- 45 at the point of discharge
7. Oil and grease, mg/l, max 10 20 10 20
8. Total residual chlorine, mg/l, Max. 1.0 --- --- 1.0
9. Ammonical nitrogen (as N), mg/l, Max. 50 50 --- 50
10. Total Kjeldahl nitrogen (as N), mg/l, Max.
100 --- --- 100
11. Free Ammonia (as NH3), mg/l, Max. 5.0 --- --- 5.0
12. Biochemical Oxygen Demand (5 days at 20oC) Max.
30 350 100 100
13. Chemical Oxygen Demand, mg/l, Max. 250 --- --- 250
14. Arsenic (as As), mg/l, Max. 0.2 0.2 0.2 0.2
15. Mercury (as Hg), mg/l, Max. 0.01 0.01 --- 0.01
16. Lead (as Pb), mg/l, Max. 0.1 1.0 --- 1.0
17. Cadmium (as Cd), mg/l, Max. 2.0 1.0 --- 2.0

ii
18. Hexavalent chromium (as Cr+6) mg/l, Max.
0.1 2.0 --- 1.0
19. Total chromium as (Cr), mg/l, Max. 2.0 2.0 --- 2.0
20. Copper (as Cu), mg/l, Max. 3.0 3.0 --- 3.0
21. Zinc (as Zn), mg/l, Max. 5.0 15 --- 15
22. Selenium (as Se), mg/l, Max. 0.05 0.05 --- 0.05
23. Nickel (as Ni), mg/l, Max. 3.0 3.0 --- 5.0
24. Boron (as B), mg/l, Max. 2.0 2.0 2.0 ---
25. Percent Sodium, Max. --- 60 60 ---
26. Residual sodium carbonate, mg/l, Max. --- --- 5.0 ---
27. Cyanide (as CN), mg/l, Max. 0.2 2.0 0.2 0.2
28. Chloride (as Cl), mg/l, Max. 1000 1000 600 (a)
29. Fluoride (as F), mg/l, Max. 2.0 15 --- 15
30. Dissolved Phosphates (as P), mg/l, Max.
5.0 --- --- ---
31. Sulphate (as SO4), mg/l, Max. 1000 1000 1000 ---
32. Sulphide (as S), mg/l, Max. 2.0 --- --- 5.0
33. Pesticides Absent Absent Absent Absent
34. Phenolic compounds (as C6H5OH), mg/l, Max.
1.0 5.0 --- 5.0
35. Radioactive materials (a) Alpha emitters MC/ml, Max. (b) Beta emitters uc/ml, Max.
10-7
10-6
10-7
10-6
10-8
10-7
10-7
10-6
Note :-
1. All efforts should be made to remove colour and unpleasant odour as far as practicable.
2. The standards mentioned in this notification shall apply to all the effluents discharged such as industrial mining and mineral processing activities municipal sewage etc.
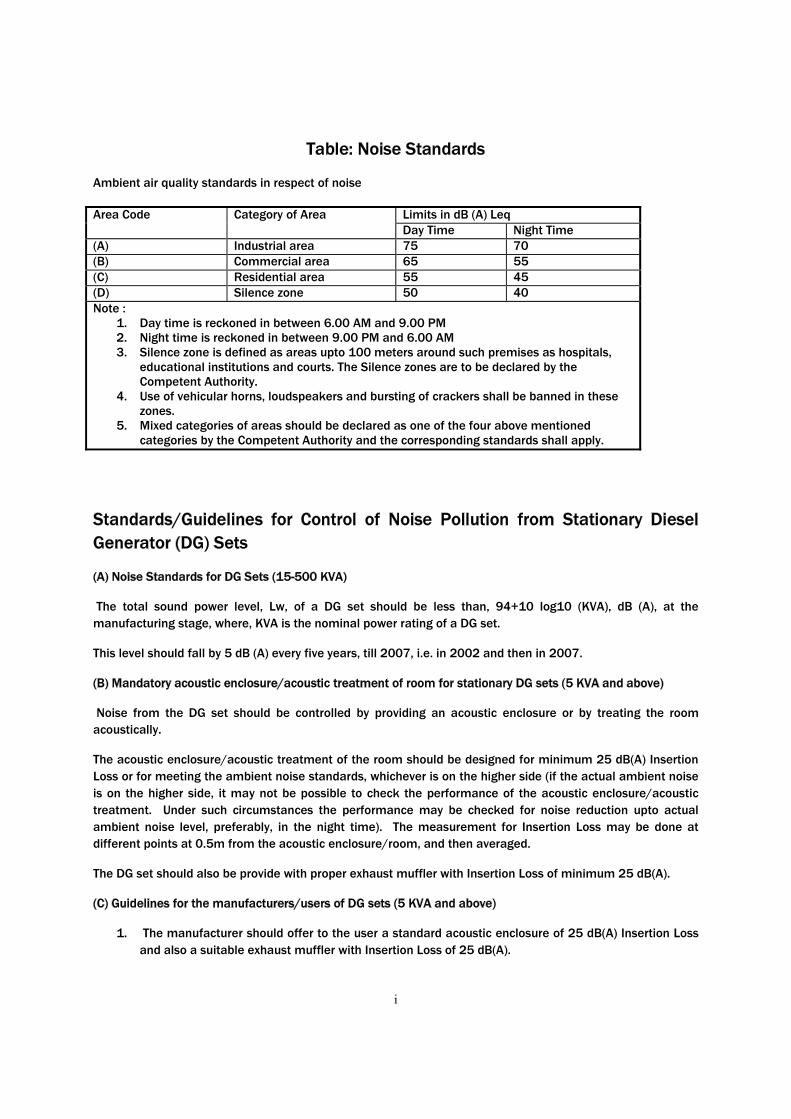
i
Ambient air quality standards in respect of noise
Area Code Category of Area Limits in dB (A) Leq
Day Time Night Time
(A) Industrial area 75 70
(B) Commercial area 65 55
(C) Residential area 55 45
(D) Silence zone 50 40
Note : 1. Day time is reckoned in between 6.00 AM and 9.00 PM 2. Night time is reckoned in between 9.00 PM and 6.00 AM 3. Silence zone is defined as areas upto 100 meters around such premises as hospitals,
educational institutions and courts. The Silence zones are to be declared by the Competent Authority.
4. Use of vehicular horns, loudspeakers and bursting of crackers shall be banned in these zones.
5. Mixed categories of areas should be declared as one of the four above mentioned categories by the Competent Authority and the corresponding standards shall apply.
The total sound power level, Lw, of a DG set should be less than, 94+10 log10 (KVA), dB (A), at the
manufacturing stage, where, KVA is the nominal power rating of a DG set.
This level should fall by 5 dB (A) every five years, till 2007, i.e. in 2002 and then in 2007.
Noise from the DG set should be controlled by providing an acoustic enclosure or by treating the room
acoustically.
The acoustic enclosure/acoustic treatment of the room should be designed for minimum 25 dB(A) Insertion
Loss or for meeting the ambient noise standards, whichever is on the higher side (if the actual ambient noise
is on the higher side, it may not be possible to check the performance of the acoustic enclosure/acoustic
treatment. Under such circumstances the performance may be checked for noise reduction upto actual
ambient noise level, preferably, in the night time). The measurement for Insertion Loss may be done at
different points at 0.5m from the acoustic enclosure/room, and then averaged.
The DG set should also be provide with proper exhaust muffler with Insertion Loss of minimum 25 dB(A).
1. The manufacturer should offer to the user a standard acoustic enclosure of 25 dB(A) Insertion Loss
and also a suitable exhaust muffler with Insertion Loss of 25 dB(A).
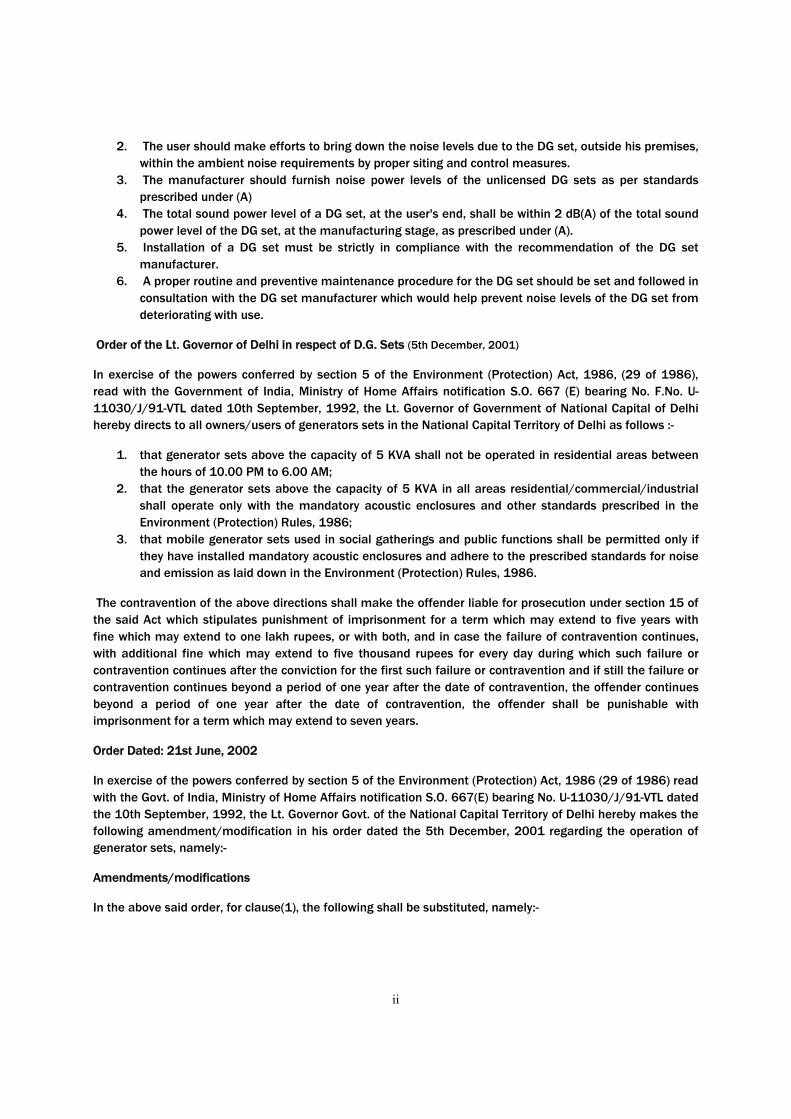
ii
2. The user should make efforts to bring down the noise levels due to the DG set, outside his premises,
within the ambient noise requirements by proper siting and control measures.
3. The manufacturer should furnish noise power levels of the unlicensed DG sets as per standards
prescribed under (A)
4. The total sound power level of a DG set, at the user's end, shall be within 2 dB(A) of the total sound
power level of the DG set, at the manufacturing stage, as prescribed under (A).
5. Installation of a DG set must be strictly in compliance with the recommendation of the DG set
manufacturer.
6. A proper routine and preventive maintenance procedure for the DG set should be set and followed in
consultation with the DG set manufacturer which would help prevent noise levels of the DG set from
deteriorating with use.
(5th December, 2001)
In exercise of the powers conferred by section 5 of the Environment (Protection) Act, 1986, (29 of 1986),
read with the Government of India, Ministry of Home Affairs notification S.O. 667 (E) bearing No. F.No. U-
11030/J/91-VTL dated 10th September, 1992, the Lt. Governor of Government of National Capital of Delhi
hereby directs to all owners/users of generators sets in the National Capital Territory of Delhi as follows :-
1. that generator sets above the capacity of 5 KVA shall not be operated in residential areas between
the hours of 10.00 PM to 6.00 AM;
2. that the generator sets above the capacity of 5 KVA in all areas residential/commercial/industrial
shall operate only with the mandatory acoustic enclosures and other standards prescribed in the
Environment (Protection) Rules, 1986;
3. that mobile generator sets used in social gatherings and public functions shall be permitted only if
they have installed mandatory acoustic enclosures and adhere to the prescribed standards for noise
and emission as laid down in the Environment (Protection) Rules, 1986.
The contravention of the above directions shall make the offender liable for prosecution under section 15 of
the said Act which stipulates punishment of imprisonment for a term which may extend to five years with
fine which may extend to one lakh rupees, or with both, and in case the failure of contravention continues,
with additional fine which may extend to five thousand rupees for every day during which such failure or
contravention continues after the conviction for the first such failure or contravention and if still the failure or
contravention continues beyond a period of one year after the date of contravention, the offender continues
beyond a period of one year after the date of contravention, the offender shall be punishable with
imprisonment for a term which may extend to seven years.
In exercise of the powers conferred by section 5 of the Environment (Protection) Act, 1986 (29 of 1986) read
with the Govt. of India, Ministry of Home Affairs notification S.O. 667(E) bearing No. U-11030/J/91-VTL dated
the 10th September, 1992, the Lt. Governor Govt. of the National Capital Territory of Delhi hereby makes the
following amendment/modification in his order dated the 5th December, 2001 regarding the operation of
generator sets, namely:-
In the above said order, for clause(1), the following shall be substituted, namely:-

iii
“(1) that the generator sets above 5KVA shall not be operated in residential areas between the hours from
10.00 p.m. to 6.00 a.m. except generator sets of Group Housing Societies and Multi-storey residential
apartments”.
The minimum height of stack to be provided with each generator set can be worked out using the following
formula:
H = h +0.2 Ì √KVA
H = Total height of stack in metre
h = Height of the building in metres where the generator set is installed
KVA = Total generator capacity of the set in KVA
Based on the above formula the minimum stack height to be provided with different range of generator sets
may be categorized as follows:
For Generator Sets Total Height of stack in metre
50 KVA Ht. of the building + 1.5 metre
50-100 KVA Ht. of the building + 2.0 metre
100- 150 KVA Ht. of the building + 2.5 metre
150-200 KVA Ht. of the building + 3.0 metre
200-250 KVA Ht. of the building + 3.5 metre
250-300 KVA Ht. of the building + 3.5 metre
Similarly for higher KVA ratings a stack height can be worked out using the above formula
Source: Evolved By CPCB
[Emission Regulations Part IV: COINDS/26/1986-87]
ANNEXURE III Form 1 (Application Form for Obtaining EIA Clearance)

1
FORM 1
(I) BASIC INFORMATION
S. No. Item Details
1. Name of the project/s
2. S.No. in the schedule
3. Proposed capacity/area/length/tonnage to be
handled/command area/lease area/number of
wells to be drilled
4. New/Expansion/Modernization
5. Existing Capacity/Area etc.
6. Category of Project i.e., ‘A’ or ‘B’
7. Does it attract the general condition? If yes,
please specify.
8. Does it attract the specific condition? If yes,
Please specify.
Location
Plot/Survey/Khasra No.
Village
Tehsil
District
9.
State
10. Name of the applicant
11. Registered Address
12. Address for correspondence:
Name
Designation (Owner/Partner/CEO)
Address
Pin Code
Telephone No.
Fax No.
13. Details of alternative Sites examined, if any
location of these sites should be shown on a
toposheet.
Village-District-State
1.
2.
3.

2
S. No. Item Details
14. Interlined Projects
15. Whether separate application of interlined
project has been submitted
16. If yes, date of submission
17. If no, reason
18. Whether the proposal involves
approval/clearance under:
The Forest (Conservation) Act, 1980
The Wildlife (Protection) Act, 1972
The C.R.Z. Notification, 1991
19. Forest land involved (hectares)
20. Whether there is any litigation pending against
the project and/or land in which the project is
propose to be set up
Name of the Court
Case No.
Orders/directions of the Court, if any and its
relevance with the proposed project.
(II) ACTIVITY
1. Construction, operation or decommissioning of the Project involving
actions, which will cause physical changes in the locality (topography, land use,
changes in water bodies, etc.)
S.No.
Information/Checklist confirmation
Yes/No
Details thereof (with
approximate quantities
/rates, wherever
possible) with source of
information data
1.1 Permanent or temporary change in land use,
land cover or topography including increase
in intensity of land use (with respect to local
land use plan)
1.2 Clearance of existing land, vegetation and
buildings?
1.3 Creation of new land uses?
1.4 Pre-construction investigations e.g. bore
houses, soil testing?
1.5 Construction works?

3
S.No.
Information/Checklist confirmation
Yes/No
Details thereof (with
approximate quantities
/rates, wherever
possible) with source of
information data
1.6 Demolition works?
1.7 Temporary sites used for construction works
or housing of construction workers?
1.8 Above ground buildings, structures or
earthworks including linear structures, cut
and fill or excavations
1.9 Underground works including mining or
tunneling?
1.10 Reclamation works?
1.11 Dredging?
1.12 Offshore structures?
1.13 Production and manufacturing processes?
1.14 Facilities for storage of goods or materials?
1.15 Facilities for treatment or disposal of solid
waste or liquid effluents?
1.16 Facilities for long term housing of operational
workers?
1.17 New road, rail or sea traffic during
construction or operation?
1.18 New road, rail, air waterborne or other
transport infrastructure including new or
altered routes and stations, ports, airports etc?
1.19 Closure or diversion of existing transport
routes or infrastructure leading to changes in
traffic movements?
1.20 New or diverted transmission lines or
pipelines?
1.21 Impoundment, damming, culverting,
realignment or other changes to the hydrology
of watercourses or aquifers?
1.22 Stream crossings?
1.23 Abstraction or transfers of water form ground
or surface waters?
1.24 Changes in water bodies or the land surface
affecting drainage or run-off?
1.25 Transport of personnel or materials for
construction, operation or decommissioning?

4
S.No.
Information/Checklist confirmation
Yes/No
Details thereof (with
approximate quantities
/rates, wherever
possible) with source of
information data
1.26 Long-term dismantling or decommissioning
or restoration works?
1.27 Ongoing activity during decommissioning
which could have an impact on the
environment?
1.28 Influx of people to an area in either
temporarily or permanently?
1.29 Introduction of alien species?
1.30 Loss of native species or genetic diversity?
1.31 Any other actions?
2. Use of Natural resources for construction or operation of the Project
(such as land, water, materials or energy, especially any resources which are
non-renewable or in short supply):
S.No.
Information/checklist confirmation
Yes/No
Details thereof (with
approximate quantities
/rates, wherever possible)
with source of
information data
2.1 Land especially undeveloped or agricultural
land (ha)
2.2 Water (expected source & competing users)
unit: KLD
2.3 Minerals (MT)
2.4 Construction material – stone, aggregates, sand
/ soil (expected source – MT)
2.5 Forests and timber (source – MT)
2.6 Energy including electricity and fuels (source,
competing users) Unit: fuel (MT), energy (MW)
2.7 Any other natural resources (use appropriate
standard units)
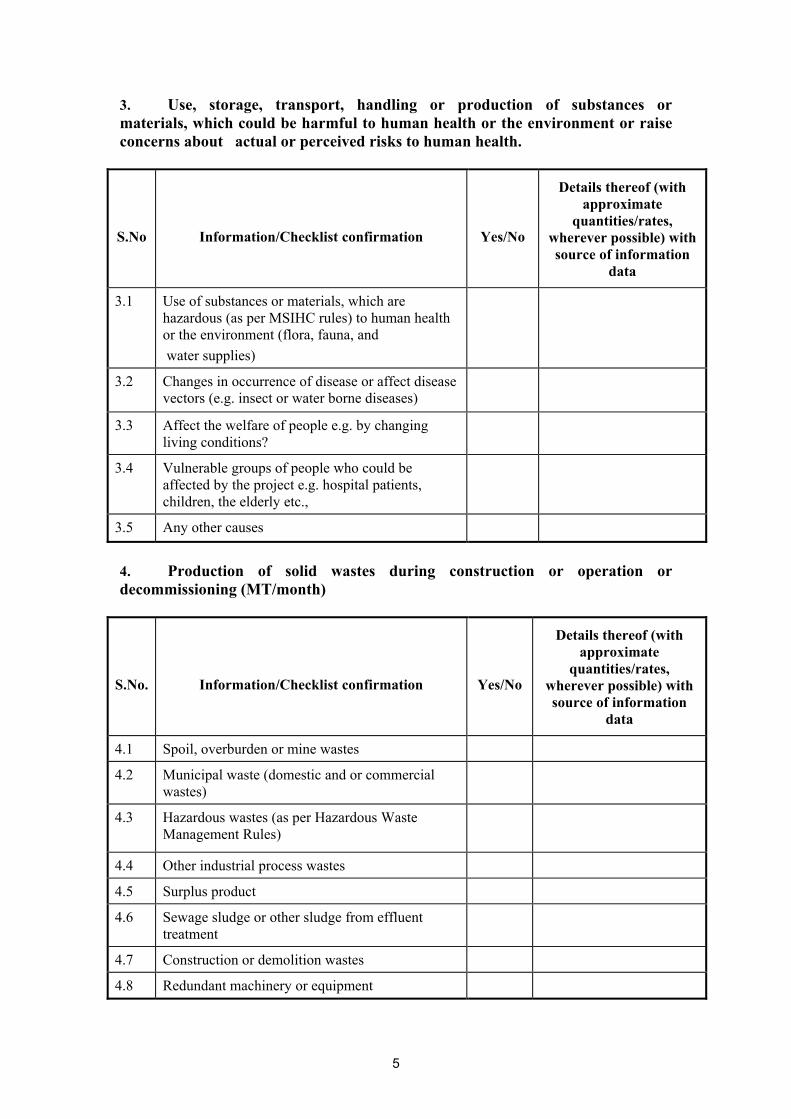
5
3. Use, storage, transport, handling or production of substances or
materials, which could be harmful to human health or the environment or raise
concerns about actual or perceived risks to human health.
S.No
Information/Checklist confirmation
Yes/No
Details thereof (with
approximate
quantities/rates,
wherever possible) with
source of information
data
3.1 Use of substances or materials, which are
hazardous (as per MSIHC rules) to human health
or the environment (flora, fauna, and
water supplies)
3.2 Changes in occurrence of disease or affect disease
vectors (e.g. insect or water borne diseases)
3.3 Affect the welfare of people e.g. by changing
living conditions?
3.4 Vulnerable groups of people who could be
affected by the project e.g. hospital patients,
children, the elderly etc.,
3.5 Any other causes
4. Production of solid wastes during construction or operation or
decommissioning (MT/month)
S.No.
Information/Checklist confirmation
Yes/No
Details thereof (with
approximate
quantities/rates,
wherever possible) with
source of information
data
4.1 Spoil, overburden or mine wastes
4.2 Municipal waste (domestic and or commercial
wastes)
4.3 Hazardous wastes (as per Hazardous Waste
Management Rules)
4.4 Other industrial process wastes
4.5 Surplus product
4.6 Sewage sludge or other sludge from effluent
treatment
4.7 Construction or demolition wastes
4.8 Redundant machinery or equipment
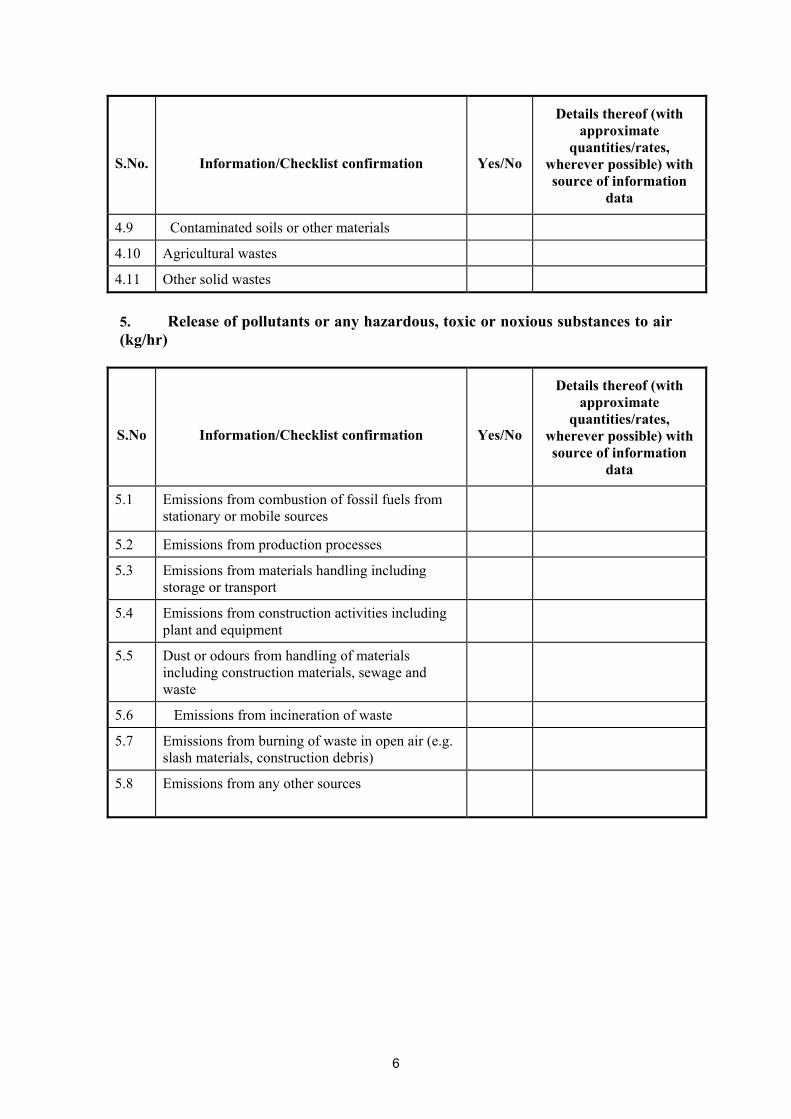
6
S.No.
Information/Checklist confirmation
Yes/No
Details thereof (with
approximate
quantities/rates,
wherever possible) with
source of information
data
4.9 Contaminated soils or other materials
4.10 Agricultural wastes
4.11 Other solid wastes
5. Release of pollutants or any hazardous, toxic or noxious substances to air
(kg/hr)
S.No
Information/Checklist confirmation
Yes/No
Details thereof (with
approximate
quantities/rates,
wherever possible) with
source of information
data
5.1 Emissions from combustion of fossil fuels from
stationary or mobile sources
5.2 Emissions from production processes
5.3 Emissions from materials handling including
storage or transport
5.4 Emissions from construction activities including
plant and equipment
5.5 Dust or odours from handling of materials
including construction materials, sewage and
waste
5.6 Emissions from incineration of waste
5.7 Emissions from burning of waste in open air (e.g.
slash materials, construction debris)
5.8 Emissions from any other sources

7
6. Generation of Noise and Vibration, and Emissions of Light and Heat:
S.No. Information/Checklist confirmation Yes/No Details thereof (with
approximate
quantities/rates, wherever
possible) with source of
information data with
source of information data
6.1 From operation of equipment e.g. engines,
ventilation plant, crushers
6.2 From industrial or similar processes
6.3 From construction or demolition
6.4 From blasting or piling
6.5 From construction or operational traffic
6.6 From lighting or cooling systems
6.7 From any other sources
7. Risks of contamination of land or water from releases of pollutants into
the ground or into sewers, surface waters, groundwater, coastal waters or the
sea:
S.No.
Information/Checklist confirmation
Yes/No
Details thereof (with
approximate
quantities/rates,
wherever possible) with
source of information
data
7.1 From handling, storage, use or spillage of
hazardous materials
7.2 From discharge of sewage or other effluents to
water or the land (expected mode and place of
discharge)
7.3 By deposition of pollutants emitted to air into
the land or into water
7.4 From any other sources
7.5 Is there a risk of long term build up of pollutants
in the environment from these sources?
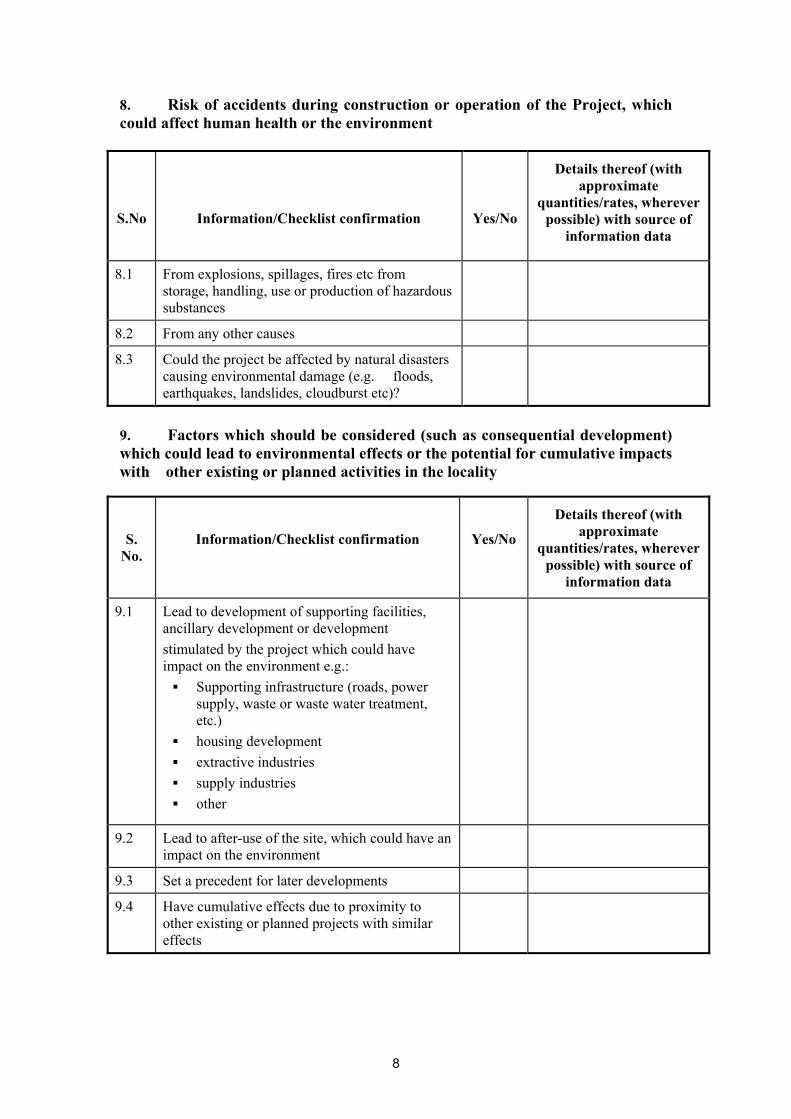
8
8. Risk of accidents during construction or operation of the Project, which
could affect human health or the environment
S.No
Information/Checklist confirmation
Yes/No
Details thereof (with
approximate
quantities/rates, wherever
possible) with source of
information data
8.1 From explosions, spillages, fires etc from
storage, handling, use or production of hazardous
substances
8.2 From any other causes
8.3 Could the project be affected by natural disasters
causing environmental damage (e.g. floods,
earthquakes, landslides, cloudburst etc)?
9. Factors which should be considered (such as consequential development)
which could lead to environmental effects or the potential for cumulative impacts
with other existing or planned activities in the locality
S.
No.
Information/Checklist confirmation
Yes/No
Details thereof (with
approximate
quantities/rates, wherever
possible) with source of
information data
9.1 Lead to development of supporting facilities,
ancillary development or development
stimulated by the project which could have
impact on the environment e.g.:
Supporting infrastructure (roads, power
supply, waste or waste water treatment,
etc.)
housing development
extractive industries
supply industries
other
9.2 Lead to after-use of the site, which could have an
impact on the environment
9.3 Set a precedent for later developments
9.4 Have cumulative effects due to proximity to
other existing or planned projects with similar
effects

9
(III) ENVIRONMENTAL SENSITIVITY
S.No. Areas Name/
Identity
Aerial distance (within 15
km.)
Proposed project location
boundary
1 Areas protected under international conventions,
national or local legislation for their ecological,
landscape, cultural or other related value
2 Areas which are important or sensitive for
ecological reasons - Wetlands, watercourses or
other water bodies, coastal zone, biospheres,
mountains, forests
3 Areas used by protected, important or sensitive
species of flora or fauna for breeding, nesting,
foraging, resting, over wintering, migration
4 Inland, coastal, marine or underground waters
5 State, National boundaries
6 Routes or facilities used by the public for access
to recreation or other tourist, pilgrim areas
7 Defence installations
8 Densely populated or built-up area
9 Areas occupied by sensitive man-made land uses
(hospitals, schools, places of worship,
community facilities)
10 Areas containing important, high quality or
scarce resources (ground water resources,
surface resources, forestry, agriculture,
fisheries, tourism, minerals)
11 Areas already subjected to pollution or
environmental damage. (those where existing
legal environmental standards are exceeded)
12 Areas susceptible to natural hazard which could
cause the project to present environmental
problems (earthquakes, subsidence, landslides,
erosion, flooding or extreme or adverse climatic
conditions)
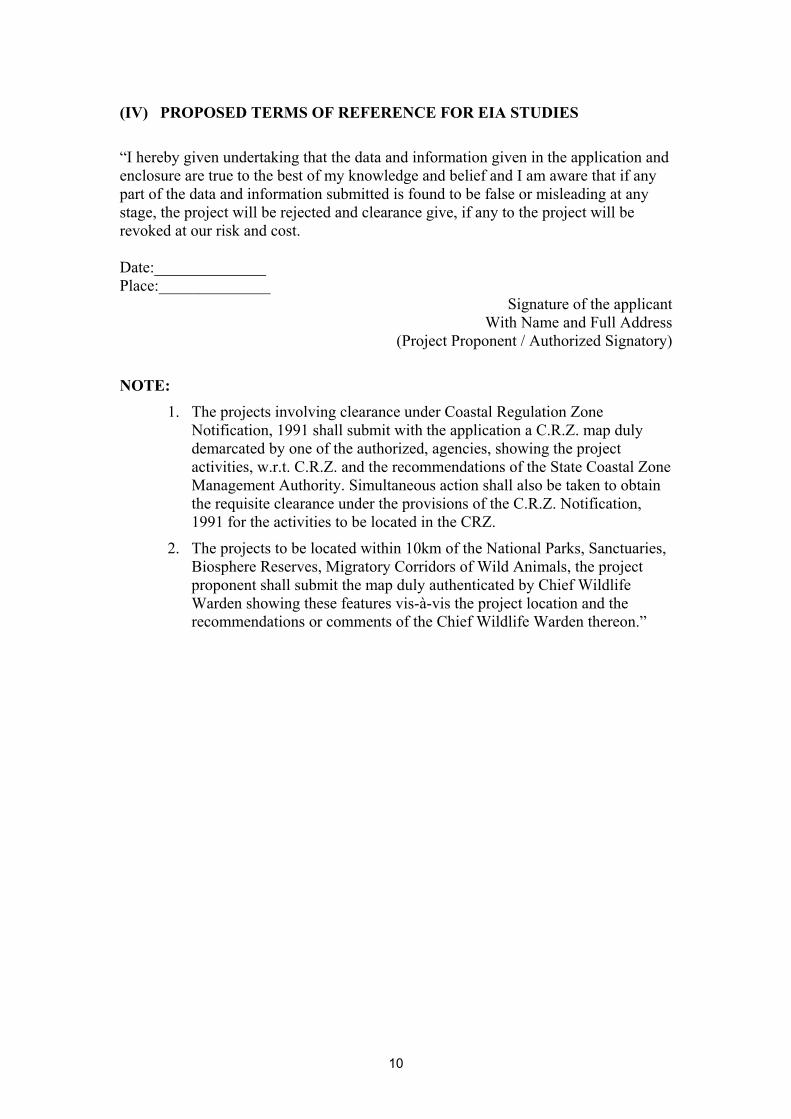
10
(IV) PROPOSED TERMS OF REFERENCE FOR EIA STUDIES
“I hereby given undertaking that the data and information given in the application and
enclosure are true to the best of my knowledge and belief and I am aware that if any
part of the data and information submitted is found to be false or misleading at any
stage, the project will be rejected and clearance give, if any to the project will be
revoked at our risk and cost.
Date:______________
Place:______________
Signature of the applicant
With Name and Full Address
(Project Proponent / Authorized Signatory)
NOTE:
1. The projects involving clearance under Coastal Regulation Zone
Notification, 1991 shall submit with the application a C.R.Z. map duly
demarcated by one of the authorized, agencies, showing the project
activities, w.r.t. C.R.Z. and the recommendations of the State Coastal Zone
Management Authority. Simultaneous action shall also be taken to obtain
the requisite clearance under the provisions of the C.R.Z. Notification,
1991 for the activities to be located in the CRZ.
2. The projects to be located within 10km of the National Parks, Sanctuaries,
Biosphere Reserves, Migratory Corridors of Wild Animals, the project
proponent shall submit the map duly authenticated by Chief Wildlife
Warden showing these features vis-à-vis the project location and the
recommendations or comments of the Chief Wildlife Warden thereon.”

ANNEXURE IV Critically Polluted Industrial Areas and Clusters/Potential Impact
Zones

i
Table 1: Details of Critically Polluted Industrial Areas and Clusters / Potential Impact Zone (Ref: Office Memorandum No. J-11013/5/2010-IA.II(I) Dated 13.1.2010)
S. No. Critically Polluted Industrial
Area and CEPI
Industrial Clusters/ Potential Impact Zones
1. Ankeshwar (Gujarat)
CEPI-88.50(Ac_Wc_Lc)
GIDC Ankeshwar and GIDC, Panoli
2 Vapi (Gujarat)
CEPI-88.09(Ac_Wc_Lc)
GIDC Vapi
3 Ghaziabad (Uttar Pradesh)
CEPI-87.37(Ac_Wc_Lc)
Sub-cluster A
Mohan nagar industrial area
Rajinder nagar industrial area
Sahibabad industrial area
Sub-cluster B
Pandav nagar industrial area
Kavi nagar industrial area
Bulandshahar road industrial area
Amrit nagar
Aryanagar industrial area
Sub-cluster C
Merrut road industrial are
Sub-cluster D
Loni industrial area
Loni Road industrial area
Roop nagar industrial area
Sub-cluster E
Hapur Road industrial area
Dasna
Philkura
Sub-cluster F (Other scattered industrial areas)
South side of GT road
Kavi Nagar
Tronica city
Anand Nagar
Jindal Nagar
Prakash Nagar
Rural industrial estate
4 Chandrapur
(Maharashtra)
CEPI-83.88 (Ac_Wc_Lc)
Chandrapur (MIDC Chandrapur, Tadali, Ghuggus,
Ballapur)
5 Kobra (Chhatisgarh)
CEPI-83.00 (Ac_Ws_Lc)
Industrial areas and their townships of NTPC, BALCO,
CSEB (East) & CSEB (West)
Korba town
6 Bhiwadi (Rajasthan)
CEPI-82.91 (Ac_Wc_Ls)
RIICO industrial areas Phase I to IV
Bhiwadi town
Other surrounding industrial areas: Chopanki, Rampura
Mundana, Khuskhera Phase I to III
7 Angul Talcer(Orissa)
CEPI-82.09 (Ac_Wc_Lc)
MCL Coal mining area, Augul – Talcer region
Industrial area (60 km x 45 km)
Following blocks of Augul district:
Kohina block
Talcher block
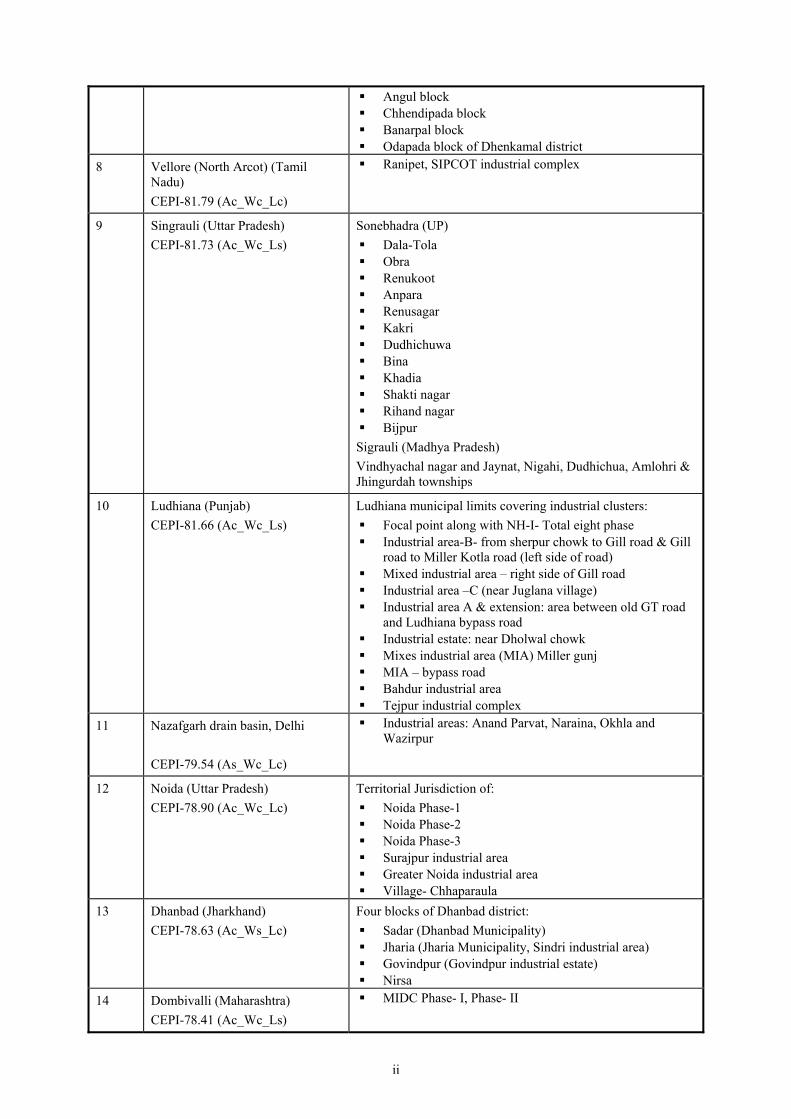
ii
Angul block
Chhendipada block
Banarpal block
Odapada block of Dhenkamal district
8 Vellore (North Arcot) (Tamil
Nadu)
CEPI-81.79 (Ac_Wc_Lc)
Ranipet, SIPCOT industrial complex
9 Singrauli (Uttar Pradesh)
CEPI-81.73 (Ac_Wc_Ls)
Sonebhadra (UP)
Dala-Tola
Obra
Renukoot
Anpara
Renusagar
Kakri
Dudhichuwa
Bina
Khadia
Shakti nagar
Rihand nagar
Bijpur
Sigrauli (Madhya Pradesh)
Vindhyachal nagar and Jaynat, Nigahi, Dudhichua, Amlohri &
Jhingurdah townships
10 Ludhiana (Punjab)
CEPI-81.66 (Ac_Wc_Ls)
Ludhiana municipal limits covering industrial clusters:
Focal point along with NH-I- Total eight phase
Industrial area-B- from sherpur chowk to Gill road & Gill
road to Miller Kotla road (left side of road)
Mixed industrial area – right side of Gill road
Industrial area –C (near Juglana village)
Industrial area A & extension: area between old GT road
and Ludhiana bypass road
Industrial estate: near Dholwal chowk
Mixes industrial area (MIA) Miller gunj
MIA – bypass road
Bahdur industrial area
Tejpur industrial complex
11 Nazafgarh drain basin, Delhi
CEPI-79.54 (As_Wc_Lc)
Industrial areas: Anand Parvat, Naraina, Okhla and
Wazirpur
12 Noida (Uttar Pradesh)
CEPI-78.90 (Ac_Wc_Lc)
Territorial Jurisdiction of:
Noida Phase-1
Noida Phase-2
Noida Phase-3
Surajpur industrial area
Greater Noida industrial area
Village- Chhaparaula
13 Dhanbad (Jharkhand)
CEPI-78.63 (Ac_Ws_Lc)
Four blocks of Dhanbad district:
Sadar (Dhanbad Municipality)
Jharia (Jharia Municipality, Sindri industrial area)
Govindpur (Govindpur industrial estate)
Nirsa
14 Dombivalli (Maharashtra)
CEPI-78.41 (Ac_Wc_Ls)
MIDC Phase- I, Phase- II

iii
15 Kanpur (Uttar Pradesh)
CEPI-78.09 (Ac_Wc_Ls)
Industrial areas:
Dada nagar
Panki
Fazalganj
Vijay nagar
Jajmau
16 Cuddalore (Tamil Nadu)
CEPI-77.45 (As_Wc_Lc)
SIPCOT industrial complex, Phase I & II
17 Aurangabad (Maharashtra)
CEPI-77.44 (Ac_Wc_Ls)
MIDC Chikhalthana, MIDC Waluj, MIDC Shendra, and
Paithan road industrial area
18 Faridabad (Haryana)
CEPI-77.07 (Ac_Ws_Lc)
Sector 27-A, B, C, D
DLF phase- 1, sector 31,32
DLF phase- 2, sector 35
Sector 4, 6, 24, 27, 31, 59
Industrial area Hatin
Industrial model township
19 Agra (Uttar Pradesh)
CEPI-76.48 (As_Wc_Ls)
Nunihai industrial estate, Rambag nagar, UPSIDC
industrial area, and Runukata industrial area
20 Manali (Tamil Nadu)
CEPI-76.32 (Ac_Ws_Ls)
Manali industrial area
21 Haldia (West Bengal)
CEPI-75.43 (As_Wc_Ls)
5 km wide strip (17.4 x 5.0 km) of industrial area on the
southern side of the confluence point of Rivers Hugli and
Rupnarayan, covering
Haldia municipal area & Sutahata block – I and II
22 Ahmedabad (Gujarat)
CEPI-75.28 (Ac_Ws_Ls)
GIDC Odhav
GIDC Naroda
23 Jodhpur (Rajasthan)
CEPI-75.19 (As_Wc_Ls)
Industrial areas including Basni areas (phase-I & II),
industrial estate, light & heavy industrial areas, industrial
areas behind new power house, Mandore, Bornada,
Sangariya and village Tanwada & Salawas.
Jodhpur city
24 Greater Cochin (Kerala)
CEPI-75.08 (As_Wc_Ls)
Eloor-Edayar industrial belt,
Ambala Mogal industrial areas
25 Mandi Gobind Garh (Punjab)
CEPI-75.08 (Ac_Ws_Lc)
Mandi Govindgarh municipal limit and khanna area
26 Howrah (West Bengal)
CEPI-74.84 (As_Ws_Lc)
Liluah-Bamangachhi region, Howrah
Jalan industrial complex-1, Howrah
27 Vatva (Gujarat)
CEPI-74.77 (Ac_Wc_Ls)
GIDC Vatva, Narol industrial area (Villages Piplaj,
Shahwadi, Narol)
28 Ib Valley (Orissa)
CEPI-74.00 (Ac_Ws_Ls)
Ib Valley of Jharsuguda (Industrial and mining area)
29 Varansi-Mirzapur (Uttar Pradesh)
CEPI-73.79 (As_Wc_Ls)
Industrial estate, Mirzapur
Chunar
Industrial estate, Chandpur, Varansi
UPSIC, industrial estate, Phoolpur
Industrial area, Ramnagar, Chandauli
30 Navi Mumbai (Maharashtra)
CEPI-73.77 (Ac_Ws_Ls)
TTC industrial area, MIDC, Navi Mumbai (including
Bocks-D, C, EL, A, R, General, Kalva)
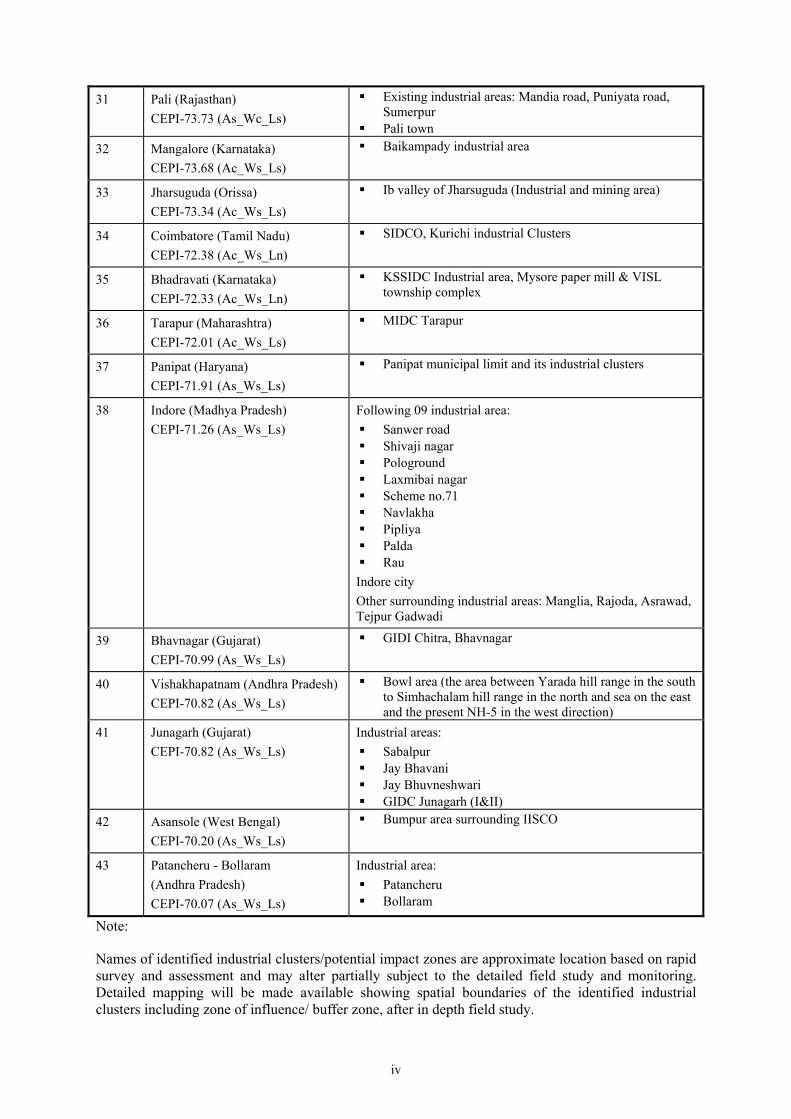
iv
31 Pali (Rajasthan)
CEPI-73.73 (As_Wc_Ls)
Existing industrial areas: Mandia road, Puniyata road,
Sumerpur
Pali town
32 Mangalore (Karnataka)
CEPI-73.68 (Ac_Ws_Ls)
Baikampady industrial area
33 Jharsuguda (Orissa)
CEPI-73.34 (Ac_Ws_Ls)
Ib valley of Jharsuguda (Industrial and mining area)
34 Coimbatore (Tamil Nadu)
CEPI-72.38 (Ac_Ws_Ln)
SIDCO, Kurichi industrial Clusters
35 Bhadravati (Karnataka)
CEPI-72.33 (Ac_Ws_Ln)
KSSIDC Industrial area, Mysore paper mill & VISL
township complex
36 Tarapur (Maharashtra)
CEPI-72.01 (Ac_Ws_Ls)
MIDC Tarapur
37 Panipat (Haryana)
CEPI-71.91 (As_Ws_Ls)
Panipat municipal limit and its industrial clusters
38 Indore (Madhya Pradesh)
CEPI-71.26 (As_Ws_Ls)
Following 09 industrial area:
Sanwer road
Shivaji nagar
Pologround
Laxmibai nagar
Scheme no.71
Navlakha
Pipliya
Palda
Rau
Indore city
Other surrounding industrial areas: Manglia, Rajoda, Asrawad,
Tejpur Gadwadi
39 Bhavnagar (Gujarat)
CEPI-70.99 (As_Ws_Ls)
GIDI Chitra, Bhavnagar
40 Vishakhapatnam (Andhra Pradesh)
CEPI-70.82 (As_Ws_Ls)
Bowl area (the area between Yarada hill range in the south
to Simhachalam hill range in the north and sea on the east
and the present NH-5 in the west direction)
41 Junagarh (Gujarat)
CEPI-70.82 (As_Ws_Ls)
Industrial areas:
Sabalpur
Jay Bhavani
Jay Bhuvneshwari
GIDC Junagarh (I&II)
42 Asansole (West Bengal)
CEPI-70.20 (As_Ws_Ls)
Bumpur area surrounding IISCO
43 Patancheru - Bollaram
(Andhra Pradesh)
CEPI-70.07 (As_Ws_Ls)
Industrial area:
Patancheru
Bollaram
Note:
Names of identified industrial clusters/potential impact zones are approximate location based on rapid
survey and assessment and may alter partially subject to the detailed field study and monitoring.
Detailed mapping will be made available showing spatial boundaries of the identified industrial
clusters including zone of influence/ buffer zone, after in depth field study.

ANNEXURE V Pre-Feasibility Report: Points for Possible Coverage

ii
Table 1: Points for Possible Coverage in Pre-feasibility Report
S. No. Contents Points of Coverage in Pre-feasibility Report
I. Executive summary A miniature report of entire pre feasibility report.
II. Project Details
Need/Justification of the Project Current demand scenario of the paper products
Alternatives to meet the demand
Post project scenario on residual demand, etc.
Capacity of Pulp and Paper
Industry
Production capacity of paper industry
Sustainability of raw material supply and quality
Optimization of plant capacity, etc.
Process technology Analysis of available/advanced technologies, etc.
Analysis of possible configurations for each
technology or a combination of these technologies
Broad specifications for the proposed industrial units
including process technologies/equipments
Resources/raw materials Details on raw material (wood, waste paper, water,
additives, chemicals, pulp, agro-residues, etc.), by
products
Water
- Water requirement for process, utilities,
domestic, gardening etc.
- Source of construction water and potable water
- Source of circulating/consumptive water
- Quality of raw water, treated water
- Water budget calculations and effluent
generation
- Approved water allocation quota (drinking,
irrigation and industrial use) and surplus
availability
- Feasible ways of bringing water to site
indicating constraints if any.
- Lean season water availability and allocation
source in case main source not perennial.
Manpower
Infrastructure
Electrical power
Construction material like sand, brick, stone chips,
borrow earth etc.
Rejects (Pollution potential) Air emissions (emissions from blow systems, smelt
tank, evaporation, etc.)
Water pollution (wastewater, sulphide liquor, wash
waters, condensate water, clean up water, white
water, weak liquor, etc.)
Solid / hazardous waste (fibre, dust, knot fibre grits,
dirt, etc.)
Noise
Odour
Technical profile Construction details
- Estimated duration
- Number of construction workers including
migrating workers
- Construction equipment
- Vehicular traffic
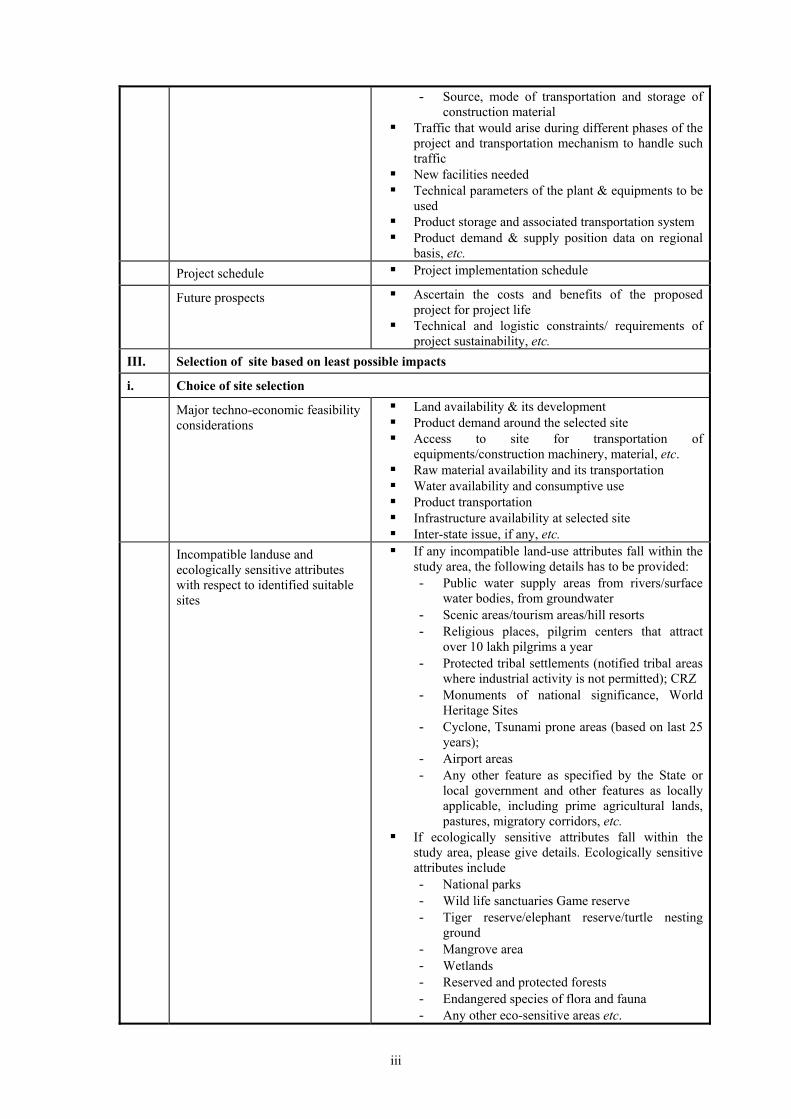
iii
- Source, mode of transportation and storage of
construction material
Traffic that would arise during different phases of the
project and transportation mechanism to handle such
traffic
New facilities needed
Technical parameters of the plant & equipments to be
used
Product storage and associated transportation system
Product demand & supply position data on regional
basis, etc.
Project schedule Project implementation schedule
Future prospects
Ascertain the costs and benefits of the proposed
project for project life
Technical and logistic constraints/ requirements of
project sustainability, etc.
III. Selection of site based on least possible impacts
i. Choice of site selection
Major techno-economic feasibility
considerations
Land availability & its development
Product demand around the selected site
Access to site for transportation of
equipments/construction machinery, material, etc.
Raw material availability and its transportation
Water availability and consumptive use
Product transportation
Infrastructure availability at selected site
Inter-state issue, if any, etc.
Incompatible landuse and
ecologically sensitive attributes
with respect to identified suitable
sites
If any incompatible land-use attributes fall within the
study area, the following details has to be provided:
- Public water supply areas from rivers/surface
water bodies, from groundwater
- Scenic areas/tourism areas/hill resorts
- Religious places, pilgrim centers that attract
over 10 lakh pilgrims a year
- Protected tribal settlements (notified tribal areas
where industrial activity is not permitted); CRZ
- Monuments of national significance, World
Heritage Sites
- Cyclone, Tsunami prone areas (based on last 25
years);
- Airport areas
- Any other feature as specified by the State or
local government and other features as locally
applicable, including prime agricultural lands,
pastures, migratory corridors, etc.
If ecologically sensitive attributes fall within the
study area, please give details. Ecologically sensitive
attributes include
- National parks
- Wild life sanctuaries Game reserve
- Tiger reserve/elephant reserve/turtle nesting
ground
- Mangrove area
- Wetlands
- Reserved and protected forests
- Endangered species of flora and fauna
- Any other eco-sensitive areas etc.

iv
Social aspects Corporate social responsibilities
Employments and infrastructure added in the vicinity
of the plant
Status of land availability, current and post project
land use variation
Social sensitivity and likely project affected people,
etc.
ii. Details of selected site
Land details Land requirement and availability
Land ownership details such as Government, private,
tribal, non-tribal, etc.
Total area of the project/site
Prevailing land cost details, etc.
Location Geographical details - Longitude & latitude, village,
taluka, district, state
Approach to site – roads, railways and airports
Distance from nearest residential and industrial areas
Distance from nearest water bodies such as river,
canal, dam, etc
Distance from ecologically sensitive areas
In case of flood prone areas, HFL of the site
In case of seismic areas, seismic zone, active faults,
occurrence on earthquakes, etc.
Proximity from infrastructural facilities, etc.
Physical characteristics Demography
Meteorological data
Landuse pattern such as agricultural, barren, forest,
etc. and details thereof
Topography of the area
Drainage patterns
Soil condition and soil investigation results
Ground profile and levels, etc.
IV. Anticipated impacts based on
project operations on receiving
environment
Population
Flora and fauna
Water
Soil
Air
Climate
Landscape, etc.
V. Proposed broad mitigation
measures which could effectively
be internalized as project
components to have
environmental and social
acceptance of the proposed site
Preventive measures
Source control measures
Mitigation measures at the receiving environment
Health and safety measures of workers, etc.
VI. An indication of any difficulties (technical deficiencies or lack of know-how) encountered by
the developer in compiling the required information.
The above listing is not exhaustive. Thus the proponent may provide additional necessary
information, felt appropriate, to include in the pre-feasibility study report in support of selecting
the site for the proposed developmental activities. The Concerned EAC/SEAC during scrutiny,
may specifically ask for any additional information/data required to substantiate the requirement
to prescribe the ToR for EIA studies. However, it is to make clear that all the required further
information by EAC/SEAC may be mentioned in one single letter, within the prescribed time.

ANNEXURE VI Types of Monitoring and Network Design Considerations

i
TYPES OF MONITORING AND NETWORK DESIGN CONSIDERATIONS
A. Types of Monitoring
Monitoring refers to the collection of data using a series of repetitive measurements of
environmental parameters (or, more generally, to a process of systematic observation).
The environmental quality monitoring programme design will be dependent upon the
monitoring objectives specified for the selected area of interest. The main types of EIA
monitoring activities are:
Baseline monitoring is the measurement of environmental parameters during the pre-
project period for the purpose of determining the range of variation of the system and
establishing reference points against which changes can be measured. This leads to
the assessment of the possible (additional available) assimilative capacity of the
environmental components in pre-project period w.r.t. the standard or target level.
Effects monitoring is the measurement of environmental parameters during project
construction and implementation to detect changes which are attributable to the
project to provide the necessary information to:
− verify the accuracy of EIA predictions; and
− determine the effectiveness of measures to mitigate adverse effects of projects on
the environment.
− Feedback from environmental effect monitoring programs may be used to improve
the predictive capability of EIAs and also determine whether more or less stringent
mitigation measures are needed
Compliance monitoring is the periodic sampling or continuous measurement of
environmental parameters to ensure that regulatory requirements and standards are
being met.
Compliance and effects monitoring occurs during the project construction, operation, and
abandonment stages. The resources and institutional set-up should be available for the
monitoring at these stages. All large-scale construction projects will require some
construction stage monitoring. To control the environmental hazards of construction as
specified in the EIA, a monitoring program should be established to ensure that each
mitigation measure is effectively implemented. There are numerous potential areas for
monitoring during operations.
The scope of monitoring topics discussed in this chapter is limited to Baseline and Effects
monitoring. In addition, this chapter will also discuss the Compliance monitoring during
the construction phase. Post-project monitoring requirements are discussed in the EMP.
Before any field monitoring tasks are undertaken there are many institutional, scientific,
and fiscal issues that must be addressed in the implementation of an environmental
monitoring program. Careful consideration of these issues in the design and planning
stages will help avoid many of the pitfalls associated with environmental monitoring
programs. Although these issues are important but the discussions here are confined to the
monitoring network design component.
ii
B. Network Design
Analysis of Significant Environmental Issues
At the outset of planning for an environmental monitoring network, the EIA manager may
not know exactly what should be monitored, when monitoring should begin, where it
should monitor, which techniques should be employed, and who should take
responsibility for its conduct. Because there are usually a number of objective decisions
associated with network design to be made, it is important to start with an analysis of
environmental issues. The scoping phase of an EIA is designed to identify and focus on
the major issues. Scoping should provide a valuable source of information on the
concerns that need to be addressed by the monitoring network design. These are project
specific as well as specific to the environmental setting of the location where the project
is proposed to be located
Hence, the network designs are associated with questions like:
What are the expected outputs of the monitoring activity?
Which problems do we need to address to? etc.
Defining the output will influence the design of the network and optimize the resources
used for monitoring. It will also ensure that the network is specially designed to optimize
the information on the problems at hand
What to Monitor?
The question of what to monitor is associated with the identification of VECs.
VECs are generally defined as environmental attributes or components of the
environment that are valued by society as identified during the scoping stage of the
project. They are determined on the basis of perceived public concerns. For example,
changes to water quality and quantity could have implications on fish by affecting habitat,
food supply, oxygen, and contaminant uptake. Similarly, employment and business, and
economies are both VECs that serve as pathways.
The choice of VECs is also related to the perceived significant impact of the project
implementation on important environmental components. In general, the significance or
importance of environmental components is judged based on:
legal protection provided (for example, rare and endangered species)
political or public concerns (for example, resource use conflicts and sustainable
development)
scientific judgment (for example, ecological importance); or
commercial or economic importance
However, in addition to their economic, social, political or ecological significance, the
chosen VEC should also have unambiguous operational ease, be accessible to prediction
and measurement; and be susceptible to hazard. Once the VECs are defined, the VECs
may be directly measured (for example, extent of habitat for an endangered species). In
cases where it is impossible or impractical to directly measure the VECs, the chosen
measurement endpoints or environmental indicators must correspond to, or be predictive
of assessment endpoints.
The chosen environmental indicators must be: 1) measurable; 2) appropriate to the scale
of disturbance/ contamination; 3) appropriate to the impact mechanism; 4) appropriate
iii
and proportional to temporal dynamics; 5) diagnostic; and 6) standardized; as well as
have: 1) a low natural variability; 2) a broad applicability; and 3) an existing data series.
Where, How and How Many Times to Monitor?
These are the other components of Monitoring Network Design. These questions are best
answered based on local field conditions, capacity and resources available, prevailing
legal and regulatory priorities, etc. For this screening or reconnaissance Surveys of the
study area also necessary. This may also include some simple inexpensive measurements
and assimilative/dispersion modeling. The data will give some information on the
prevailing special and temporal variations, and the general background air pollution in the
area. The number of monitoring stations and the indicators to be measured at each station
in the final permanent network may then be decided upon based on the results of the
screening study as well as on the knowledge of the sources of the proposed development
and prevailing local environmental/meteorological conditions. The best possible
definition of the air pollution problem, together with the analysis of the resources:
personnel, budget and equipment available, represent the basis for the decision on the
following questions:
What spatial density (number) of sampling stations is required? How many samples
are needed and during what period (sampling (averaging) time and frequency)?
Where should the stations be located?
What kind of equipment should be used?
What additional background information is needed?
− meteorology
− topography
− population density
− emission sources and emission rates
− effects and impacts
How will the data be made available/communicated?
C. Site Selection
This normally means that for designing a monitoring programme in an (study) area which
might have an impact, several monitoring stations are needed for characterizing the
baseline conditions of the impacted area. When considering the location of individual
samplers, it is essential that the data collected are representative for the location and type
of area without the undue influence from the immediate surroundings. In any
measurement point in the study area the total ambient concentration is the representative
of:
natural background concentration
regional background
impact of existing large regional sources such as Industrial emissions
To obtain the information about the importance of these different contributions it is
therefore necessary to locate monitoring stations so that they are representative for
different impacts. In addition to the ambient pollution data, one would often need other
data governing the variations such as meteorological data for air pollution, to identify and
quantify the sources contributing to the measurements.. When considering the location of
individual samplers, it is essential that the data collected are representative for the
location and type of area without undue influence from the immediate surroundings.

ANNEXURE VII Guidance for Assessment of Baseline Components and Attributes

i
GUIDANCE FOR ASSESSMENT OF BASELINE COMPONENTS AND ATTRIBUTES*
Sampling Attributes
Network Frequency
Measurement Method Remarks
A. Air
Meteorological
Wind speed
Wind direction
Dry bulb temperature
Wet bulb temperature
Relative humidity
Rainfall
Solar radiation
Cloud cover
Minimum 1 site in the
project impact area
requirements
Other additional site(s) are
require depending upon the
model applied or site
sensitivities
Min: 1 hrly observations
from continuous records
Mechanical / automatic weather station
Rain gauge
As per IMD
As per IMD
IS 5182 Part 1-20 Sit-specific primary data is essential
Secondary data from IMD,
New Delhi for the nearest
IMD station
Pollutants
SPM
RPM
SO2
NO2
CO
H2S*
NH*3
HC*
Fluoride*
Pb*
VOC-PAH*
Mercury*
(parameters to be proposed by the
proponent, in draft ToR, which will
be reviewed and approved by
EAC/SEAC)
10 to 15 locations in the
project impact area
24 hrly twice a week
8 hrly twice a week
24 hrly twice a week
Gravimetric (High – Volume)
Gravimetric (High – Volume
with Cyclone)
EPA Modified West & Gaeke
method
Arsenite Modified Jacob &
Hochheiser
NDIR technique
Methylene-blue
Nessler’s Method
Infra Red analyzer
Specific lon meter
Monitoring Network
Minimum 2 locations in
upwind side, more sites
in downwind side /
impact zone
All the sensitive receptors
need to be covered
Measurement Methods
As per CPCB standards for
NAQM, 1994

ii
Sampling Attributes
Network Frequency
Measurement Method Remarks
B. Noise
Hourly equivalent noise levels Same as for Air Pollution
along with others Identified
in study area
At lest one day continuous
in each season on a
working and non-working
day
Instrument : Sensitive Noise level
meter (preferably recording type)
Min: IS: 4954- 1968 as
adopted by CPCB
Hourly equivalent noise levels Inplant (1.5 m from
machinery or high emission
processes)
Same as above for day and
night
Instrument : Noise level metre CPCB / OSHA
Hourly equivalent noise levels Highways (within 500
metres from the road edge)
Same as above for day and
night
Instrument : Noise level meter CPCB / IS : 4954-1968
Peak particle velocity 150- 200m from blast site Based on hourly
observations
PPV meter
C. Water
Parameters for water quality
Ph, temp, turbidity, magnesium
hardness, total alkalinity,
chloride, sulphate, nitrate,
fluoride, sodium, potassium
salinity
Total nitrogen, total phosphorus,
DO, BOD, COD, Phenol
Heavy metals
Total coliforms, faecal coliforms
Phyto plankton
Zooplankton
Fish & other aquatic flora &
fauna
(parameters are given in ToR for
EIA studies based on nature of
project, raw material & process
Set of grab samples during
pre and post- monsoon for
ground and surface water
for the whole study zone.
For lab. Analysis the
samples should be
preserved for transport safe
Diurnal and season-wise Samples for water quality should
be collected and analyzed as per:
IS: 2488 (Part 1-5) methods for
sampling and testing of industrial
effluents
Standard methods for examination
of water and waste water analysis
published by American Public
Health Association.
International standard practices
for benthos and aquatic flora &
fauna

iii
Sampling Attributes
Network Frequency
Measurement Method Remarks
technology, location-nature/activities
within of air basin)
For Surface Water Bodies
Total Carbon
PH
Dissolved Oxygen
Biological Oxygen
Demand
Free NH4
Boron
Sodium Absorption ratio
Electrical Conductivity
Monitoring locations
should include up-stream,
on site, down stream of
proposed discharge point.
Besides sampling should
cover width of the river in
case water quality modeling
is proposed.
Standard methodology for
collection of surface water
(BIS standards)
At least one grab sample
per location per season
Yield & impact on water
sources to be measured
during critical season
River Stretch within
project area be divided in
grids (say 1 km length and
1/3 width) and samples
should be from each grid
at a time when the
wastewater discharged by
other sources of pollution
is expected to be
maximum
Samples for water quality should
be collected and analyzed as per:
IS: 2488 (Part 1-5) methods for
sampling and testing of industrial
effluents
Standard methods for examination
of water and wastewater analysis
published by American Public
Health Association.
Historical data should be
collected from relevant offices
such as central water
commission, state and central
ground water board, Irrigation
dept.
Parameters for wastewater characterization
Temp, colour, odour, turbidity,
TSS, TDS
PH , alkalinity as CaCO3, p
value, M value, tatal hardness as
CaCO3, chloride as cl, sulphate
as S04, Nitrate as NO3, Floride
as F, Phosphate as P04,
Chromium as Cr (Hexavalent,
total) Ammonical Nitrogen as
N, TKN, % sodium, BOD at 20
C, COD, DO, total residual
chlorine as Cl2, oil and grease,
sulphide, phenolic compound
Implant Source depending
upon the different waste
streams the parameters can
be optimized
Grab and composite
sampling representing avg
of different process
operations as well as worst
emission scenario should be
represented
Different operational
cycles as well as raw
material variations should
be reflected in the analysis
Samples for water quality should
be collected and analyzed as per:
IS: 2488 (Part 1-5) methods for
sampling and testing of industrial
effluents
Standard methods for examination
of water and wastewater analysis
published by American Public
Health Association.
All plant sources categorized
as:
Different Process waste
streams as well as run-off
conditions
ETP wastewater
Domestic/ sanitary wastewater
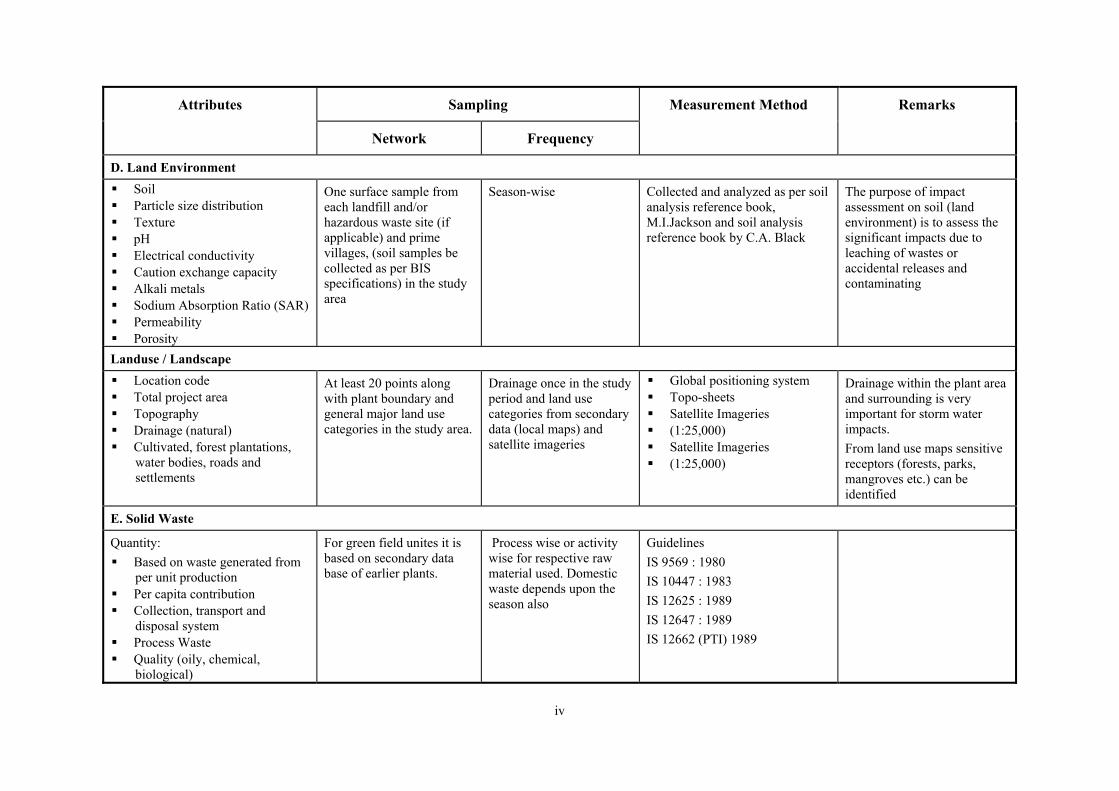
iv
Sampling Attributes
Network Frequency
Measurement Method Remarks
D. Land Environment
Soil
Particle size distribution
Texture
pH
Electrical conductivity
Caution exchange capacity
Alkali metals
Sodium Absorption Ratio (SAR)
Permeability
Porosity
One surface sample from
each landfill and/or
hazardous waste site (if
applicable) and prime
villages, (soil samples be
collected as per BIS
specifications) in the study
area
Season-wise Collected and analyzed as per soil
analysis reference book,
M.I.Jackson and soil analysis
reference book by C.A. Black
The purpose of impact
assessment on soil (land
environment) is to assess the
significant impacts due to
leaching of wastes or
accidental releases and
contaminating
Landuse / Landscape
Location code
Total project area
Topography
Drainage (natural)
Cultivated, forest plantations,
water bodies, roads and
settlements
At least 20 points along
with plant boundary and
general major land use
categories in the study area.
Drainage once in the study
period and land use
categories from secondary
data (local maps) and
satellite imageries
Global positioning system
Topo-sheets
Satellite Imageries
(1:25,000)
Satellite Imageries
(1:25,000)
Drainage within the plant area
and surrounding is very
important for storm water
impacts.
From land use maps sensitive
receptors (forests, parks,
mangroves etc.) can be
identified
E. Solid Waste
Quantity:
Based on waste generated from
per unit production
Per capita contribution
Collection, transport and
disposal system
Process Waste
Quality (oily, chemical,
biological)
For green field unites it is
based on secondary data
base of earlier plants.
Process wise or activity
wise for respective raw
material used. Domestic
waste depends upon the
season also
Guidelines
IS 9569 : 1980
IS 10447 : 1983
IS 12625 : 1989
IS 12647 : 1989
IS 12662 (PTI) 1989

v
Sampling Attributes
Network Frequency
Measurement Method Remarks
Quality:
General segregation into
biological/organic/inert/hazardo
us
Loss on heating
pH
Electrical Conductivity
Calorific value, metals etc.
Grab and Composite
samples
Process wise or activity
wise for respective raw
material used. Domestic
waste depends upon the
season also
Analysis
IS 9334 : 1979
IS 9235 : 1979
IS 10158 : 1982
Hazardous Waste
Permeability And porosity
Moisture pH
Electrical conductivity
Loss on ignition
Phosphorous
Total nitrogen
Caution exchange capacity
Particle size distribution
Heavy metal
Ansonia
Fluoride
Grab and Composite
samples. Recyclable
components have to
analyzed for the recycling
requirements
Process wise or activity
wise for respective raw
material used.
Analysis
IS 9334 : 1979
IS 9235 : 1979
IS 10158 : 1982
Impacts of hazardous waste
should be performed critically
depending on the waste
characteristics and place of
discharge. For land disposal
the guidelines should be
followed and impacts of
accidental releases should be
assessed
F. Biological Environment Aquatic
Primary productivity
Aquatic weeds
Enumeration of
phytoplankton, zooplankton and
benthos
Fisheries
Diversity indices
Considering probable
impact, sampling points and
number of samples to be
decided on established
guidelines on ecological
studies based on site eco-
environment setting within
10/25 km radius from the
Season changes are very
important
Standards techniques (APHA et.
Al. 1995, Rau and Wooten 1980)
to be followed for sampling and
measurement
Seasonal sampling for aquatic
biota
One season for terrestrial
biota, in addition to vegetation
studies during monsoon
season
Preliminary assessment
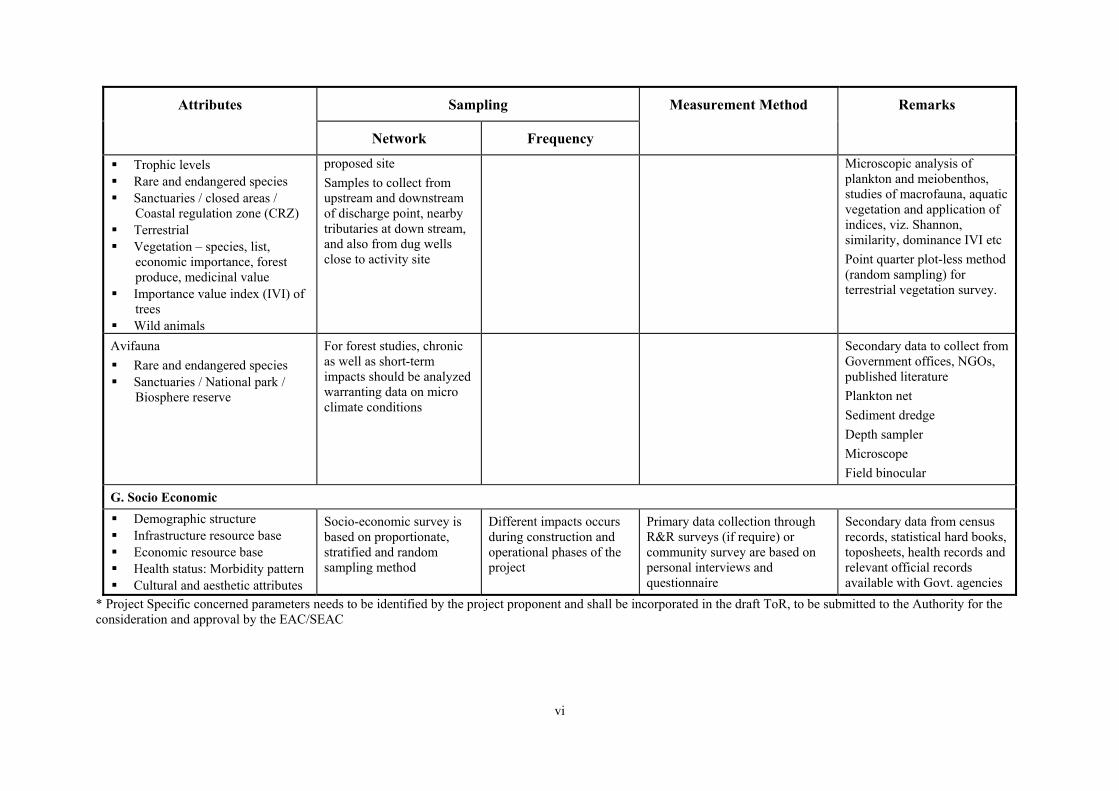
vi
Sampling Attributes
Network Frequency
Measurement Method Remarks
Trophic levels
Rare and endangered species
Sanctuaries / closed areas /
Coastal regulation zone (CRZ)
Terrestrial
Vegetation – species, list,
economic importance, forest
produce, medicinal value
Importance value index (IVI) of
trees
Wild animals
proposed site
Samples to collect from
upstream and downstream
of discharge point, nearby
tributaries at down stream,
and also from dug wells
close to activity site
Microscopic analysis of
plankton and meiobenthos,
studies of macrofauna, aquatic
vegetation and application of
indices, viz. Shannon,
similarity, dominance IVI etc
Point quarter plot-less method
(random sampling) for
terrestrial vegetation survey.
Avifauna
Rare and endangered species
Sanctuaries / National park /
Biosphere reserve
For forest studies, chronic
as well as short-term
impacts should be analyzed
warranting data on micro
climate conditions
Secondary data to collect from
Government offices, NGOs,
published literature
Plankton net
Sediment dredge
Depth sampler
Microscope
Field binocular
G. Socio Economic
Demographic structure
Infrastructure resource base
Economic resource base
Health status: Morbidity pattern
Cultural and aesthetic attributes
Socio-economic survey is
based on proportionate,
stratified and random
sampling method
Different impacts occurs
during construction and
operational phases of the
project
Primary data collection through
R&R surveys (if require) or
community survey are based on
personal interviews and
questionnaire
Secondary data from census
records, statistical hard books,
toposheets, health records and
relevant official records
available with Govt. agencies
* Project Specific concerned parameters needs to be identified by the project proponent and shall be incorporated in the draft ToR, to be submitted to the Authority for the
consideration and approval by the EAC/SEAC

ANNEXURE VIII Sources of Secondary Data Collection

Annexure VIII A: Potential Sources of Data For EIA
Information
Air Environment
1. Meteorology- Temperature, Rainfall, Humidity,
Inversion, Seasonal Wind rose pattern (16 point
compass scale), cloud cover, wind speed, wind
direction, stability, mixing depth
2. Ambient Air Quality- 24 hourly concentration of
SPM, RPM, SO2, NOx, CO
Water Environment
3. Surface water- water sources, water flow (lean
season), water quality, water usage, Downstream
water users
Command area development plan
Catchment treatment plan
4. Ground Water- groundwater recharge
rate/withdrawal rate, ground water potential
groundwater levels (pre monsoon, post monsoon),
ground water quality, changes observed in quality
and quantity of ground water in last 15 years
5. Coastal waters- water quality, tide and current data,
bathymetry
Biological Environment
6. Description of Biological Environment- inventory
of flora and fauna in 7 km radius, endemic species,
endangered species, Aquatic Fauna, Forest land,
forest type and density of vegetation, biosphere,
national parks, wild life sanctuaries, tiger reserve,
elephant reserve, turtle nesting ground, core zone
of biosphere reserve, habitat of migratory birds,
routes of migratory birds
Land Environment
7. Geographical Information-Latitude, Longitude,
Elevation ( above MSL)
Source
¤ Indian Meteorology Department, Pune
¤ Central Pollution Control Board (CPCB),
¤ State Pollution Control Board (SPCB),
¤ Municipal Corporations
¤ Ministry of Environment and Forests (MoEF)
¤ State Department of Environment (DoEN)
¤ Central Water Commission (CWC),
¤ Central Pollution Control Board (CPCB),
¤ State Pollution Control Board (SPCB), Central Water
and Power Research Institute (CWPRS), Pune
¤ State Irrigation Department
¤ Hydel Power generation organizations such as NHPC, State SEBs
¤ Central Ground Water Board (CGWB)
¤ Central Ground Water Authority (CGWA)
¤ State Ground Water Board (SGWB)
¤ National Water Development Authority (NWDA)
¤ Department of Ocean Development, New Delhi ¤ State Maritime Boards
¤ Naval Hydrographer’s Office, Dehradun
¤ Port Authorities
¤ National Institute of Oceanography (NIO), Goa
¤ District Gazetteers
¤ National Remote Sensing Agency (NRSA), Hyderabad
¤ Forest Survey of India, Dehradun
¤ Wildlife Institute of India
¤ World Wildlife Fund
¤ Zoological Survey of India
¤ Botanical Survey of India
¤ Bombay Natural History Society, (BNHS), Mumbai
¤ State Forest Departments
¤ State Fisheries Department
¤ Ministry of Environment and Forests
¤ State Agriculture Departments
¤ State Agriculture Universities
¤ Toposheets of Survey of India, Pune
¤ National Remote Sensing Agency (NRSA), Hyderabad
¤ Space Application Centre (SAC), Ahmedabad
REPORT ON SECONDARY DATA COLLECTION FOR ENVIRONMENTAL INFORMATION CENTRE 1

Information
8. Nature of Terrain, topography map indicating
contours (1:2500 scale)
9. Hydrogeology- Hydrogeological report (in case of
ground water is used/area is drought
prone/wastewater is likely to discharged on land)
Geomorphological analysis (topography and
drainage pattern)
Geological analysis (Geological
Formations/Disturbances- geological and structural
maps, geomorphological contour maps, structural
features, including lineaments, fractures, faults and
joints)
Hydrogeological analysis (disposition of permeable
formations, surface-ground water links, hydraulic
parameter determination etc)
Analysis of the natural soil and water to assess
pollutant absorption capacity
10. Nature of Soil, permeability, erodibility
classification of the land
11. Landuse in the project area and 10 km radius of the
periphery of the project
12. Coastal Regulation Zones- CRZMP, CRZ
classification, Demarcation of HTL and LTL෪
෪ Agencies authorized for approval of demarcation of HTL and LTL
Source
¤ Survey of India Toposheets
¤ National Remote Sensing Agency (NRSA),
Hyderabad
¤ State Remote Sensing Centre,
¤ Space Application Centre (SAC), Ahmedabad
¤ NRSA, Hyderbad
¤ Survey of India Toposheets
¤ Geological Survey of India
¤ State Geology Departments
¤ State Irrigation Department
¤ Department of Wasteland Development, Ministry of Rural Areas
¤ National Water Development Authority (NWDA)
¤ Agriculture Universities
¤ State Agriculture Department
¤ Indian Council for Agriculture Research
¤ State Soil Conservation Departments
¤ National Bureau of Soil Survey and Landuse Planning
¤ Central Arid Zone Research Institute (CAZRI), Jodhpur
¤ Survey of India- Toposheets
¤ All India Soil and Landuse Survey; Delhi
¤ National Remote Sensing Agency (NRSA),
Hyderabad
¤ Town and County Planning Organisation
¤ State Urban Planning Department
¤ Regional Planning Authorities (existing and proposed
plans)
¤ Village Revenue Map- District Collectorate
¤ Directorate of Economics and Statistics-State
Government
¤ Space Application Centre, Ahmedabad
¤ Urban Development Department
¤ State Department of Environment
¤ State Pollution Control Board
¤ Space Application Centre*
¤ Centre for Earth Sciences Studies, Thiruvanthapuram*
¤ Institute of Remote Sensing, Anna University
Chennai*
¤ Naval Hydrographer’s Office, Dehradun*
¤ National Institute of Oceanography, Goa*
¤ National Institute of Ocean Technology, Chennai
¤ Centre for Earth Science Studies
REPORT ON SECONDARY DATA COLLECTION FOR ENVIRONMENTAL INFORMATION CENTRE 2

Information
Social
13. Socioeconomic - population, number of houses
and present occupation pattern within 7 km from
the periphery of the project
14. Monuments and heritage sites
Natural Disasters
15. Seismic data (Mining Projects)- zone no, no of
earthquakes and scale, impacts on life, property
existing mines
16. Landslide prone zone, geomorphological
conditions, degree of susceptibility to mass
movement, major landslide history (frequency of
occurrence/decade), area affected, population
affected
17. Flood/cyclone/droughts- frequency of occurrence
per decade, area affected, population affected
Industrial
18. Industrial Estates/Clusters, Growth Centres
19. Physical and Chemical properties of raw material
and chemicals (Industrial projects); fuel quality
20. Occupational Health and Industrial Hygiene-
major occupational health and safety hazards,
health and safety requirements, accident histories
21. Pollutant release inventories (Existing pollution
sources in area within 10 km radius)
22. Water requirement (process, cooling water, DM
water, Dust suppression, drinking, green belt, fire
service)
Source
¤ Census Department
¤ District Gazetteers- State Government
¤ District Statistics- District Collectorate
¤ International Institute of Population Sciences,
Mumbai (limited data)
¤ Central Statistical Organisation
District Gazetteer
Archeological Survey of India,
INTACH
District Collectorate
Central and State Tourism Department
State Tribal and Social Welfare Department
¤ Indian Meteorology Department, Pune
¤ Geological Survey of India
¤ Space Application Centre
¤ Natural Disaster Management Division in Department of Agriculture and Cooperation
¤ Indian Meteorological Department
¤ State Industrial Corporation
¤ Industrial Associations
¤ State Pollution Control Boards ¤ Confederation Indian Industries (CII)
¤ FICCI
¤ Material and Safety Data Sheets ¤ ENVIS database of Industrial Toxicological Research
Centre, Lucknow
¤ Indian Institute Petroleum
¤ Central Labour Institute, Mumbai
¤ Directorate of Industrial Safety
¤ ENVIS Database of Industrial Toxicological Research
Centre, Lucknow
¤ National Institute of Occupational Health,
Ahmedabad
¤ Project proponents which have received EC and have commenced operations
¤ EIA Reports
¤ National and International Benchmarks
REPORT ON SECONDARY DATA COLLECTION FOR ENVIRONMENTAL INFORMATION CENTRE 3

Annexure VIII B: Summary of Available Data with Potential Data Sources for EIA
Agency
1. Archaeological Survey of India
Department of Culture
Government of India
Janpath, New Delhi - 110011
2. Botanical Survey Of India
P-8, Brabourne Road Calcutta
700001
Tel#033 2424922
Fax#033 2429330
Email: [email protected]. .
RO - Coimbatore, Pune, Jodhpur,
Dehradun, Allahabad, Gantok,
Itanagar, Port Blair
3. Bureau of Indian Standards
Manak Bhawan, 9 Bahadur Shah
Zafar Marg, New Delhi 110 002
Tel#3230131, 3233375, 3239402 (10
lines)
Fax : 91 11 3234062, 3239399,
3239382
Email- [email protected]
4. Central Water Commission (CWC)
Sewa Bhawan, R.K.Puram
New Delhi - 110066
RO- Bangalore, Bhopal,
Bhubaneshwar, Chandigarh,
Coimbatore/Chennai, Delhi,
Hyderabad, Lucknow, Nagpur,
Patna, Shillong, Siliguri and
Vadodara
5. Central Ground Water Board
(HO) N.H.IV, New CGO
Complex,
Faridabad - 121001
RO - Guwahati, Chandigarh,
Ahemadabad, Trivandrum,
Calcutta, Bhopal, Lucknow,
Banglore, Nagpur, Jammu,
Bhubneshwar, Raipur, Jaipur,
Chennai, Hyderabad, Patna
16 Based on web search and literature review
Information Available
¤ Inventory of monuments and sites of national importance- Listing and
documentation of monuments according to world heritage, pre
historic, proto historic and secular, religious places and forts
¤ Photodiversity documentation of flora at National, State and District level and flora of protected areas, hotspots, fragile ecosystems, sacred
groves etc
¤ Identification of threatened species including endemics, their
mapping, population studies
¤ Database related to medicinal plants, rare and threatened plant species
¤ Red data book of Indian plants (Vol 1,2, and 3)
¤ Manual for roadside and avenue plantation in India
¤ Bureau of Indian Standards Committees on Earthquake Engineering and Wind Engineering have a Seismic Zoning Map and the Wind
Velocity Map including cyclonic winds for the country
¤ Central Data Bank -Collection, collation and Publishing of Hydrological, Hydrometeorological, Sediment and Water Quality
data-.
¤ Basin wise Master Plans
¤ Flood atlas for India
¤ Flood Management and Development and Operation of Flood
Forecasting System- CWC operate a network of forecasting stations
Over 6000 forecasts are issued every year with about 95% of the
forecasts within the permissible limit.
¤ Water Year Books, Sediment Year Books and Water Quality Year
Books.
¤ Also actively involved in monitoring of 84 identified projects through National, State and Project level Environmental Committees for
ensuring implementation of environmental safeguards
¤ surveys, exploration, monitoring of ground water development
REPORT ON SECONDARY DATA COLLECTION FOR ENVIRONMENTAL INFORMATION CENTRE 4

6. Central Pollution Control Board
Parivesh Bhawan, CBD-cum-Office
Complex
East Arjun Nagar, DELHI - 110 032
INDIA
E-mail : [email protected]
7. Central Arid Zone Research
Institute, Jodhpur
Email : [email protected]
Regional Centre at Bhuj in Gujarat
8. Central Inland Capture Fisheries
Research Institute, Barrackpore-
743101,
Tel#033-5600177
Fax#033-5600388
Email : [email protected]
9. Central Institute of Brackish Water
Aquaculture
141, Marshalls Road, Egmore ,
Chennai - 600 008,
Tel# 044-8554866, 8554891,
Director (Per) 8554851
Fax#8554851,
10. Central Marine Fisheries Research
Institute (CMFRI), Cochin
11. Central Water and Power Research
Station, Pune
Tel#020-4391801-14; 4392511;
4392825
Fax #020-4392004,4390189
12. Central Institute of Road Transport,
Bhosari, Pune
411 026, India.
Tel : +91 (20) 7125177, 7125292,
7125493, 7125494
¤ National Air Quality Monitoring Programme
¤ National River Water Quality Monitoring Programme- Global
Environment Monitoring , MINARS
¤ Zoning Atlas Programme
¤ Information on 17 polluting category industries (inventory, category
wise distribution, compliance, implementation of pollution control
programmes
¤ AGRIS database on all aspects of agriculture from 1975 to date
¤ Also have cell on Agriculture Research Information System;
¤ Working on ENVIS project on desertification
¤ Repository of information on the state of natural resources and
desertification processes and their control
¤ The spectrum of activities involves researches on basic resource inventories; monitoring of desertification, rehabilitation and
management of degraded lands and other areas
¤ Data Base on
Ecology and fisheries of major river systems of India. Biological features of commercially important riverine and estuarine
fish species.
Production functions and their interactions in floodplain wetlands.
¤ Activities - Environmental Impact Assessment for Resource Management ; Fisheries Resource surveys
¤ Repository of information on brackish water fishery resources with systematic database of coastal fishery resources for ARIS
¤ Agricultural Research Information System (ARIS) database covers
State wise data on soil and water quality parameters, land use pattern, production and productivity trends,
¤ Social, economic and environmental impacts of aquaculture farming,
¤ Guidelines and effluent standards for aquaculture farming
¤ Assessing and monitoring of exploited and un-exploited fish stocks in
Indian EEZ
¤ Monitoring the health of the coastal ecosystems, particularly the
endangered ecosystems in relation to artisanal fishing, mechanised
fishing and marine pollution
¤ The institute has been collecting data on the catch and effort and
biological characteristics for nearly half a century based on scientifically developed sampling scheme, covering all the maritime
States of the country
¤ The voluminous data available with the institute is managed by the
National Marine Living Resources Data Centre (NMLRDC)
¤ Numerical and Physical models for hydro-dynamic simulations
¤ Repository of data on all aspects of performance of STUs and a host
of other related road transport parameters
REPORT ON SECONDARY DATA COLLECTION FOR ENVIRONMENTAL INFORMATION CENTRE 5

13. Department of Ocean Development ¤
¤ ¤ ¤
¤
¤
¤ ¤ ¤
¤
¤
14. Environment Protection Training ¤
and Research Institute
Gachibowli, Hyderabad - 500 019,
India Phone: +91-40-3001241,
3001242, 3000489
Fax: +91-40- 3000361
E-mail: [email protected]
Assessment of environment parameters and marine living resources
(primary and secondary) in Indian EEZ (Nodal Agency NIO Kochi)
Stock assessment, biology and resource mapping of deep sea shrimps,
lobsters and fishes in Indian EEZ (Nodal agency-Fisheries Survey of
India)
Investigations of toxical algal blooms and benthic productivity in
Indian EEZ (Nodal agency- Cochin University of Science and technology)
Coastal Ocean Monitoring and Prediction System (COMAP) -
monitoring and modelling of marine pollution along entire Indian
coast and islands. Parameters monitored are temp, salinity, DO, pH,
SS, BOD, inorganic phosphate, nitrate, nitrite, ammonia, total
phosphorus, total nitrite, total organic carbon, petroleum
hydrocarbons, pathogenic vibros, pathogenic E.coli, shigella,
salmonella, heavy metals (Cd, Hg, Pb) and pesticide residues (DDT,
BHC, Endosulfan). Monitoring is carried out along the ecologically
sensitive zones and urban areas (NIO Mumbai- Apex coordinating
agency).
Sea Level Measurement Programe (SELMAM)- sea level measurement
at selected stations (Porbandar, Bombay, Goa, Cochin, Tuticorin,
Madras, Machilipatnam, Visakhapatnam, Paradeep, Calcutta and
Kavaratti (Lakshadweep Island)) along Indian coast and islands using
modern tide gauges
Detailed coastal maps through Survey of India showing contour at 1/2
a metre interval in the scale of 1:25000. (Nellore- Machhalipatnam work
already over)
Marine Data Centre (MDC) IMD for Ocean surface meteorology,
GSI for marine geology, SOI for tide levels, Naval Hydrographic
Office for bathymetry, NIO Goa for physical chemical and biological
oceanography, NIO Mumbai for marine pollution, CMFRI for
coastal fisheries, Institute of Ocean Management Madras for coastal
geomorphology
DOD has setup Indian National Centre for Ocean Information
Services (INCOIS) at Hyderabad for generation and dissemination of
ocean data products (near real time data products such as sea surface
temperature, potential fishing zones, upwelling zones, maps, eddies,
chlorophyll, suspended sediment load etc). MDC will be integrated
with INCOIS
Integrated Coastal and Marine Area Management (ICMAM)
programme - GIS based information system for management of 11
critical habitats namely Pichavaram, Karwar, Gulf of Mannar, Gulf of
Khambat, Gulf of Kutch, Malvan, Cochin, Coringa mangroves,
Gahirmata, Sunderbans and Kadamat (Lakshadeep)
Wetland maps for Tamil Nadu and Kerala showing the locations of
lagoons, backwaters, estuaries, mudflats etc (1:50000 scale)
Coral Reef Maps for Gulf of Kachch, Gulf of Mannar, Andaman and Nicobar and Lakshadeep Islands (1:50,000 scale) indicating the
condition of corals, density etc
Environment Information Centre- has appointed EPTRI as the Distributed Information Centre for the Eastern Ghats region of India.
EIC Collaborates with the Stockholm Environment Institute Sweden
Database on Economics of Industrial Pollution Prevention in India
Database of Large and Medium Scale Industries of Andhra Pradesh Environmental Status of the Hyderabad Urban Agglomeration
Study on ‘water pollution-health linkages’ for a few Districts of A.P
REPORT ON SECONDARY DATA COLLECTION FOR ENVIRONMENTAL INFORMATION CENTRE 6

¤
15. Forest Survey of India (FSI) ¤
Kaulagarh Road, P.O., IPE ¤
Dehradun - 248 195
Tel# 0135-756139, 755037, 754507 ¤
Fax # 91-135-759104
E-Mail : [email protected] ¤
¤
RO- Banglore, Calcutta, Nagpur
and Shimla
16. Geological Survey of India ¤
27 Jawaharlal Nehru Road, Calcutta ¤
700 016, India Telephone +91-33-
2496941 FAX 91-33-2496956 ¤
17. Indian Council of Agriculture ¤
Research,
Krishi Bhawan, New Delhi, ¤
Tel#011-338206
¤
− ICAR complex, Goa- Agro
metrology ¤
− Central Arid Zone Research
Institute- Agro forestry ¤
− Central Soil salinity Research
Institute,
− Indian Institute of Soil Science
− Central Soil and Water ¤
Conservation Research and
Training Institute ¤
− National Bureau of Soil Survey ¤
and Landuse Planning ¤
18. Indian Bureau of Mines ¤
Indira Bhawan, Civil Lines Nagpur ¤
Ph no - 0712-533 631,
Fax- 0712-533 041 ¤
Environment Quality Mapping
Macro level studies for six districts in the State of Andhra Pradesh
Micro level studies for two study zones presenting the permissible
pollutant load and scoping for new industrial categories
Zonation of the IDA, Parwada which helped APIIC to promote the
land for industrial development
Disaster management plan for Visakhapatnam Industrial Bowl Area
State of Forest Report (Biannual) National Forest Vegetation Map (Biannual exercise) (on 1: 1 million
scale)
Thematic mapping on 1:50,000 scale depicting the forest type, species
composition, crown density of forest cover and other landuse National
Basic Forest Inventory System
Inventory survey of non forest area
Forest inventory report providing details of area estimates,
topographic description, health of forest, ownership pattern,
estimation of volume and other growth parameters such as height and
diameter in different types of forest, estimation of growth,
regeneration and mortality of important species, volume equation and
wood consumption of the area studied
Environmental hazards zonation mapping in mineral sector
Codification of base line information of geo-environmental
appreciation of any terrain and related EIA and EMP studies
Lineament and geomorphological map of India on 1:20,000 scale.
Photo-interpreted geological and structural maps of terrains with
limited field checks.
A total of 80,000 profiles at 10 kms grid across the country were
analyzed to characterize the soils of India.
Detailed soil maps of the Country (1:7 million), State (1:250,000) and districts map (1:50,000) depicting extent of degradation (1:4.4 millions)
have been prepared.
Thematic maps depicting soil depth, texture drainage, calcareousness,
salinity, pH, slope and erosion have been published
Agro-climate characterization of the country based on moisture,
thermal and sunshine regimes
Agro-ecological zones (20) and sub-zones (60) for the country were delineated based on physiography, soils, climate, Length of Growing
Period and Available Water Content, and mapped on 1:4.4 million
scale.
Digitization of physiography and soil resource base on 1:50,000 scale for 14 States have been completed.
.Soil fertility maps of N,P,K,S and Zn have also been developed
Water quality guidelines for irrigation and naturally occurring
saline/sodic water
Calibration and verification of ground water models for predicting
water logging and salinity hazards in irrigation commands
National mineral inventory for 61 minerals and mineral maps
Studies on environmental protection and pollution control in regard
to the mining and mineral beneficiation operations
Collection, processing and storage of data on mines, minerals and
mineral-based industries, collection and maintenance of world mineral
intelligence, foreign mineral legislation and other related matters
REPORT ON SECONDARY DATA COLLECTION FOR ENVIRONMENTAL INFORMATION CENTRE 7
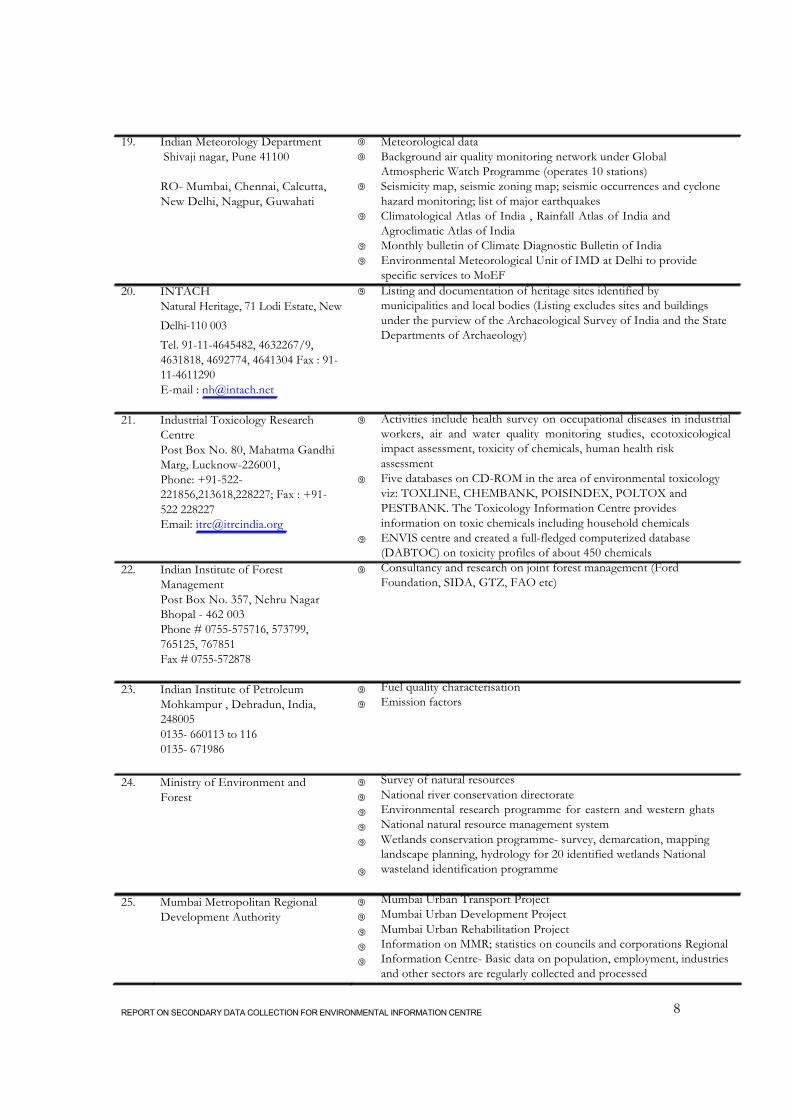
19. Indian Meteorology Department ¤
Shivaji nagar, Pune 41100 ¤
RO- Mumbai, Chennai, Calcutta, ¤
New Delhi, Nagpur, Guwahati
¤
¤
¤
20. INTACH ¤
Natural Heritage, 71 Lodi Estate, New
Delhi-110 003
Tel. 91-11-4645482, 4632267/9,
4631818, 4692774, 4641304 Fax : 91-
11-4611290
E-mail : [email protected]
21. Industrial Toxicology Research ¤
Centre
Post Box No. 80, Mahatma Gandhi
Marg, Lucknow-226001,
Phone: +91-522- ¤
221856,213618,228227; Fax : +91-
522 228227
Email: [email protected]
¤
22. Indian Institute of Forest ¤
Management
Post Box No. 357, Nehru Nagar
Bhopal - 462 003
Phone # 0755-575716, 573799,
765125, 767851
Fax # 0755-572878
23. Indian Institute of Petroleum ¤
Mohkampur , Dehradun, India, ¤
248005
0135- 660113 to 116
0135- 671986
24. Ministry of Environment and ¤
Forest ¤
¤
¤
¤
¤
25. Mumbai Metropolitan Regional ¤
Development Authority ¤
¤
¤
¤
Meteorological data
Background air quality monitoring network under Global
Atmospheric Watch Programme (operates 10 stations)
Seismicity map, seismic zoning map; seismic occurrences and cyclone
hazard monitoring; list of major earthquakes
Climatological Atlas of India , Rainfall Atlas of India and
Agroclimatic Atlas of India
Monthly bulletin of Climate Diagnostic Bulletin of India
Environmental Meteorological Unit of IMD at Delhi to provide
specific services to MoEF
Listing and documentation of heritage sites identified by
municipalities and local bodies (Listing excludes sites and buildings
under the purview of the Archaeological Survey of India and the State
Departments of Archaeology)
Activities include health survey on occupational diseases in industrial
workers, air and water quality monitoring studies, ecotoxicological
impact assessment, toxicity of chemicals, human health risk
assessment
Five databases on CD-ROM in the area of environmental toxicology
viz: TOXLINE, CHEMBANK, POISINDEX, POLTOX and
PESTBANK. The Toxicology Information Centre provides
information on toxic chemicals including household chemicals
ENVIS centre and created a full-fledged computerized database
(DABTOC) on toxicity profiles of about 450 chemicals
Consultancy and research on joint forest management (Ford
Foundation, SIDA, GTZ, FAO etc)
Fuel quality characterisation
Emission factors
Survey of natural resources
National river conservation directorate Environmental research programme for eastern and western ghats
National natural resource management system
Wetlands conservation programme- survey, demarcation, mapping
landscape planning, hydrology for 20 identified wetlands National
wasteland identification programme
Mumbai Urban Transport Project
Mumbai Urban Development Project
Mumbai Urban Rehabilitation Project
Information on MMR; statistics on councils and corporations Regional
Information Centre- Basic data on population, employment, industries
and other sectors are regularly collected and processed
REPORT ON SECONDARY DATA COLLECTION FOR ENVIRONMENTAL INFORMATION CENTRE 8
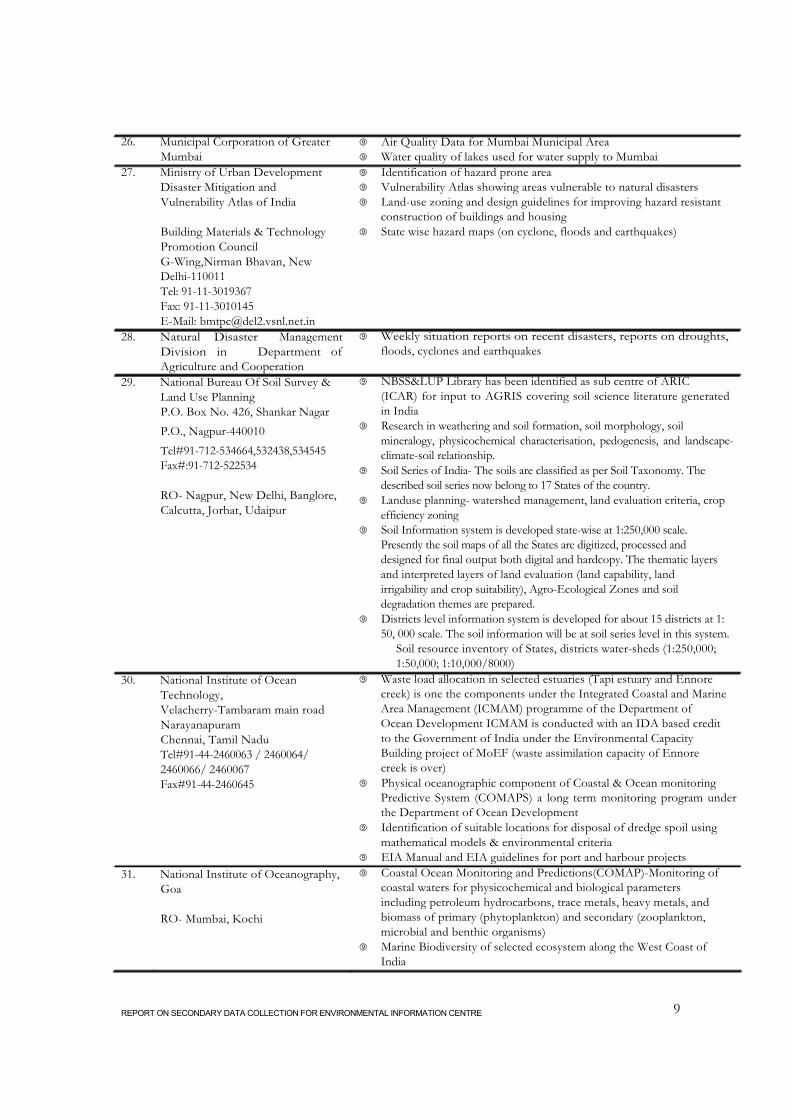
26. Municipal Corporation of Greater
Mumbai
27. Ministry of Urban Development
Disaster Mitigation and
Vulnerability Atlas of India
Building Materials & Technology
Promotion Council
G-Wing,Nirman Bhavan, New
Delhi-110011
Tel: 91-11-3019367
Fax: 91-11-3010145
E-Mail: [email protected]
28. Natural Disaster Management
Division in Department of
Agriculture and Cooperation
29. National Bureau Of Soil Survey &
Land Use Planning
P.O. Box No. 426, Shankar Nagar
P.O., Nagpur-440010
Tel#91-712-534664,532438,534545
Fax#:91-712-522534
RO- Nagpur, New Delhi, Banglore,
Calcutta, Jorhat, Udaipur
30. National Institute of Ocean
Technology,
Velacherry-Tambaram main road
Narayanapuram
Chennai, Tamil Nadu
Tel#91-44-2460063 / 2460064/
2460066/ 2460067
Fax#91-44-2460645
31. National Institute of Oceanography,
Goa
RO- Mumbai, Kochi
¤ Air Quality Data for Mumbai Municipal Area
¤ Water quality of lakes used for water supply to Mumbai
¤ Identification of hazard prone area
¤ Vulnerability Atlas showing areas vulnerable to natural disasters
¤ Land-use zoning and design guidelines for improving hazard resistant
construction of buildings and housing
¤ State wise hazard maps (on cyclone, floods and earthquakes)
¤ Weekly situation reports on recent disasters, reports on droughts,
floods, cyclones and earthquakes
¤ NBSS&LUP Library has been identified as sub centre of ARIC
(ICAR) for input to AGRIS covering soil science literature generated
in India
¤ Research in weathering and soil formation, soil morphology, soil
mineralogy, physicochemical characterisation, pedogenesis, and landscape-
climate-soil relationship.
¤ Soil Series of India- The soils are classified as per Soil Taxonomy. The
described soil series now belong to 17 States of the country.
¤ Landuse planning- watershed management, land evaluation criteria, crop
efficiency zoning
¤ Soil Information system is developed state-wise at 1:250,000 scale.
Presently the soil maps of all the States are digitized, processed and
designed for final output both digital and hardcopy. The thematic layers
and interpreted layers of land evaluation (land capability, land
irrigability and crop suitability), Agro-Ecological Zones and soil
degradation themes are prepared.
¤ Districts level information system is developed for about 15 districts at 1:
50, 000 scale. The soil information will be at soil series level in this system.
Soil resource inventory of States, districts water-sheds (1:250,000;
1:50,000; 1:10,000/8000)
¤ Waste load allocation in selected estuaries (Tapi estuary and Ennore creek) is one the components under the Integrated Coastal and Marine
Area Management (ICMAM) programme of the Department of
Ocean Development ICMAM is conducted with an IDA based credit
to the Government of India under the Environmental Capacity Building project of MoEF (waste assimilation capacity of Ennore
creek is over)
¤ Physical oceanographic component of Coastal & Ocean monitoring
Predictive System (COMAPS) a long term monitoring program under the Department of Ocean Development
¤ Identification of suitable locations for disposal of dredge spoil using
mathematical models & environmental criteria
¤ EIA Manual and EIA guidelines for port and harbour projects
¤ Coastal Ocean Monitoring and Predictions(COMAP)-Monitoring of coastal waters for physicochemical and biological parameters
including petroleum hydrocarbons, trace metals, heavy metals, and
biomass of primary (phytoplankton) and secondary (zooplankton,
microbial and benthic organisms)
¤ Marine Biodiversity of selected ecosystem along the West Coast of
India
REPORT ON SECONDARY DATA COLLECTION FOR ENVIRONMENTAL INFORMATION CENTRE 9

32. National Botanical Research ¤
Institute,
Post Box No 436 Rana Pratap Marg
Lucknow- 226001,
Tel: (+91) 522 271031-35 Fax: (+91)
522 282849, 282881 ¤
Lucknow
33. National Geophysical Research ¤
Institute, Uppal Road, Hyderabad
Telephone:0091-40-7171124,
FAX:0091-40-7171564
34. National Environmental ¤
Engineering Research Institute, ¤
Nagpur
RO- Mumbai, Delhi, Chennai,
Calcutta, Ahmedabad, Cochin,
Hyderabad, Kanpur
35. National Hydrology Institute, ¤
Roorkee
RO- Belgaum (Hard Rock Regional
Centre), Jammu (Western
Himalayan Regional Centre),
Guwahati (North Eastern Regional
Centre), Kakinada (Deltaic Regional
Centre), Patna (Ganga Plains North
Regional Centre), and Sagar (Ganga
Plains South)
36. National Institute Of Urban Affairs, ¤
India Habitat Centre, New Delhi
37. National Institute of Occupational ¤
Health
Meghaninagar, Ahmedabad
RO- Banglore, Calcutta ¤
38. NRSA Data Centre ¤
Department of Space, Balanagar,
Hyderabad 500 037
Ph- 040-3078560
3078664
39. Rajiv Gandhi National Drinking ¤
Water Mission
40. Space Application Centre ¤
Value Added Services Cell (VASC) ¤
Remote Sensing Application Area
Ahmedabad 380 053 ¤
079-676 1188 ¤
Dust filtering potential of common avenue trees and roadside shrubs
has been determined, besides studies have also been conducted on
heavy-metals accumulation potential of aquatic plants supposedly
useful as indicators of heavy metal pollution in water bodies and
capable of reducing the toxic metals from water bodies.
Assessment of bio-diversity of various regions of India
Exploration, assessment and management of ground water resources
including ground water modelling and pollution studies
National Air Quality Monitoring (NAQM) for CPCB
Database on cleaner technologies of industrial productions
Basin studies, hydrometeorological network improvement,
hydrological year book, hydrological modelling, regional flood
formulae, reservoir sedimentation studies, environmental hydrology,
watershed development studies, tank studies, and drought studies.
Urban Statistics Handbook
epidemiological studies and surveillance of hazardous occupations
including air pollution, noise pollution, agricultural hazards, industrial
hazards in organised sectors as well as small scale industries,
carcinogenesis, pesticide toxicology, etc
WHO collaborative centre for occupational health for South East Asia
region and the lead institute for the international programme on
chemical safety under IPCS (WHO)
Satellite data products (raw data, partially processed (radiometrically
corrected but geometrically uncorrected), standard data
(radiometrically and geometrically corrected), geocoded data(1:50,000
and 1:25000 scale), special data products like mosaiced, merged and
extracted) available on photographic (B?W and FCC in form of film of
240 mm X 240mm or enlargements/paper prints in scale varying
between 1:1M and 1:12500 and size varying between 240mm and
1000mm) and digital media (CD-ROMs, 8 mm tapes)
Database for groundwater using remote sensing technology (Regional
Remote Sensing Service Centre involved in generation of ground
water prospect maps at 1:50,000 scale for the State of Kerala,
Karnataka, AP, MP and Rajasthan for RGNDWM)
National Natural Resource Information System
Landuse mapping for coastal regulation zone (construction setback
line) upto 1:12500 scale
Inventory of coastal wetlands, coral reefs, mangroves, seaweeds
Monitoring and condition assessment of protected coastal areas
REPORT ON SECONDARY DATA COLLECTION FOR ENVIRONMENTAL INFORMATION CENTRE 10

Fax- 079-6762735 ¤
¤
¤
¤
41. State Pollution Control Board ¤
¤
¤
¤
¤
¤
¤
¤
42. State Ground Water Board
43. Survey of India ¤
¤
¤
¤
¤
¤
44. Town and Country Planning ¤
Organisation
45. Wildlife Institute of India Post Bag ¤
No. 18, Chandrabani Dehradun -
248 001, Uttaranchal ¤
Tel#0135 640111 -15,
Fax#0135 640117
email : wii@wii .
46. Zoological Survey of India ¤
Prani Vigyan Bhawan ¤
'M' Block, New Alipore
Calcutta - 700 053
Phone # 91-33-4786893, 4783383
Fax # 91-33-786893
RO - Shillong, Pune, Dehradun,
Jabalpur, Jodhpur, Chennai, Patna,
Hyderabad, Canning, Behrampur,
Kozikode, Itanagar, Digha, Port
Bliar, Solan
Wetland mapping and inventory
Mapping of potential hotspots and zoning of environmental hazards
General geological and geomorphological mapping in diverse terrain
Landslide risk zonation for Tehre area
State Air Quality Monitoring Programme
Inventory of polluting industries
Identification and authorization of hazardous waste generating
industries
Inventory of biomedical waste generating industries
Water quality monitoring of water bodies receiving wastewater
discharges
Inventory of air polluting industries
Industrial air pollution monitoring
Air consent, water consent, authorization, environment monitoring
reports
Topographical surveys on 1:250,000 scales, 1:50,000 and 1:25,000
scales
Digital Cartographical Data Base of topographical maps on scales
1:250,000 and 1:50,000
Data generation and its processing for redefinition of Indian Geodetic
Datum
Maintenance of National Tidal Data Centre and receiving/ processing
of tidal data of various ports.
Coastal mapping along the Eastern coast line has been in progress to
study the effect of submergence due to rise in sea-level and other
natural phenomenon. Ground surveys have been completed for the
proposed coastal region and maps are under printing.
District planning maps containing thematic information (135 maps)
have been printed out of 249 maps covering half the districts of India.
Districts planning maps for remaining half of the area are being
processed by National Atlas and Thematic Mapping Organisation
(NATMO)
Urban mapping - Thematic maps and graphic database on towns (under progress in association with NRSA and State town planning
department)
Provide information and advice on specific wildlife management problems.
National Wildlife Database
Red Book for listing of endemic species
Survey of faunal resources
REPORT ON SECONDARY DATA COLLECTION FOR ENVIRONMENTAL INFORMATION CENTRE 11

ANNEXURE IX Impact Prediction Tools

i
Table 1: Choice of Models for Impact Prediction: Air Environment*
Model Application Remarks
ISCST 3 Appropriate for point, area and line sources
Application for flat or rolling terrain
Transport distance up to 50 km valid
Computes for 1 hr to annual averaging
periods
Can take up to 99 sources
Computes concentration on 600
receptors in Cartesian on polar
coordinate system
Can take receptor elevation
Requires source data,
meteorological and receptor data
as input.
AERMOD with
AERMET
Settling and dry deposition of particles;
Building wake effects (excluding cavity
region impacts);
Point, area, line, and volume sources;
Plume rise as a function of downwind
distance;
Multiple point, area, line, or volume
sources;
Limited terrain adjustment;
Long-term and short-term averaging modes;
Rural or urban modes;
Variable receptor grid density;
Actual hourly meteorology data
Can take up to 99 sources
Computes concentration on 600
receptors in Cartesian on polar
coordinate system
Can take receptor elevation
Requires source data,
meteorological and receptor data
as input.
PTMAX Screening model applicable for a single
point source
Computes maximum concentration and
distance of maximum concentration
occurrence as a function of wind speed and
stability class
Require source characteristics
No met data required
Used mainly for ambient air
monitoring network design
PTDIS Screening model applicable for a single
point source
Computes maximum pollutant concentration
and its occurrences for the prevailing
meteorological conditions
Require source characteristics
Average met data (wind speed,
temperature, stability class etc.)
required
Used mainly to see likely impact
of a single source
MPTER Appropriate for point, area and line sources
applicable for flat or rolling terrain
Transport distance up to 50 km valid
Computes for 1 hr to annual averaging
periods
Terrain adjustment is possible
Can take 250 sources
Computes concentration at 180
receptors up to 10 km
Requires source data,
meteorological data and receptor
coordinates
CTDM PLUS
(Complex
Terrain
Dispersion
Model)
Point source steady state model, can
estimate hrly average concentration in
isolated hills/ array of hills
Can take maximum 40 Stacks and
computes concentration at
maximum 400 receptors
Does not simulate calm met
conditions
Hill slopes are assumed not to
exceed 15 degrees
Requires sources, met and terrain
characteristics and receptor details

ii
Model Application Remarks
UAM (Urban
Airshed Model)
3-D grid type numerical simulation model
Computes O3 concentration short term
episodic conditions lasting for 1 or 2 days
resulting from NOx and VOCs
Appropriate for single urban area having
significant O3 problems
RAM (Rural
Airshed Model)
Steady state Gaussian plume model for
computing concentration of relatively stable
pollutants for 1 hr to 1 day averaging time
Application for point and area sources in
rural and urban setting
Suitable for flat terrains
Transport distance less than 50
km.
CRESTER Applicable for single point source either in
rural or urban setting
Computes highest and second highest
concentration for 1hr, 3hr, 24hr and annual
averaging times
Tabulates 50 highest concentration for
entire year for each averaging times
Can take up to 19 Stacks
simultaneously at a common site.
Unsuitable for cool and high
velocity emissions
Do not account for tall buildings or
topographic features
Computes concentration at 180
receptor, circular wing at five
downwind ring distance 36 radials
Require sources, and met data
OCD (Offshore
and coastal
Dispersion
Model)
It determines the impact of offshore
emissions from point sources on the air
quality of coastal regions
It incorporates overwater plume transport
and dispersion as well as changes that occur
as the plume crosses the shore line
Most suitable for overwater sources shore
onshore receptors are below the lowest
shore height
Requires source emission data
Require hrly met data at offshore
and onshore locations like water
surface temperature; overwater air
temperature; relative humidity etc.
FDM (Fugitive
Dust Model)
Suitable for emissions from fugitive dust
sources
Source may be point, area or line (up to 121
source)
Require particle size classification max. up
to 20 sizes
Computes concentrations for 1 hr, 3hr, 8hr,
24hr or annual average periods
Require dust source particle sizes
Source coordinates for area
sources, source height and
geographic details
Can compute concentration at
max. 1200 receptors
Require met data (wind direction,
speed, Temperature, mixing height
and stability class)
Model do not include buoyant
point sources, hence no plume rise
algorithm
RTDM (Rough
Terrain
Diffusion
Model)
Estimates GLC is complex/rough (or flat)
terrain in the vicinity of one or more co-
located point sources
Transport distance max. up to 15 km to up
to 50 km
Computes for 1 to 24 hr. or annual ave5rage
concentrations
Can take up to 35 co-located point
sources
Require source data and hourly
met data
Computes concentration at
maximum 400 receptors
Suitable only for non reactive
gases
Do not include gravitational
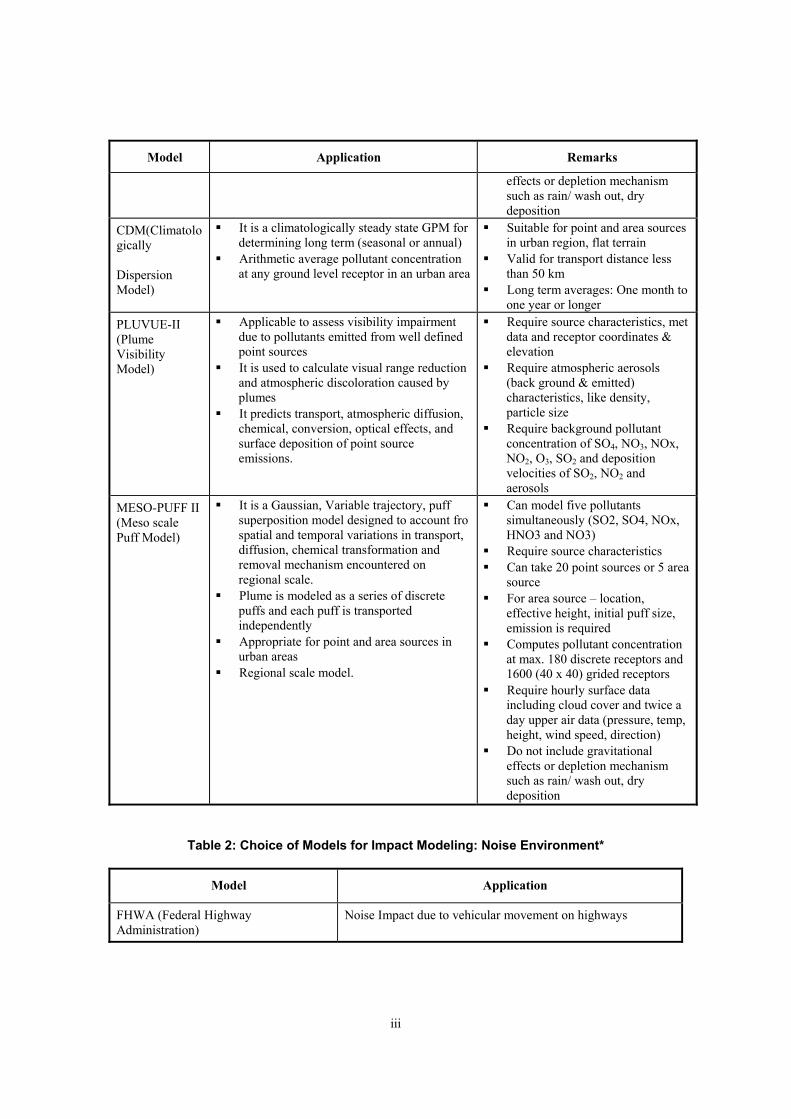
iii
Model Application Remarks
effects or depletion mechanism
such as rain/ wash out, dry
deposition
CDM(Climatolo
gically
Dispersion
Model)
It is a climatologically steady state GPM for
determining long term (seasonal or annual)
Arithmetic average pollutant concentration
at any ground level receptor in an urban area
Suitable for point and area sources
in urban region, flat terrain
Valid for transport distance less
than 50 km
Long term averages: One month to
one year or longer
PLUVUE-II
(Plume
Visibility
Model)
Applicable to assess visibility impairment
due to pollutants emitted from well defined
point sources
It is used to calculate visual range reduction
and atmospheric discoloration caused by
plumes
It predicts transport, atmospheric diffusion,
chemical, conversion, optical effects, and
surface deposition of point source
emissions.
Require source characteristics, met
data and receptor coordinates &
elevation
Require atmospheric aerosols
(back ground & emitted)
characteristics, like density,
particle size
Require background pollutant
concentration of SO4, NO3, NOx,
NO2, O3, SO2 and deposition
velocities of SO2, NO2 and
aerosols
MESO-PUFF II
(Meso scale
Puff Model)
It is a Gaussian, Variable trajectory, puff
superposition model designed to account fro
spatial and temporal variations in transport,
diffusion, chemical transformation and
removal mechanism encountered on
regional scale.
Plume is modeled as a series of discrete
puffs and each puff is transported
independently
Appropriate for point and area sources in
urban areas
Regional scale model.
Can model five pollutants
simultaneously (SO2, SO4, NOx,
HNO3 and NO3)
Require source characteristics
Can take 20 point sources or 5 area
source
For area source – location,
effective height, initial puff size,
emission is required
Computes pollutant concentration
at max. 180 discrete receptors and
1600 (40 x 40) grided receptors
Require hourly surface data
including cloud cover and twice a
day upper air data (pressure, temp,
height, wind speed, direction)
Do not include gravitational
effects or depletion mechanism
such as rain/ wash out, dry
deposition
Table 2: Choice of Models for Impact Modeling: Noise Environment*
Model Application
FHWA (Federal Highway
Administration)
Noise Impact due to vehicular movement on highways

iv
Dhwani For predictions of impact due to group of noise sources in the
industrial complex (multiple sound sources)
Hemispherical sound wave propagation
Air Port
Fore predictive impact due to single noise source
For predictive impact of traffic on airport and rail road
Table 3: Choice of Models for Impact Modeling: Land Environment*
Model Application Remarks
Digital Analysis Techniques Provides land use / land cover
distribution
Ranking analysis for soil
suitability criteria
Provides suitability criteria
for developmental
conversation activities
Various parameters viz. depth, texture,
slope, erosion status, geomorphology,
flooding hazards, GW potential, land
use etc., are used.
Table 4: Choice of Models for Impact Modeling: Water Environment*
Model Application Remarks
QUAL-II E Wind effect is insignificant, vertical dispersive effects
insignificant applicable to streams
Data required
Deoxygenation coefficients, re-aeration coefficients for
carbonaceous, nitrogenous and benthic substances,
dissolved oxygen deficit
Steady state or dynamic
model
The model is found excellent to generate water quality
parameters
Photosynthetic and respiration rate of suspended and
attached algae
Parameters measured up to 15 component can be
simulated in any combination, e.g. ammonia, nitrite,
nitrate, phosphorous, carbonaceous BOD, benthic
oxygen demand, DO, coliforms, conservative
substances and temperature
DOSAG-3, USEPA:
(1-D) RECEIV – II,
USEPA
Water quality simulation model for streams & canal
A general Water quality model
Steady-state
Explore –I, USEPA A river basin water quality model Dynamic, Simple
hydrodynamics
HSPE, USEPA Hydrologic simulation model Dynamic, Simple
hydrodynamics
RECEIVE-II,
USEPA
A general dynamic planning model for water quality
management
Stanford watershed This model simulates stream flows once historic

v
Model Application Remarks
model precipitation data are supplied
The major components of the hydrologic cycle are
modeled including interception, surface detention,
overland inflow, groundwater, evapo-transpiration and
routing of channel flows, temperature, TDS, DO,
carbonaceous BOD coliforms, algae, zooplanktons,
nitrite, nitrate, ammonia, phosphate and conservative
substances can be simulated
Hydrocomp model Long-term meteorological and wastewater
characterization data is used to simulate stream flows
and stream water quality
Time dependant
(Dynamic)
Stormwater
Management model
(SWMM)
Runoff is modeled from overland flow, through surface
channels, and through sewer network Both combined
and separate sewers can be modeled.
This model also enables to simulate water quality
effects to stormwater or combined sewer discharges.
This model simulates runoff resulting from individual
rainfall events.
Time Dependent
Battelle Reservoir
model
Water body is divided into segments along the
direction of the flow and each segment is divided into
number of horizontal layers. The model is found to
generate excellent simulation of temperature and good
prediction of water quality parameters.
The model simulates temperature, DO, total and
benthic BOD, phytoplankton, zooplankton, organic and
inorganic nitrogen, phosphorous, coliform bacteria,
toxic substances and hydrodynamic conditions.
Two Dimensional multi-
segment model
TIDEP (Turbulent
diffusion
temperature model
reservoirs)
Horizontal temperature homogeneity Coefficient of
vertical turbulent diffusion constant for charge of area
with depth negligible coefficient of thermal exchange
constant
Data required wind speed, air temperature, air
humidity, net incoming radiation, surface water
temperature, heat exchange coefficients and vertical
turbulent diffusion coefficients.
Steady state model
BIOLAKE Model estimates potential fish harvest from a take Steady state model
Estuary models/
estuarial Dynamic
model
It is simulates tides, currents, and discharge in shallow,
vertically mixed estuaries excited by ocean tides,
hydrologic influx, and wind action
Tides, currents in estuary are simulated
Dynamic model
Dynamic Water
Quality Model
It simulates the mass transport of either conservative or
non-conservative quality constituents utilizing
information derived from the hydrodynamic model
Bay-Delta model is the programme generally used.
Up to 10 independent quality parameters of either
conservative or non-conservative type plus the BOD-
DO coupled relationship can be handled
Dynamic model

vi
Model Application Remarks
HEC -2 To compute water surface profiles for stead7y,
gradually: varying flow in both prismatic & non-
prismatic channels
SMS Lake circulation, salt water intrusion, surface water
profile simulation model
Surface water Modeling
system Hydrodynamic
model
RMA2 To compute flow velocities and water surface
elevations
Hydrodynamic analysis
model
RMA4 Solves advective-diffusion equations to model up to six
non-interacting constituents
Constituent transport
model
SED2D-WES Model simulates transport of sediment Sediment transport
model
HIVEL2D Model supports subcritical and supercritical flow
analysis
A 2-dimensional
hydrodynamic model
MIKE-II, DHI Model supports, simulations of flows, water quality,
and sediment transport in estuaries, rives, irrigation
systems, channels & other water bodies
Professional Engineering
software package
Table 5: Choice of Models for Impact Modeling: Biological Environment*
Name Relevance Applications Remarks
Flora
Sample
plot
methods
Density and
relative density
Density and
relative dominance
Average number of
individuals species per unit
area
Relative degree to which a
species predominates a
community by its sheer
numbers, size bulk or biomass
The quadrant sampling technique is
applicable in all types of plant
communities and for the study of
submerged, sessile (attached at the
base) or sedentary plants
Frequency and
relative frequency
importance value
Plant dispersion over an area
or within a community
Commonly accepted plot size:
0.1 m2- mosses, lichens & other mat-
like plants
Average of relative density,
relative dominance and
relative frequency
0.1 m2- herbaceous vegetation
including grasses
10.20 m2 – for shrubs and saplings up
to 3m tall, and
100 m2 – for tree communities
Transects
& line
intercepts
methods
Cover
Ratio of total amount of line
intercepted by each species
and total length of the line
intercept given its cover
This methods allows for rapid
assessment of vegetation transition
zones, and requires minimum time or
equipment of establish
Relative It is the ratio of total Two or more vegetation strata can be
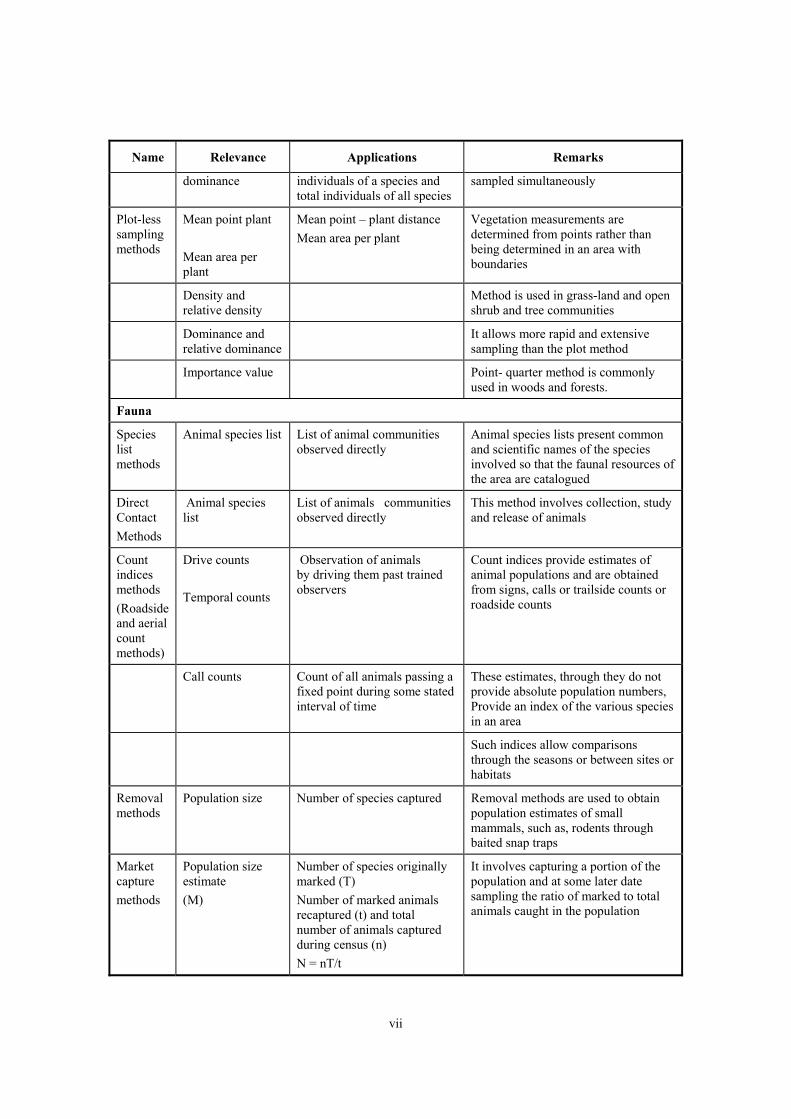
vii
Name Relevance Applications Remarks
dominance individuals of a species and
total individuals of all species
sampled simultaneously
Plot-less
sampling
methods
Mean point plant
Mean area per
plant
Mean point – plant distance
Mean area per plant
Vegetation measurements are
determined from points rather than
being determined in an area with
boundaries
Density and
relative density
Method is used in grass-land and open
shrub and tree communities
Dominance and
relative dominance
It allows more rapid and extensive
sampling than the plot method
Importance value Point- quarter method is commonly
used in woods and forests.
Fauna
Species
list
methods
Animal species list List of animal communities
observed directly
Animal species lists present common
and scientific names of the species
involved so that the faunal resources of
the area are catalogued
Direct
Contact
Methods
Animal species
list
List of animals communities
observed directly
This method involves collection, study
and release of animals
Count
indices
methods
(Roadside
and aerial
count
methods)
Drive counts
Temporal counts
Observation of animals
by driving them past trained
observers
Count indices provide estimates of
animal populations and are obtained
from signs, calls or trailside counts or
roadside counts
Call counts
Count of all animals passing a
fixed point during some stated
interval of time
These estimates, through they do not
provide absolute population numbers,
Provide an index of the various species
in an area
Such indices allow comparisons
through the seasons or between sites or
habitats
Removal
methods
Population size Number of species captured Removal methods are used to obtain
population estimates of small
mammals, such as, rodents through
baited snap traps
Market
capture
methods
Population size
estimate
(M)
Number of species originally
marked (T)
Number of marked animals
recaptured (t) and total
number of animals captured
during census (n)
N = nT/t
It involves capturing a portion of the
population and at some later date
sampling the ratio of marked to total
animals caught in the population

viii
Table 6: Choice of Models for Impact Predictions: Socio-economic Environment*
Relevance
Name Application Remarks
Extrapolati
ve Methods
A prediction is made that is consistent with past and
present socio-economic data, e.g. a prediction based
on the linear extrapolation of current trends
Intuitive
Forecasting
(Delphi
techniques)
Delphi technique is used to determine environmental
priorities and also to make intuitive predictions
through the process of achieving group consensus
Conjecture Brainstorming Heuristic
programming Delphi consensus
Trend
extrapolatio
n and
correlation
Predictions may be obtained by extrapolating present
trends Not an accurate method of making socio-
economic forecasts, because a time series cannot be
interpreted or extrapolated very far into the future
with out some knowledge of the underlying physical,
biological, and social factors
Trend breakthrough precursor
events correlation and regression
Metaphors
and
analogies
The experience gained else where is used to predict
the socio-economic impacts
Growth historical simulation
commonsense forecasts
Scenarios Scenarios are common-sense forecasts of data. Each
scenario is logically constructed on model of a
potential future for which the degrees of
“confidence” as to progression and outcome remain
undefined
Common-sense
Dynamic
modeling
(Input- Out
model)
Model predicts net economic gain to the society after
considering all inputs required for conversion of raw
materials along with cost of finished product
Normative
Methods
Desired socio-economic goals are specified and an
attempt is made to project the social environment
backward in time to the present to examine whether
existing or planned resources and environmental
programmes are adequate to meet the goals
Morphological analysis technology
scanning contextual mapping
- functional array
- graphic method
Mission networks and functional
arrays decision trees & relevance
trees matrix methods scenarios
* NOTE: Project-specific proposed prediction tools need to be identified by the project proponent and shall
be incorporated in the draft ToR to be submitted to the Authority for the consideration and approval by the
concerned EAC/SEAC.

ANNEXURE X Form through which the State Governments/Administration of the Union Territories Submit Nominations for SEIAA and SEAC
for the Consideration and Notification by the Central Government
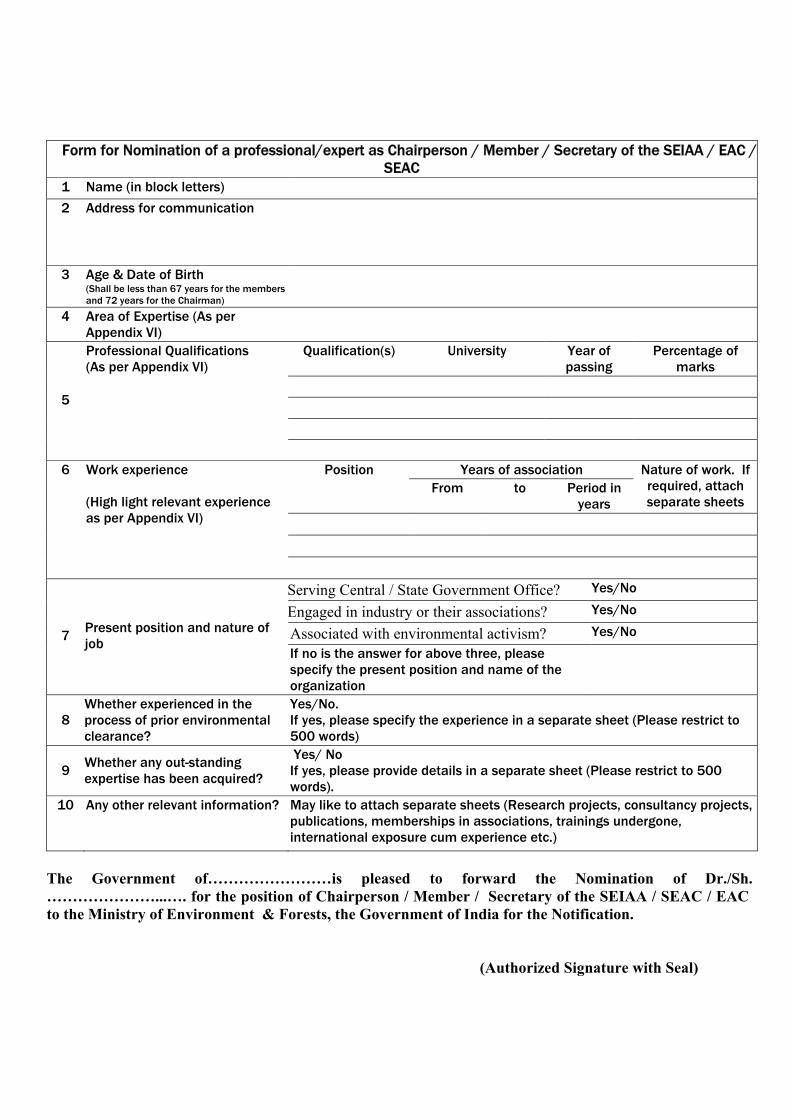
1 Name (in block letters)
2 Address for communication
3 Age & Date of Birth (Shall be less than 67 years for the members and 72 years for the Chairman)
4 Area of Expertise (As per Appendix VI)
Qualification(s) University Year of passing
Percentage of marks
5
Professional Qualifications (As per Appendix VI)
Years of association Position
From to Period in years
Nature of work. If required, attach separate sheets
6 Work experience
(High light relevant experience as per Appendix VI)
Serving Central / State Government Office? Yes/No
Engaged in industry or their associations? Yes/No
Associated with environmental activism? Yes/No7Present position and nature of job
If no is the answer for above three, please specify the present position and name of the organization
8Whether experienced in the process of prior environmental clearance?
Yes/No.If yes, please specify the experience in a separate sheet (Please restrict to 500 words)
9Whether any out-standing expertise has been acquired?
Yes/ No If yes, please provide details in a separate sheet (Please restrict to 500 words).
10 Any other relevant information? May like to attach separate sheets (Research projects, consultancy projects, publications, memberships in associations, trainings undergone, international exposure cum experience etc.)
The Government of……………………is pleased to forward the Nomination of Dr./Sh.
…………………...…. for the position of Chairperson / Member / Secretary of the SEIAA / SEAC / EAC
to the Ministry of Environment & Forests, the Government of India for the Notification.
(Authorized Signature with Seal)

ANNEXURE XI Composition of EAC/SEAC
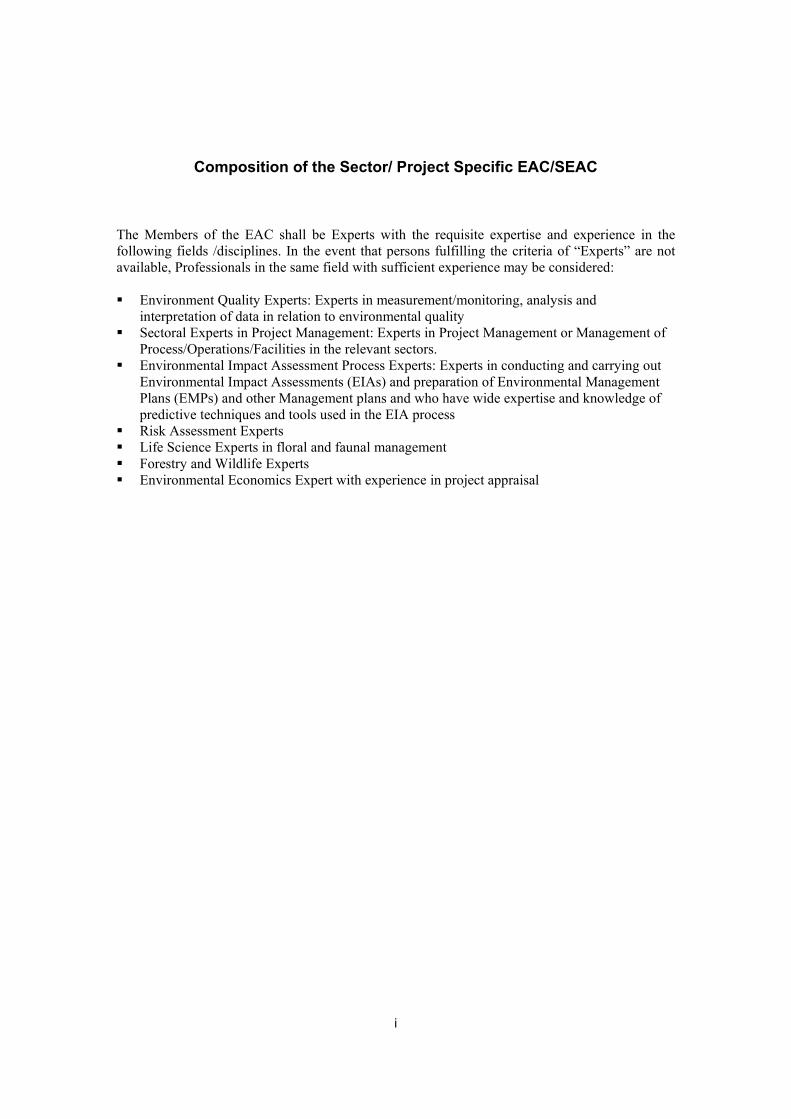
i
Composition of the Sector/ Project Specific EAC/SEAC
The Members of the EAC shall be Experts with the requisite expertise and experience in the
following fields /disciplines. In the event that persons fulfilling the criteria of “Experts” are not
available, Professionals in the same field with sufficient experience may be considered:
Environment Quality Experts: Experts in measurement/monitoring, analysis and
interpretation of data in relation to environmental quality
Sectoral Experts in Project Management: Experts in Project Management or Management of
Process/Operations/Facilities in the relevant sectors.
Environmental Impact Assessment Process Experts: Experts in conducting and carrying out
Environmental Impact Assessments (EIAs) and preparation of Environmental Management
Plans (EMPs) and other Management plans and who have wide expertise and knowledge of
predictive techniques and tools used in the EIA process
Risk Assessment Experts
Life Science Experts in floral and faunal management
Forestry and Wildlife Experts
Environmental Economics Expert with experience in project appraisal

___________________________________________________________________
ANNEXURE XII
Best Practices & Latest Technologies available and reference

Pulp and Paper Industry
TGM for Pulp and Paper Industry 3-37 August 2010
Factor Challenges
m3/tonne (European average 10 m3/tonne)
Improve filler loading (Indian average – 140 kg/t; Global
330 kg/t)
Water Increase water system closure
Define internal ecological footprint for water as monitoring
benchmark
Increase:
Whitewater recycle
Recovery of condensate
Reuse of foul condensate
Bleach filter recycle
Rainwater harvesting
Improve monitoring of water use in different sections
Relook at sectional discharges & monitor against set
benchmarks
Evaluate ETP performance & check on colour reduction,
sludge use/disposal
Monitor receiving media
3.3 Technological Aspects
3.3.1 Cleaner technologies
It is an approach to better environmental performance, increased production efficiency
with economic benefits. Often in economic analysis the true economic value of
environmental benefits (or damages), particularly intangibles are poorly reflected.
Environmental economics is not well appreciated resulting in improper economic
evaluation of cleaner production technology options. Newer technology options
evaluation must include the costs (intangibles included) to find economic benefits
The three main cleaner production technologies include:
Source reduction
Recycling
Product modification
Good house keeping and process parameter optimization are the first two steps to source
reduction. The technology upgrade includes process control, changes in input materials,
equipment modification and technology change.
Cleaner production indicators
The indicators are the tools for assessing the potential of a cleaner production option and
thus include.
Process technology (sets limits on performance)
Process efficiency (fibre loss, yield, washing, recovery efficiency etc.)
Specific consumption of inputs (raw materials, energy, water etc.)
Degree of system closure (for water, condensate, chemicals)
Degree of sustainability (ecological foot prints, green house gas emissions, rain water
harvesting, bio-fuel / renewable fuel use, energy self sufficiency).

Pulp and Paper Industry
TGM for Pulp and Paper Industry 3-38 August 2010
Specific pollution load generation (COD, TS, AOX, VOC, SS, DS, Color, odourous
gases emissions, solid waste generation etc).
Economic benefits including environmental advantages (RIO, payback)
Aesthetics and good will
Pulp & paper industries are complex in nature that consists of quite many process
emissions guided by the quality and type of paper required and raw material used besides
on the prevailing management practices. Implementation of cleaner production processes
and pollution prevention measures can yield both economic and environmental benefits.
Preventive technologies
The focus of cleaner technologies in pulp & paper production is summarized as follows:
Adopt various measures to reduce water requirement for different production
processes
Adopt dry debarking processes. Minimize the generation of effluents through process
modifications and recycle wastewaters, aiming for total recycling.
Prevention and control of spills of black liquor and also minimize unplanned or non-
routine discharges of wastewater and black liquor, caused by equipment failures,
human error, and faulty maintenance procedures through EMS in the plant, by
training operators, establishing good operating practices, and providing sumps and
other facilities to recover liquor losses from the process.
Reduce emissions of chlorinated compounds to the environment by reducing the
lignin content in the pulp
Reduce bleaching requirements by process design and operation. Use the following
measures to reduce emissions of chlorinated compounds to the environment: before
bleaching, reduce the lignin content in the pulp (Kappa number of 10) for hardwood
by extended cooking and by oxygen delignification under elevated pressure; optimize
pulp washing prior to bleaching; use TCF or at a minimum, ECF bleaching systems;
use oxygen, ozone, peroxides (hydrogen peroxide), peracetic acid, or enzymes
(cellulose-free xylanase) as substitutes for chlorine-based bleaching chemicals;
recover and incinerate maximum material removed from pulp bleaching; where
chlorine bleaching is used, reduce the chlorine charge on the lignin by controlling pH
and by splitting the addition of chlorine
Total chlorine-free processes are desirable. However, while bleaching at least
elemental chlorine-free bleaching systems should be adopted.
Minimize use of hazardous bleaching chemicals by extended cooking and oxygen
delignification.
Minimize the generation of effluents through process modifications and recycle
wastewaters aiming for total recycling.
Reduce effluent volume and treatment requirements by using dry instead of wet
debarking recovering pulping chemicals by concentrating black liquor and burning
the concentrate in a recovery furnace; recovering cooking chemicals by recausticizing
the smelt from the recovery furnace; and using high-efficiency washing and bleaching
equipment.
Minimize unplanned or non-routine discharges of wastewater and black liquor,
caused by equipment failures, human error, and faulty maintenance procedures, by

Pulp and Paper Industry
TGM for Pulp and Paper Industry 3-39 August 2010
training operators, establishing good operating practices, and providing sumps and
other facilities to recover liquor losses from the process.
Aim for zero-effluent discharge by reducing wastewater discharges at source,
adopting segregation and applying effective waste treatment for reuse in the process,
in case reuse is not possible the wastes could be incinerated.
Minimize odour from reduced sulphur emissions by using modern, low-odour
recovery boilers fired at over 75% concentration of black liquor and then collection
and incineration of left over.
Dewater all sludge and then either recycle or incinerate the unusable part or safely
landfill as ultimate option.
Minimize sulphur emissions to the atmosphere by using a low-odour design black
liquor recovery furnace.
Use energy-efficient processes and equipments such as steam and utility boilers, for
black liquor chemical recovery for a high solid content up to 70%.
3.3.1.1 Improvements in manufacturing process
The most significant environmental issues are the discharge of chlorine-based organic
compounds (from bleaching) and of other toxic organics. The unchlorinated material is
essentially black liquor that escapes the mill recovery process. Some mills are
approaching 100% recovery. Industry developments demonstrate that total chlorine free
bleaching is feasible for many pulp & paper products but cannot produce certain grades of
paper. The adoption of these modern process developments, wherever feasible, is
encouraged. Pollution prevention programs should focus on reducing wastewater
discharges and on minimizing air emissions. Major process recommendations include the
following:
Dry debarking of wood
RDH and Super batch cooking, a pretreatment with BL is done to reduce heat demand,
maintain high initial sulphide concentration and decrease EA charge. The kappa number
is reduced to 14 – 16 for HW against 18 – 22 for conventional cooking. (1 kappa 0.15 %
lignin in pulp). Extended delignification/modified cooking results in less heat demand in
cooking, lower emission (gaseous & wastewater) reduced bleach chemical demand,
marginal increase in BLS. Closed screening of BSW is a reality the knots/ Shives level in
modern cooking is less than 0.5%. Countercurrent approach with washing (integrated
washing and screening) can reduce organic discharges to wastewater.
New generation washing equipments (like DD washers, wash press, horizontal washer)
are a common practice in washer. This gives high discharge consistency, reduces organic
carryover, reduces bleach chemical demand and increases BLS to recovery.
Cooking
Alkali pulping (Kraft /soda) is popular. For wood, Kraft pulping in batch digesters with
hot blow is popular. This results in high thermal energy demand, higher emissions and
relatively higher chemical consumption and lower yield. Better option is to go for
RDH/Super batch cooking with extended delignification, better alkali profile, better
selectivity, higher yield, cold blow, lesser energy demand and no emissions. (700 / 800 kg
steam/ton pulp). Better control is essential in digester operation to ensure proper H
Factor. Conventional batch cooking with hot blow has to adopt techniques to reduce
emissions (blow heat recovery, stripping of NCG’s, incineration). Direct steaming

Pulp and Paper Industry
TGM for Pulp and Paper Industry 3-40 August 2010
digesters need to be phased out. Continuous digesters need to replace them for agro
residues. For conventional cooking use of chemicals for better selectivity are needed (e.g.
polysulphide). Usage of cooking catalysts/ cooking aids like enzymes, AQ.
Washing and screening
The main purpose of washing and cleaning process is to give clean pulp with least carry
over of BL and Shives using minimum dilution. The emission from this section includes
discharges from screens and black liquor if not processed properly. Washing results are
influenced by type of pulp and washing equipments. Integrated washing and screening
(closed screening with refining/recooking) is necessary to reduce screen room discharges.
Great care is essential to reduce discharges from conventional rotary vacuum washers
(leakage, spills, foam, vacuum/level, over loading, hoods).
Non wood pulps, are slow draining & need careful design/selection of equipment for
reduced environmental discharges. In digester washing must be proper in continuous
digesters to ensure lower environmental impacts. Wash plants should never be used as a
buffer between cooking and bleaching department. New generation screen equipments
(like Pressure screen Delta combi screens) for better separation of knots and fines are
needed. Tail screens can remove Shives. Modern concept is to use high consistency (3-
4%) pressure screens.
Bark effluents are toxic. Condensates from cooking and evaporator are Volume (8 – 10
m3/tonne), COD (20 –30 kg/tonne) and BOD (7 – 10 kg/tonne). Foul condensates include
methanol/ ethanol, TRS, turpentine, ketones, phenolics, resin /fatty acids, N are high in
hardwood. Strong condensates (1 m3/tonne) can be steam stripped and gases are
incinerated. Weak condensates (7-8 m3/tonne), 0.5 – 2 kg COD/ m3, free of metal, can be
directly utilized in washing.
Spills
Spills occur from digestion plant, screen room, wash plant, evaporation plant and tanks.
They must be collected and reprocessed. Leakages occur from pumps, seals, gland,
valves, pipelines and mating surfaces and proper maintenance can reduce this.
Conductivity measurements and fibre content of wastewater must be benchmarked and
checked. Spill account for 10 kg/tonne of COD. Black liquor residues (washing losses)
in unbleached pulp press washing at last stage can reduce amount of water going with
pulp from 6 – 10 m3/tonne to 2 – 3 m3/tonne. The values should be benchmarked as
cod pulp. (Typically 7 – 12 kg/tonne hardwood pulp).
AOX release
Use of elemental chlorine and Hypochlorite result in high AOX releases (almost 0.1 kg
AOX/kg elemental Cl2 and 0.05 kg AOX/kg Hypo as active chlorine). Chlorinated
phenolics degrade very slowly and their values (Penta and Tri) should be less than 1
g/tonne pulp. Full/ partial elimination of Cl2 and hypo by chlorine dioxide reduces AOX
release. This with oxygen delignification can substantially reduce AOX levels.
Enzyme prebleaching (Xylanase) can reduce bleach consumption by 10 – 20%. AOX
generation in conventional cook with CEHH type sequence for HW is 5 – 8 kg/tonne.
This can be reduced to 2 kg by ECF, less than 1 kg by oxygen/ECF, less than 0.5 kg by
modified cook / oxygen/ ECF. Use of enzymes will further reduce AOX.

Pulp and Paper Industry
TGM for Pulp and Paper Industry 3-41 August 2010
ECF bleaching
The ECF bleaching sequence for Hardwood include D (EOP)D(EP)D, D(EO)D(EP)D,
D(EOP)DD, D(EO)DD, QOPZP. Chlorine and hypo are eliminated to improve
environmental situation of bleach plants. Initially partially chlorine replacement (as C/D
or D/C) and full Hypo replacement are tried in Indian mills to reduce AOX generation in
bleach plant. Dioxide bleaching is carried out at 10% consistency, 60ºC, for 30 minutes
at pH of 3.5.
Alkaline extraction reinforced with O and P (EOP) is done around 12% consistency, 60 -
70ºC, for 60 minutes. Alkali, oxygen and peroxide changes are 10 – 20, 3 – 6 and 2 – 4
kg/tonne. Peroxide can be applied at several positions (in extraction, for final brightness
adjustment, separate delignification/ bleaching. These bleaching changes eliminate 2378
TCDD and 2378 TCDF formation to non-detectable limits. Chloroform generation is
decreased; chlorinated organics generation level is decreased to 0.2 – 1.0 kg AOX/tonne
before ETP.
The Hexauronic acid is produced during Kraft pulping of HW contributes to higher
Kappa number and brightness reversion. This can be removed by acidic conditions in
bleaching (pH ~ 2) and high temperature in bleaching or by ozone bleaching.
Bleach plant closure
Partial / full closing of bleach plant mill result in reduced wastewater discharges. This
can be done counter currently with ODL and BSW. This will be associated with
accumulation of DS affecting plant operation, besides needing pH adjustments. There
could be possibility of Ca-oxalate precipitation, increased built up calcium chlorides may
enhance corrosion of equipment. The current levels of bleach plant discharges at lower
level are 25 – 40 m3/tonne which can be reduced to 20 – 25 m3/tonne volume The COD
discharge can be reduced to 10 m3/tonne and 30 kg COD with better closure. Generally
first acid stage filtrate with highest Ca is purged to contain mill operations.
Spill collection
Greater in plant measures reduce discharges, Pulping liquors lost from BSW, pumps,
valves, from knotters and screens, sewered evaporator boil out solutions. Spilled liquors
should be collected at highest possible concentration and returned to appropriate
locations. Adequate buffer tank capacity can reduce spills. Monitoring conductivity and
pH can detect losses. A single line Kraft mill can have 5 collection sumps. Evaporator
plant should have 5 – 10% extra capacity to deal with sump liquors.
Technologies for kappa number reduction
The pulp & paper industries normally use kraft process in batch or continuous digesters to
remove the lignin as much as possible during pulping of wood based fibrous raw material
but the process has limitation that the wood based fibrous raw material can not be
delignified to a low kappa number. Since the kappa number is the main factor which
governs the demand of chemicals for bleaching of the pulp the process was modified to
achieve maximum possible delignification during cooking of raw materials. Pulp & paper
industries have incorporated various measures to reduce the kappa number and also to
minimize the carry over of organic matter along with pulp as it governs the bleach
chemical demand during the bleaching process before bleaching. The reduction of the
lignin content in the pulp (Kappa number of 10) for hardwood can be carried out using
cleaner technologies such as extension of cooking and carrying out oxygen delignification
under elevated pressure; optimizing the pulp washing prior to bleaching; use TCF or at a

Pulp and Paper Industry
TGM for Pulp and Paper Industry 3-42 August 2010
minimum, ECF bleaching systems; use oxygen, ozone, peroxides (hydrogen peroxide),
peracetic acid, or enzymes (cellulose-free xylanase) as substitutes for chlorine-based
bleaching chemicals; recover and incinerate maximum material removed from pulp
bleaching; where chlorine bleaching is used, reduce the chlorine charge on the lignin by
controlling pH and by splitting the addition of chlorine.
Extended delignification: Most of the industries in developed countries are employing
RDH, modified continuous cooking, super batch process etc to reduce the kappa number
of the unbleached pulp. Modified pulping processes are energy efficient, require fewer
chemicals for cooking of raw materials and produce the pulp of low kappa number with
better strength properties as compared to conventional pulping processes. However, the
high capital investment and high level of operation restrict the adoption of these
technologies in Indian pulp & paper industries
Improved pulp washing: The pulp & paper industries can use the modified washing
systems such as belt filter press, double wire washer etc, to minimize the carry over of the
black liquor with pulp entering the bleaching section.
Oxygen delignification: Oxygen delignification is a well established technology and
most of the pulp mill abroad is using this process to reduce the kappa number of pulp
before bleaching stage. Single stage oxygen pre bleaching of the pulp reduces the pulp
kappa number by 50-60 % and two-stage oxygen pre-bleaching reduces the pulp kappa
number by 80%.
Recycled fibre processing
Recycled fibres are indispensable raw materials for the industry. The processing varies
depending on grade to be produced and the quality of waste paper. RCF processes are
essentially of two main categories:
Process with exclusive mechanical cleaning (no deinking) like for test liner,
corrugating medium, board or carton board.
Processes with mechanical and chemical unit processes (deinking) for products like
NP, tissue, printing, and copy paper, magazine paper (SC/LWC).
3.3.1.2 Improvements in effluent treatment process
The effluent generation during the manufacturing process may be controlled in following
ways.
− Segregation / separation of water loops of each machine.
− Shower waters are treated with micro screens.
− Sealing waters are properly collected and recycled.
− Using of pinch technology to ensure proper quality of recycle.
− Using well washed pulp in paper machine.
− Ensuring chemicals are of right quality.
− Well Monitoring
− Understanding wet end chemistry well.
Reduction of fibre and filler losses
− Proper refining and screening
− Efficient control of paper machine headbox
− Proper use of retention aids

Pulp and Paper Industry
TGM for Pulp and Paper Industry 3-43 August 2010
− Proper management of broke.
− The losses can be reduced from 10 – 100 kg/tonne to 10 – 20 kg/tonne (1 – 2%
loss).
Recovery and recycling of coating – color containing effluent
Paper mills with coating generate a hydraulic low flow wastewater (2 – 5% of total flow)
with rich pigments/adhesives.
Environmentally sound coating waste stream management includes
− Minimum discharge of coating kitchen colors.
− Minimum grade changes.
− Optimum design of coating color kitchen.
− Coating chemical recovery by UF method.
3.3.1.3 Improvements in reducing air emissions
Collection, incineration of malodorous gases and control of resulting SO2 (burning in
recovery furnace/lime kiln/ dedicated) separate low NOX burner, SO2 scrubbing and SO2
recovery. Dilute malodorous gases from various sources are collected and incinerated
(HVLC) and resulting controlled (SO2 by scrubbing). Efficient combustion control in
recovery boiler and control TRS and CO emission. TRS emissions of lime kiln controlled
by excess O2, using low S-fuel and controlling residual soluble sodium in lime mud fed to
kiln. Firing high solids to recovery boiler (>75%) to control SO2 emission and using flue
gas scrubber. Ensure proper mixing and distribution of air in recovery boiler to control
NOX. Use of bark, gas, wood dust, low S fuel to reduce SO2 emission from auxiliary
boiler. Use SO2 scrubber. ESP’s are required to mitigate dust from recovery boiler,
auxiliary boiler and limekiln.
3.3.1.4 Improvements in solid waste management
In pulp & paper industry to reduce waste is to minimize generation of solid waste and
recover, recycle and reuse these materials wherever practicable. Incineration of organic
waste should be considered as one of the available technologies.
3.4 Benchmarking of Indian Paper Mills on Various Parameters
Table 3-19: Fibre Use Efficiency (%) in Indian Paper Mills
Kraft Mills Soda
Mills
Waste Paper
Fibre Use efficiency
(%)
Wood/
Bamboo
Bagasse NP Pkg
a. Indian avg 46.2 47.2 43.4 65 89
b. India’s best Mills 50.9 53.2 49.1 75 92
c. Global best
practices
52.7 54.9 57.5 85 95

Technical EIA Guidance Manual for Pulp and Paper Industry August 2010
REFERENCES
Documents
Ministry of Environment and Forest, GoI - “Environment Impact Assessment Notification”
S.O.1533 dated 14th September 2006.
Ministry of Environment and Forest, GoI – “Environment Impact Assessment Notification
2006 – Amendment” S.O. 195 (E) dated 1st December, 2009.
Ministry of Environment and Forest, GoI – Charter on Corporate Responsibility for
Environment Protection Action Points for 17 Categories of Industries, CPCB, March 2003.
Ministry of Environment and Forests, GoI – “Environmental Guidelines for Siting of
Industry Report of the Working Group”, August 1985.
Ministry of Environment and Forest, Govt. of the People’s Republic of Bangladesh – “EIA
Guideline for Industries”- June, 1997.
Larry W. Canter, “Environmental Impact Assessment”, Second Edition, McGraw Hill,
University of Oklahoma, 1997.
Central Pollution Control Board – “Development of Guidelines for Water Conservation in
Pulp and Paper Sector”, National Productivity Council – March, 2006.
Central Pollution Control Board –Comprehensive Industry Document for Large Pulp &
Paper Industry, COINDS/36/2000-2001)
Central Pollution Control Board – Draft Report of the Expert Committee on Odour Pollution
& its Control, July 2007.
European Commission - Integrated Pollution Prevention and Control (IPPC): Best
Available Techniques Reference Document on the Production of Iron and Steel December
2001.
International Association for Impact Assessment – “Principles of Environmental Impact
Assessment Best Practice”, Institute of Environmental Assessment, UK.
International Institute for Environment and Development – “A Changing future for Paper”,
Peter Knight, London.
World Bank Group, Pollution Prevention and Abatement Handbook – “Pulp and Paper
Mills”, July 1998.
Blackie Academic & Professional – “Technology of Paper Recycling”, Edited by R.W.J.
McKINNEY, Director, Fibre Research Consultants Ltd, Bookham, Surrey.
Ernest Orlando Lawrence Berkeley National Laboratory – “India’s Pulp and Paper Industry:
Productivity and Energy Efficiency” – Environmental Energy Technologies Division, LBNL-
41843.

Technical EIA Guidance Manual for Pulp and Paper Industry August 2010
FAO Corporate Document Repository – “Environmental impact assessment and
environmental auditing in the pulp and paper industry”, Forest Department.
Rajasthan Mines and Minerals Ltd., & Rajasthan Spinning and Weaving Mills Ltd., - “All
India Seminar on Environmental Impact Assessment”, Organized by ‘The Institution of
Engineers (I)’ Aug, 2006.
Munich Personal RePEc Archive (MPRA) – “Economic reform and Productivity Growth in
Indian Paper and Paper Products Industry: A Nonparametric Analysis”, Chirayil, Anish,
December 2008.
“Global Competitiveness of the Indian Paper Industry” – Central Pulp & Paper Research
Institute (EPPRI), India.
“Green Rating of Indian Pulp & Paper Industry” – Center for Science and Environment
(CSE).
“National Census of Pulp, Paper & Paperboard manufacturing facilities” – United States
Environmental Protection Agency (USEPA), USA.
“Document on best available techniques in the pulp & paper industry” – Integrated Pollution
Prevention & Control (IPPC).
“Environmental Management in Pulp & Paper Industry” – Technical report no. 34, United
Nations Environmental Program, Stockholm.
“Technical guidance for integrated pulp & paper sector” – Integrated Pollution Prevention &
Control Environmental Protection Agency, Scientific & Technical information services,
Bristol.
“Pulp & Paper Manufacture volume 1-4” – Joint Textbook committee of paper industry
(TAPPI), Atlanta (US).
Various Publications, Technical Association of the Pulp and Paper Industry (TAPPI), U.S.
Various Publications, Indian Paper Manufacturers Association (IPMA), India.
Various Publications, Indian Pulp and Paper Technical Association (IPPTA), Saharanpur,
India.

Technical EIA Guidance Manual for Pulp and Paper Industry August 2010
Websites
http://envfor.nic.in/divisions/iass/eia.htm
http://www.cpcb.nic.in/
http://www.epa.gov/
http://www.iaia.org
http://www.fao.org/docrep/005/v9933e/v9933e00.htm#TOC
http://kspcb.kar.nic.in/

IL&FS Ecosmart Limited
Flat # 408, Saptagiri Towers
Begumpet
Hyderabad – 500 016
Ph: + 91 40 40163016
Fax: + 91 40 40032220
For any queries or technical inputs kindly mail:


![Trucknology Generation TGL,TGM [2013]](https://static.fdocuments.us/doc/165x107/55cf9b50550346d033a58d41/trucknology-generation-tgltgm-2013.jpg)