
For measures in 2019 - assets.publishing.service.gov.uk · 1.5 In both 2017 and 2018 headline...
101
16 to 18 accountability measures: technical guide For measures in 2019 July 2019
Transcript of For measures in 2019 - assets.publishing.service.gov.uk · 1.5 In both 2017 and 2018 headline...

16 to 18 accountability measures: technical guide
For measures in 2019
July 2019

2
Contents Contents 2
Introduction 7
Expiry or review date 8
Who is this advice for? 8
Allocation of students to schools and colleges 9
Students included at the end of 16-18 study 10
Summary of Performance Measures 11
Headline measures since 2016 11
Disadvantage measures since 2017 11
Additional measures 12
Other measures 13
Future plans 14
Timeline of changes to performance tables since 2016 14
Qualifications and performance points 17
Qualifications included 17
A level 17
Academic 17
Applied general and tech level 18
Level 2 vocational qualifications 18
Technical certificates 19
Discounting 19
Performance point scores 19
Level 3 qualifications 19
Level 2 qualifications 19
Progress (and a combined completion / attainment measure) 20
Level 3 value added measure 20
Students included in the measure 20
Qualifications included in the measure 20

3
How the measure works 21
Academic and applied general minimum standards withdrawn 21
Progress Banding 22
Completion and attainment measure 22
How the measure works 22
Tech level minimum standard withdrawn 24
Attainment 25
Attainment measure methodology 25
Discounting of level 3 qualifications 29
Discounting of level 2 technical certificate qualifications 29
Additional attainment measures 29
Best 3 A levels measure 29
AAB measure (of which at least two are in facilitating subjects) 31
TechBacc measure 32
Technical certificate measure (from 2017) 32
Level 3 vocational measures (from 2018) 32
Attainment of an approved level 3 maths qualification 33
English and maths 35
How the measure works 35
Data sources 35
Overview of the measures 36
Calculating the English and maths progress measures 36
Students included in the measures, exclusions and exemptions 36
Qualifications included in the measures: students in scope 37
Qualifications included in the measures: starting point 37
Qualifications included in the measures: progress 38
Calculating progress 38
Points awarded for stepping stone qualifications 39
Calculating school or college progress 42

4
Retention 43
How the measure works 43
Exceptions to the retention measure 44
Selection of the core aim 44
All academic aims or academic aims and level 2 vocational aims only 45
All vocational aims 46
Mixture of academic and vocational aims 47
Supporting retention measures 48
Returned and retained for a second year 48
Retained and assessed 49
Destinations 50
Changes to destination measures in 2019 50
Cohort expanded to students of level 2 qualifications and below 50
Flexible destination year methodology 50
Further education destination level breakdown 51
How the headline measure works 51
Data sources 53
Supporting information 53
New measure: Progression to higher education or training 53
Students in scope and progression criteria 53
How the new measure works 54
Wider qualification reform 55
English and maths 55
A level reforms 55
Reform of vocational qualifications 56
Independent, special schools, and multi-academy trusts 57
Independent schools 57
Special schools 57
Multi-academy trusts 57

5
Apprenticeship reporting in performance tables 59
Future plans for performance tables and timescales for implementation 60
Multi-site college reporting 60
T Level accountability measures 60
Background 60
Attainment 61
Completion 61
English & maths 62
Progress (value added) 63
Tech level value added progress measure 63
Timescales for implementation 64
Annex A: Detailed methodology for allocation 66
Annex B: Level 3 Value Added calculations 70
Overview of the measure 70
Calculating the national average grade for comparison 70
Calculating average prior attainment at key stage 4 70
Calculating the national average grade 73
Calculating value added scores 75
Confidence intervals for L3VA 81
Purpose of confidence intervals 81
Understanding school and college confidence intervals 84
Annex C: Further details of the completion and attainment measure 86
Example of how the completion and attainment measure works 86
Subject grouping for fairer matching 87
Determining the size of an aim or result for the completion and attainment measure 88
Examples of how the size of an aim or result is determined 88
Re-based performance points scores for level 2 qualifications 89
Annex D: English and maths progress measure 90
English and maths progress examples 90

6
Individual student progress in the same institution throughout 90
Individual student progress in multiple institutions 90
Multiple institutions and moving out-of-scope of tables 92
Condition of funding details: points to note 92
Unregulated level 1/ level2 certificates in the English and maths measure 92
Annex E: Retention 93
Headline retention measure 93
Returned and retained for a second year 94
Retained and assessed 97
Annex F: Destination measures – sources and methodology 98
Data sources used 98
The headline measure: percentage staying in education or employment for at least two terms 99
Annex G: Data sources 100

7
Introduction 1.1. Initially announced in 2014, from 2016 we have been reforming the school and college accountability systems to set higher expectations, and to make the system fairer, more ambitious, and more transparent. 1.2. To achieve these aims a set of five headline measures was published for the first time in 2016 16-18 performance tables. The headline measures are progress, attainment, progress in English and maths (for students without a GCSE pass at A*-C in these subjects or 9-4 for new reformed GCSEs), retention, and destinations. 1.3. These measures provide a rounded picture of school and college performance used in a range of ways: informing student choice; informing a school or college’s own self-assessment and benchmarking; informing Ofsted’s inspection regime; and informing government’s performance management of the 16-18 sector. 1.4 In 2017 these headline measures were extended to include level 2 vocational qualifications, and disadvantaged measures are now published for all headline measures, whilst in 2018 performance tables included value-added data for Multi Academy Trusts (MATs) and apprenticeships for the first time. 1.5 In both 2017 and 2018 headline measures were supported by additional measures covering attainment, retention, and the proportion of students entering qualifications approved for reporting in performance tables. 1.6. On 2nd July, DfE published the 2019 Statement of Intent. This sets out the information that will be published in the 2019 school and college performance tables: https://www.gov.uk/government/publications/school-and-college-performance-tables-statements-of-intent The Statement explains that the 16-18 performance tables will be published in January and March as the data sources required for some1 of the headline measures do not become available until after January 2019. 1.7. Guidance for headline and additional measures in 2019 - with the exception of destinations described in chapter 9 - is substantially unchanged from the previous update in October 2018. 1.8 The ‘Understanding School and College Performance Measures’ guidance gives a complementary non-technical view of 16 to 18 accountability measures: https://www.gov.uk/government/publications/understanding-school-and-college-performance-measures. That guidance also covers some additional details for how measures are displayed on the compare school and college performance website, for example: when certain data may be suppressed; or what happens in cases where a school or college closes, merges with another, or becomes an academy. The compare school and college performance website can be found at: https://www.compare-school-performance.service.gov.uk/
1 The completion and attainment, and retention headline measures are published in March

8
Expiry or review date 1.9. This guide will be reviewed in summer 2020.
Who is this advice for? 2.0. This advice is for:
a) School and college leaders, school and college staff and governing bodies in all maintained schools, academies and free schools with a sixth form, sixth form colleges and general further education colleges.
b) Ofsted inspectors, education advisers and brokers, regional school
commissioners, FE advisers and the FE commissioner.
c) Local authorities
d) Other users of 16-18 performance tables

9
Allocation of results to schools and colleges 2.1. Prior to the 2016 performance tables all results were assigned to one school or college (in the reporting year). Since 2016, results are allocated on an annual basis to the school or college where the student has enrolled to take their main programme of study, recorded in the School Census or Individual Learner Record (ILR). Note all results taken in that year will be allocated to the main school or college, irrespective of where they were taken. Results will continue to be published at the end of the post-16 study phase; usually when the student is academic age 17 (year 13). 2.2. If a school or college defers the student’s results this might mean that some results are published three years after the end of key stage 4. There are three possible sources of information to consider, each year: • schools that return the spring school census – the spring school census returns
student level information and is used to identify 16-18 students on-roll in state-funded schools as before;
• colleges that return the ILR – the ILR returns student level information and is used
to identify 16-18 students ‘on-roll’ in colleges (and other provider types returning the ILR); determined by where the student studied their main course of study. Outcomes related to additional courses recorded on the ILR, which may include those delivered by a different school or college, are also reported against the ‘core’ college since they are responsible for that student’s overall study programme
• awarding organisation data2 (for schools or colleges that do not return the spring school census or ILR) – for schools or colleges which do not return student level information to the department i.e. independent schools, we have continued to use awarding organisation data to allocate results to schools and colleges but on an annual basis.
2.3. On completion of 16-18 study, outcomes are reported against one, two or three schools or colleges, reflecting the study and achievements in that year. Annex A provides more information on how the allocation methodology works in practice using these data sources, including some worked examples.
2 Awarding organisations (AOs) deliver regulated qualifications and award examination results to students in post-16 study. Each year, the department collects data from AOs, via an external contractor, on the students who have entered exams and their results

10
Students included at the end of 16-18 study 2.4 From the 2016 performance tables, students are included if;
a) they have entered for at least 2 qualifications, each of which is at least the
size of an A level or they have entered for at least 1 qualification the size of at least 2 A levels, in the reporting year;
OR
b) they have been allocated to the same school or college for the last two years;
OR
c) they are 18 at the start of the reporting year and have not been reported in the performance tables at their current allocated school or college.
Schools or colleges will still be able to defer students who meet criteria a) or b) but who are continuing their 16-18 study, as long as the student has not reached age 18 before the start of the reporting year. 2.5. This allows us to identify all students at the end of their 16-18 study, not just those following a level 3 programme of study. 2.6. Please note a student eligible for reporting in 16-18 performance tables will also need to meet criteria for each performance measure to be included in that measure. For example, to be included in the average point score per A level entry expressed as a grade, the student must have been entered for at least an AS qualification.

11
Summary of Performance Measures 3.1. Effective education systems around the world have high levels of autonomy with clear and robust accountability. OECD evidence shows that strong accountability is an important part of improving students’ achievement. Our new headline performance measures will shine a light on the progress that students make while at a school or college. This is a fairer reflection of how the school or college is performing than looking only at the grades that students achieve. It encourages schools and colleges to focus on achieving the best outcomes for all students, irrespective of their starting points.
Headline measures since 2016 3.2. The five headline measures are:
• Progress: The progress of students is the main focus of the new accountability system. This measure is a value added progress measure for academic and applied general qualifications, and a combined completion and attainment measure for tech level and level 2 technical certificate qualifications (section 5).
• Attainment: The attainment measure shows the average point score per entry, expressed as a grade and average points. Separate grades are shown for level 3 academic (including a separate grade for A level), applied general, tech level and, level 2 technical certificate qualifications (section 6).
• English and maths progress (for those students who have not achieved GCSE
grade 9-4 or A*-C by the end of key stage 4): This measure shows the average change in grade separately for English and maths. The methodology for the measure is closely aligned with the condition of funding rules, which means that students that do not reach grade 9-4 or A*-C are required to continue to study English and/or maths at post-16 (section 7).
• Retention: As the participation age has increased to 18 it is increasingly important
that all young people are given suitable education and training opportunities that they see through to completion. The retention measure therefore shows the proportion of students who are retained to the end of their main programme of study (section 8).
• Destinations: Including destination information in performance tables broadens
the information available to the public and gives schools and colleges the opportunity to demonstrate other aspects of their performance (section 9).
Disadvantage measures since 2017 3.3. Headline measures are calculated for the disadvantaged students in a school or college, to illustrate differences between how well disadvantaged students in a school or college do compared to non-disadvantaged students nationally.

12
3.4. The disadvantage classification follows that used at key stage 4. Disadvantaged students are all students who were in receipt of pupil premium when they were in their last year of key stage 4. Note, the pupil premium is distinct from the Service Pupil Premium (SPP); students eligible for the SPP but not in receipt of pupil premium will not be identified as disadvantaged. 3.5. The attainment, progress, retention and English and maths disadvantage measures do not include students who were not reported at the end of key stage 4 – for example, because they came from overseas. Students who were known to be at independent schools in their last year of key stage 4 are treated as non-disadvantaged. The destination measures group all students not known to be disadvantaged at the end of key stage 4 as “all other students”. 3.6. These measures are not calculated for independent schools.
Additional measures 3.7. Additional measures are produced as follows:
• Best 3 A levels: For students studying A levels and no other applied or technical qualifications we expect that their programme size should be at least 3 A levels. This measure is calculated for A level students only and shows the average points per entry of a student’s best 3 A levels. For students who have only entered one or two A levels their total points are still divided by three (section 6).
• AAB in at least two facilitating subjects: The government’s policy is to promote and incentivise participation in the facilitating subjects at A level. This measure applies to A level students only (so students just entering Applied A levels are not in scope of this measure). A student must have achieved three A levels, of which at least two are in facilitating subjects, at grades AAB. The percentage of students achieving this measure is shown for each school or college (section 6).
• TechBacc: The Technical Baccalaureate (TechBacc) measure allows young people aspiring to a technical career a high-quality alternative to the A level route. This measure is a count of all students in a school or college who have achieved the TechBacc (section 6).
• Technical certificate measure: Technical certificates were developed to encourage take-up of level 2 vocational qualifications that support student progression into a recognised occupation. To give time for schools and colleges to transition towards these qualifications a broader range of level 2 vocational qualifications were reported in the 2017 and 2018 tables (section 6). This measure shows the proportion of students whose highest attainment is a vocational level 2 qualification and who achieve an approved technical certificate.

13
• Level 3 vocational measures: These additional measures show the number of students entering level 3 vocational qualifications that count in the 16 to 18 performance tables as a proportion of the total number of students entering any level 3 vocational qualification. The level 3 comparison group includes all level 3 vocational qualifications at least equivalent in size to one A level (minimum 325 guided learning hours), including those which are not approved to count in the 16 to 18 performance tables in 2019. The measure is shown separately for applied general qualifications and tech levels (section 6).
• Level 3 maths: This measure supports our ambition for the overwhelming majority of young people in England to study maths to age 18 by 2020. This measure shows the percentage of students who achieved a GCSE 9-4 or A*-C grade in GCSE maths (or equivalent) by the end of key stage 4 and go on to achieve an approved level 3 maths qualification (section 7).
• English and maths progress measure: Supplementary data to the headline measure showing the proportion of students in scope for either English and/or maths measures that enter an approved qualification (section 7).
• Returned and retained for a second year: This supporting measure to the headline retention measure shows the percentage of students who return and complete a second year (section 8).
• Retained and assessed: This supporting measure to the headline retention measure shows the percentage of students who complete their main programme of study and are assessed at the end of their course (section 8).
• Progression to higher education or training: This value-added measure is being released for the first time in 2019 and will show the number of level 3 students that progress to a sustained level 4 or higher destination (apprenticeships, level 4/5 courses and degrees). We will also show breakdowns of the destination type (apprenticeship, level 4 or 5 course, degree) and destination provider (top third, Russell group, Oxford and Cambridge). See section 9 for more details.
Other measures 3.8. From 2018 performance tables reporting was extended by reporting:
• Multi-academy trusts: MAT performance tables measures for 16 to 18 education are published in March alongside the school and college performance tables published in January (Section 11).
• Apprenticeships: Performance tables now include qualification achievement rates (QARs) for 16-18 year old apprenticeships. This data is published in National

14
Achievement Rate Tables, and now additionally in performance tables each March (Section 12).
Future plans 3.9. We intend to make the following changes in future:
• Multi-site colleges: To calculate accountability measures for eligible college groups showing the performance of their constituent colleges and/or delivery sites. This follows a public consultation that ran from April to June 2018 (section 13): https://www.gov.uk/government/consultations/performance-reporting-fe-college-groups-and-multi-site-colleges
• T Levels: These are new courses being rolled out nationally from September 2020 which are equivalent to 3 A levels. Following a public consultation, the government response set out at a high level five headline accountability measures that will be developed and published as part of performance tables: attainment, completion, English and maths, progress, and destinations (section 13): https://www.gov.uk/government/consultations/implementation-of-t-level-programmes
• Tech level progress: A value-added tech level progress measure will be demonstrated in shadow data shared with schools and colleges in spring 2020. The intention is for a value-added measure to replace existing progress reporting through the combined completion and attainment measure in 2020 performance tables (section 13).
Timeline of changes to performance tables since 2016 3.10. The table below provides a high-level summary of the range of performance table measures since 2016, detailing extensions to reporting (additional measures, or extending coverage to include more qualifications). It also outlines any methodological changes to how measures are calculated. Note methodological changes are not applied retrospectively to previous cohorts / tables.
2016 Vocational qualifications reported separately for tech levels and applied general qualifications, following the review of vocational education and recommendations by Professor Alison Wolf. A new set of headline measures were introduced, covering: • Level 3 progress: value added for academic and applied general qualifications;
combined completion and attainment measure for tech levels

15
• Attainment based on average grade for academic, applied general and tech levels
• English and maths progress (for students who complete key stage 4 without an A*-C/9-4 GCSE in these subjects).
• Retention measure • Destination measures (reporting on cohort of 16-18 students reported in other
measures in 2014 tables)
2017 New cohort introduced: level 2 vocational qualifications and technical certificates; Disadvantaged measures introduced: Disadvantaged status at end of KS4 applied to headline measures; New supporting measures introduced:
• level 3 maths measure; • technical certificate measure; • returned and retained for a second year; • retained and assessed measure
Methodology change: Update to completion and attainment measures, such that: • Aggregate score now weighted by the relative size of each qualification. • Change to subject grouping methodology. Qualifications of the same subject
with different awarding bodies now grouped together rather than grouped separately (as they were in the 2016 tables).
2018 Multi-academy trust measures introduced: progress measures for academic (including A levels) and applied general cohorts; Apprenticeship measures introduced: Qualification achievement rates (QARs) for 16-18 year old apprenticeships reproduced in performance tables; New supporting measures introduced:
• English and maths progress: the proportion of students in scope for either the English and/or maths measures who enter an approved qualification;
• Level 3 vocational measures: the proportion of students entering level 3 vocational qualifications that count in the 16 to 18 performance tables as a proportion of the total number of students entering any level 3 vocational qualifications. The measures are published separately for applied general students and tech level students.
Methodology changes in 2018: • English and maths progress: schools and colleges are able to remove
apprenticeship students from 2018. This is in line with the condition of funding policy;
• Level 3 value added: Methodology for KS4 prior attainment updated. From 2018, the best result in any subject achieved in KS4 used when calculating the average point score. Qualifications in scope will be those approved in KS4 performance tables in any year from 2014 onwards. Before 2018, the first entry in same subject was used, and only vocational qualifications on the approved list for inclusion in the year when the student was at the end of KS4 were included.

16
• Destination measures: As destination measures are on a 2-year lag with the other measures, changes to the institution allocation rules from 2016 come into effect. A student must have studied an approved level 3 qualification and have been allocated to an institution in the 2016 academic year to be included in 2018 Destination measures.
2019 Progression to higher education or training: This value-added measure will show the number of level 3 students that progress to a sustained level 4 or higher destination (apprenticeships, level 4/5 courses and degrees). Level 2 vocational cohort withdrawn: from 2019 at level 2 only approved technical certificate qualifications are reported in attainment, completion and attainment, and retention measures. Methodology changes in 2019:
• Destination measures: The cohort of students in scope for destination measures is expanded to include students of level 2 and below and unapproved qualifications. Students that did not attend their school or college in the year in which they were deemed to have reached the end of 16 to 18 study are also included by implementing a flexible destination year methodology.

17
Qualifications and performance points
Qualifications included 4.1. A list of qualifications recognised in the 2019 performance tables data are set out below. They are listed according to the four level 3 performance cohorts: A level, academic, applied general and tech level; and the level 2 technical certificate cohort (note the broader level 2 vocational qualification is not reported from 2019). A level 4.2. To be included in the A level performance cohort for a school or college, the student must have entered for at least one of the following qualifications in the academic years they have been allocated to that school or college: Qualification
GCE A level Applied GCE A level single award Applied GCE A level double award GCE AS level Applied GCE AS level single award Applied GCE AS level double award Applied GCE A level / AS level combined
Academic 4.3. The A level category is a sub-set of the academic category. Therefore, the qualifications listed above will also be reported as academic qualifications. Please note that the AQA Baccalaureate will not count in the performance tables from 2016. This is because, from 2016, enrichment activities do not receive performance points as these are not examined. Therefore the diploma itself will no longer count, although its constituent qualifications will continue to earn points in their own right. 4.4. To be included in the academic performance cohort for a school or college, the student must have entered for one of the following qualifications, which must be equivalent in size to at least 0.5 A levels with the exception of the extended project, which although smaller is still included.

18
Qualification GCE A level Applied GCE A level single award Applied GCE A level double award GCE AS level Applied GCE AS level single award Applied GCE AS level double award Applied GCE A level / AS level combined International Baccalaureate Diploma (IB) IBO Standard level component IBO Higher level component IBO Diploma Theory of Knowledge, Extended Essay and Reflective Project * Pre-U Principal Subject Pre-U Short Course Subject Pre U Diploma Extended Project (Diploma) Advanced Extension Award Core Maths Qualifications at level 3 Free standing Maths Qualification level 3 (FSMQ) *
* These qualifications are too small to cause inclusion in the academic performance cohort on their own; however, they are still counted if students have entered other qualifications on this list. Applied general and tech level 4.5. Since 2016, only high value level 3 vocational qualifications, which meet pre-defined characteristics, are recognised in the 16-18 performance tables. The lists of vocational qualifications that count in the 2019 performance tables can be found here: https://www.gov.uk/government/publications/2019-performance-tables-technical-and-vocational-qualifications Only those qualifications on the list of applied general qualifications are recognised in the applied general category, and only those qualifications on the list of tech level qualifications are recognised in the tech level category. We expect all students wishing to pursue a level 3 vocational course to be studying a qualification on one of these two lists. Other qualifications should only be studied in exceptional circumstances. To be included in the applied general or tech level performance cohort, the student must have entered for at least one of these qualifications in the academic years they have been allocated to that school or college. Level 2 vocational qualifications 4.6. From 2019, only technical certificates will be recognised as level 2 vocational qualifications in the 16-18 performance tables. Previously, to give time for schools and colleges to transition towards these qualifications a broader range of qualifications were also reported in 2017 and 2018 tables. These included all level 2 vocational qualifications of size equivalent to at least two GCSEs (minimum 145 guided learning hours).

19
Technical certificates 4.7. Technical certificates are a subset of level 2 vocational qualifications. To be included in the technical certificate performance cohort, the student must have entered for at least one of these qualifications in the academic years they have been allocated to that school or college. The lists of qualifications that count in 2019 performance tables can be found here: https://www.gov.uk/government/publications/2019-performance-tables-technical-and-vocational-qualifications Discounting 4.8. Discounting is primarily about ensuring that where a student has taken more than one qualification in the same subject area, the performance tables only give credit to institutions once for teaching a single course of study. 4.9. In 2016 performance tables the only discounting that occurred was when one level 3 qualification discounted another level 3 qualification(s). 4.10. In 2017 and 2018 tables reporting included vocational qualifications at level 2, which from 2019 tables just means technical certificate qualifications. Reporting level 2 qualifications required an extension to discounting where: (a) level 2 qualifications can discount other level 2 qualification(s) in the same subject; (b) level 3 qualifications discount a level 2 qualification in the same subject area (but not vice-versa).
Performance point scores 4.11 Performance points for 2019 tables can be found here: https://www.gov.uk/government/publications/16-to-19-qualifications-discount-codes-and-point-scores Level 3 qualifications 4.12. The points for level 3 qualifications in the 2019 16-18 performance tables have not changed from those used in 2016 to 2018 tables. They were designed to allow level 3 qualifications of different sizes and grade structures to be compared, as well as to act as a good basis for calculation and statistical modelling in the new headline measures. Level 2 qualifications 4.13. The performance points at level 2 have been designed to have the following properties (and can differ from the points used in key stage 4 performance tables):
• As per level 3 performance points, larger qualifications attract more points (size is measured relative to 1 GCSE equivalent);
• Differences in reported headline attainment measures (average point score per entry, or average grade) make intuitive sense: for most qualifications an improvement of one grade would translate to an improvement of one unit (APS per entry).

20
Progress (and a combined completion / attainment measure) 5.1. The progress of students is the main focus of the new accountability system. The progress measures show separate scores for:
• level 3 academic programmes (including A levels)
• level 3 applied general programmes
• level 3 tech level programmes
• level 2 technical certificates 5.2. The level 3 value added measure is used to calculate academic and applied general progress; whereas a combined completion and attainment measure is used for tech level, and level 2 technical certificate qualifications.
Level 3 value added measure 5.3. For academic and applied general qualifications we use a value added progress measure to show how well students have progressed when compared with students with similar prior attainment. Progress is shown separately for academic and applied general qualifications. 5.4. The Level 3 value added (L3VA) measure shows the progress each student makes between key stage 4 and graded level 3 qualifications (excluding tech levels), compared with the actual progress made by students nationally who had similar levels of attainment at key stage 4. Students are compared with other students studying the same qualification nationally before being aggregated to give an overall score for a school or college. This score is expressed as a proportion of a grade above or below the national average, e.g. students achieve half a grade lower than the national average for those with similar starting points.
Students included in the measure 5.5. To be included in the L3VA measure, a student must:
• have results at the end of key stage 4. • have completed an academic or applied general qualification (see section 4.2). If
they enter and fail they are included, but if they withdraw and don’t enter, they are not.
Qualifications included in the measure 5.6. Only academic qualifications and qualifications on the approved applied general list (see section 4.5) are included in the L3VA measures. In addition, qualifications are only

21
included if at least 16 eligible students, in at least five schools or colleges, have an exam result.
How the measure works 5.7. For all students, we work out their average attainment at key stage 4. For academic qualifications, students’ prior attainment is based on their average attainment in GCSEs only3. For applied general qualifications, students’ prior attainment is based on all qualifications achieved at key stage 4. 5.8. In 2017, students included in L3VA contained students on mixed scales, whose KS4 attainment had been reported on a 0-58 scale (reported in 2015 and earlier) and students reported on a 0-8 scale (reported in 2016). To ensure a consistent baseline, the 2016 KS4 points were converted back to a 0-58 scale. 5.9. Also prior to 2018, qualifications were included in the prior attainment calculation if they met all the rules for inclusion in the key stage 4 tables for the year the student completed KS4. For example, for students who completed key stage 4 in 2015, only the first entry of a subject is included and only vocational qualifications that were on the approved list for inclusion in the key stage 4 tables in 2015. Re-sits or additional qualifications gained during the 16-18 study phase were not included. 5.10. From 2018 onwards, prior attainment in L3VA reflects the points scales used at KS4 in the current reporting year for all students (e.g. for the 2019 L3VA, the scale used for GCSE and other qualifications will be the points used in the 2019 key stage 4 performance tables). Qualifications in scope are all those approved in key stage 4 performance tables in any year from 2014 onwards. Simple discounting rules apply, with the best result in any subject used when calculating the average point score. As before, re-sits or additional qualifications gained during 16-18 are ignored. 5.11. To calculate the progress made by students taking the same qualification nationally we first divide students into up to 20 bands based on their prior attainment. We then calculate the average attainment for each of these bands. This allows us to compare a student’s result with the average result of students with equivalent prior attainment taking the same qualification. The difference between the two is the student’s value added score in that qualification. 5.12. The students’ value added scores are then aggregated to create separate scores for academic qualifications and applied general qualifications for each school or college. The supporting information allows schools and colleges to see value added scores for specific qualifications and qualification types (e.g. A levels). All results are shown with confidence intervals. 5.13. Detailed level 3 value added methodology and calculations are in Annex B.
Academic and applied general minimum standards withdrawn 5.14 As set out in the 2019 Statement of Intent, from 2019 tables 16 to 18 minimum standards will no longer be published, nor used for any purpose. This follows a similar 3 A small number of other academic qualifications (such as AS levels) are included as well as GCSEs

22
announcement in May 2019 that we will no longer publish floor and coasting standards for primary and secondary schools.
Progress Banding 5.15. On the Compare School Performance website, a school or college is assigned to one of five Progress Bands based on their value added score and confidence interval values. These are designed to quickly show how a school or college compares to the performance of other schools and colleges. 5.16. More information on the scores and confidence intervals needed in 2019 to assign a school or college to a band will be updated in the progress banding guidance for 2019: https://www.gov.uk/government/publications/16-to-19-accountability-headline-measures-technical-guide 5.17 The methodology used to decide which progress band a school or college falls into is currently being reviewed. Previously school or colleges falling below minimum standards in 2018 also identified the schools and colleges in the lowest of the five Progress Bands in 2018 performance tables. As minimum standards are no longer produced a new methodology is being explored.
Completion and attainment measure 5.18. In the 2017 performance tables we broadened the scope of the completion and attainment measure to include all level 2 vocational qualifications equivalent in size to at least two GCSEs. From 2019 the completion and attainment scores are shown separately as two cohorts: tech level qualifications, and level 2 technical certificates. 5.19. The measure compares the attainment of students with the national average attainment for each qualification and treats non-completion of the course as a fail. The scores for each qualification are aggregated to give an overall score for a school or college, expressed as a proportion of a grade above or below the national average. 5.20. Note, we have not had a value added progress measure for tech levels due to a weak relationship between students’ average key stage 4 results and their tech level outcomes. We have re-tested this relationship following reforms to approved level 3 vocational qualifications in 2018, and observed that the relationship has strengthened. In spring 2020 we will run shadow measures to demonstrate a tech level value added progress measure. This will be calculated – separately – for two cohorts of tech level students previously reported in 2018 and 2019 performance tables (i.e. as part of testing we will retrospectively calculate two years of a value-added progress measure) – see section 13. How the measure works 5.21. Attainment in each qualification delivered by a school or college is first calculated by adding up all the point scores for the qualification and dividing them by the number of students taking that qualification. Non-completion is treated as a fail and given a score of zero. A school or college’s attainment in a subject is then subtracted from the national average attainment in that subject to generate a score above or below the national

23
average. Scores for each subject are finally aggregated to produce an overall score for a school or college relative to the national average. For example, a school or college may have a score of +0.5 in tech levels, meaning that on average in these qualifications, students achieve half a grade higher than the national average attainment for all students. 5.22 From 2017, the completion and attainment methodology has been updated so that the aggregate score will be weighted by the relative size of each qualification. For example, the score in a qualification equivalent in size to 2 A levels will count twice as much as the score in a qualification equivalent in size to 1 A level. 5.23. From 2019, the completion and attainment measure at level 2 just includes approved technical certificate qualifications. 5.24. A student is included when they study at least one tech level course or one level 2 technical certificate qualification, in a state-funded institution, for years where the student attracts funding. Students who withdraw from a relevant qualification within the funding “qualifying period”4 are excluded from the measure. Where a student is recorded as having withdrawn from a qualification after the qualifying period they are treated as having failed the qualification. 5.25. For all students who complete relevant qualifications we assign a point score based on the grade that they achieved5. Fails and withdrawals after the qualifying period are given zero points. The grading information is sourced from the data supplied to the Department by awarding bodies. For many vocational qualifications, this information does not include the records of students failing qualifications. By including a completion element to this measure, we are able to cover more students than otherwise would have been possible and increase incentives to help weaker students complete their qualifications. 5.26. Students who are shown on the school census or ILR as withdrawing from a tech level or technical certificate because they are transferring to start an apprenticeship, traineeship or supported internship, are excluded from the completion and attainment measure. This is so that there is no disincentive for students to take up opportunities to continue their training with employers as well as with schools and colleges. 5.27. Where a student transfers onto a different subject or qualification type with the same school or college, only the latest qualification is included in the measure. For example, a student who transfers from a plumbing qualification to a construction qualification at the same school or college will only have their construction qualification included in the measure. 5.28. Where a student of academic age 18 is due to complete a course at academic age 19, the qualification is also excluded from the measure.
4 For programmes longer than 24 weeks the qualifying period is 6 weeks, for programmes that are 2 to 24 weeks the qualifying period is 2 weeks. 5 Level 3 qualification grades map to the points scales used in the attainment measure (see Section 4 for further details); level 2 qualifications use a “re-based” version of performance points set out in Annex C.

24
5.29. Discounting is applied to students with a mix of level 2 technical certificate qualifications and tech level or applied general qualifications. For example, a level 2 technical certificate is discounted by a tech level or an applied general qualification in the same discounting family. 5.30. When discounting between level 2 qualifications or between tech levels the largest qualification takes precedence. A smaller size tech level is discounted by a larger tech level, as is a smaller level 2 technical certificate by a larger level 2 technical certificate qualification. 5.31. In cases where a student achieves a level 2 technical certificate qualification, but then fails to complete a tech level in the same subject, discounting is not applied and both the level 2 technical certificate and tech level are reported. 5.32. The subject included must have a graded outcome. This means that the subject needs to have more than two possible outcomes. 5.33. Additionally, there needs to be a minimum of 16 students with results in that subject and at least five institutions offering the course nationally in order for it to be included in the completion and attainment measure. This is to avoid small numbers of students distorting results. 5.34. The subject grouping methodology changed in 2017. Qualifications of the same subject with different awarding bodies are now grouped together rather than grouped separately as they were in the 2016 tables. See Annex C for further details on how qualifications are grouped together in the completion and attainment measure.
Tech level minimum standard withdrawn 5.35 As set out in the 2019 Statement of Intent, from 2019 tables 16 to 18 minimum standards will no longer be published, nor used for any purpose. This follows a similar announcement in May 2019 that we will no longer publish floor and coasting standards for primary and secondary schools.

25
Attainment 6.1. It is important to provide an indicator of students’ overall attainment in different types of qualifications, which parents and students can easily understand and use to compare schools and/or colleges. The headline attainment measures from 2016 are the average point score (APS) per entry and APS per entry expressed as a grade. 6.2. Headline attainment measures report level 3 qualifications for four performance cohorts (A level, academic, applied general, and tech level), and level 2 qualifications for the technical certificate cohort. Note a student can be reported in more than one cohort, for example, a student who enters both A level and applied general qualifications will contribute to an institution’s performance in both attainment measures.
Attainment measure methodology 6.3. The average point score per entry is calculated by dividing the total number of points achieved by students in a particular cohort by the total size of entries for those students. 6.4. For example, to calculate an average point score per academic entry, the total point score achieved by students in all academic qualifications is divided by those students’ total size of academic entries. The average point score per applied general and tech level entry is calculated in the same way, based on students entered for the relevant qualifications and their results. 6.5. Where a student has attempted an A level and failed, but they have been awarded an AS in the same subject, the size of the A level entry is counted and not the size of the AS level entry. Therefore, these students will have an A level size of 1 and not 0.5. 6.6. Average grades are published for each school and college in the 16 to 18 performance tables alongside the average point score per entry measure. These are reported to help interpret the average point score per entry in terms of grades that are meaningful for the types of qualification reported within each performance cohort. 6.7. The average grade per academic qualification is calculated using the average point score per academic entry. Similarly, the average grade per A level, applied general, tech level, vocational qualifications at level 2, and technical certificate qualifications are calculated from the respective average point scores per entry. 6.8. The average point score per entry is assigned an average grade based on the average point score band rules set out in Table 6.1.a. and 6.1.b. and 6.1.c below.
• Average grade per A level and academic entry is reported in terms of A level grades. Table 6.1.a. shows the relevant point score bands for A levels and academic qualifications.
• Average grade per level 3 vocational entry is reported in terms of qualification with a four-grade structure (for example, Distinction*/Distinction/Merit/Pass). Table

26
6.1.b. shows the relevant point score bands for applied general and tech level qualifications.
• Average grade per level 2 vocational entry is based on a level 2 qualification with a Distinction*/Distinction/Merit/Pass grade structure. Some reported level 2 vocational qualifications have passing grades at level 1, and the scale is extended to reflect this. All passing grades in reported qualifications will count towards an institution’s APS per entry score and the related average grade. Table 6.1.c. shows the relevant point score bands for technical certificate qualifications.
6.9. A worked example of calculating an average grade per academic qualification based on a cohort of 5 students is shown in Table 6.1.d. Table 6.1.a – Average grade per A level or academic qualification
A level grade A level point score APS band Fine grade6
(for comparison only)
A* 60 58.34 – 60.00 A* 55.00 – 58.33 A*-
A 50 51.67 – 54.99 A+ 48.34 – 51.66 A 45.00 – 48.33 A-
B 40 41.67 – 44.99 B+ 38.34 – 41.66 B 35.00 – 38.33 B-
C 30 31.67 – 34.99 C+ 28.34 – 31.66 C 25.00 – 28.33 C-
D 20 21.67 – 24.99 D+ 18.34 – 21.66 D 15.00 – 18.33 D-
E 10 11.67 – 14.99 E+ 8.34 – 11.66 E 5.00 – 8.33 E-
U 0 Below 5.00 U
6 Fine grades such as B-, B and B+ are assigned by evenly distributing the points around the point score i.e. 40 points for a grade B.

27
Table 6.1.b – Average grade per applied general or tech level qualification
Grade Points / size (L3 vocational) APS band Fine grade7
Distinction* 508 46.67 – 50.00 Dist* 41.67 – 46.66 Dist*-
Distinction 35 36.67 – 41.66 Dist+ 33.34 – 36.66 Dist 30.00 – 33.33 Dist-
Merit 25 26.67 – 29.99 Merit+ 23.34 – 26.66 Merit 20.00 – 23.33 Merit-
Pass 15 16.67 – 19.99 Pass+ 13.34 – 16.66 Pass 10.00 – 13.33 Pass-
U 0 Below 10.00 U
7 Fine grades for the vocational grade bands are assigned by evenly distributing the points around the points/grades for a prototypical vocational qualification with a 4-grade structure (D*/D/M/P). 8 Note: in some exceptional circumstances schools/colleges may achieve a tech level APS above 50 where students have entered for Principal Learning qualifications

28
Table 6.1.c – Average grade per level 2 vocational qualification
Grade Points / size (L1/L2 vocational ) APS band Fine grade9
L2
Distinction * 8 >7.83 - 8.00 L2 Dist* >7.50 - 7.83 L2 Dist*-
Distinction 7 >7.17 -7.50 L2 Dist+ >6.83 - 7.17 L2 Dist >6.50 - 6.83 L2 Dist-
Merit 6 >6.17 - 6.50 L2 Merit+ >5.83 - 6.17 L2 Merit >5.50 - 5.83 L2 Merit-
Pass 5 >5.17 - 5.50 L2 Pass+ >4.83 - 5.17 L2 Pass >4.50 - 4.83 L2 Pass-
L1
Distinction 4 >4.17 - 4.50 L1 Dist+ >3.83 - 4.17 L1 Dist >3.50 - 3.83 L1 Dist-
Merit 3 >3.17 - 3.50 L1 Merit+ >2.83 - 3.17 L1 Merit >2.50- 2.83 L1 Merit-
Pass 2 >2.17 -2.50 L1 Pass+ >1.83 - 2.17 L1 Pass 1.50 - 1.83 L1 Pass-
U 0 Below 1.5 U Table 6.1.d – Example of calculation for average grade per academic qualification
Students Total academic
point score No of academic
entries Student 1 100 3.0 Student 2 240 4.0 Student 3 140 3.0 Student 4 210 5.5 Student 5 140 4.0 Sum of Total academic point scores= 830
Sum of academic entries= 19.5 Average point score 42.56 Average grade (academic) B+
9 Fine grades for the L2 vocational grade bands are assigned by evenly distributing the points/grades for a prototypical qualification with a D*/D/M/P grade structure at L2. Some reported qualifications include grades that span both L2 and L1 so the fine-grade classification is extended to reflect this.

29
Discounting of level 3 qualifications 6.10. The discounting methodology for level 3 qualifications is unchanged from 2016 performance tables.
Discounting of level 2 technical certificate qualifications 6.11. Level 2 vocational qualifications can be discounted by level 3 qualifications reported in performance tables (applied general and tech levels potentially) in the same subject area. Note, a failed level 3 qualification cannot discount a level 2 pass. 6.12. Discounting between level 2 qualifications prefers first the largest qualification, and if all the same size, the qualification with the most performance points in the same subject area. Note, a failed technical certificate qualification cannot discount a smaller technical certificate pass.
Additional attainment measures 6.13. In addition to the headline attainment measures, there are six additional attainment measures. These are described below.
Best 3 A levels measure 6.14. This measure applies to the subset of A level students who entered at least one full size A level (this includes double award A levels, and applied A levels, but does not include AS levels, general studies or critical thinking). If students are entered for less than three full size A levels, they are only included in the measure if they have not entered for other academic, applied general and tech level qualifications greater than or equal to the size of an A level. Where a student has only been at a school or college for one year, they need to have entered three A levels to be included. 6.15. A best 3 A levels score is then calculated for each student by adding together the points in their best 3 A levels, then summed across a school or college. This is divided by the number of eligible students, then further divided by three to give a best 3 A levels points per entry, and this is also expressed as a grade. 6.16. For students who have only entered one or two A levels, but have been at a school or college for two years and haven’t entered at least size 1 of other approved qualifications, the points in their one or two A levels are still divided by three.

30
Worked example of the best 3 A levels measure 6.17. The following examples assume all the students remained at the same school or college for two years. Student Qualification Grade Points Comment
A
Single Award A level (size =1)
A* 60 pts For this student their best 3 A levels count in the measure. [Note, students who study combined A/AS levels, where size = 1.5, each result is divided by 1.5 to scale the size/points to 1 A level].
Single Award A level (size =1)
B 40 pts
Single Award A level (size =1)
B 40 pts
Total points 140 pts
B
Double Award A level (size =2)
A* A* 120 pts In this case the double award counts as two of their best three A level entries; only the best result from the two single award A levels count (if there are two double awards, the points from the lower grade are halved)
Single Award A level (size =1)
A 50 pts
Single Award A level (size =1)
B ignored
Total points 170 pts
C
Single Award A level (size =1)
B 40 pts Although this student has only entered 2 A levels they still count in the measure, provided they have not also entered an approved tech level, applied general or other academic qualification of size =1). The AS result does not count (only A levels count in this measure).
Single Award A level (size =1)
B 40 pts
Single Award AS level (size =0.5)
C Ignored
Total points 80 pts
The points for students A, B and C are combined to produce a school/college score in the best 3 A levels measure as follows: Student Points Total
points Total entries Points per
entry Result expressed as a grade
A 140 390 9 (number of students x 3)
390 / 9 = 43.33
B+ B 170 C 80

31
AAB measure (of which at least two are in facilitating subjects) 6.18. This measure applies to the subset of A level students who entered at least one full size A level, excluding applied A levels (this includes double award A levels, but also does not include AS levels, general studies or critical thinking). It is a similar subset to the best 3 A levels measure, except that applied A levels are not included when determining the cohort. If students are entered for less than three full size A levels, they are only included in the measure if they have not entered for other academic, applied general and tech level qualifications greater than or equal to the size of an A level. Where a student has only been at a school or college for one year, they need to have entered three A levels to be included. A student must have achieved three A levels, of which at least two are in facilitating subjects, at grades AAB or better. The percentage of students achieving this measure is shown for each school or college. 6.19. The facilitating subjects are: Biology, Chemistry, Physics, Mathematics, Further Mathematics, Geography, History, English Literature, and Classical/Modern Languages10. 6.20. The qualification numbers for A level facilitating subjects, Awarding Organisations and qualification titles are flagged in the guidance showing discount codes here: https://www.gov.uk/government/publications/16-to-19-qualifications-discount-codes-and-point-scores 6.21. The following table summarises the rules governing which A level results contribute to headline attainment and the Best 3 A level and AAB additional measures:
Qualification Counts in headline attainment (APS)
Counts in best 3 measure
Counts in AAB in 2 facilitating subjects measure
GCE A level Yes Yes (except General Studies and Critical Thinking)
Yes (except General Studies and Critical Thinking)
Applied GCE A level /AS level combined
Yes Yes No
GCE AS level
Yes No No
Applied GCE AS level Double Award
Yes No No
Applied GCE Single Award
Yes Yes No
Applied GCE AS level
Yes No No
Applied GCE Double Award
Yes Yes No
10 Classical/Modern Languages which will count towards the AAB 2019 16-18 Performance Tables indicator are: Arabic, Bengali, Chinese, Dutch, French, German, Greek (Classical), Greek (Modern), Gujarati, Irish (second language), Italian, Japanese, Latin, Modern Hebrew, Panjabi, Persian, Polish, Portuguese, Russian, Spanish, Turkish, Urdu, Welsh (second language)

32
TechBacc measure 6.22. This measure is a count of all students in a school or college who have achieved the TechBacc. More details about the TechBacc, including details of the qualifications that count towards it, can be found here: https://www.gov.uk/government/publications/technical-baccalaureate-measure-for-16-to-19-year-olds 6.23. The level 3 mathematic qualifications that count towards the TechBacc are flagged in the guidance showing discount codes for qualifications approved for 2019 tables: https://www.gov.uk/government/publications/16-to-19-qualifications-discount-codes-and-point-scores 6.24. Students need to achieve at least a pass grade in all of:
• a tech level
• a level 3 maths qualification from the list in the link above, such as core maths
• an extended project qualification
Technical certificate measure (from 2017) 6.25. This measure shows the proportion of students whose highest attainment is a level 2 qualification and who achieve an approved technical certificate. 6.26. Note discounting will not apply in this measure. Consequently, a student who passes both a technical certificate and also a larger vocational qualification at level 2, will count towards an institution’s performance in this measure.
Level 3 vocational measures (from 2018) 6.27. This additional measure shows the number of students entering level 3 vocational qualifications that count in the 16 to 18 performance tables as a proportion of the total number of students entering any level 3 vocational qualification. The level 3 comparison group includes all level 3 vocational qualifications at least equivalent in size to one A level (minimum 325 guided learning hours), including those which are not approved to count in the 16 to 18 performance tables. 6.28 The measure is produced separately for applied general qualifications and tech levels. 6.29 We expect the proportion of students studying level 3 vocational qualifications that are not on either the approved tech level or applied general lists for 2019 to be very small.

33
6.30. We do not apply discounting when determining the proportion of students entering approved level 3 vocational qualifications out of the entire cohort of level 3 vocational students (approved and non-approved).
Calculating the tech level measures
Variable Description
%𝑇𝑇𝑇𝑇𝑇𝑇ℎ Proportion of students entering tech levels that are on the approved list in 2018
Ν𝑇𝑇𝑇𝑇𝑇𝑇ℎ Number of students entering tech levels that are on the approved list in 2018
Ν𝑁𝑁𝑁𝑁𝑁𝑁𝑁𝑁3𝑉𝑉𝑁𝑁𝑇𝑇 Number of students just entering non-approved level 3 vocational qualifications at least the size of one A level
%𝑇𝑇𝑇𝑇𝑇𝑇ℎ =Ν𝑇𝑇𝑇𝑇𝑇𝑇ℎ
Ν𝑇𝑇𝑇𝑇𝑇𝑇ℎ + Ν𝑁𝑁𝑁𝑁𝑁𝑁𝑁𝑁3𝑉𝑉𝑁𝑁𝑇𝑇
Note: The denominator in this calculation does not include applied general qualifications.
Calculating the applied general measure
Variable Description
%𝐴𝐴𝐴𝐴𝑇𝑇𝑁𝑁 Proportion of students entering applied general qualifications that are on the approved list in 2018
Ν𝐴𝐴𝐴𝐴𝑇𝑇𝑁𝑁 Number of students entering applied general qualifications that are on the approved list in 2018
Ν𝑁𝑁𝑁𝑁𝑁𝑁𝑁𝑁3𝑉𝑉𝑁𝑁𝑇𝑇 Number of students just entering non-approved level 3 vocational qualifications at least the size of one A level
%𝐴𝐴𝐴𝐴𝑇𝑇𝑁𝑁 =Ν𝐴𝐴𝐴𝐴𝑇𝑇𝑁𝑁
Ν𝐴𝐴𝐴𝐴𝑇𝑇𝑁𝑁 + Ν𝑁𝑁𝑁𝑁𝑁𝑁𝑁𝑁3𝑉𝑉𝑁𝑁𝑇𝑇
Note: The denominator in this calculation does not include tech level qualifications.
Attainment of an approved level 3 maths qualification 6.31. This measure supports our ambition for the overwhelming majority of young people in England to study maths to age 18 by 2020. New, high-quality ‘Core Maths’ qualifications provide an option to continue the study of maths for those students with at least a grade C/4 at GCSE, but who do not wish to take A level or AS level maths. This measure is designed to reward schools and colleges for supporting students to develop the advanced mathematical skills that are valued by universities and employers.

34
6.32. This measure shows the percentage of students who achieved GCSE maths A*-C (or equivalent) or grade 4 or above by the end of key stage 4, who go on to achieve an approved level 3 maths qualification. 6.33 Students are only included in this measure if they are also reported in headline attainment measures (i.e. they have also entered either an approved level 2 or level 3 qualification in the 16-18 phase). 6.34. The same list of qualification types used to assess prior attainment in the English and maths progress measure (see section 7) is also used in the level 3 maths measure. As such the vast majority of students will either be included in the maths progress measure (those without a GCSE A*-C or equivalent or without GCSE grades 9-4) or in this level 3 maths attainment measure (those with a GCSE A*-C or equivalent or with a GCSE grade 9-4). No students will be included in both measures. 6.35 Approved maths qualifications at level 3 are those that count in the TechBacc. These are flagged in guidance showing discount codes for all qualifications approved for performance tables: https://www.gov.uk/government/publications/16-to-19-qualifications-discount-codes-and-point-scores
Calculating the level 3 maths measure 6.36 In the most straightforward cases, the calculation simply divides the number of students who pass an approved level 3 maths qualification by the number of students in scope for the measure. 6.37 However, if a student already has an approved level 3 maths qualification (from either key stage 4 or an earlier 16-18 institution) that student remains in scope for the current institution only if they achieve another approved level 3 maths qualification. 6.38 This special treatment for students who already have an approved Level 3 maths qualification is to avoid penalising institutions where, for example, students do not repeat an AS Maths qualification gained at KS4 in the 16-18 phase. If a student changes institutions in the 16-18 phase in between AS and A level maths, the A level attainment will count positively towards the second institution’s performance in this measure.

35
English and maths 7.1. English and maths provide a vital foundation to enable students to progress to employment and further study. This measure will help the public hold schools and colleges to account for the progress of students in English and maths where they did not achieve at least a grade C or grade 4 or above at GCSE by the end of key stage 4.
How the measure works 7.2. The English and maths progress measure is made up of two distinct measures, one for maths and the other for English, and an individual student can be in scope for one, both or neither measure depending on their achievement in English and maths by the end of KS4. 7.3. Students in overall scope for each measure have their progress assessed by comparing their best grades by the end of KS4 to those achieved by the end of post-16 study11. 7.4. By aggregating student progress scores to give overall English and maths progress scores for each school and college, the effectiveness of the school or college can be measured and they can be held accountable.
Data sources 7.5. The primary source of information underpinning the English and maths progress measure is current and historical exam data sourced from Awarding Organisations. This data is used to determine students’ prior attainment (and so whether in scope of the measure), and the progress students make in the 16-18 phase. 7.6. In addition, funding data collected by the Education and Skills Funding Agency12 (ESFA) is used to determine whether any student is exempt from the requirement to study English and/or maths post-16 irrespective of their prior attainment. The English and maths accountability measure broadly aligns with the ESFA condition of funding rules which require students without prior attainment of GCSE A*-C or grades 9-4 in English and/or maths to be studying these subjects as part of their study programme in each academic year.
11 Note, because only a student’s best performance is considered, both during KS4 and in the 16-18 phase, formal discounting as implemented in attainment measures is not required here. 12 Data from the predecessor organisation, the Education Funding Agency (EFA), is also used

36
Overview of the measures
Calculating the English and maths progress measures 7.7. The following sections give more detail on what is involved when determining which students are in scope of the progress measure, and for those in scope, calculating both their level of prior attainment and progress made in the institution post-16.
Students included in the measures, exclusions and exemptions 7.8. Students are potentially in scope for either the English or maths progress measures if they did not achieve a GCSE grade A*-C or 9-4 or equivalent by the end of KS4 in that subject. 7.9. Students for whom no recorded prior achievement exists in exam records are excluded from the measure. 7.10. Exam results have been combined with ESFA funding data to identify students that schools and colleges have confirmed as exempt from the requirement to study English and maths in the 16-18 phase, in particular:
• students with learning difficulties and/or disabilities, who are assessed as not able to study either GCSE or stepping stone qualifications;
• students with overseas qualifications that are established as equivalent to GCSE
grade C or grade 4. 7.11. In addition, there are students for whom condition of funding rules do not apply. These includes students on study programmes under 150 hours, and students not on a study programme generally, for example those on an apprenticeship programme. From

37
2017 performance tables – where ESFA funding data confirms the condition of funding does not apply – these students will also be exempted. 7.12 Where an apprenticeship student has been recorded on the ILR or school census and have been included in the English and maths progress measure, Schools and colleges can submit a request to remove these students from the English and maths measure. 7.13 A student is considered enrolled on an apprenticeship programme in the reporting years if:
• They have a continuing or completed apprenticeship recorded in the ILR for two academic years; OR
• They have no ESFA core learning aim recorded in the ILR alongside their apprenticeship programme in the same academic year; OR
• They are recorded in the ILR on an apprenticeship programme at the same
provider as their ESFA learning aims.
Qualifications included in the measures: students in scope 7.14 ESFA guidance13 sets out the full list of qualification types equivalent to GCSE grade A*-C for the purpose of prior attainment. Principally these are qualifications in maths, English language and English literature from Ofqual approved GCSEs graded A*-C (and 9-4 for new reformed GCSEs), level 1/level 2 certificates grade A*-C, and some level 3 qualifications such as A/AS levels, International Baccalaureate including maths components, and Core Maths. 7.15 The guidance is used to inform a list of specific qualifications that the student’s exam record is checked against to determine whether the student is in scope for the English and maths progress measures. The check is made against all examination results achieved by the student up to and including key stage 4. 7.16 English literature GCSE counts for prior attainment; a student with either an English language or literature GCSE at A*-C or 9-4 by the end of key stage 4 is out of scope of the English progress measure. However, English literature GCSE does not count for progress.
Qualifications included in the measures: starting point 7.17 When assessing a student’s starting point for the calculation a similar process occurs as when assessing whether a student is in scope for the measure. However, the list of qualifications used to establish their level of prior attainment is wider, in particular including Basic Skills, Key Skills and Functional Skills. This is to recognise that whilst students may end key stage 4 with no GCSE passes in English and/or maths, achievement in other qualifications provide evidence of their level of ability when starting post-16 study.
13 ESFA guidance is published here.

38
Qualifications included in the measures: progress 7.18 During post-16 study, students for whom the condition of funding applies must be enrolled on an approved qualification. The list of qualifications approved for teaching under the condition of funding is maintained on the Learning Aims Reference Service (LARS). 7.19 This list of qualifications approved for teaching is used to determine which individual qualifications ‘count’ for progress in the measure. Any post-16 attainment in an English or maths qualification that is not approved for teaching as set out on LARS is not captured in the progress measure. 7.20 Qualifications are approved for a set period of time and are organised in LARS based on whether the qualification is approved in a given academic year. As such, the student’s exam record for a given academic year is compared to the list of approved qualifications for that academic year, and the student’s best result (in terms of performance points) is recorded and used when calculating progress. 7.21 Further details are given in Annex D around the expectation that students with a prior attainment grade D or grade 3 study GCSEs rather than stepping-stone and the treatment of unregulated level 1/ level 2 qualifications.
Calculating progress 7.22 In the most straightforward cases, the calculation of progress simply subtracts their performance post-16 from their prior attainment at KS4. For example:
• If an individual student moves from an E grade to a C grade they would receive a progress score of +2 as they have made two grades progress;
• If the student starts at grade E but achieves a grade F during post-16 they would
receive a progress score of -1.

39
7.23 We do not wish institutions to be disproportionately penalised where a student is unable to enter for an English or maths exam or where factors outside of an institution’s control lead to a bad result. This is achieved by applying a cap to the measure so that -1 grade is the maximum negative progress score applied to an individual student. Students not entered for any exams automatically score -1. For example:
• A student who enters with a D grade but achieves an F grade when they retake has their progress capped to -1 grade (rather than -2);
• A student who enters with an E grade but does not sit the exam has their
progress capped to -1 grade (rather than -3). 7.24 Applying this cap means that schools and colleges that take on students with poor motivation are treated fairly. This is important as the measure includes all students who do not have a C/4 grade or above in English and/or maths, in line with the condition of funding, regardless of whether or not they enter for an examination.
Points awarded for stepping stone qualifications 7.25 Stepping stone qualifications such as functional skills and free standing maths are taken into account when calculating the progress made by students, but do not attract as many points as good GCSE grades. Attainment of GCSE grades C/4 or above leads to the highest progress scores, and for students who already have a D/3 grade or above, re-taking a GCSE and improving their grade is the only way to attain a positive progress score.
Students attending multiple institutions post-16 The highest English and maths grade a student has achieved when they enter an institution is the baseline for the calculation. This may be the grade a student achieved at key stage 4 or a grade achieved with a different institution at an earlier stage of 16-18 study. This ensures the measure only counts the progress an institution makes with a student to improve their English and/or maths. A consequence is that an individual student might be in scope for the measure at the end of key stage 4 for their first institution attended – and progress in that institution will be included in performance tables – but if the student achieves the A*-C (or 9-4) standard in the first institution then the student is out-of-scope of the measure at their second institution. When a student attends multiple institutions post-16, requiring both their scope and starting point to be re-assessed, the only new exams taken into account after key stage 4 are those approved for teaching post-16 under the condition of funding, i.e. the qualifications listed on LARS online that ‘count’ for progress.

40
7.26 This is done by using a capped version of the “challenge points”14 from the performance points system, as illustrated in the table below which shows the points that will be used in 2018 and 2019 performance tables. 7.27 In 2017, English and maths results included reformed GCSEs graded on a 9-1 scale for the first time. The points these qualifications attract have been set to ensure that students are treated fairly whether they have results in either legacy or reformed GCSEs. 7.28 A comprehensive list of points to be used in 2018 and 2019 performance tables can be found here https://www.gov.uk/government/publications/16-to-18-english-and-maths-progress-measure-qualifications, a summary table of the points can be seen below: Current points: 2017, 2018 and 2019 tables
Points awarded
Grade achieved
9-1 GCSEs
Legacy GCSEs
Functional Skills
Free Standing maths ESOL AQA use
of maths
8 9 A* 7.7 8 7 7 A
6.3 6 6 B
5.7 5 5 4 C 4 3 D L2 L2 (all grades) L2 (all grades) A*/A/B/C 3 2 E
2.5 L1 L1 (A-C) L1 (D/M) D/E 2 F F
1.7 L1 (D) 1.5 L1 (pass) 1 1 G G
0.8 L1 (E) 0.4 Entry level Entry level
Note that:
a) Whilst a level 2 Functional Skill has 6 challenge points, these are capped at 4pts, equivalent to a GCSE D/3 grade to reward learners achieving a GCSE C/4 grade or above.
b) A level 1 Functional Skill has 2.5 challenge points, between a GCSE E and F grade. Other level 1 courses are capped at 2.5 points to align with the level 1 Functional Skill.
7.29 Applying equal capping to all the stepping stone qualifications ensures they have equal value in the measure, encouraging choice of stepping stone qualification that is correct for a student’s needs. Whilst stepping stone qualifications are typically smaller
14 Challenge points are points awarded for grades awarded in qualifications regardless of their size. More detail can be found in the guide to performance points.

41
than GCSEs, capped points do not factor in size, as all approved qualifications have sufficient breadth to meet the existing requirements of funding. 7.30 The measure only looks at the highest value outcome a student has attained in the institution attended. A student achieving a level 1 functional skill and a GCSE D/3 grade will be assigned 4 points in the calculation – the value of the GCSE D/3 grade. 7.31 Detailed worked examples, including what happens when students attend multiple institutions, are shown in Annex D. 7.32 As part of a review for summer 2019, the points applied to all qualifications used in the calculation of English and maths progress will change in 2020 performance tables. This follows wider consultation with stakeholders. The changes are:
- Increasing the relative progress points for attaining Functional Skills Level 1 and Level 2 qualifications so schools and colleges can further support students to take the level 2 qualification which is most appropriate for them.
- Reflecting the new GCSE grading system and making the points consistent by moving from the old 8-point scale to the new 9-point scale, with each grade worth one point.
- Recognising progress made between each entry level. Currently attainment of any entry level qualifications receives 0.4 progress points. From 2020 tables, Entry Level 1 will receive 0.25, Entry Level 2 0.5 and Entry Level 3 0.75 points.
Future points: 2020 performance tables
Points awarded
Grade achieved
9-1 GCSEs Legacy GCSEs
Functional Skills
Free Standing maths ESOL AQA use
of maths 9 9
8.5 A* 8 8 7 7 A 6 6
5.5 B 5 5 4 4 C
3.5 L2 3 3 D L2 (all grades) L2 (all grades) A*/A/B/C 2 2 E L1
1.75 L1 (A-C) L1 (D/M) D/E 1.5 F F
1.25 L1 (D) L1 (pass) 1 1 G G
0.8 L1 (E) 0.75 EL 3 EL 3 0.5 EL 2 EL 2
0.25 EL 1 EL 1

42
Calculating school or college progress 7.33 Once the student progress scores have been calculated, the average of all the student progress scores is then calculated within the school or college. 7.34 The figure below shows an example for a school or college with 5 student progress scores: Example
Student 1 English progress
Student 2 English progress
Student 3 English progress
Student 4 English progress
Student 5 English progress
School or college progress score for English
= +1.0
= +1.0
= +0.4
= -1.0
= -1.0
= +1.0 +1.0 +0.4 -1.0 -1.0
5
= +0.08 grades
7.35 From 2018, the headline English and maths progress performance measures (average progress) will be supplemented by contextual data showing the proportion of students in scope for either the English and/or maths measures that entered an approved qualification. This will highlight the percentage of students in an institution that study English and maths and take examinations in these subjects.
Students in scope for the measures, but studying level 3 qualifications
In addition, a student may meet the condition of funding through approved level 3 qualifications (Core maths at level 3, A or AS levels, the International Baccalaureate, OCR Maths for Engineering level 3 certificate and OCR Cambridge Pre-U maths). The points awarded for approved level 3 qualifications are capped at 8 pts in 2018 and 2019 tables.

43
Retention 8.1. As the participation age has been increased to 18, it is increasingly important that all young people are given suitable education and training opportunities that they see through to completion. We want schools and colleges to ensure that students study courses that match their ability and ambition and that they remain motivated and engaged to complete their studies. The retention measure shows the percentage of students who get to the end of the programme of study that they enrolled on at a school or college.
How the measure works
8.2. The retention measure shows the percentage of students who are retained to the end of the ‘core aim’ (or main learning aim) of their study programme at a school or college. The retention measure shows separate values for:
a) level 3 academic programmes (including A levels)
b) A level programmes
c) level 3 applied general programmes
d) level 3 tech level programmes
e) level 2 technical certificates programmes
8.3. In the 2016 performance tables, the retention measure only applied to level 3 qualifications. The 2017 performance tables extended the coverage of the retention measure to include level 2 vocational programmes (including technical certificates); note, from 2019 tables only technical certificate qualifications are reported at level 2. 8.4. A student’s programme is defined based on their core aim. Withdrawing from supporting aims, such as GCSEs, will not stop them being counted as retained on this measure. Similarly an A level student only needs to complete one A level to be counted as retained15. 8.5. Students are counted as retained if they are recorded as having “completed the learning activities leading to the learning aim” on the Learning Aim Status Field of the School Census or the Completion Status Field of the ILR. 8.6. Some programmes will be more than one-year long. For example, an International Baccalaureate is typically studied over two years. For a student to be counted as retained they must complete all learning activities for an aim. 8.7. Since the retention measure is calculated at student level it is not affected by the total number of subjects a student takes, or whether they only complete a subset of these. Enrolling a student for additional AS level subjects alongside A levels, or
15 The A level that is completed must be in a subject other than General Studies or Critical Thinking.

44
entering a student for AS level exams as well as A level exams in the same subject will not affect the retention calculation. 8.8. In the majority of cases, the core aim will be at least the size of 1 A level or 4 GCSEs. However, where students are solely taking AS levels they can be counted as retained in year 12 provided they complete at least one AS level. We publish separately supporting information on the proportion of level 3 students who return in year 13 (see from here). 8.9. Some students may take multiple programmes that are one academic year in length. In these cases, they need to have completed in any year, for level 3 programmes, an aim equivalent to the size of 1 A Level and for level 2 programmes an aim equivalent in size to 4 GCSEs. Or if they have no aims of this size, an aim of A level size 0.5 or GCSE size 2, for level 3 and level 2 programmes respectively, again in any year. A range of examples are shown in Annex E.
Exceptions to the retention measure
8.10. Students who are not eligible for funding because they withdrew during the “qualifying period” at the start of their programme are not included in the retention measure. For programmes longer than 24 weeks the qualifying period is six weeks, for programmes that are 2 to 24 weeks the qualifying period is two weeks. All withdrawals from a programme will be treated in the same way in the measure methodology regardless of whether they are related to educational reasons or not. This aligns with the funding methodology. 8.11. The following aims are not included in the retention measure:
• where a student’s core aim is less than 0.5 in size
• where a student’s core aim has a completion status of ‘continuing’
• where the planned end date of a student’s core aim is after the current reporting year and the student is academic age 18 in the reporting year
8.12. Independent schools are not included in the retention measure as learning aims data are not available for these schools.
Selection of the core aim
8.13. The majority of students will only have one core aim for their time in 16-18 education. However, any students who attend multiple institutions will have one core aim for each institution attended. 8.14. The process of selecting a student’s core aim depends on the combination of aims that a student is studying. A student can be studying either all academic aims, all vocational aims or a mixture of academic and vocational aims. 8.15. When a student has a mix of level 2 and level 3 aims, the level of their aims is largely ignored in selecting the core aim as selection will continue to be done on the

45
status of the aim. The level of the aim only comes into consideration where a student has multiple aims of the same size with the same status.
All academic aims or academic aims and level 2 vocational aims only
8.16. If a student is studying the International Baccalaureate, this aim is selected as their core aim due to the large size of this type of qualification. Otherwise, an aim of size 1 A level or 4 GCSEs or above is selected as their core aim, with preference being given to any aim recorded as ‘completed’. If a student has no completed aims, then an aim recorded as ‘continuing’ is selected. If a student has no completed or continuing aims, then an aim recorded as ‘withdrawn’ or ‘transferred’ is selected as their core aim.
Does the student have an International
Baccalaureate aim?
Select as core aim
Does the student have any aims of size 1 A
level/4 GCSEs or above?
Select size 1+ aim in following order:
- Completed- Continuing
- Transferred /Withdrawn
Does the student have any aims of size 0.5 A
level/2 GCSEs or above?
Out of Scope
Select size 0.5 aim in following order:
- Completed- Continuing
- Transferred /Withdrawn
No
Yes
No
No
Yes
Yes
8.17. If a student does not have any aims of size 1 A level or 4 GCSEs or above, the above process is followed for aims of size 0.5 A levels or 2 GCSEs or above. 8.18. If a student has multiple aims with the same status, the following criteria are used (in order) to select a single core aim:
• A level or AS level
• aim flagged as a ‘core aim’ by the school or college
• qualification included in the performance tables
• largest size (size of level 2 aims is divided by 4 before comparing to level 3 aims)
• level 3 over level 2

46
All vocational aims
8.19. If a student has an aim which has been flagged by their school or college as being their ‘core aim’ (for funding purposes), it is selected for the retention measure. If a student has no aims flagged as a ‘core aim’, then any aim equivalent in size to 1 A level (level 3 programmes) or 4 GCSEs (level 2 programmes) or above is selected as their core aim, with preference being given to any aim recorded as ‘completed’. If a student has no completed aims, then any aim recorded as ‘continuing’ is selected. If a student has no completed or continuing aims, then any aim recorded as ‘withdrawn’ or ‘transferred’ is selected as their core aim. If a student does not have any aims of size 1 A level or 4 GCSEs or above, the process below is followed for aims of size 0.5 A levels or 2 GCSEs or above.
Does the student have an aim flagged as a ‘core aim’ by their
provider?
Select as core aim
Does the student have any aims of size 1 A
level/4 GCSEs or above?
Select size 1+ aim in following order:
- Completed- Continuing
- Transferred /Withdrawn
Does the student have any aims of size 0.5 A
level/2 GCSEs or above?
Out of Scope
Select size 0.5 aim in following order:
- Completed- Continuing
- Transferred /Withdrawn
No
Yes
No
No
Yes
Yes
8.20. If a student has multiple aims with the same status, the following criteria are used (in order) to select a single core aim:
• qualification included in the performance tables
• aim of the same type as the majority of the student’s attainment
• largest size (size of level 2 aims is divided by 4 before comparing to level 3 aims)
• level 3 over level 2
school/college?

47
Mixture of academic and vocational aims
8.21 If a student has a tech level or applied general aim which has been flagged by their school or college as being their ‘core aim’ it is selected for the retention measure. If not and they are studying the International Baccalaureate, then this aim is selected as their core aim. If a student does not meet these first two criteria, then any aim of size equivalent to 1 A level (level 3 programmes) or 4 GCSEs (level 2 programmes) or above is selected as their core aim, with preference being given to any aim recorded as ‘completed’. If a student has no completed aims, then any aim recorded as ‘continuing’ is selected. If a student has no completed or continuing aims, then any aim recorded as ‘withdrawn’ or ‘transferred’ is selected as their core aim. If a student does not have any aims of size 1 A level or 4 GCSEs or above, the process below is followed for aims of size 0.5 A levels or 2 GCSEs or above.
Does the student have a Tech Level or Applied General aim flagged as
a ‘core aim’ by their provider?
Select as core aim
Does the student have any aims of size 1 A
level/4 GCSEs or above?
Select size 1+ aim in following order:
- Completed- Continuing
- Transferred /Withdrawn
Does the student have any aims of size 0.5 A
level/2 GCSEs or above?
Out of Scope
Select size 0.5 aim in following order:
- Completed- Continuing
- Transferred /Withdrawn
No
Yes
No
No
Yes
Yes
Does the student have an International
Baccalaureate aim?
No
Select as core aim
Yes
8.22. If a student has multiple aims with the same status, the following criteria are used (in order) to select a single core aim:
school/college

48
• qualification included in the performance tables
• aim of the same type as the majority of the student’s attainment
• A level or AS level if the majority of the student’s attainment is academic
• largest size (size of level 2 aims is divided by 4 before comparing to level 3 aims)
• level 3 over level 2
Supporting retention measures
8.23. Alongside the headline retention measure there are two supporting retention measures published in the performance tables from 2017.
Returned and retained for a second year
8.24. This supporting measure shows the percentage of level 3 students who return to the same school or college for a second year of study and are retained in their second year. It highlights cases where, although students are retained, they have only completed, for example, AS levels and do not return for a second year of study. 8.25. Students with a level 3 core aim are in scope for the measure, regardless of whether they were retained in year 12. It is shown separately as four cohorts:
a) level 3 academic programmes (including A levels)
b) A level programmes
c) level 3 applied general programmes
d) level 3 tech level programmes 8.26. The following students are excluded:
• Students with a level 2 core aim (since many level 2 programmes are not expected to be two years long)
• Students who are academic age 18 in their first year in the institution (since they would be out of scope for inclusion in performance tables in their second year)
• Students who achieve a sizeable qualification (their level 3 qualifications of size 1 or above sum to 2 or more) in their first year in the institution (since they have already completed what is expected)
8.27. To be counted as returned and retained for a second year, a student must:
• be recorded as completing their selected core aim which is at least size 1 and in scope for inclusion in the performance tables
• have been attending the institution for at least two academic years
• have completed a level 3 qualification of at least size 1 in their second (or third) year at the institution (this may be the selected core aim or another aim).

49
8.28. A student is deemed to have been attending an institution for at least two academic years if they meet any of the following conditions:
• they have aims at that institution in three academic years
• they have aims at that institution in two academic years and have been at that institution for at least 602 days (based on the start and end dates of all their aims at that institution)
• they have aims at that institution in two academic years; they left in May, June or July and have been at that institution for at least 480 days.
Retained and assessed 8.29. This supporting measure shows the percentage of students who are retained to the end of their course and are assessed. This allows monitoring of whether students are effectively completing their study rather than merely being enrolled at an institution for a certain period of time. 8.30. A student is considered retained and assessed16 as long as they have an exam result that matches on the level of and is at least the same size as the core aim qualification selected for the headline retention measure. For example, if a student’s core aim is an A level in Biology with size of 1, we do not require it to match to a Biology A level but just one of the same size. Similarly, we also do not require the qualification type of the result to match the aim as long as it is of the same size. For example, a student with a tech level aim of size 1 is considered a match to an applied general result of size 1. A range of examples are shown in Annex E. 8.31. The retained and assessed percentage includes the same students as the main retention measure. It shows separately as five cohorts:
• level 3 academic programmes (including A levels)
• A level programmes
• level 3 applied general programmes
• level 3 tech levels
• level 2 technical certificate programmes
16 Students that have been assessed but are recorded as not retained in the headline retention measure will not be included. Students need to be both retained and assessed to be included in the retained and assessed supporting measure.

50
Destinations 9.1 Schools and colleges should be supporting and preparing their students for future education, training and employment. Including destination information in performance tables broadens the information available to the public and gives schools and colleges the opportunity to demonstrate other aspects of their performance. 9.2 Student destinations have been a headline accountability measure for students who entered level 3 qualifications at 16 to 18 since 2016 when, following the inclusion of new information on employment and benefits, we determined that the statistics were of sufficient quality to be included in performance tables as a headline measure. This reflects the importance of this indicator for demonstrating an institution’s success in helping students make a successful transition to the next stage.
Changes to destination measures in 2019
Cohort expanded to students of level 2 qualifications and below 9.3 In 2018 destinations were only reported for students of approved level 3 qualifications (such as A levels, applied general qualifications and tech levels). In October 2019 we have extended the destination measures cohort to include approved and unapproved qualifications at level 3, level 2, level 1, entry level and other students. This will help to ensure that schools and colleges are held to account for the destinations of all their 16 to 18 students. 9.4 Destination results will be broken down by level so that schools and colleges with a high proportion of level 2 and below students are not unfairly compared against those that primarily cater to level 3 students. Where a student has studied a mixture of qualification types at their allocated institution the level they are reported against will be determined by the size of the exams they have entered at each level. Unapproved qualifications are however only taken into account when the size of approved qualifications for that student totals to less than half an A level (at level 3) or one GCSE (at level 2). In the event of a tie, the higher level is chosen.
Flexible destination year methodology 9.5 In 2018 destinations were only reported for students that were allocated to their school or college in the same year as which they were deemed to have reached the end of 16 to 18 study. This covered 95% of level 3 students. At level 2 and below however a significant proportion (~20%) of the cohort had not been allocated to their final school or college in the year in which they were deemed to have reached the end of 16 to 18 study (for example, by having reached the age of 18 but without having completed qualifications equivalent in size to two A levels). Rather than continue to exclude these students from destination measures on the grounds that their destination year is too far removed from the school or college’s influence, they will now be included by adopting a flexible destination year methodology.

51
9.6 The figure below shows the seven possible attendance patterns over the 16 to 18 study period for the 2016/17 cohort that will be reported on in October 2019. Students that were excluded last year from destination measures (those in groups 3, 6 and 7 on the left side of the figure) will this year be included but with the destination activity taken from an earlier year than the majority of the cohort (right hand side of figure). While the destinations reported will no longer all take place in the same year, it allows more students to be included, it more accurately reflects the influence of the school or college in achieving that destination (important for accountability purposes), and it measures the destinations at a more meaningful point in time than if 2017/18 was uniformly used for all students.
Further education destination level breakdown 9.7 The further education destination will now feature a breakdown showing the level studied in the destination year. This is in order to recognise and encourage progression to higher level study.
How the headline measure works 9.8 Destination measures show the percentage of students staying in education or employment for at least two terms in the year after their last allocation to a school or college at 16 to 18. The data in the October 2019 statistical release and 2019 performance tables will report on students who were deemed to have reached the end of 16 to 18 study in the 2016/17 academic year and identifies their education and/or employment destinations in October to March of their destination year, or any six months in the year for apprenticeships. 9.9 The destination measures cohort now aims for fuller coverage by including young people aged 16, 17 or 18 who were deemed to be at the end of 16 to 18 study and had been allocated to a school or college, regardless of qualifications entered. 9.10 To be included in the headline measure, young people have to be recorded as having participation in:
• 6 consecutive months at any point in the year (from August to July) in an apprenticeship
• all of the first two terms of the academic year (October to March) at one or more education destinations
• or for 5 of the 6 months in employment

52
Young people with a combination of education and employment, or apprenticeships, meeting the sustained participation criteria are also included in the measure. 9.11 Data used to compile the measure come from the National Pupil Database (NPD) and Longitudinal Education Outcomes (LEO) datasets with individual student level data matched to a range of administrative sources on education participation, employment records and claims of out of work benefits. 9.12 A hierarchical series of rules is used to determine whether students meet the criteria for sustained participation and the specific destinations they are reported under if more than one definition is met.
More information on the methodology and data sources used is available in Annex F.
Start
Did the student have a (non-apprenticeship) study aim at level 3
or below at a university, HE alternative provider or FE college
which was sustained from October to March?
Staying in employment for
two terms
Does the student have employment activity in 5 out
of 6 months (Oct to Mar); combined 6 months between
the education and employment datasets; or a
self-employment claim for the tax year?
No
Does the student have any partipation in education or
employment datasets (which didn't meet the 6 month
requirements)? Or did they claim out-of-work benefits in
the year?
No
Not staying in education or employment
Is student in an education dataset (with activity in each of the 6 months Oct to Mar)?
Yes
No No
Staying in education for two
terms
Further education (level 3 and below)
Yes
Higher education (level 4 or above)
Did the student have a (non-apprenticeship) study aim at level 4
or above at a university, HE alternative provider or FE college
which was sustained from October to March?
No Destination unknown
Did the student have an apprenticeship aim record
on the ILR for 6 consecutive months (August to July)?
Yes
No
Staying in an apprenticeship
for 6 months
For example: ▪ continuing in a non-standard setting for adult education e.g. school, special school or sixth-form college▪ completing 6 months with a mixture of FE & HE courses.▪ taking non-designated courses at an HE alternative provider
Other education
Yes
Yes
For example:▪ NEET and not claiming benefits▪ living, working or studying overseas▪ activity other than work or study in UK▪ attending Scottish, Welsh or Northern Irish FE college
Counted in the headline measure:
staying in education or employment for at least two terms
Yes
Not counted in the headline measure

53
Data sources 9.13 We are continuing to work with other government departments and with analysts developing the Longitudinal Education Outcomes dataset to improve the scope of activity that can be captured. Strands under development include increasing the range of benefits included and the quality of the employment information, as well as linking to information on Scottish and Welsh schools and colleges. We are hopeful that this will increase our coverage beyond 97% in future years and more fairly reflect the outcomes of certain institutions.
Supporting information 9.14 We publish a range of supporting information on this measure. This includes further breakdowns of the data in school and college performance tables showing more detail on destinations: for example, further education colleges and higher education institutions, apprenticeships, or employment, as well as information on those not sustaining participation in education or employment, and those with no activity captured in our data. 9.15 Further information is published in the key stage 4 & key stage 5 destinations statistical release, showing national trends and characteristics data, such as special educational needs, ethnicity, disadvantage and gender. A detailed technical note is available from this page.
New measure: Progression to higher education or training 9.16 We have developed a new “Progression to higher education or training” destination measure which will be introduced at an institutional level alongside the standard measure in the October 2019 publication. The aim of this measure is to encourage schools and colleges to prepare their students for academic, technical and vocational study at level 4 and above. 9.17 From 2019 performance tables will show the percentage of Level 3 students from each school or college that continue to degrees, higher technical courses and higher apprenticeships as well as a score that shows whether this demonstrates good progress based on the students’ prior attainment and qualification type. Degrees, higher technical courses and higher apprenticeships will be treated equally as level 4+ destinations. The Higher Education breakdowns from the original measure will be retained but moved in to this new level 4+ measure.
Students in scope and progression criteria 9.18 The cohort for the new measure will consist only of level 3 students on the grounds that students of level 2 courses and below are not expected to progress directly to a level 4 or higher destination. Students of academic qualifications (such as A levels), applied general qualifications, tech levels and unapproved level 3 qualifications will be in scope. 9.19 A student will be deemed to have successfully progressed to a level 4 or higher destination if they sustain a level 4 or higher course in an HE or FE institution, a level 4+

54
apprenticeship, or a mixture of the two for at least six months within the two year period following their allocation to a school or college at 16 to 18. This measure will use a two-year destination window rather than the standard measure’s one-year window to allow for gap years and similar breaks in study. This means that the cohort will be drawn from those level 3 students that were deemed to be at the end of 16 to 18 study in 2015/16 (c.f. 2016/17 for this year’s standard destination measures).
How the new measure works 9.20 The entire level 3 cohort is first grouped according to their qualification type and their prior attainment at KS4. The prior attainment for each student follows the same methodology as is used for the level 3 value-added measure (average GCSE score for students of academic qualifications; average GCSE and vocational equivalents score for students of other qualification types) but students are then placed into deciles. Qualification type for each student is decided using the same methodology as the standard destination measure (using the size of qualifications entered), however students of academic and applied general qualifications are grouped together as they have the same expectation for progression to higher education or training. 9.21 Within each combination of qualification type and prior attainment decile the number of students that progress to a level 4 or higher destination is divided by the size of the group to obtain the national average for that type of student. Each student then scores +1 if they progress to level 4+, 0 otherwise, and the national expectation for that student is subtracted. For example, an A level student in the 9th decile might have an 85% probability of progressing to level 4+ according to the national average. If that student does progress then they score 1 - 0.85 = +0.15. If they do not progress then they score 0 – 0.85 = -0.85. These individual scores are then aggregated for the school or college and the result multiplied by 100 to convert it into percentage points. Thus a value-added score of +12 represents a 12 percentage point increase on progression to level 4+ when compared to the national average for that school or college’s intake of students. 9.22 Level 4+ education or training must be sustained for six consecutive months at any point within the two-year destination window to count as a positive destination. When a sustained period of activity begins in or extends into the second year of the window, that second year will be used to determine the reported destination type such as whether the education or training was an apprenticeship/level 4 or 5 course/degree, and whether Top third/Russell group/Oxbridge flags should be applied. Otherwise the first year will be used. 9.23 For each state-funded mainstream school or college with a cohort at 16-18, we will report the level 3 cohort size, the percentage that progressed to a level 4+ destination, the national comparator percentage, the resulting value-added score, and provide a banding that puts the score in context. We will additionally report these items separately for the different qualification groups, however value-added scores will not be reported when the relevant group size is less than 16 students. We will also show breakdowns of the destination type (apprenticeship, level 4 or 5 course, degree) and destination provider (top third, Russell group, Oxbridge).

55
Wider qualification reform
English and maths 10.1. We are putting English and maths right at the heart of our education system. Reformed GCSEs in English and maths, taught from September 2015, are both more stretching at the top, and more practical than legacy GCSEs. Building on the Wolf Review’s recommendations, 16-19 study programmes require students without at least a C/4 in English and maths GCSE by age 16 to keep on working towards them. 10.2. From September 2014, these requirements for English and maths became a condition of 16 to 19 funding and with effect from August 2015, the funding condition was amended so full-time 16 to 19 students with prior attainment of grade D/3 in English and/or maths will take GCSE, rather than any other qualification in these subjects. These changes build on wider reforms under this government to put academic and vocational education on an equal footing. They will create a culture in which the majority of young people routinely leave further education with good GCSEs in English and maths.
A level reforms 10.3. We are reforming A levels to match the best education systems in the world and to keep pace with universities and employers’ demands. Evidence from higher education shows that new undergraduates lack some of the skills essential for undergraduate learning and that modular A levels have contributed to this. A levels are becoming linear (exams at the end of two years), allowing more time for teaching and learning. 10.4. As the first new linear A levels were introduced from 2015, the AS is entirely decoupled from the A level, ending the routine, automatic external assessment of students at the end of year 12 that places unnecessary burdens on students and teachers. The new A levels have been designed to allow awarding organisations to develop stand-alone AS qualifications taught over one or two years that can be co-taught with the A level. It will continue to be possible for students to take an AS in some subjects before deciding which to continue onto A level. Schools and colleges should support their students to decide what qualification to take. 10.5. Ofqual have decided that existing or legacy AS and A levels (this includes applied A levels) offered in subjects that are not being reformed for 2017 are withdrawn from September 2017. This means that the majority of unreformed qualifications were assessed for the last time in summer 201817. The last cohort of students taking these qualifications began their studies in September 2016. 10.6. AS and A levels in applied art and design, and AS and A levels in applied business were entered for last time in 2017 and can only be offered by schools or colleges previously delivering them. There was no resit opportunity in 2018. 17 Re-sits are only be available to students who have taken the qualification previously, or had a good reason not to have taken it when planned (such as illness). Further information can be found here.https://www.gov.uk/guidance/timings-for-the-withdrawal-of-legacy-gcses-as-and-a-levels

56
Reform of vocational qualifications 10.7. We have taken action to reform vocational qualifications to ensure that young people know which qualifications are valued by employers and promote progression. By only recognising high-value vocational qualifications in performance tables, these reforms are encouraging schools and colleges to offer vocational qualifications that genuinely support progression to skilled employment and/or higher education. To be included in performance tables, qualifications must demonstrate tough new characteristics, set out in Technical Guidance for Awarding Organisations. An annual process identifies the qualifications approved for inclusion in performance tables. 10.8. There are three vocational options for 16-18 year olds:
a) Applied general qualifications are rigorous advanced (level 3) qualifications that equip students with transferable knowledge and skills. Taught from September 2014, they are for post-16 students wanting to continue their education through applied learning. They fulfil entry requirements for a range of higher education courses, either by meeting entry requirements in their own right or being accepted alongside and by adding value to other qualifications at the same level.
b) Tech levels are rigorous advanced (level 3) technical qualifications, on a par with A levels and recognised by employers. Taught from September 2014, they equip students with specialist knowledge and skills, enabling entry to an Apprenticeship, other skilled employment or a technical degree. In some cases, they provide a ‘licence to practise’ or exemption from professional exams. Tech levels are one of the components of the TechBacc measure, which recognises the highest level of technical training. For courses taught from September 2014 it will measure the achievement of students taking advanced (level 3) programmes which include a tech level, Level 3 maths and an Extended Project Qualification.
c) Technical certificates at level 2 provide students aged 16 to 18 with a route into a skilled trade or occupation, where employers recognise entry at this level (most construction trades, care work and hairdressing, for example). They also provide access to tech levels. Taught from September 2015, they require public backing from employers, giving students’ confidence that the qualification they are taking is genuinely valued. Like tech levels, they will offer students the chance to acquire the skills and expertise needed for the real economy – and provide a passport to a good job or a great apprenticeship.
10.9 From 2018 onwards, level 3 technical qualifications must meet the full set of characteristic requirements in order to count in performance tables. These include criteria relating to size, content and assessment, including a requirement that a proportion of the qualification’s content is subject to external assessment. Prior to 2018, qualifications could count in performance tables if they met interim requirements. From 2019 onwards, full requirements also apply to level 2 technical certificates.

57
Independent, special schools, and multi-academy trusts
Independent schools 11.1. The completion and attainment and retention measures are not calculated for independent schools. This is because the Department does not have access to the relevant data. 11.2. Disadvantaged measures are not calculated for independent schools. 11.3. For the attainment measures, level 3 value added, and English & maths progress measures information is sourced from awarding bodies. This allows us to calculate these headline measures for independent schools. 11.4. Destination Measures for independent schools are not included in performance tables due to more limited information on students causing low coverage. They continue to be produced in the statistical release.
Special schools 11.5. Students who need more specialised teaching and facilities may go to special schools. Special schools with sixth form students can currently choose to have their results included in the 16-18 performance tables; however, this policy is under review. Some special schools will have no results published for their students because they do not take the qualifications reported in these tables.
Multi-academy trusts 11.6 Schools in multi-academy trusts (MATs) include an expanding proportion of the students in the 16-18 phase. It is therefore increasingly important that all young people attending a school within these trusts are confident of that trust’s effectiveness, and from a delivery standpoint, regional school commissioners (RSCs) remain informed of MAT performance and can support MATs to focus on 16-18 provision where appropriate. 11.7 Following consultation with MAT representatives, it has been agreed that from 2018 performance tables four 16-18 MAT progress measures, a reflection of the L3VA progress measure at school level, will be published as part of performance tables as follows: Progress scores for academic quals (including A levels) – all students Progress scores for academic quals (including A levels) – disadvantage students only Progress scores for applied general quals – all students Progress scores for applied general quals – disadvantage students only

58
11.8 In keeping with existing key stage 2 and key stage 4 methodology, we will report on MATs if they have had three or more schools that have been with the MAT for at least three academic years. Special schools and alternative provision will not be included. 11.9 We published 2018 MAT performance tables for 16-18 students for the first time in March 2019, and these will be updated annually.

59
Apprenticeship reporting in performance tables 12.1 From 2018 performance tables include qualification achievement rates (QARs) for 16-18 year old apprenticeships. This data is currently published in National Achievement Rate Tables (or NARTs), updated annually at the following link: https://www.gov.uk/government/collections/sfa-national-success-rates-tables. 12.2 In March 2019, the apprenticeship QAR data was additionally reported in performance tables showing data for 2017/18, and will continue to be updated annually. Essentially the QAR shows the proportion of apprenticeship framework aims in an institution that were achieved, calculated as the number achieved in an institution divided by the number started for the relevant year. The relevant year is defined as the ‘Hybrid End Year’, which is the later of the Expected End Year, Actual End Year or Reporting Year of a framework. 12.3 Students who start an apprenticeship framework but transfer to another qualification within the same institution are excluded from the calculation. Full details of the 2018/19 methodology will be available in documents accessible through both the NARTs and 2019 performance tables. 12.4 Note there are two significant differences from the QAR and other accountability measures reported in performance tables. Firstly, QAR reporting is not subject to allocation rules (see section 2.1). This means that in the QARs a student could be reported against more than one institution in a given academic year (in this case if they started apprenticeship aims in different institutions). Secondly, the cohort of students in the apprenticeship QAR are academic age 16-18 when they started the apprenticeship framework, so unlike other performance table measures could be aged 19+ when they achieved (or did not achieve) the apprenticeship framework.

60
Future plans for performance tables and timescales for implementation
Multi-site college reporting 13.1 Currently in performance tables, we report colleges and college groups at the legal entity which is important for accountability. However, the sector has been changing with more colleges expanding and merging into large college groups where the legal entity may feel far removed from the site where education is delivered. 13.2 Following public consultation college groups will soon also be reported in their constituent parts i.e. colleges and delivery sites. This is to aid transparency for the students and local accountability. It will supplement existing reporting and not replace it: https://www.gov.uk/government/consultations/performance-reporting-fe-college-groups-and-multi-site-colleges 13.3 A pilot is being rolled out at large delivery sites that are comparable to freestanding colleges i.e. that offer a broad range of provision to their local community with a threshold of a minimum of 1,000 learners and 15km from other delivery sites which are part of the same college group. 13.4 Eligible college groups will allocate students to a college/delivery site in the Individual Learner Record (ILR) where they are principally based. If the student is allocated to that college group based on current allocation principles (Annex A), performance tables will also be disaggregated to the colleges and delivery sites eligible for reporting within the college group. 13.5 Shadow data will be created based on data from 2020 and 2021 performance table cohorts, ahead of the first planned publication of disaggregated data of college groups as part of 2022 performance tables.
T Level accountability measures
Background
13.6 T Levels are new courses being rolled out nationally from September 2020, which are equivalent to 3 A levels. These 2-year courses have been developed in collaboration with employers and business so that the content meets the needs of industry and prepares students for work.
13.7 T Levels will become one of the main choices for students after GCSE alongside A levels for students who wish to continue academic education, and apprenticeships for students who wish to learn a specific occupation ‘on the job’.
13.8 A form of study programme, T Levels will comprise:
• A technical qualification (TQ) which consist of core theory and specialist skills and knowledge for a particular occupation or career

61
• An industry placement with an employer • A minimum standard in maths and English if these have not already been
achieved • Mandatory additional requirements for specific professions
13.9 Students who pass all the elements of their T Level will get a national recognised certificate showing an overall grade of pass, merit, distinction, or distinction*. The details of what students have achieved (grades for the core and occupational specialism) will also be included.
13.10 Each T level will be a ‘pathway’ under a specific T Level ‘route’; for example, the Design, surveying and planning T Level pathway will be part of the Construction route.
13.11 Following a public consultation, the government response set out at a high-level five headline accountability measures that will be developed and published as part of performance tables:
• Attainment
• Completion
• English and maths
• Progress
• Destinations
Attainment 13.12 The attainment measure will show a school or college’s attainment in the TQ element of the T Level. The attainment measure will show the average grade that students attain, and builds on the average points score per entry data (expressed as a grade) that is currently published in performance tables.
How the new measure will work 13.13 Average points score per entry will be expressed as a grade. Separate average grades will be shown for the different TQ components: the core theory (‘Core’), and the specialist skills for a particular occupation or career (‘Occupational Specialism’ or OS).
13.14 Withdrawals to L3 apprenticeships or above, or alternative educational provision (A levels, tech levels) will not be reported as a fail. Outcomes will be reported where a student has entered for an examination in either a Core or OS qualification, irrespective of whether the student completes the overall T Level. This means the treatment of students taking TQ components as part of a T Level in the headline attainment measure is the same as a student taking A levels instead as part of their study programme.
Completion 13.15 It is important to provide an indicator of schools’ and colleges’ overall completion rate of T Levels, which parents and employers can easily understand and use to compare

62
schools and colleges. T Levels are a significant undertaking and bring together a variety of components – as such, we want schools and colleges to ensure that students leave 16-18 study with a valuable T Level qualification.
13.16 The completion measure will show the proportion of students who complete all required components of their T Level study programme.
How the new measure will work 13.17 Students who are recorded as enrolled on a T Level study programme, or have component aims (in the ILR or School Census), or results from TQ components in Awarding Organisation data are in scope for this measure.
13.18 A student is considered to have completed a T Level if they achieve an overall passing grade in a T Level pathway. In practice this will require that:
• They pass the TQ (core and OS components) • They complete the industry placement • They have a minimum standard in English and maths, subject to individual T Level
requirements • They are recorded as having completed any additional other requirements for that
T Level pathway.
13.19 Students who withdraw from a T Level study programme to study a level 3 apprenticeship will be excluded from the measure. However, those who withdraw to study a level 2 apprenticeship will remain in scope.
13.20 Students that transfer from a T Level, and are assessed against approved level 3 qualifications equivalent to least 3 A levels, will be excluded from the calculation (note, this could be a combination of A level, applied general or tech level qualifications).
13.21 A student will only count once toward the overall completion rate in a school or college. Where a student has an incomplete and complete T Level (perhaps because they transferred between different T Level routes or pathways), the complete T level will take precedence, and the student will be counted as complete. Where a student has two incomplete T Levels, even if they pass components, or complete elements from both, without on overall passing grade for a T Level pathway they remain incomplete for the accountability measure overall.
English & maths 13.22 The English and maths progress measure for T Level students is expected to retain the same basic methodology as the current English and maths progress measure. While, for funding purposes, the condition of funding does not apply to T Level study programmes, there is an exit requirement that a student must have achieved English and maths at level 2. For T Level students this can be either a GCSE or Functional Skills qualification at level 2.

63
13.23. Regardless of T Level pathway or route taken, the best result will be used to calculate progress, using the same list of approved qualifications and points as the existing English and maths headline measure.
Progress (value added) 13.24 The T Level consultation document indicated respondents supported a progress measure, but with reservations about the possibility of developing a value-added measure for technical qualifications given that historically GCSEs are not a good predictor of outcomes for technical qualifications. Until we have the results from the first T Level cohorts, the approach set out below should be regarded as indicative of how a progress measure would work.
13.25 The T Level-specific progress measure will show the progress students make between key stage 4 and the TQ components of the T Level (core and occupational specialism) for a school or college. Students will be compared with other students studying the same components nationally before being aggregated to give an overall score for a school or college. This score will be expressed as a proportion of a grade above or below the national average in each component type.
How the new measure will work
13.26 As now, for all students prior attainment will be their average attainment at key stage 4. We expect to use students’ prior attainment in all qualifications achieved at key stage 4 (in common with value-added for the current applied general cohort).
13.27 As in the headline attainment measure, there is no penalty if a student withdraws or transfers to do a level 2 apprenticeship, alternative qualifications such as A levels, or another destination.
13.28 Completion of the overall T Level programme will not affect whether a learner’s components are included in the measure.
13.29 The core and occupational specialism components included in the VA measure will depend on the number of students and schools/colleges offering them nationally. As now, we expect to have a lower limit of at least 16 students across five schools or colleges for a particular component qualification to be in scope for the value added measure.
Tech level value added progress measure 13.30 Historically we have not had a value added progress measure for tech levels due to a weak relationship between students’ average key stage 4 results and their tech level outcomes. We have re-tested this relationship following reforms to approved L3 vocational qualifications in 2018, and observed that the relationship has strengthened sufficiently to support a robust value added methodology. 13.31 In spring 2020 we will share shadow measures to demonstrate a tech level value added progress measure. This will be calculated – separately – for two cohorts of tech level students previously reported in 2018 and 2019 performance tables (i.e. as part of

64
testing we will retrospectively calculate two years of a value-added progress measure). The underlying methodology will mirror that for the existing value added measure for the existing applied general cohort (Section 5, Annex B). The intention is for a value added measure to replace reporting of completion and attainment in 2020 performance tables.
Timescales for implementation 13.32 The proposed timeline covers the publication of publication of statistics, and the sharing of 16 to 18 shadow data (see table). The aim is to fully test out new methodologies and prepare the sector for full implement of new accountability cohorts (e.g. T levels) or measures (e.g. tech level value added). 13.33 There are two types of data release described within the timetable:
• Pilot measures – non-final methodology shared with schools and colleges only as ‘shadow data’. The methodology may not exactly replicate what is later applied in performance tables. The outputs are shared with individual schools and colleges to both incentivise behaviour, and also feedback ahead of public implementation
• Final – publicly available data on main performance tables
Tables cohort Data release Access Status Publication
date 2018 and 2019 (published 2020)
Progress (tech level value-added measure; possible technical certificate value-added measure)
Shadow data (schools/colleges only)
Pilot Spring 2020
2020 exam year (published in 2021)
Progress (tech level value-added measure; possible technical certificate value-added measure)
Published Final January 2021
English and maths (new point scores) Published Final January 2021
Multi-site college data (measures TBD)
Shadow data (schools/colleges only
Pilot Spring/Summer 2021
2021 exam year (published 2022)
Multi-site college data (measures TBD)
Shadow data (schools/college only)
Pilot Spring/Summer 2022
2022 exam year (published 2023
Multi-site college data (measures TBD) Published Final Spring 2023
2023 exam year (published 2024
T Level accountability measures (attainment, completion, English and maths, possible value-added)
Shadow data (schools and colleges only)
Pilot Spring/Summer 2024
2024 exam year
T Level accountability measures (attainment, completion, English and maths, possible value-added)
Published Final Spring 2025

65
(published 2025

66
Annex A: Detailed methodology for allocation In order to identify which school or college to report a student against in each year, the following three data sources have been used:
Spring School Census Individual Learner Record (ILR SN10 for 2017/18, SN14 for previous years)
Awarding Organisation Data
If students are reported once, select school or college based on:
Where student is recorded as on-roll in the Spring school census.
Where student is recorded as studying a main course of study / core aim which is 16-19 funded and is level 3 or below.
Where student is recorded as having sat their exams.
If students are returned multiple times in the same data source:
School selected prioritising enrolment status of ‘current’, then ‘main’, then ‘subsidiary’. If the enrolment status is the same, the school with the highest volume of entries (from awarding organisation data) will be selected.
Where two or more courses are recorded in different colleges, the following hierarchy is used to select the college: 1. Aim started before 1 May 2. Latest start date Where there are concurrent courses of study: 3. Largest course of study 4. Earliest start date 5. Latest end date
School or college with the highest volume of exams (based on size) will be selected
If students are returned in multiple data sources:
The ILR record (a college) will be selected when the student has an enrolment status of subsidiary at the school or is retained in their main course of study and the college either had the highest volume of exam results, or started their main course of study after the date of the spring school census (but before 1st May). Otherwise, the spring school census (a school) will be selected.
State-funded school with ‘main’ or ‘current’ enrolment status; but if ‘subsidiary’ or hospital school then...
…independent school is selected based on AO data
When a student did level 3 qualifications mainly in an independent school and small qualifications in college, the independent school will be selected.
If the same college or school was selected in all years of post-16 study, then all the student’s outcomes have been reported against this one school or college. However, if different schools or colleges were selected using the principles above, only the outcomes achieved in that year are reported against the school or college. The following examples show some common scenarios and how results are reported against each school or college.

67
Scenario 1: A student is taking an academic pathway but moves from a school to a college between AS and A levels. On completing 16 to 18 study in year 13 outcomes are reported:
Year 12 Year 13
Scenario 2: A student starts on an academic pathway but moves to another academic pathway and moves college. On completing 16 to 18 study in year 14 or by age 18 outcomes are reported:
Year 12 Year 13 Year 14
Scenario 3: A student starts on an academic pathway but moves to a vocational pathway and moves schools. On completing 16 to 18 study in year 14 or by age 18 outcomes are reported:
Year 12 Year 13 Year 14
School A: 4 AS levels
College B: 3 A levels (in same
subject as 3 AS levels)
Do
AS level achievement reported against school A
A level achievement reported against college B
College A: 3 AS levels
College B: AS levels (year 13) and A levels (year 14)
AS level (year 12) achievement reported against college A
AS and A level achievement reported against college B, subject to discounting
School A: 3 AS levels
School B: 2 Applied General qualifications (AGQs)
AS level achievement reported against school A
Applied General achievement reported against school B

68
Scenario 4: A student starts on an academic pathway but leaves partway through. At reaching the age of 18 or requesting the student be included in performance tables early via the checking exercise outcomes are reported:
Year 12
Scenario 5 - A student is studying with 2 different colleges in the same academic year. A college is selected using DfE allocation rules – see table above. All of their results are attributed to a single college, including any results studied elsewhere. This may mean qualifications not offered by the allocated college are reported against them.
Year 13
To note: in this scenario the student will be included against college A and B for the retention measures based on the core aim at each college
School A: 4 AS levels
AS level achievement reported against school/college A
College B: One A level
Applied General achievement reported against college B
One A level achievement reported against college B
College A: 2 Applied General qualifications
(AGQs)

69
Scenario 6: A student attends a school in the first year but takes no exams and then takes an academic pathway at a different school. On completing 16 to 18 study in year 14 or by age 18 outcomes are reported:
Year 12 Year 13 Year 14
School A: School B: AS levels (year 13) and A levels (year 14)
There are no attainment measures to report, but the retention measure and English and maths (if applicable) will be reported
against school A
AS and A level achievement reported against school B

70
Annex B: Level 3 Value Added calculations Overview of the measure The figure below provides a snapshot of the level 3 value added (L3VA) calculation. It contains four main steps, where each step will be explained in detail in the following sections.
• Calculating the national average grade for comparison Stage 1
• Calculating student value added (VA) scores Stage 2
• Calculating school and college VA scores Stage 3
• Calculating confidence intervals Stage 4
Calculating the national average grade for comparison This is the first step of how the L3VA calculation works. It sets out the methodology for calculating national average levels of progress and explains how student’s prior attainment is defined.
Calculating average prior attainment at key stage 4 The starting point for the L3VA calculation is to determine each student’s key stage 4 prior attainment. Different qualifications are taken into account when calculating VA scores for qualifications in the academic or applied general cohorts. As a subset of the academic cohort, the calculation for the A level cohort follows the same method as the academic cohort: Academic qualification Applied General qualification
If academic VA scores are being calculated, the average prior attainment is based on students' GCSEs grades only.
If applied general VA scores are being calculated, the average prior attainment is based on all students' key stage 4 results.

71
From 2018 onwards, prior attainment in L3VA reflects the point scale used at KS4 in the current reporting year for all students (e.g. for the 2018 L3VA, the scale used for GCSE and other qualifications will be the points used in the 2018 key stage 4 performance tables). Qualifications in scope will be those approved in KS4 performance tables in any year from 2014 onwards. Simple discounting rules apply, and the best result in any subject will be used when calculating the average point score. As before, re-sits or additional qualifications gained during 16-18 are ignored. For specific points information see here: Key stage 4 performance points for qualifications counting in performance tables. A key table shows how points for grades in legacy GCSEs (A*-G) are put on the same points scale as reformed GCSE grades 9-1 as follows:
Pass Grades Pass Points
GCSE Size Equivalence
Pass Grades
Pass Points
GCSE Size Equivalence
A* 8.5 1 D 3 1
A 7 1 E 2 1
B 5.5 1 F 1.5 1
C 4 1 G 1 1
To calculate prior attainment of students, we first identify exams that are done both during KS4, and are approved for reporting in KS4 tables (in any year from 2014 onwards). Simple discounting is applied to pick exam entries that had the highest points for a particular subject, filtering out lower scoring results. This will usually return the best entry that a student sat. The points they received from their exam entries are averaged – weighted by the qualification size of their entries – to return their average point scores. This process is applied both a student’s GCSE entries – to use as prior attainment for L3VA academic qualifications – and to all of a student’s KS4 entries – to use as prior attainment for L3VA applied general qualifications. Below are two examples of students’ KS4 results on the new prior attainment scale. For both students, any combination of reformed and unreformed GCSEs they take can be combined by adopting the 9-1 scale for reformed GCSEs, and converting unreformed GCSEs to this scale. Example 2 shows how other qualifications are converted to the 9-1 scale.
• For both categories, only qualifications achieved during key stage 4 are included in the prior attainment calculation. Re-sits or additional qualifications gained during the 16-18 study phase are not included.
• Qualifications in the same subjects will be discounted. • AS levels taken before a student reaches the end of key stage 4 are included in
the prior attainment calculation for both academic and applied general L3VA.

72
Example 1 Student A achieved 5 legacy GCSEs at grade A* (worth 8.5 points each), 3 GCSEs at grade A/7 (worth 7 points each) and 2 GCSEs at grade C/4 (worth 4 points each) in key stage 4. Each GCSE entry is equivalent to a size of 1. So:
Example 2 Student B, who reached the end of key stage 4 in 2016, achieved 4 GCSEs at grade C/4 (worth 4 points each) and an OCR Level 2 National Certificate at grade M (worth 6 points) in key stage 4. Each qualification is equivalent to a size of 1.
Academic qualification Applied general qualification
For academic VA scores, only the student’s GCSE grades are included: Total points = 4*4 = 16
Total size = 4*1 = 4
Total points/total = 16 size = 4
Average prior = APS per entry attainment at KS4 = 4
For applied general VA scores, all of the student’s key stage 4 qualifications are included: Total points = 4*4+1*6 = 22
Total size = 5*1 = 5
Total points/total = 22/5 size = 4.4
Average prior = APS per entry attainment at key = 4.4 stage 4
Total points
Total size
Total points/total size
Average prior attainment at key stage
= 5*8.5+3*7+2*4 = 71.5 = 10*1 = 10 = 71.5/10 = 7.15 = Average point score (APS) per entry = 7.15 **
** This is used to calculate both academic and applied general VA scores.

73
Calculating the national average grade After determining each student’s key stage 4 average prior attainment, the next step is to calculate the national average grade of every level 3 qualification type that will be included within the L3VA report for comparison. At the start, data for a particular subject are taken – for example A level design and technology18. For each student taking this subject, their average key stage 4 prior attainment and their A level grade are plotted on a chart and divided into 20 bands19 based on their prior attainment. Each band contains the same number of students. The first band contains the 5 per cent of students with the lowest prior attainment. These mainly achieved 3, 2 or 1 grades in their GCSEs. The 20th band contains the 5 per cent of students with the highest prior attainment. They mainly achieved 9 or 8 grades in their GCSEs.
18 This example shows an A level but the methodology is equivalent for both academic and applied general qualifications. 19 There are usually 20 bands. However, if the 20 bands model does not fit well for a qualification due to various reasons, this is reduced to 10 bands, 5 bands or 1 band. 1 band is used where there is a poor relationship between prior attainment at key stage 4 and outcome in level 3 qualifications, for example where there are only a small number of students entering the qualification.

74
The average attainment for each of these 20 bands can then be calculated. As prior attainment increases, the 16-18 attainment will typically increase20. This reflects the fact that students who get better grades at key stage 4 typically do better at 16-18. In the example below, for band 1, the students with the lowest attainment, the average A level grade in this subject is just below a 5 grade. For band 20, the students with the highest prior attainment, the average A level grade in this subject is around an 8 grade.
These averages can then be “joined up” by drawing a straight line between the points to get a line of average attainment, which shows that students with higher prior attainment typically get better grades. The line is also extrapolated with the lowest and highest grades achieved in the qualification type being the starting and ending points respectively. For example, the figure below shows that students whose average prior attainment was equivalent to a 6 grade at GCSE on average attain a C grade at this A level (30pts). Value added uses the same point scores for outcome attainment as those used in the headline attainment measure with one exception. A fail grade in the full International Baccalaureate (IB) scores 91pts (rather than 0pts). This is to avoid a cliff-edge effect compared to students who narrowly pass the IB (the lowest pass grade 24 scores 100.5 pts, pass grade 25 scores 110 pts, pass grade 26 scores 119.5 pts etc). 20 Where the outcome attainment does not increase steadily with prior attainment, bands will be combined to create an average attainment based on a larger number of students. This will ensure a steadily increasing or level line. The methodology used is called “pool adjacent violators smoothing”.

75
Calculating value added scores This is the second step of how the L3VA calculation works.
Calculating student value added scores for individual qualifications The line of average attainment from the previous section can then be used to calculate the VA scores. These are the difference between actual A level attainment and average A level attainment for students with the same key stage 4 prior attainment. For example, if a student achieves an A grade when the average attainment for a student with that prior attainment in that subject was a C grade, the VA score is +2 grades. Where the difference between the average attainment and the actual attainment is a fraction of a grade, the VA score will be a decimal. VA scores are reported to 2 decimal points.

76
The percentile banding approach allows for the average attainment to be calculated in a way that closely aligns with the underlying data. This minimises any bias for certain groupings of prior attainment that can occur if a “line of best fit” is used.
School and college value added scores School and college VA scores for individual qualifications (e.g. A level chemistry), qualification types (e.g. A Levels) and overall academic and applied general qualifications can be calculated. This is explained in the following sections.
Calculating value added scores for individual qualifications Once the student VA scores have been calculated for a particular qualification, the average of all the student VA scores for that qualification is calculated within the school or college. The figure below shows an example of how a school or college VA score is calculated from five student VA scores in an individual qualification. Example
Student 1 VA score = +0.25 Student 2 VA score = +0.35 Student 3 VA score = +0.50 Student 4 VA score = –0.60 Student 5 VA score = –0.80
School or college VA score in the = +0.25+0.35+0.50–0.60–0.80 qualification (e.g. A level maths)
5 = –0.06 A level grades

77
Formulae The information required to perform this calculation is detailed below:
Variable Description
n Number of exam records in qualification per school/college
u Array of exam record VA scores
Calculating value added sores for a qualification A qualification VA score for a school or college is calculated by finding the average of all the exam level VA scores in that qualification and in that institution.
n
uVA
n
n
avg
∑= 1 where nu = the VA score of the thn exam record
Hence, the overall institution VA score U for the given qualification is U = VAavg .
Calculating value added scores for qualifications types After the VA scores for each qualification have been determined, the qualification type VA scores for the school or college can be calculated by finding the sum of the VA scores for each qualification within the type, divided by the total number of students taking each individual qualification. Example
A level history VA score Number of students A level economics VA score Number of students A level maths VA score Number of students A level VA score
= +0.25 = 50 = –0.70 = 20 = +0.35 = 100
= (50*+0.25)+(20*–0.70)+(100*+0.35)
50+20+100
=+0.20 A level grades

78
Formulae The information required to performance this calculation is as follows:
Variable Description
QualSubjVA VA score for a particular qualification within a given qualification type at school/college level
QualVA Aggregate VA score across qualifications within a given qualification
type at school/college level
bjExamQualSun Number of exams for a particular qualification at school/college level
ExamQualsn Number of exams across all qualifications within a given qualification type at school/college level
ω Weighting factor for selected qualifications, ω = 1 for all qualifications,
except General Studies, where ω = 0.5
Calculating value added scores for a qualification type The formula below is used to calculate aggregate VA scores for qualification types for a school or college. This formula is used for each qualification type that a school or college offers:
Calculating academic and applied general qualifications value added score Finally, using VA scores for all qualifications, school and college overall academic and applied general VA scores can be calculated. Academic VA scores are the average of all academic qualification type VA scores. This calculation is weighted by the relative size of each qualification type. Applied general scores are calculated likewise.

79
Example Below is the summary of all qualification type VA scores for an example school:
Qualification type VA score Number of students
Qualification type size
A level chemistry +0.50 50 1.0 AS level maths –0.15 100 0.5 BTEC Level 3 subsidiary diploma business studies +0.30 30 1.0
Level 3 Foundation Diploma in art and design –0.10 60 2.0
So:
Academic VA scores Applied general VA scores
Total points
Total sizes
Total points/total sizes
= (50*+0.50*1)+(100*– 0.15*0.5) = 17.5 = 50*1+100*0.5 = 100 = VA scores = 17.5/100 = +0.175 A level grades
Total points
Total sizes
Total points/total sizes
= (30*+0.30*1)+(60*– 0.10*2) = –3 = 30*1+60*2 = 150 = VA scores = –3/150 = –0.02 BTEC grades
Formulae: The information required to perform this calculation is detailed below:
Variable Description
𝑉𝑉𝑉𝑉𝐴𝐴𝐴𝐴𝑉𝑉𝐴𝐴 School or college’s overall academic or applied general VA score 𝑁𝑁𝐴𝐴𝑄𝑄𝑄𝑄𝑄𝑄𝐴𝐴𝐴𝐴𝑉𝑉𝐴𝐴 The number of academic or applied general qualifications for that
school or college 𝑉𝑉𝑉𝑉𝐴𝐴𝑄𝑄𝑄𝑄𝑄𝑄 School or college’s VA score for given academic or applied general
qualification (e.g. A level physics VA score) 𝜇𝜇𝐴𝐴𝑄𝑄𝑄𝑄𝑄𝑄 National average VA score for a given academic or applied general
qualification 𝑛𝑛𝐴𝐴𝑄𝑄𝑄𝑄𝑄𝑄 Number of entries within school or college within given academic or
applied general qualification 𝑉𝑉𝑉𝑉𝑉𝑉𝐴𝐴𝑄𝑄𝑄𝑄𝑄𝑄 The size of the qualification type for the given academic or applied
general qualification, in relation to A Levels (for academic qualifications) or BTEC level 3 Subsidiary Diplomas (for applied general qualifications)

80
Calculating value added scores for academic and applied general qualifications The formula below is used to calculate aggregated VA scores for academic and applied general qualifications. As this VA score combines information from different qualification types, the VolQual variable is included in the formula.
𝑉𝑉𝑉𝑉𝐴𝐴𝐴𝐴𝑉𝑉𝐴𝐴 = ∑ ((𝑉𝑉𝑉𝑉𝐴𝐴𝑄𝑄𝑄𝑄𝑄𝑄 − 𝜇𝜇𝐴𝐴𝑄𝑄𝑄𝑄𝑄𝑄) ∙ 𝑛𝑛𝐴𝐴𝑄𝑄𝑄𝑄𝑄𝑄)𝑁𝑁𝑄𝑄𝑄𝑄𝑄𝑄𝑄𝑄𝑄𝑄𝑄𝑄𝑄𝑄𝑄𝑄1
∑ (𝑛𝑛𝐴𝐴𝑄𝑄𝑄𝑄𝑄𝑄 ∙ 𝑉𝑉𝑉𝑉𝑉𝑉𝐴𝐴𝑄𝑄𝑄𝑄𝑄𝑄)𝑁𝑁𝑄𝑄𝑄𝑄𝑄𝑄𝑄𝑄𝑄𝑄𝑄𝑄𝑄𝑄𝑄𝑄1
This step includes a small adjustment to correct for aggregation error. This means the student average VA score is 0 rather than the institution average. This may mean there is a small inconsistency with qualification type and individual qualification scores. For example, if an institution only offered A levels, then their A levels score could be slightly different from their aggregate academic score, even though they are calculated from the same results.

81
Confidence intervals for L3VA This is the final step of how the new L3VA calculation works.
Purpose of confidence intervals The L3VA measure is used to determine how effective a school or college is in helping their students make progress. However, the VA scores of a school or college are derived from a given set of students’ results for a particular test paper on a particular day. In addition, it is known that the school or college is not the only influence on students’ attainment. In fact, there are many random factors that will make a considerable impact on students’ attainment, such as their home life or any private tuition they receive. As such, confidence intervals are used to capture the uncertainty of the L3VA measure.
Calculating confidence intervals around a school or college’s qualification value added score The information required to perform this calculation is detailed below: Variable Description
2σ National variance of error
n Number of exam records in qualification per school/college
u Array of exam record VA scores
ψ Standard error per qualification per school/college
Using the standard error, it is possible to calculate confidence intervals around a school or college’s qualification value added score.
n2σψ =
The 95% confidence interval around a school or college’s qualification VA score is then given by:
ψ96.1±U

82
Calculating confidence intervals around a school or college’s qualification type value added score The information required to performance this calculation is as follows:
Variable Description
QualSubjVA VA score for a particular qualification within a given qualification type at school/college level
QualVA Aggregate VA score across qualifications within a given qualification
type at school/college level
bjExamQualSun Number of exams for a particular qualification at school/college level
ExamQualsn Number of exams across all qualifications within a given qualification type at school/college level
QualSubjΨ Standard error for a given qualification at school/college level
QualVAΨ Standard error for a given qualification type at school/college level
ω Weighting factor for selected qualifications, ω = 1 for all qualifications,
except General Studies, where ω = 0.5 It is then possible to calculate 95% confidence intervals around the school or college’s qualification type VA score. To do this, the standard error for the qualification type needs to be determined first:
∑ ⋅
=
bjExamQualSu
Qual
n
QualSubjExamQuals
bjExamQualSuVA n
n
1
2
2
ψψ
With the standard error for the qualification type, the following equation can be used to calculate confidence intervals around the VA score:
qualVAQualVA ψ96.1±

83
Calculating confidence intervals around a school or college’s academic or applied general value added score The information required to perform this calculation is detailed below:
Variable Description
𝑉𝑉𝑉𝑉𝐴𝐴𝐴𝐴𝑉𝑉𝐴𝐴 School or college’s overall academic or applied general VA score (in
grades) 𝑁𝑁𝐴𝐴𝑄𝑄𝑄𝑄𝑄𝑄𝐴𝐴𝐴𝐴𝑉𝑉𝐴𝐴 The number of academic or applied general qualifications for that
school or college 𝑉𝑉𝑉𝑉𝐴𝐴𝑄𝑄𝑄𝑄𝑄𝑄 School or college’s VA score for given academic or applied general
qualification (e.g. A level physics VA score) 𝜇𝜇𝐴𝐴𝑄𝑄𝑄𝑄𝑄𝑄 National average VA score for a given academic or applied general
qualification 𝑛𝑛𝐴𝐴𝑄𝑄𝑄𝑄𝑄𝑄 Number of entries within school or college within given academic or
applied general qualification 𝑉𝑉𝑉𝑉𝑉𝑉𝐴𝐴𝑄𝑄𝑄𝑄𝑄𝑄 The size of the qualification type for the given academic or applied
general qualification, in relation to A Levels (for academic qualifications) or BTEC level 3 Subsidiary Diplomas (for applied general qualifications)
𝛹𝛹𝑉𝑉𝐴𝐴𝑄𝑄𝑄𝑄𝑄𝑄𝑄𝑄 Standard error of overall academic or applied general value added score (in grades)
𝜓𝜓𝐴𝐴𝑄𝑄𝑄𝑄𝑄𝑄 Standard error for the VA score for the given academic or applied general qualification (in points, before rescaling to grades)
It is possible to calculate confidence intervals around each sector subject area (across qualification types) VA score. To do this, the standard error must first be calculated which is given by the formula below:
ψ𝑉𝑉𝐴𝐴𝑄𝑄𝑄𝑄𝑄𝑄𝑄𝑄 = � � �𝑛𝑛𝐴𝐴𝑄𝑄𝑄𝑄𝑄𝑄 ∙ 𝑉𝑉𝑉𝑉𝑉𝑉𝐴𝐴𝑄𝑄𝑄𝑄𝑄𝑄
∑ �𝑛𝑛𝐴𝐴𝑄𝑄𝑄𝑄𝑄𝑄 ∙ 𝑉𝑉𝑉𝑉𝑉𝑉𝐴𝐴𝑄𝑄𝑄𝑄𝑄𝑄�𝑁𝑁𝑄𝑄𝑄𝑄𝑄𝑄𝑄𝑄𝑄𝑄𝑄𝑄𝑄𝑄𝑄𝑄1
�2
∙ �𝜓𝜓𝐴𝐴𝑄𝑄𝑄𝑄𝑄𝑄𝑉𝑉𝑉𝑉𝑉𝑉𝐴𝐴𝑄𝑄𝑄𝑄𝑄𝑄
�2𝑁𝑁𝑄𝑄𝑄𝑄𝑄𝑄𝑄𝑄𝑄𝑄𝑄𝑄𝑄𝑄𝑄𝑄
1
With the academic or applied general standard error, the following equation can be used to calculate confidence intervals around the VA score:
𝑉𝑉𝑉𝑉𝐴𝐴𝐴𝐴𝑉𝑉𝐴𝐴 ± 1.96 ∙ ψ𝑉𝑉𝐴𝐴𝑄𝑄𝑄𝑄𝑄𝑄𝑄𝑄

84
Understanding school and college confidence intervals 95% of the time, a school or college’s true score will fall within the confidence interval. A school or college’s confidence interval is always centred on the school or college’s VA score. For example, if a school or college’s VA score is +1 and the size of their confidence interval is 0.5 grades, then the confidence interval ranges between +0.5 and +1.5 (i.e. half a grade either side of the VA score). The size of the confidence interval is largely determined by the number of students in the school or college that completed the level 3 qualification. Schools and colleges with fewer students completing the qualification have wider confidence intervals because their VA score is based on a smaller number of students, and so there is less evidence on which to judge the school or college’s effectiveness. School and college confidence intervals can be interpreted to give one of three conclusions:
• a school or college is significantly below the national average;
• a school or college is not significantly different to the national average;
• a school or college is significantly above the national average. The national average VA score is 0.
Calculation of statistical significance of value added scores A school or college qualification VA score (denoted U) is defined to be below the national average and statistically significant when their VA score is below 0 and their upper end of the 95% confidence interval is below 0. This can be expressed formulaically as:
( ) 096.1&0 <+< ψUU A school or college qualification VA score (denoted U) is defined to be above the national average and statistically significant when their VA score is above 0 and their lower end of the 95% confidence interval is above 0. This can be expressed formulaically as:
( ) 096.1&0 >−> ψUU
Statistical significance at qualification type level A school or college qualification type VA score is defined to be below the national average and statistically significant when their VA score is below 0 and their upper end of the 95% confidence interval is below 0. This can be expressed formulaically as:
( ) 096.1&0 <+<QualVAQualQual VAVA ψ

85
A school or college qualification VA score defined to be above the national average and statistically significant when their VA score is above 0 and their lower end of the 95% confidence interval is above 0. This can be expressed formulaically as:
( ) 096.1&0 >−>QualVAQualQual VAVA ψ
Statistical significance at academic or applied general level A school or college academic or applied general VA score is defined to be below the national average and statistically significant when their VA score is below 0 and their upper end of the 95% confidence interval is below 021. This can be expressed formulaically as:
𝑉𝑉𝑉𝑉𝐴𝐴𝐴𝐴𝑉𝑉𝐴𝐴 < 0 & �𝑉𝑉𝑉𝑉𝐴𝐴𝐴𝐴𝑉𝑉𝐴𝐴 + 1.96 ∙ 𝜓𝜓𝑉𝑉𝐴𝐴𝑄𝑄𝑄𝑄𝑄𝑄𝑄𝑄� < 0
A school or college academic or applied general VA score is defined to be above the national average and statistically significant when their VA score is above 0 and their lower end of the 95% confidence interval is above 0. This can be expressed formulaically as:
𝑉𝑉𝑉𝑉𝐴𝐴𝐴𝐴𝑉𝑉𝐴𝐴 > 0 & �𝑉𝑉𝑉𝑉𝐴𝐴𝐴𝐴𝑉𝑉𝐴𝐴 − 1.96 ∙ 𝜓𝜓𝑉𝑉𝐴𝐴𝑄𝑄𝑄𝑄𝑄𝑄𝑄𝑄� > 0
21 We base calculations on rounded figures (to 2 decimal places). For example, in the rare case that the upper CI is -0.000001, it is regard as bow average as the rounded upper CI is 0.00, therefore the CI range includes 0.

86
Annex C: Further details of the completion and attainment measure Example of how the completion and attainment measure works This example is for tech levels but the methodology is equivalent for level 2 vocational qualifications. Below is a simplified example of how the completion and attainment measure works for an institution with 2 subjects and 9 students. First, we calculate subject level attainment by adding together the point scores for each outcome. Students who withdraw before completing the qualification are treated as fails. These subject level attainment scores are then compared with the national average to give a completion and attainment score for each subject. In this example the institution has higher absolute attainment in plumbing than hairdressing, but worse relative attainment. This means there is no advantage from institutions entering students into subjects that are perceived to be easier. These subject level relative attainment scores are then aggregated into overall completion and attainment scores for tech levels. For tech levels we convert from point scores to grades by dividing by 10.
Entry Outcome (Points)
Subject Level Attainment
Compare With National Average
School/College's Overall Score
Hai
rdre
ssin
g (le
vel 3
) with
a
subj
ect s
ize
(com
pare
d w
ith
an A
leve
l) of
1.5
Student A Distinction (52.5) Institution
Average Point Score
= 37.5 points
(equal to a merit)
Hairdressing National Average
= 36.5 points
Difference
= 37.5 – 36.5
= + 1 point
Weighted Average
(for each subject calculate the number of students multiplied by the points difference, find the total and then divide by the total sum of subject sizes)
= (5 x 1) + (4 x – 1.5) (5 x 1.5) + (4 x 1) = – 0.09 points A score of – 0.09 points is equivalent to being – 0.01 grades below average.
Student B Merit (37.5)
Student C Pass (22.5)
Student D Distinction* (75)
Student E Fail (0)
Plum
bing
(Lev
el 3
) with
a
subj
ect s
ize
(com
pare
d w
ith a
n A
le
vel)
of 1
Student F Withdrawal (0) Institution
Average Point Score
= 27.5 points
(just above a merit)
Plumbing National Average
= 29 points
Difference
= 27.5 – 29 = – 1.5 points
Student G Distinction* (50)
Student H Merit (25)
Student I Distinction (35)

87
Subject grouping for fairer matching In the ILR / school census data, institutions record the specific courses that their students take. There is a reference number that identifies the awarding organisation, subject and the amount of learning normally required. For example, if put in terms of guided learning hours needed to complete an A level, a diploma is worth 2 A levels. To match learning aim records and attainment data over a three-year period we group together similar subjects to increase flexibility for institutions to change the number of learning hours a student spends on a course. It improves the match rate and therefore decreases the number of instances where we award a fail. Subject grouping methodology has changed from 2016. Qualifications of the same subject with different awarding bodies are now grouped together rather than grouped separately. Below are two examples of the subject groups used for the completion and attainment measure. 1. Two tech levels are grouped into one, accommodating qualifications of different sizes
and grade structures.
Qualification number
Qualification description Subject group Subject size (compared
with an A level) Subject grade
structure
50071373
Pearson BTEC Level 3 Diploma in Construction and the Built Environment (QCF)
Construction Tech 2 **/*D/DD/DM/M
M/MP/PP/F
50071397
Pearson BTEC Level 3 Extended Diploma in Construction and the Built Environment (QCF)
Construction Tech 3
***/**D/*DD/DDD/DDM/DMM/MMM/MMP/MPP/PP
P/F The created subject group in tech levels is: Construction Tech 2. Two level 2 vocational qualifications are grouped into one, accommodating
qualifications of different sizes, grade structures and awarding organisations.
Qualification number
Qualification description Subject group Subject size (compared
with a GCSE) Subject grade
structure
5007930X Pearson BTEC Level 2 Diploma in Creative Media Production (QCF)
Multimedia 4 D*/D/M/P/F
60139274
UAL Level 2 Diploma In Creative Media Production & Technology (QCF)
Multimedia 5 D/M/P/F
The created subject group in level 2 vocational qualifications is: Multimedia

88
Determining the size of an aim or result for the completion and attainment measure An important part of the completion and attainment process is to compare students’ attainment with the national average in the same subject of the same size and grade structure. The size of the qualification/aim is defined accordingly:
• A student who completes a course and achieves an exam result o The size of the result is determined by the size of the exam result. If there is
more than one, the largest size counts. For example, if a student had results for both the diploma and extended diploma in the above table, their result would be weighted to the size of 3 A levels.
• A student who completes a course with no exam result or is withdrawn o The size of the fail result will be the size of the largest aim in the ILR / autumn
school census data for the particular subject grouping.
Examples of how the size of an aim or result is determined The examples below are for tech levels but the methodology is equivalent for level 2 vocational qualifications. For a student with one aim and exam result of the same size, that size is chosen.
Subject grouping
Aim size (in A levels)
Completion status
Exam results?
Exam result size
(in A levels)
Size (in A levels) for completion and
attainment Art & Design 3 Completed Yes 3 3
For a student with one aim and an exam result of a different size, the size of the exam result is selected. The completion and attainment score will therefore be based on size 2 (diploma) rather than size 3 (extended diploma).
Subject grouping
Aim size (in A levels)
Completion status
Exam results?
Exam result size
(in A levels)
Size (in A levels) for completion and
attainment Art & Design 3 Completed Yes 2 2
For a student with two aims where one is completed and the other is withdrawn and there are no exam results, the largest aim size (3) is selected. Assuming these aims are from the same institution only one fail is included in the completion and attainment score.
Subject grouping
Aim size (in A levels)
Completion status
Exam results?
Exam result size
(in A levels)
Size (in A levels) for completion and
attainment Art & Design 3 Completed No N/A
3 Art & Design 2 Withdrawn No N/A

89
Re-based performance points scores for level 2 qualifications
Level 2 qualifications in completion and attainment: 2019 tables Note these re-based points are specifically for level 2 qualifications in the completion and attainment measure.22 Three-grade structure, e.g. Pass/Merit/Distinction structure (size 3 to 9)
Grade Size: 3
Size: 4
Size: 5
Size: 6
Size: 7
Size: 8
Size: 9
D 12.0 16 20.0 24 28.0 32 36.0 M / C 9.0 12 15.0 18 21.0 24 27.0 P 4.5 6 7.5 9 10.5 12 13.5 Fail 0 0 0 0 0 0 0
Four-grade structure, e.g. Pass/Merit/Distinction/Distinction* structure (size 2/4/5):
Grade Size: 2 Size: 4 Size: 5
D* 8 16 20 D 6 12 15 M 4 8 10 P 2 4 5 Fail 0 0 0
Five-grade structure, e.g. PP/PM/MM/MD/DD (size 4/5):
Grade Size: 4 Size: 5
DD 10 12.5 MD 8 10 MM 6 7.5 PM 4 5 PP 2 2.5 Fail 0 0
22 Level 2 points for the headline attainment measure are available here: https://www.gov.uk/government/publications/16-to-19-qualifications-discount-codes-and-point-scores

90
Annex D: English and maths progress measure
English and maths progress examples Individual student progress in the same institution throughout As the table below illustrates, the progress calculation uses the student’s best result whilst at a particular institution.
• in the case of Student A therefore, the GCSE grade C (5 points) achieved in
Year 2 (after KS4) discounts the grade E (3 points) achieved in Year 1.
• as long as the student is aged 16-18, it does not matter in which year the best results was achieved, so in the case of Student B and Student D the progress calculation uses their best achievements in Year 1, Year 2 and Year 3 respectively.
• student D gives an example of capping progress, where uncapped the
student’s progress would be -1.3, but is capped at -1.
• student E who had no entries in the 16-18 phase automatically scored -1 Individual student progress in multiple institutions Calculating student progress when they attend multiple institutions in the 16-18 phase is slightly more complicated as the student’s overall progress may be split across more than one institution, and each institution is only credited for progress made in that institution.
Attainment whilst at institution
Scenario Prior Attainment Year 1 Year 2 Year 3 Student progress
Student A GCSE grade D GCSE grade E GCSE grade C
N/A 5 - 4 = 1 4 pts 3 pts 5 pts
Student B GCSE grade E Functional skill L2 GCSE grade E
N/A 4 - 3 = 1 3 pts 4pts 3pts
Student C GCSE grade F ESOL Entry level ESOL L1 Merit ESOL L2 Pass
4 - 2 = 2 2 pts 0.4 pts 2.5 pts 4 pts
Student D IGCSE grade E FSM L1 grade E FSM L1 grade D FSM L1 grade E 1.7 - 3 = -1
(capped) 3 pts 0.8 pts 1.7 pts 0.8 pts
Student E GCSE grade G
no entries no entries no entries -1 (no entries) 1 pt
Student F GCSE grade B
Not in scope N/A 6 pts

91
The table below considers another scenario (Student G), and retaining the exam profile throughout, imagines instead that the student attended 1, 2 or 3 different institutions in the 16-18 phase. Colour coding indicates when the student moved to a different institution (or is grey when the student didn’t attend any school or college in that year). Attainment in 16-18 phase
Scenario Prior Attainment Year 1 Year 2 Year 3 Progress in
Institution 1 Progress in
Institution 2 Progress in
Institution 3
Student G -1 1pt 2 pts 4 pts 3 pts 4 - 1 = 3 N/A N/A
Student G - 2 1pt 2 pts 4 pts 3 pts 2 - 1 = 1 4 - 2 = 2 N/A
Student G - 3 1pt 2 pts 4 pts 3 pts 4 -1 = 3 3 - 4 = -1 N/A
Student G-4 1pt 2 pts 4 pts 3 pts better of: 2 -1 = 1 3 - 4 = -1
4 - 2 = 2 N/A
Student G- 5 1pt 2 pts 4 pts 3 pts 2 -1 = 1 4 - 2 = 2 3 - 4 = -1
• Scenario 1 works in the same way as the examples A-F, so 4 points is the best result in the 16-18 phase and the key stage 4 prior attainment of 1 points is subtracted.
• Scenario 2 has the student move institutions after Year 1. Progress in the first institution uses Year 1 attainment (2 points) from which the key stage 4 prior attainment of 1 is subtracted; however the best achievement in the second institution (4 points) takes into account the progress made in the first institution, and so the prior attainment subtracted is now 2 points.
• Scenario 4 is the most complex situation that is encountered and occurs when a student attends the same institution in Year 1 and Year 3, but another in Year 2. In the case of Student G we see that the student makes progress in Year 1 (1 pt). However in Year 3 the student goes backwards compared to their Year 2 in a different institution (-1 point). In this situation, where progress is both positive and negative, we report the positive progress in performance tables for Institution 1. If the student had made positive progress in both Year 1 and Year 3 in Institution 1 then both sets of progress would be added together and reported against Institution 1.
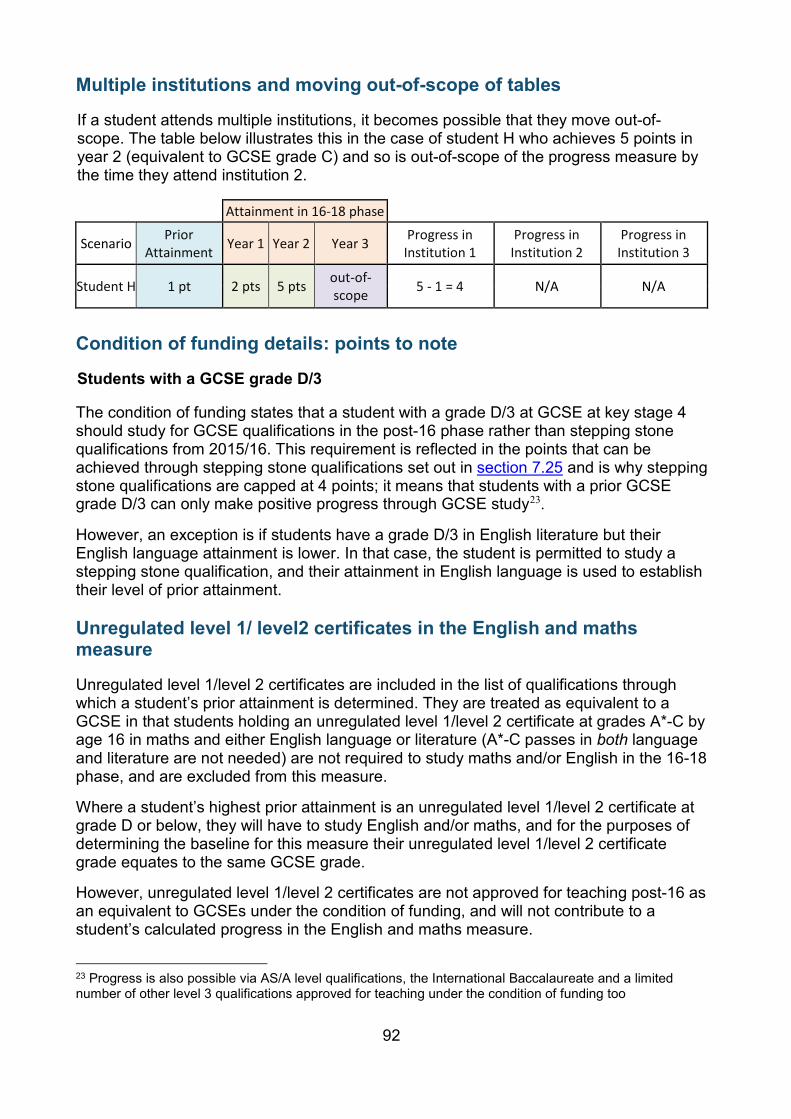
92
Multiple institutions and moving out-of-scope of tables If a student attends multiple institutions, it becomes possible that they move out-of-scope. The table below illustrates this in the case of student H who achieves 5 points in year 2 (equivalent to GCSE grade C) and so is out-of-scope of the progress measure by the time they attend institution 2. Attainment in 16-18 phase
Scenario Prior Attainment Year 1 Year 2 Year 3 Progress in
Institution 1 Progress in
Institution 2 Progress in
Institution 3
Student H 1 pt 2 pts 5 pts out-of-scope 5 - 1 = 4 N/A N/A
Condition of funding details: points to note Students with a GCSE grade D/3 The condition of funding states that a student with a grade D/3 at GCSE at key stage 4 should study for GCSE qualifications in the post-16 phase rather than stepping stone qualifications from 2015/16. This requirement is reflected in the points that can be achieved through stepping stone qualifications set out in section 7.25 and is why stepping stone qualifications are capped at 4 points; it means that students with a prior GCSE grade D/3 can only make positive progress through GCSE study23. However, an exception is if students have a grade D/3 in English literature but their English language attainment is lower. In that case, the student is permitted to study a stepping stone qualification, and their attainment in English language is used to establish their level of prior attainment. Unregulated level 1/ level2 certificates in the English and maths measure Unregulated level 1/level 2 certificates are included in the list of qualifications through which a student’s prior attainment is determined. They are treated as equivalent to a GCSE in that students holding an unregulated level 1/level 2 certificate at grades A*-C by age 16 in maths and either English language or literature (A*-C passes in both language and literature are not needed) are not required to study maths and/or English in the 16-18 phase, and are excluded from this measure. Where a student’s highest prior attainment is an unregulated level 1/level 2 certificate at grade D or below, they will have to study English and/or maths, and for the purposes of determining the baseline for this measure their unregulated level 1/level 2 certificate grade equates to the same GCSE grade. However, unregulated level 1/level 2 certificates are not approved for teaching post-16 as an equivalent to GCSEs under the condition of funding, and will not contribute to a student’s calculated progress in the English and maths measure.
23 Progress is also possible via AS/A level qualifications, the International Baccalaureate and a limited number of other level 3 qualifications approved for teaching under the condition of funding too

93
Annex E: Retention Headline retention measure
The following tables give examples of how the core aim is selected and show whether the students count as retained or not retained in the headline retention measure. Example 1 The VR2 aim is selected as the core aim since it is the only one with size of at least 1. This student does not count as retained as they withdrew from the core aim.
Qualification type Size
‘Core aim’ flagged by
school/college
Completion Status
Selected Core Aim Retained?
AS level 0.5 Completed AS level 0.5 Completed AS level 0.5 Completed AS level 0.5 Completed VR2 1.3 Withdrawn X No
Example 2 The tech level VR3 aim is selected as the core aim since there are multiple completed aims and the majority of the student’s attainment is tech level. This student counts as retained.
Qualification type Size
‘Core aim’ flagged by
school/college
Completion Status
Selected Core Aim Retained?
VR3 1.3 Completed X Yes VR2 1.3 Completed VR2 1.3 Completed VR2 1.3 Continuing A level 1.0 Continuing
Example 3 Although the IB qualification is the only one that the student did not complete, this is selected as their core aim due to its large size. This student does not count as retained as they withdrew from the core aim.
Qualification type Size
‘Core aim’ flagged by
school/college
Completion Status
Selected Core Aim Retained?
AS level 0.5 Completed AS level 0.5 Completed AS level 0.5 Completed International Baccalaureate 5.0 Withdrawn X No

94
Example 4 The BTEC Diploma level 3 qualification (size 1) is selected as the core aim as this vocational aim has been flagged by the school or college as being the student’s ‘core aim’. This student does not count as retained as they withdrew from the core aim.
Example 5 One of the AS level qualifications is arbitrarily selected as the core aim as the student only had 0.5 size aims, all of which were completed. This student counts as retained.
Qualification type Size
‘Core aim’ flagged by
school/college
Completion Status
Selected Core Aim Retained?
AS level 0.5 Completed X Yes AS level 0.5 Completed AS level 0.5 Completed AS level 0.5 Completed
Returned and retained for a second year The following tables give examples of whether the student counts as returned and retained for a second year and show situations where a student is excluded from the measure. Example 6 This student had aims in the institution in two academic years and spent a total of 657 days in the institution. They completed an aim of size 1+ in their second year so they count as returned and retained for a second year.
Year Qualification type Size Aim start
date Aim end
date Completion
Status Selected Core Aim
Returned & retained for a 2nd year?
1 VR3 1.5 09/09/2014 27/06/2015 Completed 2 VR3 3.0 09/09/2015 26/06/2016 Completed X Yes
Qualification type Size
‘Core aim’ flagged by
school/college
Completion Status
Selected Core Aim Retained?
Extended Project 0.3 Completed
AS level 0.5 Completed AS level 0.5 Completed BTEC Diploma level 3 2 Withdrawn
BTEC Diploma level 3 2 Completed
BTEC Diploma level 3 1 X Withdrawn X No

95
Example 7 This student had aims in the institution in two academic years and spent a total of 690 days in the institution. The selected core aim was completed in their first year but they have other level 3 aims of size 1+ in their second year so they count as returned and retained for a second year.
Year Qualification type Size Aim start
date Aim end
date Completion
Status Selected Core Aim
Returned & retained for a 2nd year?
1 AS level 0.5 02/09/2014 23/07/2015 Completed 1 AS level 0.5 02/09/2014 23/07/2015 Completed 1 AS level 0.5 02/09/2014 23/07/2015 Completed 1 A level 1.0 02/09/2014 23/07/2015 Completed X Yes 2 A level 1.0 01/09/2015 22/07/2016 Completed 2 A level 1.0 01/09/2015 22/07/2016 Completed 2 A level 1.0 01/09/2015 22/07/2016 Completed
Example 8 This student had aims in the institution in three academic years. Although they did not complete an aim of size 1+ in their second year, they did in their third year so they count as returned and retained for a second year.
Year Qualification type Size Aim start
date Aim end
date Completion
Status Selected Core Aim
Returned & retained for a 2nd year?
1 AS level 0.5 03/09/2013 19/07/2014 Completed 1 AS level 0.5 03/09/2013 19/07/2014 Completed 1 AS level 0.5 03/09/2013 19/07/2014 Completed 2 AS level 0.5 02/09/2014 18/07/2015 Completed 2 AS level 0.5 02/09/2014 18/07/2015 Completed 2 AS level 0.5 02/09/2014 18/07/2015 Completed 3 A level 1.0 01/09/2015 01/06/2016 Completed 3 A level 1.0 01/09/2015 01/06/2016 Completed 3 A level 1.0 01/09/2015 01/06/2016 Completed X Yes
Example 9 This student had aims in the institution in two academic years and spent a total of 682 days in the institution. They did not complete a qualification of size 1+ in their second year so they do not count as returned and retained for a second year.
Year Qualification type Size Aim start
date Aim end
date Completion
Status Selected Core Aim
Returned & retained for a 2nd year?
1 AS level 0.5 06/09/2014 04/03/2015 Withdrawn 1 AS level 0.5 06/09/2014 04/03/2015 Withdrawn 1 AS level 0.5 06/09/2014 19/07/2015 Completed 2 AS level 0.5 02/09/2015 18/07/2016 Completed 2 AS level 0.5 02/09/2015 18/07/2016 Completed 2 AS level 0.5 02/09/2015 18/07/2016 Completed X No

96
Example 10 This student had aims in the institution in two academic years but only spent 432 days in the institution. Even though they completed a qualification of size 1, they do not count as returned and retained for a second year since they were not in the institution for long enough.
Year Qualification type Size Aim start
date Aim end
date Completion
Status Selected Core Aim
Returned & retained for a 2nd year?
1 BD3 1.0 09/09/2014 02/07/2015 Completed X No 2 BD3 2.0 09/09/2015 14/11/2015 Withdrawn
Example 11 This student had aims in the institution in one academic year. However, they are excluded from the returned and retained for a second year measure since they are aged 18 and although they may return for a second year, they will be too old to be included in performance tables.
Year Qualification type Size Aim start
date Aim end
date Completion
Status Selected Core Aim
Returned & retained for a 2nd year?
1 AS level 0.5 03/09/2015 22/07/2016 Completed 1 AS level 0.5 03/09/2015 22/07/2016 Completed X N/A 1 AS level 0.5 03/09/2015 22/07/2016 Completed 1 GCSE 0.3 03/09/2015 22/07/2016 Completed
Example 12 This student had aims in the institution in one academic year. However, they are excluded from the returned and retained for a second year measure since their level 3 qualifications of size 1 or above sum to 2 or more.
Year Qualification type Size Aim start
date Aim end
date Completion
Status Selected Core Aim
Returned & retained for a 2nd year?
1 AS level 0.5 04/09/2015 10/07/2016 Completed 1 A level 1.0 04/09/2015 10/07/2016 Completed 1 A level 1.0 04/09/2015 10/07/2016 Completed X N/A 1 A level 1.0 04/09/2015 10/07/2016 Completed
Example 13 This student had aims in the institution in two academic years and spent a total of 671 days in the institution. However, they are excluded from the returned and retained for a second year measure since their selected core aim is a level 2 qualification.
Year Qualification type Size Aim start
date Aim end
date Completion
Status Selected Core Aim
Returned & retained for a 2nd year?
1 AS level 0.5 09/09/2014 25/07/2015 Completed 1 AS level 0.5 09/09/2014 25/07/2015 Completed

97
2 VR2 1.3 04/09/2015 10/07/2016 Completed X N/A
Retained and assessed The following tables provide examples of whether a student is retained and assessed, and shows situations where a student would not be counted. Example 14 The student was retained in an A level core aim and was assessed in five exams. Two of these, the Applied General and Tech level assessments are of sufficient size and level to allow the student to be retained and assessed.
Core aim type Core aim size
Core aim level
Exams taken
Exam size
Exam level
Retained and assessed?
A level 1 3
AS level 0.5 3
Yes
AS level 0.5 3 AS level 0.5 3 Tech level 1 3 Applied General 1 3
Example 15 The student was retained in a BTEC Diploma level 3 qualification and was assessed in three exams. However, this student is not retained and assessed as the individual A level assessments do not match the size of the BTEC Diploma level 3.
Core aim type Core aim size
Core aim level
Exams taken
Exam size
Exam level
Retained and assessed?
BTEC Diploma Level 3 2 3
A level 1 3 No
A level 1 3 A level 1 3
Example 16 The student was retained in a BTEC Certificate level 2, and was assessed in three exams. However, this student would not be considered retained and assessed as even though the Tech level qualification is larger than the core aim, it is at a different level.
Core aim type Core aim size
Core aim level
Exams taken
Exam size
Exam level
Retained and assessed?
BTEC Certificate
level 2 1 2
AS level 0.5 3
No
AS level 0.5 3
Applied general 1.5 3

98
Annex F: Destination measures – sources and methodology Students who had previously been recorded as being at the end of 16 to 18 study are matched to a wide range of data sources that contain information about their activity in the following academic year. This matching takes place at individual level using personal identifiers such as name, date of birth and postcode. Information on the students’ activity throughout the following academic year, as recorded across these administrative datasets, is used to determine whether they sustained an education or employment destination, and the specific category they are recorded against.
Data sources used Many of the datasets used to determine whether a student continued participating in education form part of the National Pupil Database (NPD):
• individualised learner record (ILR) covering English further education (FE) sector colleges, other FE providers and specialist post-16 institutions (SPIs).
• school census (SC) covering state-funded schools in England. This includes state-
funded and non-maintained special schools and pupil referral units (PRU) and the alternative provision (AP) census.
• awarding body data for independent schools
• Higher Education Statistics Agency (HESA) data covering United Kingdom higher
education institutions and higher education alternative providers The Longitudinal Educational Outcomes (LEO) dataset extends the national pupil database by linking employment, earnings and benefits data from other government departments to education data at an individual level:
• employment data from Her Majesty’s Revenue and Customs (HMRC) including self-employment
• out-of-work benefit data from the Department for Work and Pensions (DWP)
These sources give reliable information about participation throughout the year and do not rely on self-report or activity at a single point in time. Activity was captured in these sources for 97% of 16-18 students in 2014/15. We cannot include evidence from sources beyond those listed at this point in time, but will continue to investigate further datasets for future years. Additional information from the Universities & Colleges Admissions Service (UCAS) showing students having an accepted deferred offer for a UK higher education institution is shown alongside their recorded activity in the year.

99
The headline measure: percentage staying in education or employment for at least two terms To be included in the headline overall ‘sustained destination’ measure a student must be recorded as in an apprenticeship, education or employment for two terms the following academic year after completing 16-18 study. To be counted they must have education or employment participation throughout the 6 months between October and March, or any 6 months participation in an apprenticeship. A combination of education destinations or of education and employment is permitted, as is a one-month gap in participation within the 6 months to count as a sustained employment destination. If the month with no participation is March, participation must be recorded in April to count in the measure. Staying in an apprenticeship for at least 6 months: If the student stays in an apprenticeship for six consecutive months within the year (August to July) they are counted in an apprenticeship; whether or not they are also employed or in education (indeed apprentices are expected to be in employment and education). Staying in education for at least two terms: If the student stays in education (other than an apprenticeship) throughout the 6 months (October to March), they are counted in education; whether or not they are also employed. If the sustained participation is fulfilled through two terms attendance at one type of institution, more specific subcategories identify the most common destinations: various types of higher education institution, and FE colleges and other FE providers. Less common institution types and sustained participation achieved only through a mixture of institution types (or a mixture of education and apprenticeships) are recorded as ‘other education destinations’. Staying in employment for at least two terms: if the sustained participation is achieved only through employment, or through a combination of education and employment; or apprenticeship and employment. There are two categories that cover students not included in the measure:
• Not staying in education or employment for two terms: This includes those participating in education or employment at some point during the year but who did not have continuous participation October to March and a small number with no participation recorded but who claimed out-of-work benefits within the year.
• Destination Unknown: This includes young people who were not found in the source datasets.
More details can be found in the technical note accompanying our statistical first release.

100
Annex G: Data sources These are the data sources for the 2019 performance tables: Student ‘on roll’ status, for allocation of students to schools: spring school census for 2018/19, 2017/18 and 2016/17. For general guidance on the school census click here: https://www.gov.uk/guidance/school-census Student core aim, for allocation of students to colleges: ILR SN10 for 2018/19; ILR SN14 for 2017/18 and 2016/17. For general guidance on ILR click here: https://www.gov.uk/government/collections/individualised-learner-record-ilr Students’ learning aims, for retention and completion and attainment measures: ILR SN14 for 2018/19, 2017/16 and 2016/17. Learning Aims from the autumn school census relating to education completed in 2018/19, 2017/18 and 2016/17 academic years for retention and completion measures. School census funding relating to education completed in 2018/19, 2017/18 and 2016/17 academic years for retention and completion measures. Students’ exams in the 16-18 phase, and prior exams for all subjects (for GCSE and KS4 prior attainment for value added progress models), and just English and/or maths for the English and maths progress measures: awarding organisation data for 2018/19 and earlier.

101
© Crown copyright 2019
This document/publication (not including logos) is licensed under the terms of the Open Government Licence v3.0 except where otherwise stated. Where we have identified any third party copyright information you will need to obtain permission from the copyright holders concerned.
To view this licence: visit www.nationalarchives.gov.uk/doc/open-government-licence/version/3 email [email protected] write to Information Policy Team, The National Archives, Kew, London, TW9 4DU
About this publication:
enquiries [email protected]
Reference: DFE-00295-2018
Follow us on Twitter: @educationgovuk
Like us on Facebook: facebook.com/educationgovuk


