FOR LEASE Shop Space - LoopNetimages1.loopnet.com/d2/_37TTSzO7LDPlin26g_ci2...El Rancho Grande ±...
7
505 878 0001 www.gotspaceusa.com The information contained is believed reliable. While we do not doubt the accuracy, we have not verified it and make no guarantee, warranty or representation about it. It is your responsibility to independently confirm its accuracy and completeness. Any projection, opinion, assumption or estimated uses are for example only and do not represent the current or future performance of the property. The value of this transaction to you depends on many factors which should be evaluated by your tax, financial, and legal counsel. You and your counsel should conduct a careful independent investigation of the property to determine that it is suitable to your needs. Property Features • Join 320,000 SF of existing retail space • Significant intersection in Southwest Albuquerque • Regional location that draws from core population • Proven fashion and retail success in trade area Las Estancias Keith Meyer, CCIM, SIOR 505 878 0009 | [email protected] Clayton King 505 263 8531 | [email protected] FOR LEASE Shop Space Retail Thalia Toha 505 415 3104 | [email protected] Randall Parish 505 338 4110 | [email protected] SEC Coors Blvd. & Rio Bravo Blvd. Albuquerque, New Mexico
Transcript of FOR LEASE Shop Space - LoopNetimages1.loopnet.com/d2/_37TTSzO7LDPlin26g_ci2...El Rancho Grande ±...

505 878 0001 www.gotspaceusa.comThe information contained is believed reliable. While we do not doubt the accuracy, we have not verified it and make no guarantee, warranty or representation about it. It is your responsibility to independently confirm its accuracy and completeness. Any projection, opinion, assumption or estimated uses are for example only and do not represent the current or future performance of the property. The value of this transaction to you depends on many factors which should be evaluated by your tax, financial, and legal counsel. You and your counsel should conduct a careful independent investigation of the property to determine that it is suitable to your needs.
Property Features• Join 320,000 SF of
existing retail space
• Significant intersection in Southwest Albuquerque
• Regional location that draws from core population
• Proven fashion and retail success in trade area
Las Estancias
Keith Meyer, CCIM, SIOR505 878 0009 | [email protected]
Clayton King505 263 8531 | [email protected]
FOR LEASE
Shop Space Retail
Thalia Toha505 415 3104 | [email protected]
Randall Parish505 338 4110 | [email protected]
SEC Coors Blvd. & Rio Bravo Blvd. Albuquerque, New Mexico

505 878 0001 www.gotspaceusa.comThe information contained is believed reliable. While we do not doubt the accuracy, we have not verified it and make no guarantee, warranty or representation about it. It is your responsibility to independently confirm its accuracy and completeness. Any projection, opinion, assumption or estimated uses are for example only and do not represent the current or future performance of the property. The value of this transaction to you depends on many factors which should be evaluated by your tax, financial, and legal counsel. You and your counsel should conduct a careful independent investigation of the property to determine that it is suitable to your needs.
Interested Parties
Interested Parties
Leslie’s Nails
Interested Parties
8a15
,000
SF
8b20
,000
SF
8c
40,0
00 S
F
8d15
,000
SF
8e10
,000
SF
8f15
,000
SF
215,500 SF
207,500 SF
26,
200
SF
4d Shops6,000 SF 5
7,500 SF7
7,500 SF
Coors Blvd.
Rio
Brav
o Bl
vd.
Denn
is C
have
z Bl
vd.
Las Estancias Coors Blvd. & Rio Bravo Blvd. | Albuquerque, NM
5,000 SF
Designated Community Space
Conceptual site plan, subject to change.
9,00
0 SF
Loris Dr.
Lamonica Rd.
Not a Part
196,000 SF
MDG: 505.858.0001
Completed Lease LOI InterestLease Negotiations Available
SITE KEY
11,000 SF
300 Acre Planned Residential Development
Avanzando Development
City of Albuquerque Open Space/Nature Preserve
Proposed FutureSchool
17,700 30,900
21,0
00
17A3,600 SF
S I T E
Available
Las EstanciasSEC Coors Blvd. & Rio Bravo Blvd. Albuquerque, New Mexico
Building-Suite Square Feet4d-1 ±1,500
4d-2 ±1,000
4d-3 ±1,000
4d-4 ±1,0004d-5 ±1,500
Total ±6,000
SHOP SPACE AVAILABLE

505 878 0001 www.gotspaceusa.comThe information contained is believed reliable. While we do not doubt the accuracy, we have not verified it and make no guarantee, warranty or representation about it. It is your responsibility to independently confirm its accuracy and completeness. Any projection, opinion, assumption or estimated uses are for example only and do not represent the current or future performance of the property. The value of this transaction to you depends on many factors which should be evaluated by your tax, financial, and legal counsel. You and your counsel should conduct a careful independent investigation of the property to determine that it is suitable to your needs.
Interested Parties
Interested Parties
Leslie’s Nails
Interested Parties
8a15
,000
SF
8b20
,000
SF
8c
40,0
00 S
F
8d15
,000
SF
8e10
,000
SF
8f15
,000
SF
215,500 SF
207,500 SF
26,
200
SF
4d Shops6,000 SF 5
7,500 SF7
7,500 SF
Coors Blvd.
Rio
Brav
o Bl
vd.
Denn
is C
have
z Bl
vd.
Las Estancias Coors Blvd. & Rio Bravo Blvd. | Albuquerque, NM
5,000 SF
Designated Community Space
Conceptual site plan, subject to change.
9,00
0 SF
Loris Dr.
Lamonica Rd.
Not a Part
196,000 SF
MDG: 505.858.0001
Completed Lease LOI InterestLease Negotiations Available
SITE KEY
11,000 SF
300 Acre Planned Residential Development
Avanzando Development
City of Albuquerque Open Space/Nature Preserve
Proposed FutureSchool
17,700 30,900
21,0
00
17A3,600 SF
S I T E
Suite
4d-
1±
1,50
0 SF
Suite
4d-
2±
1,00
0 SF
Suite
4d-
3±
1,00
0 SF
Suite
4d-
4±
1,00
0 SF
Suite
4d-
5±
1,50
0 SF
Available
Las EstanciasSEC Coors Blvd. & Rio Bravo Blvd. Albuquerque, New Mexico
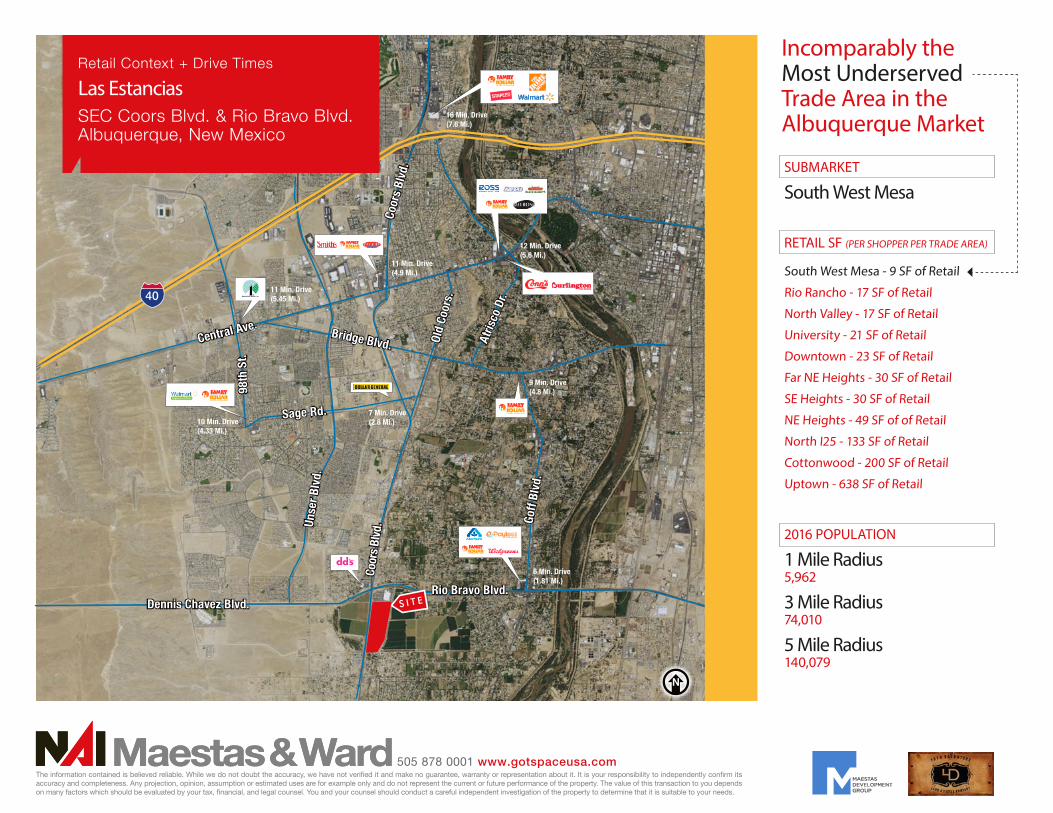
Location Advantages
• Coors Blvd. is the highest traveled North/South thoroughfare
on the Westside
• Rio Bravo Blvd. is one of the seven river crossings linking the
Eastside to Westside
• 10,000+ weekly shoppers at adjacent top performing
Walmart Supercenter
• Nearest significant retail cluster is Coors Blvd & 1-40; a 16
minute drive time and 6.8 miles in distance each way
• 80 Acre project with the first phase open and operating
• Underserved trade area in need of retail, medical, schools,
institutional, entertainment and community services
• 9 square feet of existing retail space per person in Trade Area;
City average is 45 square feet per person
• Regional location that draws from a core population base of
140,079 (2016) in a five mile radius
Floor Plan

505 878 0001 www.gotspaceusa.comThe information contained is believed reliable. While we do not doubt the accuracy, we have not verified it and make no guarantee, warranty or representation about it. It is your responsibility to independently confirm its accuracy and completeness. Any projection, opinion, assumption or estimated uses are for example only and do not represent the current or future performance of the property. The value of this transaction to you depends on many factors which should be evaluated by your tax, financial, and legal counsel. You and your counsel should conduct a careful independent investigation of the property to determine that it is suitable to your needs.
Existing Development
Las EstanciasSEC Coors Blvd. & Rio Bravo Blvd. Albuquerque, New Mexico

505 878 0001 www.gotspaceusa.comThe information contained is believed reliable. While we do not doubt the accuracy, we have not verified it and make no guarantee, warranty or representation about it. It is your responsibility to independently confirm its accuracy and completeness. Any projection, opinion, assumption or estimated uses are for example only and do not represent the current or future performance of the property. The value of this transaction to you depends on many factors which should be evaluated by your tax, financial, and legal counsel. You and your counsel should conduct a careful independent investigation of the property to determine that it is suitable to your needs.
Las Estancias Community ContextCoors Blvd. & Rio Bravo Blvd. | Albuquerque, NMMDG: 505.858.0001
Rio Bravo Blvd.Dennis Chavez Blvd.
Lamonica Rd.
Coors Blvd.
Unser Blvd.
City of AlbuquerqueOpen Space/Nature Preserve
AMAFCA Storm Water Aquifer
Atrisco Heritage High School(±2,600 Students - Opened 2010)
Anderson Hills Development
El Rancho Grande±3,000 Homes
Westgate Neighborhood
Stinson TowerNeighborhood
300 Acre PlannedResidential Development
SalazarNeighborhood
Coors Blvd.
CPD 24,100
CPD 22,000
CPD 30,900
Las Estancias
AvanzandoDevelopment
Conceptual site plan, subject to change.
Rudolf AnayaElementary School
Location Overview
Las EstanciasSEC Coors Blvd. & Rio Bravo Blvd. Albuquerque, New Mexico
Las Estancias - A Premier Development SERVING an UNDERSERVED Area
505 878 0001 www.gotspaceusa.comThe information contained is believed reliable. While we do not doubt the accuracy, we have not verified it and make no guarantee, warranty or representation about it. It is your responsibility to independently confirm its accuracy and completeness. Any projection, opinion, assumption or estimated uses are for example only and do not represent the current or future performance of the property. The value of this transaction to you depends on many factors which should be evaluated by your tax, financial, and legal counsel. You and your counsel should conduct a careful independent investigation of the property to determine that it is suitable to your needs.
Central Ave.
Dennis Chavez Blvd.
Coor
s Bl
vd.
Bridge Blvd.
S I T E
98th
St.
Unse
r Blv
d.
Coor
s Bl
vd.
Sage Rd.
Goff
Blv
d.
Rio Bravo Blvd.
Atris
co D
r.
Old
Coor
s.
16 Min. Drive (7.6 Mi.)
12 Min. Drive (5.6 Mi.)
11 Min. Drive (4.9 Mi.)
10 Min. Drive (4.33 Mi.)
9 Min. Drive (4.8 Mi.)
6 Min. Drive (1.81 Mi.)
7 Min. Drive (2.8 Mi.)
RETAIL SF (PER SHOPPER PER TRADE AREA)
South West Mesa - 9 SF of Retail
Rio Rancho - 17 SF of Retail North Valley - 17 SF of Retail
University - 21 SF of Retail
Downtown - 23 SF of Retail
Far NE Heights - 30 SF of Retail
SE Heights - 30 SF of Retail
NE Heights - 49 SF of of Retail
North I25 - 133 SF of Retail
Cottonwood - 200 SF of Retail
Uptown - 638 SF of Retail
SUBMARKET
South West Mesa
11 Min. Drive (5.45 Mi.)
Incomparably the Most Underserved Trade Area in the Albuquerque Market
40
2016 POPULATION
1 Mile Radius 5,962
3 Mile Radius 74,010
5 Mile Radius 140,079
Retail Context + Drive Times
Las EstanciasSEC Coors Blvd. & Rio Bravo Blvd. Albuquerque, New Mexico
505 878 0001 www.gotspaceusa.comThe information contained is believed reliable. While we do not doubt the accuracy, we have not verified it and make no guarantee, warranty or representation about it. It is your responsibility to independently confirm its accuracy and completeness. Any projection, opinion, assumption or estimated uses are for example only and do not represent the current or future performance of the property. The value of this transaction to you depends on many factors which should be evaluated by your tax, financial, and legal counsel. You and your counsel should conduct a careful independent investigation of the property to determine that it is suitable to your needs.
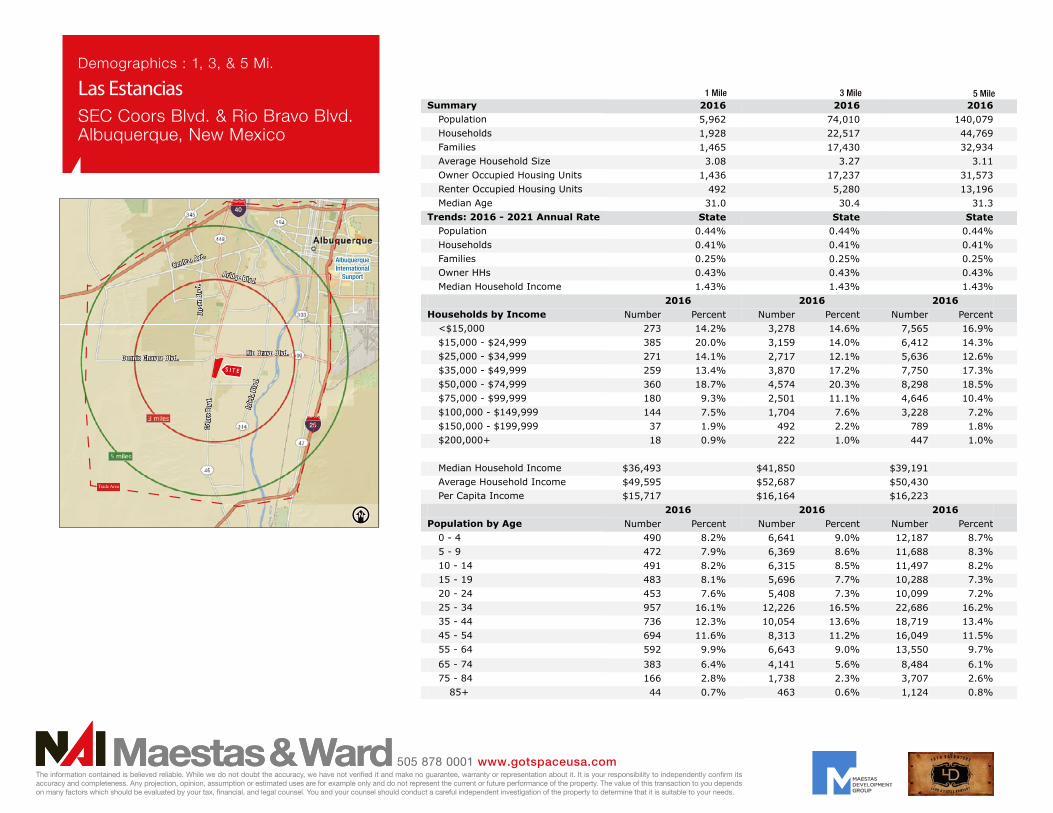
1 Mile 3 Mile 5 Mile
Demographic and Income Profile3500 Coors Blvd SW, Albuquerque, New Mexico, 87121 6 Prepared by Esri3500 Coors Blvd SW, Albuquerque, New Mexico, 87121 Latitude: 35.02597Ring: 1 mile radius Longitude: -106.71405
Summary Census 2010 2016 2021Population 6,101 5,962 5,907Households 1,972 1,928 1,910Families 1,518 1,465 1,441Average Household Size 3.08 3.08 3.08Owner Occupied Housing Units 1,519 1,436 1,429Renter Occupied Housing Units 453 492 481Median Age 30.0 31.0 32.5
Trends: 2016 - 2021 Annual Rate Area State NationalPopulation -0.19% 0.44% 0.84%Households -0.19% 0.41% 0.79%Families -0.33% 0.25% 0.72%Owner HHs -0.10% 0.43% 0.73%Median Household Income 2.19% 1.43% 1.86%
2016 2021 Households by Income Number Percent Number Percent
<$15,000 273 14.2% 252 13.2%$15,000 - $24,999 385 20.0% 420 22.0%$25,000 - $34,999 271 14.1% 194 10.2%$35,000 - $49,999 259 13.4% 199 10.4%$50,000 - $74,999 360 18.7% 438 22.9%$75,000 - $99,999 180 9.3% 189 9.9%$100,000 - $149,999 144 7.5% 155 8.1%$150,000 - $199,999 37 1.9% 43 2.3%$200,000+ 18 0.9% 20 1.0%
Median Household Income $36,493 $40,676Average Household Income $49,595 $53,584Per Capita Income $15,717 $16,988
Census 2010 2016 2021 Population by Age Number Percent Number Percent Number Percent
0 - 4 522 8.6% 490 8.2% 482 8.2%5 - 9 531 8.7% 472 7.9% 446 7.5%10 - 14 529 8.7% 491 8.2% 459 7.8%15 - 19 521 8.5% 483 8.1% 448 7.6%20 - 24 481 7.9% 453 7.6% 405 6.9%25 - 34 888 14.5% 957 16.1% 961 16.3%35 - 44 789 12.9% 736 12.3% 786 13.3%45 - 54 787 12.9% 694 11.6% 641 10.8%55 - 64 543 8.9% 592 9.9% 611 10.3%65 - 74 335 5.5% 383 6.4% 424 7.2%75 - 84 140 2.3% 166 2.8% 201 3.4%
85+ 38 0.6% 44 0.7% 44 0.7%Census 2010 2016 2021
Race and Ethnicity Number Percent Number Percent Number PercentWhite Alone 3,351 54.9% 3,221 54.0% 3,172 53.7%Black Alone 129 2.1% 125 2.1% 124 2.1%American Indian Alone 131 2.1% 136 2.3% 141 2.4%Asian Alone 43 0.7% 47 0.8% 50 0.8%Pacific Islander Alone 12 0.2% 10 0.2% 10 0.2%Some Other Race Alone 2,197 36.0% 2,182 36.6% 2,168 36.7%Two or More Races 238 3.9% 240 4.0% 242 4.1%
Hispanic Origin (Any Race) 4,953 81.2% 4,904 82.3% 4,916 83.2%Data Note: Income is expressed in current dollars.
Source: U.S. Census Bureau, Census 2010 Summary File 1. Esri forecasts for 2016 and 2021.
August 03, 2016
©2016 Esri Page 1 of 6
Demographic and Income Profile3500 Coors Blvd SW, Albuquerque, New Mexico, 87121 6 Prepared by Esri3500 Coors Blvd SW, Albuquerque, New Mexico, 87121 Latitude: 35.02597Ring: 3 mile radius Longitude: -106.71405
Summary Census 2010 2016 2021Population 71,070 74,010 75,495Households 21,733 22,517 22,916Families 17,022 17,430 17,629Average Household Size 3.25 3.27 3.28Owner Occupied Housing Units 17,145 17,237 17,564Renter Occupied Housing Units 4,588 5,280 5,353Median Age 29.1 30.4 31.2
Trends: 2016 - 2021 Annual Rate Area State NationalPopulation 0.40% 0.44% 0.84%Households 0.35% 0.41% 0.79%Families 0.23% 0.25% 0.72%Owner HHs 0.38% 0.43% 0.73%Median Household Income 1.24% 1.43% 1.86%
2016 2021 Households by Income Number Percent Number Percent
<$15,000 3,278 14.6% 3,292 14.4%$15,000 - $24,999 3,159 14.0% 3,450 15.1%$25,000 - $34,999 2,717 12.1% 2,232 9.7%$35,000 - $49,999 3,870 17.2% 3,525 15.4%$50,000 - $74,999 4,574 20.3% 4,924 21.5%$75,000 - $99,999 2,501 11.1% 2,730 11.9%$100,000 - $149,999 1,704 7.6% 1,894 8.3%$150,000 - $199,999 492 2.2% 613 2.7%$200,000+ 222 1.0% 257 1.1%
Median Household Income $41,850 $44,501Average Household Income $52,687 $56,331Per Capita Income $16,164 $17,235
Census 2010 2016 2021 Population by Age Number Percent Number Percent Number Percent
0 - 4 6,558 9.2% 6,641 9.0% 6,827 9.0%5 - 9 6,626 9.3% 6,369 8.6% 6,455 8.6%10 - 14 6,333 8.9% 6,315 8.5% 6,351 8.4%15 - 19 5,957 8.4% 5,696 7.7% 5,761 7.6%20 - 24 5,245 7.4% 5,408 7.3% 4,878 6.5%25 - 34 11,438 16.1% 12,226 16.5% 12,427 16.5%35 - 44 9,418 13.3% 10,054 13.6% 11,130 14.7%45 - 54 8,506 12.0% 8,313 11.2% 7,739 10.3%55 - 64 5,886 8.3% 6,643 9.0% 6,772 9.0%65 - 74 3,104 4.4% 4,141 5.6% 4,622 6.1%75 - 84 1,586 2.2% 1,738 2.3% 2,024 2.7%
85+ 413 0.6% 463 0.6% 508 0.7%Census 2010 2016 2021
Race and Ethnicity Number Percent Number Percent Number PercentWhite Alone 40,919 57.6% 41,899 56.6% 42,443 56.2%Black Alone 1,690 2.4% 1,739 2.3% 1,760 2.3%American Indian Alone 2,094 2.9% 2,313 3.1% 2,473 3.3%Asian Alone 497 0.7% 558 0.8% 602 0.8%Pacific Islander Alone 50 0.1% 43 0.1% 42 0.1%Some Other Race Alone 22,809 32.1% 24,221 32.7% 24,833 32.9%Two or More Races 3,010 4.2% 3,237 4.4% 3,342 4.4%
Hispanic Origin (Any Race) 57,968 81.6% 61,144 82.6% 63,128 83.6%Data Note: Income is expressed in current dollars.
Source: U.S. Census Bureau, Census 2010 Summary File 1. Esri forecasts for 2016 and 2021.
August 03, 2016
©2016 Esri Page 3 of 6
Demographic and Income Profile3500 Coors Blvd SW, Albuquerque, New Mexico, 87121 6 Prepared by Esri3500 Coors Blvd SW, Albuquerque, New Mexico, 87121 Latitude: 35.02597Ring: 5 mile radius Longitude: -106.71405
Summary Census 2010 2016 2021Population 136,503 140,079 142,536Households 43,912 44,769 45,421Families 32,717 32,934 33,185Average Household Size 3.09 3.11 3.12Owner Occupied Housing Units 32,064 31,573 32,026Renter Occupied Housing Units 11,848 13,196 13,396Median Age 30.1 31.3 32.1
Trends: 2016 - 2021 Annual Rate Area State NationalPopulation 0.35% 0.44% 0.84%Households 0.29% 0.41% 0.79%Families 0.15% 0.25% 0.72%Owner HHs 0.29% 0.43% 0.73%Median Household Income 0.91% 1.43% 1.86%
2016 2021 Households by Income Number Percent Number Percent
<$15,000 7,565 16.9% 7,606 16.7%$15,000 - $24,999 6,412 14.3% 6,961 15.3%$25,000 - $34,999 5,636 12.6% 4,596 10.1%$35,000 - $49,999 7,750 17.3% 7,322 16.1%$50,000 - $74,999 8,298 18.5% 8,861 19.5%$75,000 - $99,999 4,646 10.4% 5,026 11.1%$100,000 - $149,999 3,228 7.2% 3,568 7.9%$150,000 - $199,999 789 1.8% 974 2.1%$200,000+ 447 1.0% 509 1.1%
Median Household Income $39,191 $41,008Average Household Income $50,430 $53,731Per Capita Income $16,223 $17,226
Census 2010 2016 2021 Population by Age Number Percent Number Percent Number Percent
0 - 4 12,227 9.0% 12,187 8.7% 12,433 8.7%5 - 9 12,269 9.0% 11,688 8.3% 11,766 8.3%10 - 14 11,463 8.4% 11,497 8.2% 11,591 8.1%15 - 19 11,023 8.1% 10,288 7.3% 10,464 7.3%20 - 24 9,926 7.3% 10,099 7.2% 9,133 6.4%25 - 34 21,605 15.8% 22,686 16.2% 22,833 16.0%35 - 44 17,886 13.1% 18,719 13.4% 20,607 14.5%45 - 54 16,774 12.3% 16,049 11.5% 14,927 10.5%55 - 64 12,262 9.0% 13,550 9.7% 13,630 9.6%65 - 74 6,548 4.8% 8,484 6.1% 9,684 6.8%75 - 84 3,482 2.6% 3,707 2.6% 4,264 3.0%
85+ 1,037 0.8% 1,124 0.8% 1,203 0.8%Census 2010 2016 2021
Race and Ethnicity Number Percent Number Percent Number PercentWhite Alone 78,042 57.2% 78,727 56.2% 79,545 55.8%Black Alone 3,258 2.4% 3,283 2.3% 3,303 2.3%American Indian Alone 4,349 3.2% 4,665 3.3% 4,943 3.5%Asian Alone 967 0.7% 1,101 0.8% 1,202 0.8%Pacific Islander Alone 102 0.1% 90 0.1% 88 0.1%Some Other Race Alone 43,869 32.1% 45,966 32.8% 47,029 33.0%Two or More Races 5,916 4.3% 6,247 4.5% 6,426 4.5%
Hispanic Origin (Any Race) 110,068 80.6% 114,549 81.8% 118,021 82.8%Data Note: Income is expressed in current dollars.
Source: U.S. Census Bureau, Census 2010 Summary File 1. Esri forecasts for 2016 and 2021.
August 03, 2016
©2016 Esri Page 5 of 6
S I T E
25
40Co
ors
Blvd
.
Rio Bravo Blvd.
Isle
ta B
lvd.
Unse
r Blv
d.
Central Ave.
Dennis Chavez Blvd.
Bridge Blvd.
AlbuquerqueInternational
Sunport
Trade Area
Demographics : 1, 3, & 5 Mi.
Las EstanciasSEC Coors Blvd. & Rio Bravo Blvd. Albuquerque, New Mexico