FOR IMMEDIATE RELEASE BANK OF MONTREAL REPORTS FIRST ...
25
1 FOR IMMEDIATE RELEASE BANK OF MONTREAL REPORTS FIRST QUARTER 2002 RESULTS Operating Highlights •= Net Income of $372 Million, Diluted Cash EPS of $0.75 and Diluted EPS of $0.71 •= Solid Growth in Retail Revenues in Canada and U.S. •= New Impaired Loan Formations Lowest Since Fiscal 2000, Down 31 Per Cent from Q4 and Provisions for Credit Losses in Line with Guidance •= Investment Banking Group Net Income Holds Up in Difficult Markets •= CSFBdirect Acquisition Closed on February 4 th as Planned, with High Customer Retention •= Expense Growth Declines •= As Previously Announced, Dividends Increase for 10 th Straight Year Financial Highlights ($ millions, except per share data and as noted) Q1-2002 Reported Revenues (teb) 2,205 $ 12 $ 1% 254 $ 13% Provision for credit losses 180 $ 80 $ 80% (366) $ (67%) Non-interest expenses 1,462 $ 65 $ 5% 13 $ 1% Net income 372 $ (44) $ (10%) 368 $ +100% Return on equity 14.5% (0.8%) 14.9% Cash return on equity 15.2% (1.0%) 14.5% Earnings per share - diluted 0.71 $ (0.02) $ (3%) 0.71 $ 100% Cash earnings per share - diluted 0.75 $ (0.02) $ (3%) 0.69 $ +100% Excluding non-recurring items (refer to page 9) Revenues (teb) 2,205 $ 56 $ 3% 76 $ 4% Provision for credit losses 180 $ 80 $ 80% (366) $ (67%) Non-interest expenses 1,462 $ 65 $ 5% 13 $ 1% Net income 372 $ (31) $ (8%) 263 $ +100% Return on equity 14.5% (0.3%) 10.7% Cash return on equity 15.2% (0.5%) 10.4% Earnings per share - diluted 0.71 $ 0.01 $ 1% 0.52 $ +100% Cash earnings per share - diluted 0.75 $ - $ - 0.50 $ +100% vs. Q1-2001 vs. Q4-2001 Increase/(Decrease) Increase/(Decrease) Montreal, February 26, 2002 – Bank of Montreal reported net income of $372 million and diluted earnings per share of $0.71 for its first quarter ended January 31, 2002, compared with net income of $416 million and diluted earnings per share of $0.73 in the first quarter of last year. Excluding non-recurring items in the first quarter of last year, net income was down $31 million; however, because of the favourable effect of last year’s share buyback programs, returns to shareholders improved as diluted earnings per share increased by $0.01. Compared to the fourth quarter of 2001, results of each of the operating groups improved significantly as the Bank’s net income increased $368 million. Net income in the fourth quarter was affected by a sharp deterioration in economic conditions, prompting higher provisions for credit losses and write-downs totalling
Transcript of FOR IMMEDIATE RELEASE BANK OF MONTREAL REPORTS FIRST ...

1
FOR IMMEDIATE RELEASE BANK OF MONTREAL REPORTS FIRST QUARTER 2002 RESULTS Operating Highlights
• = Net Income of $372 Million, Diluted Cash EPS of $0.75 and Diluted EPS of $0.71
• = Solid Growth in Retail Revenues in Canada and U.S.
• = New Impaired Loan Formations Lowest Since Fiscal 2000, Down 31 Per Cent from Q4 and Provisions for Credit Losses in Line with Guidance
• = Investment Banking Group Net Income Holds Up in Difficult Markets
• = CSFBdirect Acquisition Closed on February 4th as Planned, with High Customer Retention
• = Expense Growth Declines
• = As Previously Announced, Dividends Increase for 10th Straight Year Financial Highlights
($ millions, except per share data and as noted) Q1-2002
Reported
Revenues (teb) 2,205$ 12$ 1% 254$ 13%Provision for credit losses 180$ 80$ 80% (366)$ (67%)Non-interest expenses 1,462$ 65$ 5% 13$ 1%Net income 372$ (44)$ (10%) 368$ +100%Return on equity 14.5% (0.8%) 14.9%Cash return on equity 15.2% (1.0%) 14.5%Earnings per share - diluted 0.71$ (0.02)$ (3%) 0.71$ 100%Cash earnings per share - diluted 0.75$ (0.02)$ (3%) 0.69$ +100%
Excluding non-recurring items (refer to page 9)
Revenues (teb) 2,205$ 56$ 3% 76$ 4%Provision for credit losses 180$ 80$ 80% (366)$ (67%)Non-interest expenses 1,462$ 65$ 5% 13$ 1%Net income 372$ (31)$ (8%) 263$ +100%Return on equity 14.5% (0.3%) 10.7%Cash return on equity 15.2% (0.5%) 10.4%Earnings per share - diluted 0.71$ 0.01$ 1% 0.52$ +100%Cash earnings per share - diluted 0.75$ -$ - 0.50$ +100%
vs. Q1-2001 vs. Q4-2001Increase/(Decrease) Increase/(Decrease)
Montreal, February 26, 2002 – Bank of Montreal reported net income of $372 million and diluted earnings per share of $0.71 for its first quarter ended January 31, 2002, compared with net income of $416 million and diluted earnings per share of $0.73 in the first quarter of last year. Excluding non-recurring items in the first quarter of last year, net income was down $31 million; however, because of the favourable effect of last year’s share buyback programs, returns to shareholders improved as diluted earnings per share increased by $0.01. Compared to the fourth quarter of 2001, results of each of the operating groups improved significantly as the Bank’s net income increased $368 million. Net income in the fourth quarter was affected by a sharp deterioration in economic conditions, prompting higher provisions for credit losses and write-downs totalling
2
$682 million. Excluding non-recurring items in the fourth quarter, net income increased $263 million and diluted earnings per share increased $0.52 to $0.71 this quarter. “Results reflect a solid quarter and a good start to the year,” said Tony Comper, Chairman and Chief Executive Officer, Bank of Montreal. “Loan losses were up compared to the first quarter of 2001, but are expected to decrease for the full year. Taking this into account, financial performance is on the upswing.” Even though the Bank’s provisions for credit losses in fiscal 2002 are expected to be lower than for fiscal 2001, year-over-year quarterly comparisons are affected because the provision in the first quarter of last year was low relative to later quarters due to the subsequent deterioration in economic conditions. “While a lot of work lies ahead in continuing to improve performance,” Mr. Comper added, “I am particularly encouraged by the solid growth in personal and commercial banking volumes in both Canada and the U.S.” • = Solid Growth in Retail Revenues in Canada and U.S.
Personal and Commercial Client Group performance improved from the first quarter of last year due to solid volume growth in Canada and continued strong growth in the United States, where volume growth was further enhanced by last year’s acquisition of First National Bank of Joliet (Joliet). In Canada, the premium rate savings product has attracted many new customers and positions the Group for improved profitability when interest rates rise.
• = New Impaired Loan Formations Lowest Since Fiscal 2000, Down 31 Per Cent from Q4 and Provisions for Credit Losses in Line with Guidance New impaired loan formations in the quarter were the lowest since fiscal 2000 and were down 31 per cent from the fourth quarter. The increase in this quarter’s provision for credit losses relative to the first quarter of last year is largely reflective of timing, as required quarterly provisions increased substantially over the course of fiscal 2001 as economic conditions deteriorated. Net income in the first quarter of 2002 would have been higher than in the first quarter of last year were it not for higher provisions for credit losses this quarter. However, provisions for the quarter and anticipated provisions for the year remain in line with the guidance provided at the end of last year. Provisions for credit losses allocated to the banking groups are based on expected losses over an economic cycle and the timing differences between expected loss provisions and required provisions under Generally Accepted Accounting Principles (GAAP) are allocated to the Corporate Support Group.
• = Investment Banking Group Results Hold Up in Difficult Markets Investment Banking Group net income rose from last year due to reduced expenses and continued momentum in interest rate-sensitive businesses. However, uncertain economic conditions continue to affect the Group’s fee-based businesses.
• = CSFBdirect Acquisition Closed on February 4th as Planned, with High Customer Retention Private Client Group announced the acquisition of CSFBdirect on November 28, 2001. The transaction, which closed on February 4, 2002, represents another significant step in our selective and substantial expansion into the United States and brings Bank of Montreal closer to becoming a truly transnational bank. We are pleased with the CSFBdirect integration process to date, which leverages the Group’s successful experience with its four previous acquisitions and includes proactive client communications. Client retention has been strong.
• = Expense Growth Rate Declines Expense growth in the first quarter of 2002, while currently greater than revenue growth, was much improved from a year ago. Expense management initiatives continue to be implemented and the full impact of these actions is expected to be even more apparent in the latter half of the year.
• = Private Client Group Well Positioned for Return to More Favourable Market Conditions Private Client Group net income improved year-over-year and rebounded from the fourth quarter, even though challenging market conditions continue to affect trading volumes. The Group remains focused on its
3
long-term growth strategy of expanding its distribution network and is well positioned for a return to more favourable market conditions.
Operating Group Net Income
($ millions, except as noted) Q1-2002
Reported
Personal and Commercial Client Group 226$ 21$ 10% 28$ 14%Private Client Group 37 5 14% 28 +100%Investment Banking Group 172 3 2% 285 +100%Corporate Support, including Emfisys (63) (73) (+100%) 27 30%Bank of Montreal 372$ (44)$ (10%) 368$ +100%
Excluding non-recurring items (refer to page 9)
Personal and Commercial Client Group 226$ 26$ 13% 28$ 14%Private Client Group 37 5 14% 28 +100%Investment Banking Group 172 3 2% 180 +100%Corporate Support, including Emfisys (63) (65) (+100%) 27 30%Bank of Montreal 372$ (31)$ (8%) 263$ +100%
vs. Q1-2001 vs. Q4-2001Increase/(Decrease) Increase/(Decrease)
Annual Targets for 2002, Excluding Non-Recurring Items Performance to January 31, 2002
• = Achieve cash EPS growth of 8 to 12 per cent, with the first six months EPS comparable to the same period last year.
Unchanged from last year at $0.75
• = Achieve a cash ROE of 14 to 15 per cent. 15.2 per cent annualized • = Maintain a provision for credit losses in the range of 40 to 50 basis
points of average net loans and acceptances (including securities purchased under resale agreements).
49 basis points annualized
• = Maintain a Tier 1 capital ratio of at least 8.0 per cent. 8.9 per cent 2002 Outlook Unchanged The Bank’s outlook for fiscal 2002 continues to anticipate cash earnings per share for the first six months to approximate comparable amounts for the first six months of 2001, excluding non-recurring items. The outlook also continues to anticipate that, excluding non-recurring items, cash earnings per share growth in the second six months will improve from the first half of the year. The outlook for the year now anticipates that the provision for credit losses will remain at the high end of the 40 to 50 basis point target range. As anticipated at the end of last year, the Canadian and U.S. economies are expected to gradually strengthen over the balance of this year following a short and shallow downturn in 2001. Highly stimulative monetary and fiscal policies are expected to provide ongoing support to consumer spending, while housing activity should remain elevated in the face of low mortgage rates. Inventory rebuilding is anticipated to complement the expansion. The unemployment rate should begin trending down in the spring. Interest rates in Canada and the United States are expected to remain relatively stable in the first half of the calendar year as central banks will likely be reluctant to tighten policy in the face of tame inflation, excess capacity and still emerging economic growth. However, as the recovery gathers momentum and absorbs the slack in the economy, interest rates may increase in the second half of the year. It is likely that capital markets activity will increase with a strengthening economy. Note on Performance Analysis Management and certain of the Bank’s stakeholders believe that performance analysis is enhanced by focusing on cash results and results excluding non-recurring items. These adjustments and their effects are outlined on page 9. Securities regulators require that corporations caution readers that earnings as adjusted for such items do not have standardized meanings under GAAP and are unlikely to be comparable to similar measures used by other companies.

4
Management’s Discussion and Analysis of Results of Operations (MD&A) for the quarter is attached. A more comprehensive discussion of our businesses and strategies and objectives can be found in the MD&A in the Bank’s 2001 Annual Report. Readers are also encouraged to visit the Bank’s web site as indicated below to view other quarterly financial information. Interested investors are invited to join our conference call to review the first quarter’s results on Tuesday February 26, 2002 at 2:00 p.m. (EST). The conference call can be accessed in listen-only mode as follows: Via the Internet: www.bmo.com/investorrelations
Via telephone: Toll free 1-800-213-1351 or From within Toronto 416-641-6678
A replay of the conference call will be available until Friday March 8, 2002 by calling 1-800-558-5253 and quoting reservation number 19963938. A replay of the webcast can be accessed on our web site until May 27, 2002. The news release, quarterly presentations and supplementary financial information package are available on Bank of Montreal’s web site at www.bmo.com/investorrelations and at our offices at 1 First Canadian Place, 18th Floor, Toronto, Ontario. Media Relations Contacts Joe Barbera, Toronto, 416-867-3996 Ronald Monet, Montreal, 514-877-1101
Investor Relations Contacts Susan Payne, Vice President, Investor Relations, [email protected], 416-867-6656 Lynn Inglis, Director, Investor Relations, [email protected], 416-867-5452
Chief Financial Officer Karen Maidment, Executive Vice President and Chief Financial Officer, [email protected], 416-867-6776
CAUTION REGARDING FORWARD-LOOKING STATEMENTS
This news release in respect of earnings for the first quarter of 2002 includes forward-looking statements, which are made pursuant to the ‘safe harbor’ provisions of the United States Private Securities Litigation Reform Act of 1995. These forward-looking statements include, but are not limited to, comments with respect to our objectives, targets, strategies, financial condition, the results of our operations and our businesses, our outlook for our businesses and for the Canadian and U.S. economies, and risk management. By their very nature, forward-looking statements involve numerous assumptions, inherent risks and uncertainties, both general and specific, and the risk that predictions and other forward-looking statements will not prove to be accurate. We caution readers of this document not to place undue reliance on these forward-looking statements as a number of important factors could cause actual future results to differ materially from the plans, objectives, targets, expectations, estimates and intentions expressed in such forward-looking statements. The future outcomes that relate to forward-looking statements may be influenced by the following factors: fluctuations in interest rates and currency values; regulatory developments; statutory changes; the effects of competition in the geographic and business areas in which we operate, including continued pricing pressure on loan and deposit products; and changes in political and economic conditions including, among other things, inflation and technological changes. We caution that the foregoing list of important factors is not exhaustive and that when relying on forward-looking statements to make decisions with respect to Bank of Montreal, investors and others should carefully consider the foregoing factors as well as other uncertainties and potential events. The Bank does not undertake to update any forward-looking statement, whether written or oral, that may be made from time to time by or on behalf of the Bank.

5
FIRST QUARTER 2002 MANAGEMENT’S DISCUSSION AND ANALYSIS OF RESULTS OF OPERATIONS AND FINANCIAL CONDITION (MD&A) OPERATING OVERVIEW Value Measures Annualized ROE for the quarter was 14.5 per cent. Annualized cash ROE of 15.2 per cent was in line with the Bank’s annual target of 14 to 15 per cent. Diluted earnings per share (EPS) declined 2.7 per cent, while diluted cash EPS declined 2.6 per cent from the first quarter of last year. Excluding non-recurring items, diluted EPS growth was 1.4 per cent, while diluted cash EPS was unchanged. The Bank is targeting 8 to 12 per cent cash EPS growth for the year, but had anticipated little change year-over-year in the first six months. Net economic profit was $115 million, compared with $146 million in the first quarter of 2001 and negative $249 million in the fourth quarter of last year. The variances were largely attributable to differences in net income available to common shareholders. Bank of Montreal shareholders earned a return of 7.2 per cent on their common shares in the quarter, less than the average return to shareholders of the major Canadian banks and less than the return on the TSE 300. Net Income Net income for the first quarter of 2002 was $372 million, a decrease of 10 per cent from the first quarter of 2001. Excluding non-recurring items, net income was $31 million lower than in the first quarter of last year. Improved revenues, the discontinuance of goodwill amortization and a more favourable income tax rate were more than offset by increased expenses and a significantly higher provision for credit losses. Net income rose $368 million from the fourth quarter. Excluding non-recurring items, net income rose $263 million. The improvement was largely due to lower provisions for credit losses and investment write-downs. Revenue Bank of Montreal, like most banks, analyzes revenue on a taxable equivalent basis (teb). This basis includes an adjustment that increases GAAP revenues and the provision for income taxes by an amount that adjusts revenues on certain tax-exempt securities to an amount equivalent to what revenues would have been had they been taxed at the statutory rate. The adjustments amounted to $27 million in the current quarter and slightly higher amounts in the first and fourth quarters of last year. Revenue of $2,205 million increased $12 million from the first quarter of last year and $254 million from the fourth quarter. There were no non-recurring items in the current quarter. Excluding non-recurring gains on sales of branches and a gain on sale of a portion of the Bank’s investment in Bancomer in the first quarter of last year, revenue increased $56 million or 2.6 per cent. Excluding the impact of a write-down on the Bank’s equity investment in its own collateralized bond obligations (CBOs) that was categorized as non-recurring for reporting purposes, revenue increased $76 million or 3.5 per cent from the fourth quarter. Net interest income increased $171 million from the first quarter of last year and $87 million from the fourth quarter. Both increases were driven by volume growth in Personal and Commercial Client Group and by improved net interest margins in Investment Banking Group. Net interest margins improved by 26 basis points year-over-year to 2.07 per cent while overall growth in average assets was held to $1.6 billion, notwithstanding growth of $7.7 billion in retail and business banking. Net interest margins improved by 13 basis points from the fourth quarter and average assets increased $1.1 billion overall and $2.7 billion in retail and business banking. Other income decreased $159 million from the prior year, but increased $167 million from the fourth quarter. Excluding non-recurring items in the comparative periods, non-interest revenue declined $115 million from the prior year and $11 million from the fourth quarter. The year-over-year decline was attributable to lower revenue
6
in Investment Banking Group, which more than offset higher revenue in Personal and Commercial Client Group. The decline was largely related to lower trading revenues due to challenging equity market conditions, lower securitization revenues and lower capital markets fees, which more than offset higher banking activity and credit card services revenues. Revenues in the fourth quarter were affected by $252 million of investment write-downs, including $178 million related to the CBOs. Excluding these effects, non-interest revenue decreased $85 million. Higher credit card services fees, due to seasonal factors, and higher securities trading commissions were more than offset by lower trading income, primarily due to decreased equity volumes and client-driven trading opportunities, lower capital market fees, securitization revenues and retail banking fees. Non-Interest Expenses Expenses of $1,462 million increased $65 million or 4.6 per cent from the first quarter of last year. Much of the year-over-year growth was attributable to the effects of acquired businesses, while the stronger U.S. dollar also contributed to the increase. Growth related largely to employee costs, while computer costs also increased. Revenue-based compensation costs declined. Expense growth was limited to $13 million or 0.9 per cent from the fourth quarter, reflective of the benefits of a cost management program designed to better manage expense growth relative to revenue growth. Expense growth was contained in spite of significantly higher revenue-based compensation costs, which were reduced in the fourth quarter because of the impact of the increased provisions for credit losses and write-downs in that period. Professional fees, computer costs and promotional costs declined appreciably. The Bank’s expense management program is intended to reduce expense growth, while increasing revenues. The program’s guidelines are designed to protect customer-related expenses that are essential to increased sales, to protect strategic initiatives designed to promote future growth and to reduce other discretionary costs. Effective this quarter, GAAP no longer requires amortization of goodwill, but instead requires that goodwill be subject to a periodic impairment review to ensure its fair value is equal to or greater than its book value. Goodwill amortization for prior periods is separately disclosed and pursuant to past practice, has not been included in non-interest expenses. The change in accounting increased net income this quarter by $13 million relative to the first quarter of last year and by $15 million relative to the fourth quarter. Income Taxes The provision for income taxes as a percentage of income, excluding non-recurring items, improved year-over-year as a result of lower statutory tax rates and other tax benefits, partially offset by a modest shift in the proportion of income taxed in higher tax rate jurisdictions. Comparability of tax rates relative to the fourth quarter is distorted by the significance of write-downs in that period. The provision for income taxes in the first quarter of last year included a $25 million non-recurring charge related to a proposed reduction in the federal income tax rate and its effect on future tax assets. Balance Sheet Total assets of $239.4 billion were unchanged from October 31, 2001. Cash resources increased $1.2 billion, largely due to an increase in money market activities. Investment securities increased $0.8 billion to $22.3 billion and trading securities increased $3.0 billion to $19.2 billion, largely due to higher holdings of federal government securities in Canada. Unrealized gains on investment securities declined $96 million from year-end due to lower unrealized gains on fixed income securities. Net loans and acceptances decreased $0.8 billion from October 31, 2001. Loans to businesses and governments declined by $3.3 billion because of efforts to exit lower return positions, while residential mortgages increased $1.6 billion. The portfolio remains well diversified with minimal change in the geographic breakdown from October 31, 2001.

7
Other assets decreased $3.7 billion from October 31, 2001. The decrease related to lower unrealized gains and amounts receivable on derivative contracts and to lower amounts due from dealers and brokers. Liabilities declined $0.7 billion from last year-end. Deposits increased by $0.5 billion as deposits from banks, businesses and governments declined by $1.7 billion, while deposits from individuals, which tend to be more stable, increased by $2.2 billion. Deposits from individuals accounted for 45 per cent of total deposits. Securities sold under repurchase agreements increased $2.6 billion and provided much of the funding for higher trading securities positions. Other liabilities declined $4.5 billion due to lower unrealized losses and amounts payable on derivative contracts and lower sundry payables. Risk Management The provision for credit losses totalled $180 million in the quarter, up from $100 million in the first quarter of last year and down from $546 million in the fourth quarter. The provision for the quarter represents an annualized 49 basis points of average net loans and acceptances, including securities purchased under resale agreements. The Bank now expects its annual provision to be at the upper end of its target of 40 to 50 basis points, compared with a provision, excluding non-recurring items, representing 60 basis points in fiscal 2001. In 2001, provisions were increased significantly in the fourth quarter, reflective of recessionary conditions that prevailed in the United States and weakening economic conditions in Canada. The year-over-year increase in the first quarter’s provision and the decline in the quarterly provision relative to the immediately preceding quarter were reflective of developing weakness in the economy over the course of 2001 and the resulting timing of provisioning that year. Net impaired loans totalled $170 million, compared with $65 million at the end of 2001. The ratio of the allowance for credit losses to gross impaired loans was 92.3 per cent, compared with 96.8 per cent at the end of last year. Gross impaired loans were $2,193 million, up from $2,014 million at the end of October. New impaired loan formations totalled $417 million in the quarter, which is in line with expectations at this point in the business cycle, and were down $189 million or 31 per cent from the fourth quarter. Subsequent to the end of the first quarter of 2002, the Bank committed to sell approximately $200 million of impaired loans of companies that have filed for bankruptcy, including: $35 million of $47 million of Enron Corp loans; $24 million of $56 million of Global Crossing Ltd. loans; and $130 million in loans, representing the Bank’s total loan exposure to Pacific Gas & Electric Co. These transactions, which are expected to close during the second quarter, do not impact the Bank’s outlook for the provision for credit losses for fiscal 2002. The Bank's market risk management practices and key measures were outlined on pages 20 and 21 of the 2001 Annual Report. During the quarter, total bank market value exposure, on an after-tax basis, increased slightly from $247 million to $279 million. Twelve-month after-tax earnings volatility decreased from $97 million to $68 million. For trading and underwriting portfolios, the average after-tax market value exposure increased from $13 million in the fourth quarter of 2001 to $23 million this quarter due to the reclassification of certain portfolios for risk management purposes from the structural to the money market/accrual portfolio. For the same reason, after-tax market value exposure for trading and underwriting portfolios at January 31, 2002 was $21 million compared with $14 million on October 31, 2001. The Bank’s liquidity and funding risk management framework and its key measures related to this risk were outlined on page 22 of the Annual Report. The Bank’s core deposit ratio increased to 60.9 per cent from 60.0 per cent at the end of last year, as a result of growth in deposits from individuals. The Bank’s cash and securities-to-total assets ratio increased to 25.2 per cent from 23.1 per cent last year-end, as a result of an increase in trading securities and deposits with banks. Total liquid assets increased $5.1 billion from last year-end to $60.4 billion. Securities pledged as collateral were substantially unchanged from the prior year.

8
Capital Management On December 20, 2001, the Bank issued 12 million 5.95 per cent Non-Cumulative Class B Preferred Shares Series 10 for proceeds of US$300 million. During the quarter, the Bank announced an increase in its quarterly common share dividend from $0.28 to $0.30. Bank of Montreal has now increased its common share dividend for the tenth straight year. The higher annual dividend rate represented a yield of 3.33 per cent at the end of the quarter, the highest of Canada’s major banks. The Tier 1 capital ratio improved to 8.87 per cent from 8.15 per cent at the end of last year. The improvement related to earnings in the period, the preferred share issue and lower risk-weighted asset levels. The ratio is expected to decline in the second quarter as a result of the acquisition of CSFBdirect. Credit Rating The Bank’s credit rating, as measured by a composite of Moody’s and Standard & Poor’s (S&P) senior debt ratings, remains unchanged at AA-, but with S&P maintaining a negative outlook. Following the Bank’s October 26th announcement of investment portfolio write-downs and higher provisions for credit losses in the fourth quarter, S&P announced that it had placed the Bank on ‘CreditWatch with negative implications’ due to concerns over the Bank’s credit quality and outlook for profitability improvement in the medium term. On December 19, 2001, S&P announced that it had removed the Bank’s ratings from ‘CreditWatch’ and affirmed its ratings on the Bank, including the negative outlook, indicating that they were satisfied that the Bank’s credit quality was appropriate for that point in the credit cycle and the Bank’s earnings issues were being addressed.
9
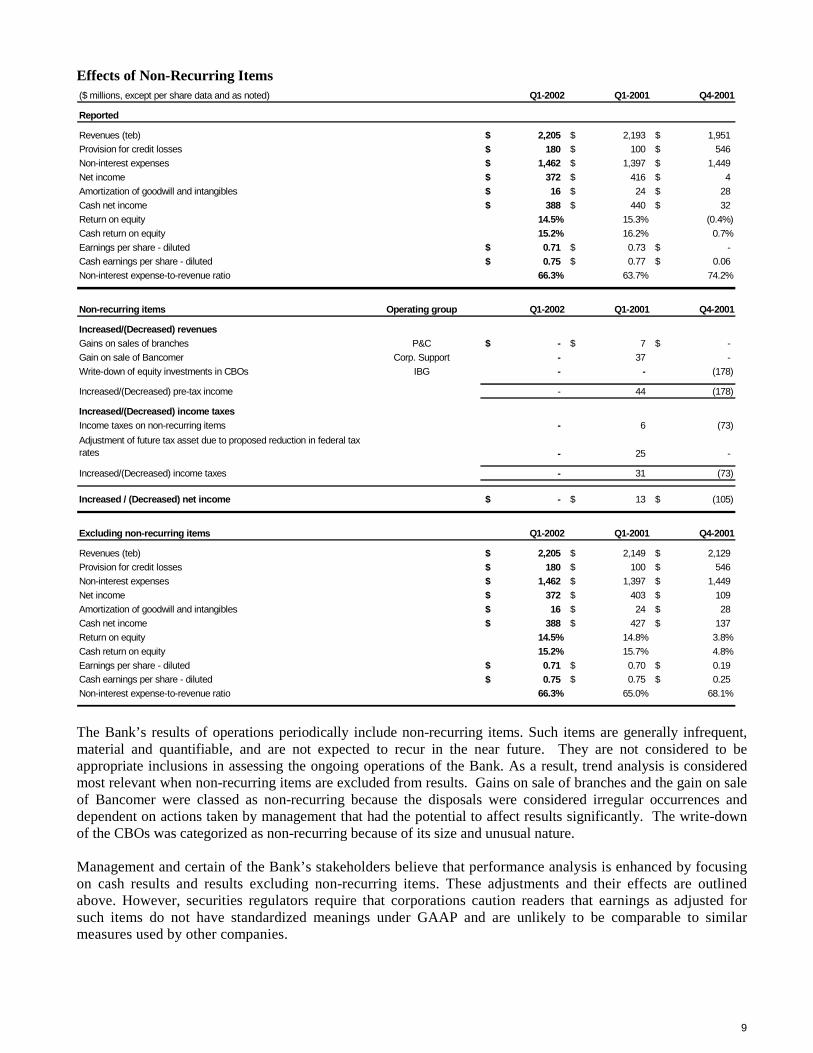
Effects of Non-Recurring Items ($ millions, except per share data and as noted) Q1-2002 Q1-2001 Q4-2001
Reported
Revenues (teb) 2,205$ 2,193$ 1,951$ Provision for credit losses 180$ 100$ 546$ Non-interest expenses 1,462$ 1,397$ 1,449$ Net income 372$ 416$ 4$ Amortization of goodwill and intangibles 16$ 24$ 28$ Cash net income 388$ 440$ 32$ Return on equity 14.5% 15.3% (0.4%)Cash return on equity 15.2% 16.2% 0.7%Earnings per share - diluted 0.71$ 0.73$ -$ Cash earnings per share - diluted 0.75$ 0.77$ 0.06$ Non-interest expense-to-revenue ratio 66.3% 63.7% 74.2%
Non-recurring items Operating group Q1-2002 Q1-2001 Q4-2001
Increased/(Decreased) revenuesGains on sales of branches P&C -$ 7$ -$ Gain on sale of Bancomer Corp. Support - 37 - Write-down of equity investments in CBOs IBG - - (178)
Increased/(Decreased) pre-tax income - 44 (178)
Increased/(Decreased) income taxesIncome taxes on non-recurring items - 6 (73) Adjustment of future tax asset due to proposed reduction in federal tax rates - 25 -
Increased/(Decreased) income taxes - 31 (73)
Increased / (Decreased) net income -$ 13$ (105)$
Excluding non-recurring items Q1-2002 Q1-2001 Q4-2001
Revenues (teb) 2,205$ 2,149$ 2,129$ Provision for credit losses 180$ 100$ 546$ Non-interest expenses 1,462$ 1,397$ 1,449$ Net income 372$ 403$ 109$ Amortization of goodwill and intangibles 16$ 24$ 28$ Cash net income 388$ 427$ 137$ Return on equity 14.5% 14.8% 3.8%Cash return on equity 15.2% 15.7% 4.8%Earnings per share - diluted 0.71$ 0.70$ 0.19$ Cash earnings per share - diluted 0.75$ 0.75$ 0.25$ Non-interest expense-to-revenue ratio 66.3% 65.0% 68.1%
The Bank’s results of operations periodically include non-recurring items. Such items are generally infrequent, material and quantifiable, and are not expected to recur in the near future. They are not considered to be appropriate inclusions in assessing the ongoing operations of the Bank. As a result, trend analysis is considered most relevant when non-recurring items are excluded from results. Gains on sale of branches and the gain on sale of Bancomer were classed as non-recurring because the disposals were considered irregular occurrences and dependent on actions taken by management that had the potential to affect results significantly. The write-down of the CBOs was categorized as non-recurring because of its size and unusual nature. Management and certain of the Bank’s stakeholders believe that performance analysis is enhanced by focusing on cash results and results excluding non-recurring items. These adjustments and their effects are outlined above. However, securities regulators require that corporations caution readers that earnings as adjusted for such items do not have standardized meanings under GAAP and are unlikely to be comparable to similar measures used by other companies.

10
REVIEW OF OPERATING GROUPS PERFORMANCE An analysis of financial results of each operating group is provided, together with some of their business achievements for the first quarter of 2002. A separate analysis of Harris Bank, whose financial results are incorporated within each of the operating groups, is also provided. Periodically, certain business lines and units within the business lines are transferred between client groups to more closely align the Bank’s organizational structure and its strategic priorities. All comparative figures are restated to give effect to the transfers. Note 5 to the attached interim consolidated financial statements outlines how income statement items requiring allocation are distributed among the operating groups, including the allocation of the provision for credit losses, which is discussed more fully on page 16 under Corporate Support. Operating Groups Summary Income Statements and Statistics for Q1-2002
($ millions, except as noted) P&C PCG IBGCorporate,
incl. Emfisys Total Bank
Reported
Net interest income (teb) 812$ 131$ 412$ (67)$ 1,288$ Other income 320 254 215 128 917 Total revenues (teb) 1,132 385 627 61 2,205Provision for credit losses 70 - 56 54 180 Non-interest expense 699 328 297 138 1,462
Income before income taxes, non-controlling interest in subsidiaries and goodwill 363 57 274 (131) 563 Income taxes (teb) 137 20 102 (84) 175 Non-controlling interest in subsidiaries - - - 16 16 Net income Q1-2002 226$ 37$ 172$ (63)$ 372$ Net income Q4-2001 198$ 9$ (113)$ (90)$ 4$ Net income Q1-2001 205$ 32$ 169$ 10$ 416$
Excluding non-recurring items
Net income Q1-2002 226$ 37$ 172$ (63)$ 372$ Net income Q4-2001 198$ 9$ (8)$ (90)$ 109$ Net income Q1-2001 200$ 32$ 169$ 2$ 403$
Other statistics - reported
Net economic profit 126$ 16$ 30$ nm 115$ Cash return on equity 23.8% 16.5% 12.9% nm 15.2%Average common equity 3,750$ 1,037$ 4,832$ nm 9,691$ Average assets 101,839$ 4,997$ 140,272$ nm 246,890$ Full-time equivalent staff 18,093 5,167 2,117 8,978 34,355

11
PERSONAL AND COMMERCIAL CLIENT GROUP
($ millions, except as noted) Q1-2002
Reported
Net interest income (teb) 812$ 51$ 7% 29$ 4%Other income 320 13 4% 9 3%Total revenues (teb) 1,132 64 6% 38 4%Provision for credit losses 70 10 17% (10) (12%)Non-interest expense 699 40 6% 21 3%Income before income taxes, non-controlling interest in subsidiaries and goodwill 363 14 4% 27 8%Income taxes (teb) 137 (2) (2%) 6 4%Non-controlling interest in subsidiaries - - - (1) (50%)Amortization of goodwill, net of income taxes - (5) (100%) (6) (100%)Net income 226$ 21$ 10% 28$ 14%
Cash return on equity 23.8% (3.8%) (0.7%)Average net interest margin 3.16% (0.05%) 0.03%Non-interest expense-to-revenue ratio 61.7% - (0.2%)Average assets 101,839$ 7,747$ 8% 2,651$ 3%
Excluding non-recurring items
Revenues (teb) 1,132$ 71$ 7% 38$ 4%Non-interest expense 699$ 40$ 6% 21$ 3%Net income 226$ 26$ 13% 28$ 14%Cash return on equity 23.8% (3.1%) (0.7%)Non-interest expense-to-revenue ratio 61.7% (0.4%) (0.2%)
vs. Q1-2001 vs. Q4-2001Increase/(Decrease) Increase/(Decrease)
Results Overview Net income of $226 million was higher than in each of the first and fourth quarters of last year. Excluding non-recurring gains on sales of branches last year, net income increased $26 million or 13 per cent from the first quarter of 2001. Net income growth in the United States was particularly strong. The increase in year-over-year net income was driven by revenue growth in Canadian and U.S. retail and business banking, cost containment in Canada and more favourable income tax rates, partially offset by higher provisions for credit losses. The 14 per cent improvement in net income relative to the fourth quarter was driven by revenue growth and cost containment in Canada and by revenue growth and lower provisions for credit losses in the United States. Revenue growth from the prior year was largely reflective of higher net interest earnings in U.S. retail and business banking, which benefited from significantly higher volumes and favourable currency translation rates. Net interest income also increased in Canada, driven by higher loan and deposit balances, but the effect was tempered by lower net interest earnings on deposit products, reflecting a low interest rate environment. Overall, net interest margins declined slightly year-over-year to 3.16 per cent. Improved card services revenues and activity fees contributed to higher non-interest revenues. Revenue growth from the fourth quarter was attributable to higher net interest income, as a result of volume growth in Canadian and U.S. retail and business banking. Seasonal increases in card services revenues and higher activity fees were only partially offset by lower securitization revenues. Non-interest expenses for the first quarter of 2002 increased by six per cent from last year, primarily due to the inclusion of Joliet and the effects of currency translation on U.S. retail and business banking expenses. In Canada, expense growth was less than one per cent, compared with nine per cent year-over-year growth in the first quarter of 2001. Non-interest expenses increased three per cent from the fourth quarter, largely due to higher costs in U.S. retail and business banking. The increase reflected system conversion costs for Joliet, as well as spending on strategic

12
initiatives in the United States. In Canada, attention to cost control and stronger revenue growth resulted in an improvement in the expense-to-revenue ratio. The acquisition of Joliet affected year-over-year comparatives. In the first quarter, revenues attributable to Joliet were $21 million and expenses, including $6 million of systems conversion and integration costs, were $20 million. Business Developments and Achievements The Group’s objectives and outlook for fiscal 2002 and the environment in which it operates are outlined on page 26 of the Bank’s 2001 Annual Report. Notable business developments and achievements in the first quarter in support of the Group’s 2002 objectives are listed below.
• = The Bank lowered the cost of credit card and personal lending. These ‘Help Provided’ initiatives are designed to help customers manage their financial affairs during the economic downturn. Initiatives include guaranteeing interest rates on pre-arranged mortgages for 150 days; a 5.9 per cent promotional interest rate for all MasterCard cash advances and balances transferred from competing cards; and offering lines of credit at the Bank’s prime rate.
• = The prime interest rate sale, targeted at the small business community, was extended to March 1, 2002. Under the program, new and existing customers received an automatic one-quarter per cent interest credit up to $600 on prime-based operating loans and lines of credit.
• = The Group continued to invest in the replacement of its sales and service branch technology platform, Pathway Connect. It has been launched successfully in 60 branches. This new platform will improve transaction service and equip our staff to better address our customers’ financial needs. The new platform will be phased in at branches across the country over the next year.
• = In Canada, most recent market share for personal lending was up 11 basis points from the same period the year before, while retail operating deposits market share was up by 33 basis points. The Bank continued to rank second in small business lending market share for business loans $5 million and below as its market share increased 24 basis points year-over-year.
• = The Group achieved strong growth in Canada, where loans and acceptances, after adding back the effects of securitizations, increased by $4.3 billion or five per cent from the first quarter of 2001 and $1.6 billion from the fourth quarter. Retail and commercial deposits grew $5.5 billion or 20 per cent from the first quarter of 2001 and $2.7 billion or nine per cent from the fourth quarter.
• = In the United States, retail and small business loan balances grew by 23 per cent from the first quarter of 2001, of which eight percentage points was attributable to the First National Bank of Joliet, positioning Chicagoland Banking to achieve its annual growth target (excluding acquisitions) of more than US$1 billion per year in loans outstanding. Excluding the Joliet acquisition, Chicagoland Banking reported continued strong deposit growth of six per cent from the same period a year ago.
13
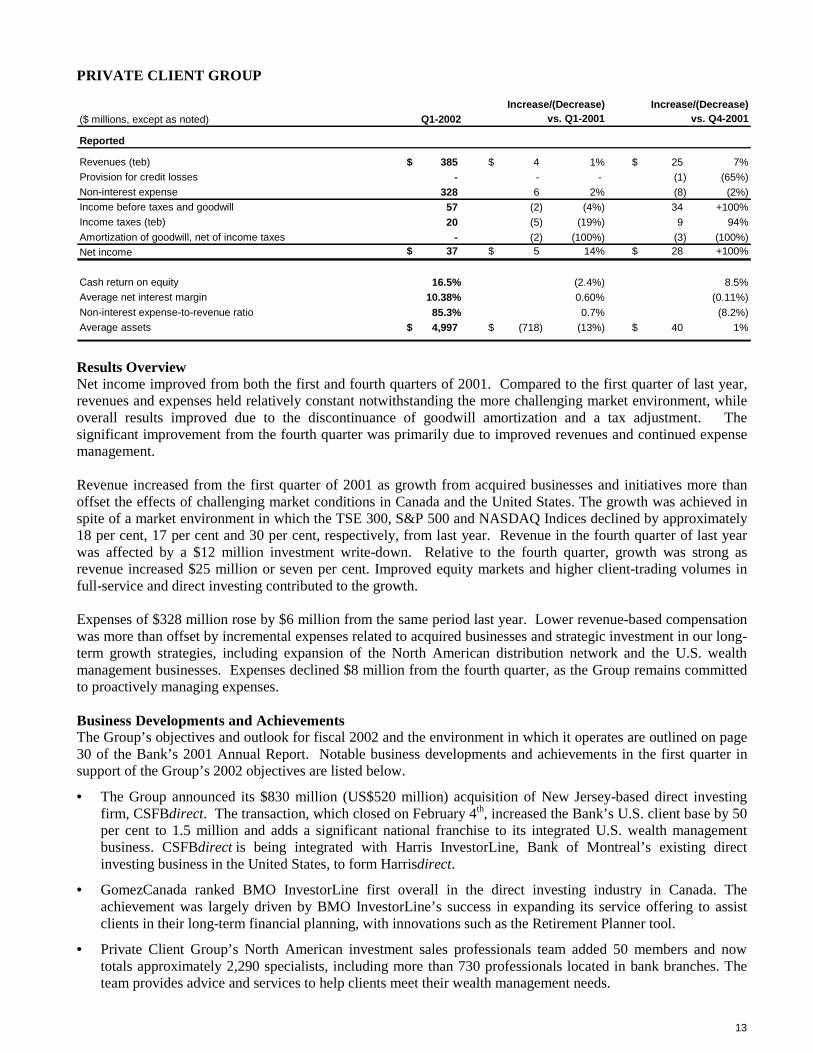
PRIVATE CLIENT GROUP
($ millions, except as noted) Q1-2002
Reported
Revenues (teb) 385$ 4$ 1% 25$ 7%Provision for credit losses - - - (1) (65%)Non-interest expense 328 6 2% (8) (2%)Income before taxes and goodwill 57 (2) (4%) 34 +100%Income taxes (teb) 20 (5) (19%) 9 94%Amortization of goodwill, net of income taxes - (2) (100%) (3) (100%)Net income 37$ 5$ 14% 28$ +100%
Cash return on equity 16.5% (2.4%) 8.5%Average net interest margin 10.38% 0.60% (0.11%)Non-interest expense-to-revenue ratio 85.3% 0.7% (8.2%)Average assets 4,997$ (718)$ (13%) 40$ 1%
vs. Q1-2001 vs. Q4-2001Increase/(Decrease) Increase/(Decrease)
Results Overview Net income improved from both the first and fourth quarters of 2001. Compared to the first quarter of last year, revenues and expenses held relatively constant notwithstanding the more challenging market environment, while overall results improved due to the discontinuance of goodwill amortization and a tax adjustment. The significant improvement from the fourth quarter was primarily due to improved revenues and continued expense management. Revenue increased from the first quarter of 2001 as growth from acquired businesses and initiatives more than offset the effects of challenging market conditions in Canada and the United States. The growth was achieved in spite of a market environment in which the TSE 300, S&P 500 and NASDAQ Indices declined by approximately 18 per cent, 17 per cent and 30 per cent, respectively, from last year. Revenue in the fourth quarter of last year was affected by a $12 million investment write-down. Relative to the fourth quarter, growth was strong as revenue increased $25 million or seven per cent. Improved equity markets and higher client-trading volumes in full-service and direct investing contributed to the growth. Expenses of $328 million rose by $6 million from the same period last year. Lower revenue-based compensation was more than offset by incremental expenses related to acquired businesses and strategic investment in our long-term growth strategies, including expansion of the North American distribution network and the U.S. wealth management businesses. Expenses declined $8 million from the fourth quarter, as the Group remains committed to proactively managing expenses. Business Developments and Achievements The Group’s objectives and outlook for fiscal 2002 and the environment in which it operates are outlined on page 30 of the Bank’s 2001 Annual Report. Notable business developments and achievements in the first quarter in support of the Group’s 2002 objectives are listed below.
• = The Group announced its $830 million (US$520 million) acquisition of New Jersey-based direct investing firm, CSFBdirect. The transaction, which closed on February 4th, increased the Bank’s U.S. client base by 50 per cent to 1.5 million and adds a significant national franchise to its integrated U.S. wealth management business. CSFBdirect is being integrated with Harris InvestorLine, Bank of Montreal’s existing direct investing business in the United States, to form Harrisdirect.
• = GomezCanada ranked BMO InvestorLine first overall in the direct investing industry in Canada. The achievement was largely driven by BMO InvestorLine’s success in expanding its service offering to assist clients in their long-term financial planning, with innovations such as the Retirement Planner tool.
• = Private Client Group’s North American investment sales professionals team added 50 members and now totals approximately 2,290 specialists, including more than 730 professionals located in bank branches. The team provides advice and services to help clients meet their wealth management needs.

14
INVESTMENT BANKING GROUP
($ millions, except as noted) Q1-2002
Reported
Revenues (teb) 627$ (8)$ (1%) 191$ 44%Provision for credit losses 56 15 37% (324) (85%)Non-interest expense 297 (23) (7%) 28 10%Income before income taxes and goodwill 274 - - 487 +100%Income taxes (teb) 102 (1) (1%) 204 +100%Amortization of goodwill, net of income taxes - (2) (100%) (2) (100%)Net income 172$ 3$ 2% 285$ +100%
Cash return on equity 12.9% (2.4%) 24.4%Non-interest expense-to-revenue ratio 47.4% (3.1%) (14.4%)Average net interest margin 1.17% 0.43% 0.21%Average assets 140,272$ (4,271)$ (3%) (510)$ -
Excluding non-recurring items
Revenues (teb) 627$ (8)$ (1%) 13$ 2%Non-interest expense 297$ (23)$ (7%) 28$ 10%Net income 172$ 3$ 2% 180$ +100%Cash return on equity 12.9% (2.4%) 14.9%Non-interest expense-to-revenue ratio 47.4% (3.1%) 3.4%
vs. Q1-2001 vs. Q4-2001Increase/(Decrease) Increase/(Decrease)
Results Overview Net income for the quarter rose two per cent from the prior year, as revenues were substantially unchanged despite a difficult capital markets environment, while the benefits of cost containment more than offset higher provisions for credit losses. Performance improved significantly from the fourth quarter, which was affected by a large increase in provisions for credit losses and investment write-downs, including a $178 million write-down. Revenues were slightly lower year-over-year. Continued momentum from Capital Markets interest-rate sensitive businesses was more than offset by weaker primary and equity market conditions, lower corporate loan volumes and decreased client-driven transactions in Capital Markets. Improved net interest income benefited from easing of monetary policy resulting in lower wholesale funding costs, partially offset by lower lending volumes. A decline in non-interest revenues was largely due to decreased trading opportunities, which were affected by weak capital market conditions, while an uncertain economic environment affected merger and acquisition revenue. Net investment gains in the quarter were affected by $32 million of write-downs in the merchant banking portfolio, which were more than offset by realized gains in merchant banking and other portfolios. Revenues were significantly higher than in the fourth quarter due to the investment write-downs in that period and higher net interest margins in the current period, partially offset by weaker mergers and acquisitions fees and lower trading income. Non-interest expenses decreased by seven per cent from the first quarter of last year due to lower employee costs and lower computer and professional fees. Costs increased from the fourth quarter as that period had low revenue-based costs, reflective of business results. Excluding revenue-based costs, non-interest expenses declined due to lower computer costs and lower professional fees. Business Developments and Achievements The Group’s objectives and outlook for fiscal 2002 and the environment in which it operates are outlined on page 33 of the Bank’s 2001 Annual Report. Notable business developments and achievements in the first quarter in support of the Group’s 2002 objectives are listed below.
• = In January, BMO Nesbitt Burns was named one of three co-lead underwriters for the Ontario government’s Hydro One initial public offering. During the quarter, the firm participated in 74 Canadian debt and equity transactions with a value of $13.6 billion, and is advising on six merger and acquisition transactions for a

15
value of $1.0 billion. The firm also ranked first by total volume of Canadian equity block trading for the quarter.
• = In the U.S. Midwest mid-market, Harris Nesbitt’s access to cross-border capabilities resulted in the provision of a credit facility for a Canadian acquisition by Check Technology Corporation. In addition, Harris Nesbitt’s banking arm worked with Alpha Banking Co. Inc. to agent/arrange a credit to refinance existing senior and a portion of its subordinate debt. Harris Nesbitt’s expertise resulted in an integrated solution, using a broad range of products and services, including a revolving credit facility, term loan, IRB placement, interest rate hedge, cash management and retirement services for the company’s 401-K plan.
• = In energy, BMO Nesbitt Burns underwrote $1.2 billion of high-yield and convertible securities in the U.S. capital markets and participated in $1.4 billion of corporate bank financing for U.S. energy clients. Notable transactions included co-managing a $160 million high-yield transaction for Forest Oil Corporation and co-managing a $1.1 billion mandatory convertible securities transaction for The Williams Companies Inc.
• = In media and communications, notable transactions included serving as one of the lead banks in financing the Wide Open West (‘WOW’) purchase of the Ameritech cable properties and the completion of a $75 million private placement of debt for Bowne Corporation, the world’s largest financial printer.
• = In securitization, BMO Nesbitt Burns led a $300 million term securitization of wholesale receivables for DaimlerChrysler Financial Services (debis) Canada Inc. The firm also closed a $100 million asset securitization for DVI Business Credit in December.
• = During the quarter, the Merchant Banking line of business unit initiated BMO Equity Partners Fund II, a North American mid-market, industry-diversified fund with a target commitment of $425 million. The group also announced a number of key senior hires to establish a centralized management approach and round out its professional staffing in Toronto, Chicago and New York.
EMFISYS
Emfisys is the Bank’s technology and e-business group. It provides information technology planning, strategy and development services, together with transaction processing, and real estate services for the Bank of Montreal Group of Companies. In addition, the Group is responsible for North American cash management, and the creation, development, and support of the Bank’s e-business services. Emfisys Business Developments and Achievements The Group’s objectives for fiscal 2002 are outlined on page 37 of the Bank’s 2001 Annual Report. Notable business developments and achievements in the first quarter in support of the Group’s 2002 objectives are listed below.
• = As indicated in the Personal and Commercial Client Group section, Emfisys commenced the national rollout of Pathway Connect, a state-of-the-art technology platform, in January 2002.
• = The group launched a new commercial mid-market web site, part of HarrisBank.com, focusing on the mid-market segment of business banking. As part of an initiative to expand Harris’ mid-market business, the site provides detailed information for customers and potential customers on Harris’ product offerings for Business Banking.
• = In preparation for national rollout later in 2002, the eScout pilot, the first service on the ‘Bank of Montreal Online Marketplace’, was successfully launched for small and medium sized businesses in Southwestern Ontario. Harris Bank began marketing eScout in March 2001 and has already signed up over 1,600 customers.
• = Preparation continued for the summer 2002 launch of the Bank’s person-to-person Email Money Transfer service. The service will enable Everyday Banking customers to send and receive funds using the speed and convenience of email, while retaining all the security of their online banking functionality.

16
CORPORATE SUPPORT
Corporate Support includes the corporate units that provide expertise and governance support for the Bank in areas such as strategic planning, law, finance, internal audit, risk management, corporate communications, human resources and learning. It also includes revenues and expenses associated with certain securitization activities, the hedging of foreign source revenues, the Bank’s debenture and former equity investment in Bancomer and activities related to the management of certain balance sheet positions and the Bank’s overall asset/liability structure. CORPORATE SUPPORT, INCLUDING EMFISYS
Results Overview Emfisys operating results are included with Corporate Support for reporting purposes. Emfisys comprises two distinct units. It provides technology, consulting, processing, and e-business services for the three banking groups (P&C, PCG and IBG). Costs of these activities are transferred to the banking groups and only relatively minor variance amounts are retained within Emfisys, and thus, within Emfisys and Corporate Support results. Emfisys also has two revenue-generating e-businesses – North American Cash Management and E-Business Division. Overall, results of Emfisys and Corporate Support are therefore largely reflective of Corporate Support activities.
($ millions, except as noted) Q1-2002
Reported
Revenues (teb) 61$ (48)$ (44%) -$ (1%)Provision for credit losses 54 55 +100% (31) (38%)Non-interest expense 138 42 44% (28) (17%)Income before taxes, non-controlling interest in subsidiaries and goodwill (131) (145) (+100%) 59 31%Income taxes (teb) (84) (77) (+100%) 33 29%Non-controlling interest in subsidiaries 16 9 +100% 3 15%Amortization of goodwill, net of income taxes - (4) (100%) (4) (100%)Net income (63)$ (73)$ (+100%) 27$ 30%
Excluding non-recurring items
Revenues (teb) 61$ (11)$ (14%) -$ (1%)Non-interest expense 138$ 42$ 44% (28)$ (17%)Income taxes (teb) (84)$ (48)$ (+100%) 33$ 29%Net income (63)$ (65)$ (+100%) 27$ 30%
vs. Q1-2001 vs. Q4-2001Increase/(Decrease) Increase/(Decrease)
Net income declined from the first quarter of last year due to higher provisions for credit losses, lower revenues and higher non-interest expenses, partially offset by favourable movements in income tax rates and benefits. Net income improved from the immediately preceding quarter because of lower provisions for credit losses and lower non-interest expenses, partially offset by reduced tax benefits. Results in the first quarter of last year benefited from non-recurring items, consisting of a $37 million ($33 million after-tax) gain on sale of investment in Bancomer, net of a $25 million increase in income taxes related to the effects of proposed reductions in federal tax rates on the bank’s future tax assets. Revenues declined year-over-year due to last year’s Bancomer gain, lower levels of capital due to the common share buyback program completed in 2001 and lower securitizations revenues. Revenues were unchanged from the fourth quarter. Non-interest expenses rose year-over-year, largely due to higher pension costs and differences in the allocation of costs to the business groups. The decline in expenses from the fourth quarter also related to differences in the allocation of costs.

17
The Bank’s overall provision for credit losses reflects its best estimate of required provisions based on impairments identified in the portfolios and existing economic conditions. Provisions are allocated to the banking groups based on expected losses over an economic cycle. The timing differences between the total of the Bank’s expected loss provisions and its required provisions under GAAP are allocated to Corporate Support. Compared with the first quarter of the prior year, the current quarter’s provision for credit losses in Corporate Support increased. The increase occurred because in the current weaker economic environment, required provisions for credit losses are higher than this quarter’s share of expected provisions over the economic cycle. Compared with the fourth quarter, the current quarter’s provision for credit losses in Corporate Support declined. The decline occurred because in the fourth quarter, the Bank’s total required provisions were increased significantly because of the rapid deterioration in economic conditions. As a result, the excess of actual provisions over expected provisions was lower in the current quarter than in the fourth quarter. In fiscal 2001, the excess of actual provisions over expected provisions that related to Harris Bank were charged to the operating groups to which they related, rather than to Corporate Support. HARRIS BANK
The results of Harris Bank are included within the results of each of Bank of Montreal’s operating groups. Harris Bank legal entity results are outlined below.
(U.S. GAAP/US$ millions, except as noted) Q1-2002
Reported
Net interest income (teb) 212$ 34$ 19% 8$ 4%Other income 110 (53) (32%) (10) (8%)Total revenue (teb) 322 (19) (6%) (2) (1%)Provision for credit losses 25 12 94% (128) (84%)Non-interest expense 198 24 14% 2 1%Income before income taxes and goodwill 99 (55) (36%) 124 +100%Income taxes (teb) 34 (21) (39%) 44 +100%Non-controlling interest in subsidiaries - - - - - Net income before goodwill 65 (34) (33%) 80 +100%Amortization of goodwill, net of income taxes 5 1 30% - - Net income 60$ (35)$ (36%) 80$ +100%
Net economic profit 16$ (38)$ (70%) 82$ (100%)Cash return on equity (U.S. basis) 15.1% (11.2%) 0.3%Average net interest margin (U.S. basis) 3.31% 0.56% 0.16%Non-interest expense-to-revenue ratio 61.4% 10.4% 0.8%Average common equity 1,963$ 312$ 19% 8$ - Average assets 28,746$ (201)$ (1%) (160)$ (1%)Total risk-weighted assets 22,229$ (258)$ (1%) (503)$ (2%)Full-time equivalent staff 6,143 513 9% 124 2%
vs. Q1-2001 vs. Q4-2001Increase/(Decrease) Increase/(Decrease)
Results Overview On a U.S. dollar/U.S. GAAP basis, Harris Bank’s net income was $60 million for the quarter. Earnings were $95 million in last year’s first quarter, while the fourth quarter reflected a loss of $20 million. The year-over-year comparison is affected by last year’s $60 million ($36 million after-tax) gain on sale of the Harris Bank merchant card business to a unit of Bank of Montreal in connection with the establishment of the Moneris Solutions joint venture and by a $9 million ($5 million after-tax) charge relating to impairments in the value of certain equity investments recorded in the current quarter. Last year’s $60 million gain was not included in Bank of Montreal’s consolidated results because the transaction was between related companies. Excluding the impact of the two foregoing items and other impacts of divested businesses, net income rose by $7 million or 11 per cent from last year to $67 million. The improvement from the fourth quarter was largely attributable to that period’s $125 million ($80 million after-tax) increase in the provision for credit losses, primarily associated with the slowing economy’s impact on the corporate loan portfolio. The effect was reduced by the current period’s $9 million ($5 million after-tax) charge for impairments in equity investments. Bank of Montreal’s consolidated financial statements reflected the $9 million charge in the fourth quarter of 2001.
18
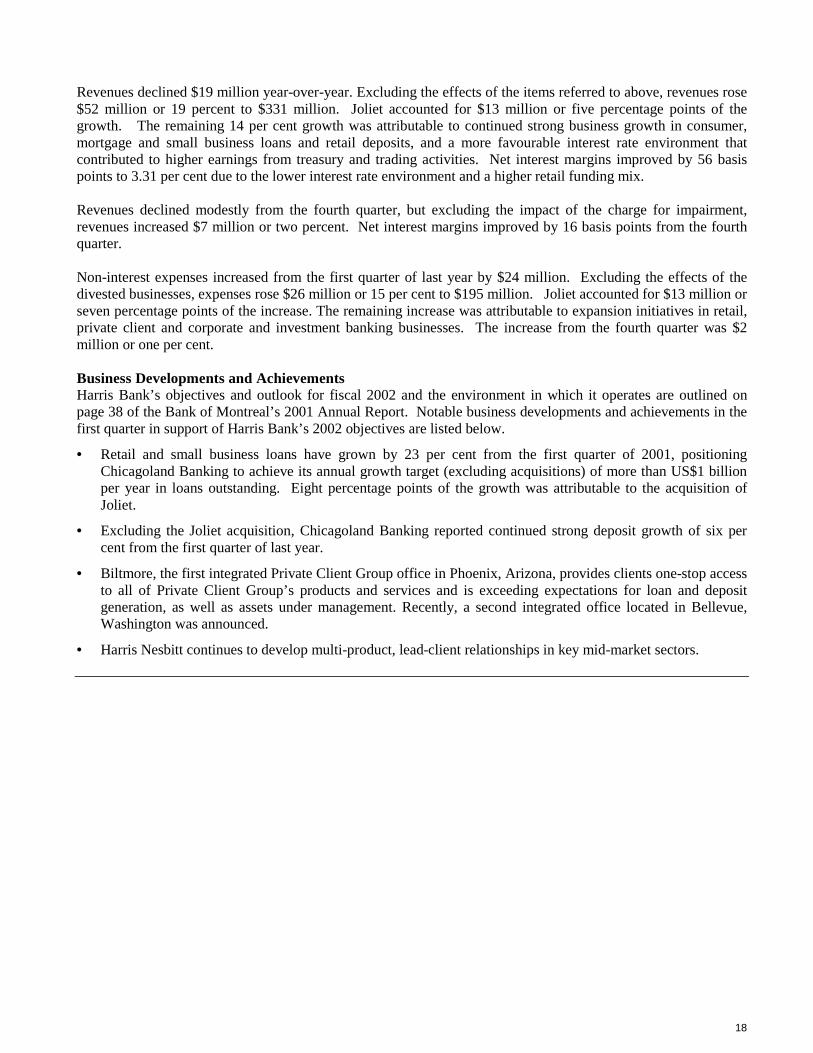
Revenues declined $19 million year-over-year. Excluding the effects of the items referred to above, revenues rose $52 million or 19 percent to $331 million. Joliet accounted for $13 million or five percentage points of the growth. The remaining 14 per cent growth was attributable to continued strong business growth in consumer, mortgage and small business loans and retail deposits, and a more favourable interest rate environment that contributed to higher earnings from treasury and trading activities. Net interest margins improved by 56 basis points to 3.31 per cent due to the lower interest rate environment and a higher retail funding mix. Revenues declined modestly from the fourth quarter, but excluding the impact of the charge for impairment, revenues increased $7 million or two percent. Net interest margins improved by 16 basis points from the fourth quarter. Non-interest expenses increased from the first quarter of last year by $24 million. Excluding the effects of the divested businesses, expenses rose $26 million or 15 per cent to $195 million. Joliet accounted for $13 million or seven percentage points of the increase. The remaining increase was attributable to expansion initiatives in retail, private client and corporate and investment banking businesses. The increase from the fourth quarter was $2 million or one per cent. Business Developments and Achievements Harris Bank’s objectives and outlook for fiscal 2002 and the environment in which it operates are outlined on page 38 of the Bank of Montreal’s 2001 Annual Report. Notable business developments and achievements in the first quarter in support of Harris Bank’s 2002 objectives are listed below.
• = Retail and small business loans have grown by 23 per cent from the first quarter of 2001, positioning Chicagoland Banking to achieve its annual growth target (excluding acquisitions) of more than US$1 billion per year in loans outstanding. Eight percentage points of the growth was attributable to the acquisition of Joliet.
• = Excluding the Joliet acquisition, Chicagoland Banking reported continued strong deposit growth of six per cent from the first quarter of last year.
• = Biltmore, the first integrated Private Client Group office in Phoenix, Arizona, provides clients one-stop access to all of Private Client Group’s products and services and is exceeding expectations for loan and deposit generation, as well as assets under management. Recently, a second integrated office located in Bellevue, Washington was announced.
• = Harris Nesbitt continues to develop multi-product, lead-client relationships in key mid-market sectors.

BANK OF MONTREAL
FINANCIAL HIGHLIGHTS
(Canadian $ in millions except as noted) For the three months ended
January 31, October 31, July 31, April 30, January 31, Change from 2002 2001 2001 2001 2001 January 31,2001
Income Statement HighlightsTotal revenue (TEB) (a) 2,205$ 1,951$ 2,234$ 2,485$ 2,193$ 0.6 %Provision for credit losses 180 546 117 217 100 80.0 Non-interest expense 1,462 1,449 1,421 1,404 1,397 4.6 Net income 372 4 444 607 416 (10.5)Common Share Data ($)Diluted earnings per share 0.71$ $ 0.00 0.83$ 1.10$ 0.73$ (0.02)$ - excluding non-recurring items 0.71 0.19 0.83 0.76 0.70 0.01Diluted cash earnings per share 0.75 0.06 0.88 1.15 0.77 (0.02) - excluding non-recurring items 0.75 0.25 0.88 0.80 0.75 0.00Dividends declared per share 0.30 0.28 0.28 0.28 0.28 0.02Book value per share 20.11 19.69 20.44 19.93 19.53 0.58Closing share price 36.00 33.86 40.85 35.20 40.89 (4.89)Total market value of common shares ($ billions) 17.6 16.6 20.7 17.8 21.5 (3.9)
January 31, October 31, July 31, April 30, January 31, Change from 2002 2001 2001 2001 2001 January 31,2001
Balance Sheet HighlightsAssets 239,440$ 239,409$ 230,203$ 235,154$ 242,230$ (1.2) %Loans 136,067 136,829 136,693 136,405 139,270 (2.3)Deposits 154,758 154,290 151,003 154,415 157,875 (2.0)Common shareholders' equity 9,851 9,632 10,374 10,102 10,280 (4.2)
January 31, October 31, July 31, April 30, January 31, 2002 2001 2001 2001 2001
Primary Financial Measures (%) (b)Average annual five year total shareholder return 12.5 14.3 23.9 20.4 23.8Diluted earnings per share growth (c ) 1.4 (75.0) 23.9 (2.6) 0.0Diluted cash earnings per share growth (c ) 0.0 (68.8) 23.9 0.0 1.4Return on equity (c ) 14.5 3.8 16.8 16.2 14.8Cash return on equity (c ) 15.2 4.8 17.8 17.2 15.7Net economic profit (NEP) growth (21.4) (100+) 48.9 55.6 (27.6)Revenue growth (c ) 2.6 (1.2) 7.5 0.0 6.8Non-interest expense-to-revenue ratio (c ) 66.3 68.1 63.6 63.9 65.0Provision for credit losses as a % of average loans and acceptances (c ) 0.49 0.60 0.31 0.29 0.27 Gross impaired loans and acceptances as a % of equity and allowance for credit losses 14.64 14.17 12.55 11.52 11.94 Cash and securities-to-total assets ratio 25.2 23.1 25.6 26.4 26.3Tier 1 capital ratio (d) 8.87 8.15 8.84 8.94 8.87 Credit rating AA- AA- AA- AA- AA-Other Financial Ratios (% except as noted) (b)Total shareholder return - twelve month (9.3) (1.2) 32.0 35.0 75.8Dividend yield 3.3 3.3 2.7 3.2 2.7Price-to-earnings ratio (times) 13.3 12.4 11.4 10.2 12.8Market-to-book value (times) 1.79 1.72 2.00 1.77 2.09 Net economic profit ($ millions) 115 (249) 184 352 146 Return on average assets (c ) 0.60 0.18 0.75 0.70 0.65 Net interest margin (c ) 2.07 1.94 2.09 1.80 1.81 Other income as a % of total revenue (c ) 41.6 43.5 44.9 50.3 48.0Expense growth (c ) 4.6 5.5 7.2 4.0 11.4Total capital ratio (d) 12.93 12.12 12.60 12.74 12.12 Tier 1 capital ratio - U.S. basis (d) 8.32 7.87 8.43 8.51 8.41 Equity-to-assets ratio 5.4 5.1 5.6 5.4 5.2All ratios in this report are based on unrounded numbers.(a) Reported on a taxable equivalent basis (TEB).(b) For the period ended, or as at, as appropriate.(c ) Reported excluding non-recurring items.(d) The July 31, 2001 total capital ratio and tier 1 capital ratios reflect the inclusion of US$250 of class B preferred shares which were redeemed on August 27, 2001. Excluding these shares, the total capital ratio would have been 12.32, the tier 1 capital ratio would have been 8.55 and the tier 1 capital ratio - U.S. basis would have been 8.15 as at July 31, 2001. The January 31, 2001 total capital ratio and tier 1 capital ratios reflect the inclusion of $250 of class B preferred shares which were redeemed on February 26, 2001. Excluding these shares, the total capital ratio would have been 11.93, the tier 1 capital ratio would have been 8.68 and the tier 1 capital ratio - U.S. basis would have been 8.23 as January 31, 2001.
For the three months ended
19

BANK OF MONTREALCONSOLIDATED STATEMENT OF INCOME
(Unaudited)(Canadian $ in millions except per share amounts)
January 31, October 31, July 31, April 30, January 31, 2002 2001 2001 2001 2001
Interest, Dividend and Fee IncomeLoans 1,851$ 2,131$ 2,301$ 2,563$ 2,694$ Securities 457 510 568 615 726 Deposits with banks 148 193 201 229 269
2,456 2,834 3,070 3,407 3,689 Interest ExpenseDeposits 849 1,228 1,389 1,630 1,936 Subordinated debt 80 86 88 87 90 Other liabilities 266 351 406 630 580
1,195 1,665 1,883 2,347 2,606
Net Interest Income 1,261 1,169 1,187 1,060 1,083 Provision for credit losses 180 546 117 217 100 Net Interest Income After Provision for Credit Losses 1,081 623 1,070 843 983
Other IncomeDeposit and payment service charges 175 175 170 164 161 Lending fees 75 88 85 96 83 Capital market fees 213 235 243 270 228 Card services 64 50 59 44 51 Investment management and custodial fees 81 87 85 82 82 Mutual fund revenues 71 70 61 61 59 Trading revenues 46 75 91 158 166 Securitization revenues 58 71 78 97 85 Other fees and commissions 134 (101) 131 421 161
917 750 1,003 1,393 1,076
Net Interest and Other Income 1,998 1,373 2,073 2,236 2,059
Non-Interest ExpenseSalaries and employee benefits 850 760 822 827 803 Premises and equipment 291 319 288 274 272 Communications 48 46 46 49 53 Other expenses 258 312 254 244 259
1,447 1,437 1,410 1,394 1,387 Amortization of intangible assets 15 12 11 10 10 Total non-interest expense 1,462 1,449 1,421 1,404 1,397
Income Before Provision for Income Taxes, Non- Controlling Interest in Subsidiaries and Goodwill 536 (76) 652 832 662 Income taxes 148 (109) 183 201 226
388 33 469 631 436 Non-controlling interest 16 14 11 10 7
Net Income Before Goodwill 372 19 458 621 429 Amortization of goodwill, net of applicable income tax (Note 2) - 15 14 14 13
Net Income 372$ 4$ 444$ 607$ 416$
Dividends Declared - preferred shares 17$ 14$ 20$ 20$ 26$ - common shares 147$ 137$ 142$ 142$ 147$
Average Number of Common Shares Outstanding 489,498,812 499,013,245 502,373,065 519,403,391 524,620,572 Average Assets 246,890$ 245,757$ 234,041$ 248,066$ 245,283$
Earnings Per Share Before Goodwill Basic 0.73$ 0.03$ 0.87$ 1.16$ 0.77$ Diluted 0.71 0.04 0.85 1.13 0.75 Earnings Per ShareBasic 0.73 0.00 0.85 1.13 0.74 Diluted 0.71 0.00 0.83 1.10 0.73 The accompanying notes to consolidated financial statements are an integral part of this statement.
The calculation of earnings per share before goodwill and earnings per share for the three months ended January 31, 2001 has been amendedto reflect the stock dividend declared on March 1, 2001, of one common share of no value, for each common share.
For the three months ended
20

BANK OF MONTREALCONSOLIDATED BALANCE SHEET
(Unaudited) (Canadian $ in millions) January 31, October 31, July 31, April 30, January 31, 2002 2001 2001 2001 2001
AssetsCash resources 18,876$ 17,656$ 17,355$ 19,059$ 20,508$
Securities Investment 22,257 21,470 21,958 22,072 22,237 Trading 19,240 16,200 19,670 20,846 21,023 Loan Substitutes 6 6 6 - -
41,503 37,676 41,634 42,918 43,260
Loans Residential mortgages 43,500 41,941 41,106 39,350 39,446 Consumer instalment and other personal loans 19,463 19,107 18,777 18,255 17,873 Credit card loans 1,528 1,527 1,525 1,459 1,448 Loans to businesses and governments 58,034 61,249 59,354 58,943 61,728 Securities purchased under resale agreements 15,565 14,954 17,592 20,054 20,329
138,090 138,778 138,354 138,061 140,824 Allowance for credit losses (2,023) (1,949) (1,661) (1,656) (1,554)
136,067 136,829 136,693 136,405 139,270 Other assets
Customers' liability under acceptances 7,488 7,936 7,400 9,468 9,149 Premises and equipment 2,094 2,170 2,075 2,083 2,088 Other (Note 2) 33,412 37,142 25,046 25,221 27,955
42,994 47,248 34,521 36,772 39,192
Total Assets 239,440$ 239,409$ 230,203$ 235,154$ 242,230$ Liabilities and Shareholders' Equity Deposits
Banks 20,022$ 20,539$ 19,188$ 22,004$ 25,447$ Businesses and governments 64,908 66,132 65,835 66,968 68,567 Individuals 69,828 67,619 65,980 65,443 63,861
154,758 154,290 151,003 154,415 157,875
Other LiabilitiesAcceptances 7,488 7,936 7,400 9,468 9,149 Securities sold but not yet purchased 7,775 6,609 6,437 6,562 11,266 Securities sold under repurchase agreements 20,121 17,480 22,867 24,127 21,983 Other 33,249 37,738 25,769 24,122 25,113
68,633 69,763 62,473 64,279 67,511
Subordinated debt 4,672 4,674 4,920 4,924 4,889
Shareholders' equityShare capital (Note 3) 4,922 4,425 4,919 4,507 4,916 Retained earnings 6,455 6,257 6,888 7,029 7,039
11,377 10,682 11,807 11,536 11,955
Total Liabilities and Shareholders' Equity 239,440$ 239,409$ 230,203$ 235,154$ 242,230$ The accompanying notes to consolidated financial statements are an integral part of this statement.
As at
21

BANK OF MONTREALCONSOLIDATED STATEMENT OF CHANGES IN SHAREHOLDERS' EQUITY
(Unaudited) (Canadian $ in millions) January 31, 2002 January 31, 2001
Preferred SharesBalance at beginning of period 1,050$ 1,681$ Proceeds from the issue of preferred shares (Note 3) 478 - Translation adjustment on shares issued in a foreign currency (2) (6)
Balance at End of Period 1,526 1,675
Common SharesBalance at beginning of period 3,375 3,173 Issued under the Shareholder Dividend Reinvestment and Share Purchase Plan 11 9 Issued under the Stock Option Plan 9 59 Issued on the exchange of shares of subsidiary corporations 1 -
Balance at End of Period 3,396 3,241
Retained EarningsBalance at beginning of period 6,257 7,087 Cumulative impact of adopting Future Employee Benefits standard,
net of applicable income tax - (250) 6,257 6,837
Net income 372 416 Dividends - Preferred shares (17) (26) - Common shares (147) (147) Unrealized loss on translation of net investment in foreign
operations, net of hedging activities and applicable income tax (4) (41) Share issue expense, net of applicable income tax (6) -
Balance at End of Period 6,455 7,039
Total Shareholders' Equity 11,377$ 11,955$ The accompanying notes to consolidated financial statements are an integral part of this statement.
For the three months ended
22

BANK OF MONTREALCONSOLIDATED STATEMENT OF CASH FLOW
(Unaudited) (Canadian $ in millions) January 31, 2002 January 31, 2001
Cash Flows From Operating ActivitiesNet income 372$ 416$ Adjustments to determine net cash flows
Provision for credit losses 180 100 Amortization of premises and equipment 102 96 Amortization of intangible assets 19 13 Amortization of goodwill (Note 2) - 15 Gain on sale of securitized loans (37) - Write-down of investment securities 30 - Future income tax expense 196 (244) Net (gain) on sale of investment securities (40) (54) Change in accrued interest
Decrease in interest receivable 89 269 Increase (decrease) in interest payable (168) 59
Net (decrease) in deferred loan fees (4) (6) Net (increase) decrease in unrealized gains and amounts receivable on
derivative contracts 1,575 (3,419) Net increase (decrease) in unrealized losses and amounts payable on
derivative contracts (1,777) 3,660 Net (increase) decrease in trading securities (3,040) 971 Net increase (decrease) in current income taxes payable (212) 76 Changes in other items and accruals, net (362) (1,022)
Net Cash Provided by (Used in) Operating Activities (3,077) 930
Cash Flows From Financing ActivitiesNet increase in deposits 468 1,085 Net increase in securities sold but not yet purchased 1,166 1,913 Net increase in securities sold under repurchase agreements 2,641 2,234 Net (decrease) in liabilities of subsidiaries (102) (762) Proceeds from issuance of preferred shares 478 - Proceeds from issuance of common shares 20 68 Share issue expense, net of applicable income tax (6) - Dividends paid (164) (156)
Net Cash Provided by Financing Activities 4,501 4,382
Cash Flows From Investing ActivitiesNet (increase) in interest bearing deposits with banks (1,810) (1,453) Purchase of investment securities (8,826) (7,978) Maturities of investment securities 5,680 6,852 Proceeds from sales of investment securities 2,349 3,451 Net (increase) in loans and loan substitute securities (2,708) (1,492) Proceeds from securitization of assets 3,938 - Net (increase) in securities purchased under resale agreements (611) (4,021) Premises and equipment - net purchases (26) (7) Acquisition of businesses - (117)
Net Cash (Used in) Investing Activities (2,014) (4,765)
Net Increase (Decrease) in Cash and Cash Equivalents (590) 547 Cash and Cash Equivalents at Beginning of Period 3,459 2,144
Cash and Cash Equivalents at End of Period 2,869$ 2,691$ The accompanying notes to consolidated financial statements are an integral part of this statement.
For the three months ended
23

BANK OF MONTREALNOTES TO CONSOLIDATED FINANCIAL STATEMENTSFor the three months ended January 31, 2002(Unaudited) (Canadian $ in millions except as noted)
1. Basis of PresentationThese consolidated financial statements should be read in conjunction with our consolidated financial statements for the year ended October 31,2001 as set out on pages 57 to 85 of our 2001 Annual Report. These consolidated financial statements have been prepared in accordance withCanadian generally accepted accounting principles, including the requirements of the Superintendent of Financial Institutions Canada, using thesame accounting policies and methods of computation as were used for our consolidated financial statements for the year ended October 31, 2001,except as described in note 2.
2. Change in Accounting PolicyOn November 1, 2001, we changed our accounting for goodwill and other intangible assets as required by CICA Handbook section 3062 "Goodwill and Other Intangible Assets". Under the new standard, goodwill is no longer amortized to income over time, and is subject to a periodic impairmentreview to ensure that the fair value remains greater than, or equal to, book value. Any excess of book value over fair value would be charged toincome in the period in which the impairment is determined. We have adopted this new accounting standard prospectively. As a result of this changein accounting policy, amortization of goodwill decreased by $15, net of applicable income tax of $2, for the three months ended January 31, 2002.
Further information on this new accounting policy is contained in note 8 to our consolidated financial statements for the year ended October 31, 2001on page 68 of our 2001 Annual Report.
3. Share CapitalDuring the three months ended January 31, 2002, we issued 12,000,000 5.95% Non-Cumulative Class B Preferred Shares, Series 10, at a price ofUS$25.00 per share, representing an aggregate issue price of US$300.
Share Capital Information (b)
PrincipalPreferred Shares outstanding Number Amount Convertible into…
Class B – Series 3 16,000,000 400 common shares (a)Class B – Series 4 8,000,000 200 common shares (a)Class B – Series 5 8,000,000 200 -Class B – Series 6 10,000,000 250 common shares (a)Class B – Series 10 12,000,000 476 common shares (a)
Total Preferred Share Capital 1,526 Common Shares outstanding 489,909,026 3,396 -Total Share Capital 4,922 Stock options issued under Stock Option Plan n/a 39,854,659 common shares
(a) The number of shares issuable on conversion is not determinable until the date of conversion. (b) For additional information refer to pages 71 and 72 of our 2001 Annual Report.n/a – not applicable
4. United States Generally Accepted Accounting PrinciplesReporting under United States generally accepted accounting principles (US GAAP) would have resulted in consolidated net income of $373, basic earnings per share of $0.73 and diluted earnings per share of $0.71 for the three months ended January 31, 2002 compared to $447, $0.80 and $0.78 respectively for the three months ended January 31, 2001.
As a result of an adjustment related to the sale of our investment in Grupo Financiero BBVA Bancomer, we have restated our US GAAP consolidatednet income from $431 to $447, our US GAAP basic earnings per share from $0.77 to $0.80 and our US GAAP diluted earnings per share from $0.75 to $0.78 for the three months ended January 31, 2001.
January 31, 2002
24
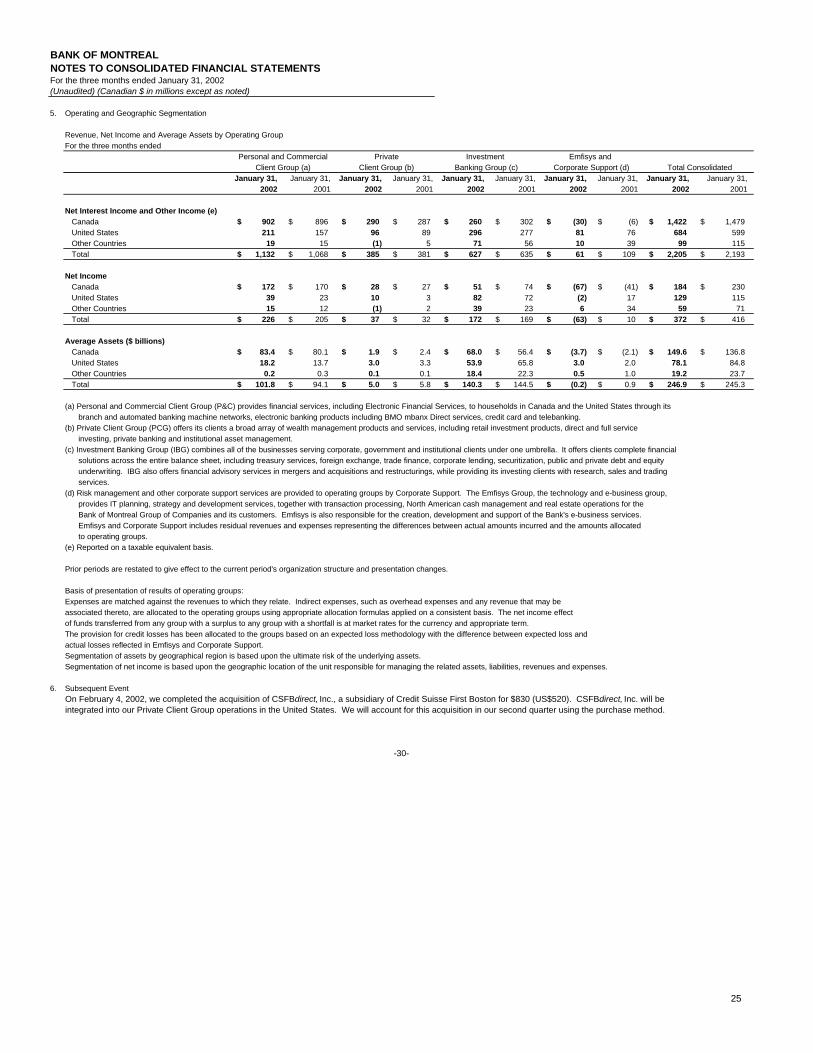
BANK OF MONTREALNOTES TO CONSOLIDATED FINANCIAL STATEMENTSFor the three months ended January 31, 2002(Unaudited) (Canadian $ in millions except as noted)
5. Operating and Geographic Segmentation
Revenue, Net Income and Average Assets by Operating Group For the three months ended
January 31, January 31, January 31, January 31, January 31, January 31, January 31, January 31, January 31, January 31,2002 2001 2002 2001 2002 2001 2002 2001 2002 2001
Net Interest Income and Other Income (e) Canada 902$ 896$ 290$ 287$ 260$ 302$ (30)$ (6)$ 1,422$ 1,479$ United States 211 157 96 89 296 277 81 76 684 599 Other Countries 19 15 (1) 5 71 56 10 39 99 115 Total 1,132$ 1,068$ 385$ 381$ 627$ 635$ 61$ 109$ 2,205$ 2,193$
Net Income Canada 172$ 170$ 28$ 27$ 51$ 74$ (67)$ (41)$ 184$ 230$ United States 39 23 10 3 82 72 (2) 17 129 115 Other Countries 15 12 (1) 2 39 23 6 34 59 71 Total 226$ 205$ 37$ 32$ 172$ 169$ (63)$ 10$ 372$ 416$
Average Assets ($ billions) Canada 83.4$ 80.1$ 1.9$ 2.4$ 68.0$ 56.4$ (3.7)$ (2.1)$ 149.6$ 136.8$ United States 18.2 13.7 3.0 3.3 53.9 65.8 3.0 2.0 78.1 84.8 Other Countries 0.2 0.3 0.1 0.1 18.4 22.3 0.5 1.0 19.2 23.7 Total 101.8$ 94.1$ 5.0$ 5.8$ 140.3$ 144.5$ (0.2)$ 0.9$ 246.9$ 245.3$
(a) Personal and Commercial Client Group (P&C) provides financial services, including Electronic Financial Services, to households in Canada and the United States through its branch and automated banking machine networks, electronic banking products including BMO mbanx Direct services, credit card and telebanking. (b) Private Client Group (PCG) offers its clients a broad array of wealth management products and services, including retail investment products, direct and full service investing, private banking and institutional asset management. (c) Investment Banking Group (IBG) combines all of the businesses serving corporate, government and institutional clients under one umbrella. It offers clients complete financial solutions across the entire balance sheet, including treasury services, foreign exchange, trade finance, corporate lending, securitization, public and private debt and equity underwriting. IBG also offers financial advisory services in mergers and acquisitions and restructurings, while providing its investing clients with research, sales and trading services. (d) Risk management and other corporate support services are provided to operating groups by Corporate Support. The Emfisys Group, the technology and e-business group, provides IT planning, strategy and development services, together with transaction processing, North American cash management and real estate operations for the Bank of Montreal Group of Companies and its customers. Emfisys is also responsible for the creation, development and support of the Bank's e-business services. Emfisys and Corporate Support includes residual revenues and expenses representing the differences between actual amounts incurred and the amounts allocated to operating groups. (e) Reported on a taxable equivalent basis.
Prior periods are restated to give effect to the current period's organization structure and presentation changes.
Basis of presentation of results of operating groups: Expenses are matched against the revenues to which they relate. Indirect expenses, such as overhead expenses and any revenue that may be associated thereto, are allocated to the operating groups using appropriate allocation formulas applied on a consistent basis. The net income effect of funds transferred from any group with a surplus to any group with a shortfall is at market rates for the currency and appropriate term. The provision for credit losses has been allocated to the groups based on an expected loss methodology with the difference between expected loss andactual losses reflected in Emfisys and Corporate Support.Segmentation of assets by geographical region is based upon the ultimate risk of the underlying assets. Segmentation of net income is based upon the geographic location of the unit responsible for managing the related assets, liabilities, revenues and expenses.
6. Subsequent EventOn February 4, 2002, we completed the acquisition of CSFBdirect, Inc., a subsidiary of Credit Suisse First Boston for $830 (US$520). CSFBdirect, Inc. will be integrated into our Private Client Group operations in the United States. We will account for this acquisition in our second quarter using the purchase method.
-30-
Total ConsolidatedEmfisys and
Client Group (a) Client Group (b) Banking Group (c) Corporate Support (d)Personal and Commercial Private Investment
25