for Doubling Farmers... · · 2018-02-23Preface kin to the Green Revolution of the late 1960’s,...
118
-
Upload
truongdiep -
Category
Documents
-
view
220 -
download
4
Transcript of for Doubling Farmers... · · 2018-02-23Preface kin to the Green Revolution of the late 1960’s,...


Preface kin to the Green Revolution of the late 1960’s, Doubling Farmers’ Income by 2022-23 has become the watchword of the current agricultural policy scenario in India. The Hon’ble Prime Minister of
India, Shri. Narendrabhai Modi, envisioned this target on Februrary 28, 2016 while addressing farmers in Bareilly district of Uttar Pradesh. The target year (i.e. 2022) has more special connotations since that happens to be the 75th year of the country’s Independence. As the policy level deliberations of various stakeholders toward identifying farm income issues and affixing strategies have gathered steam all over the country, it is beyond doubt that the Hon’ble Prime Minister’s vision has certainly made a paradigm shift in our thinking process from ensuring food security to addressing income security.
There cannot be anyone questioning the need for doubling farmers’ income. But how far it is possible to be achieved within the targeted five years remains the moot question. For the goal to be realized, it is estimated that an agricultural growth rate of 10.46 per cent is required, the rate which has never been achieved pan-India, barring a few states, since Independence. But twice over the last 30 years, farmers’ income have almost doubled in six years only in nominal terms (i.e. without adjusting for inflation) - once between 1987-88 and 1992-93 and then between 2004-05 and 2009-10. Realizing this feat for the third time will itself be an achievement and doubling farmers’ income in real terms, by removing the inflation factor from income levels, will be nothing short of a scientific miracle like Green Revolution.
Turning the pages of history would reveal that just a couple of years before the heydays of Green Revolution, many international experts predicted that India cannot be saved from famine and its food aids to India need to be diverted to other countries which can be saved. The country’s scientific fraternity proved them wrong in a matter of a few years. When given with the task of doubling farm output and move the country toward self-sufficiency, the determined stakeholders (policy makers, scientific community and farmers alike) worked with positivity and made sure that the vision got delivered. In the current context, if all the stakeholders work with the same level of positivity and determination, the Hon’ble Prime Minister’s vision of doubling farmers’ income is certainly deliverable. But there is one contrasting fact that separates the Green Revolution era from that of this Doubling Income era. In the former, the stakeholders focused on lab-to-land strategies alone in which they were able to exercise complete control. But in the latter, for doubling farmers’ income, now they have to bring the third element: market, which not only happens to be the most complex but also happens to be devoid of any institutional control. Now, the strategies need to shift from the two-dimensional lab-to-land approach toward the three dimensional lab-to-land-to-market. Thereby, either the farm production need to be market-led or the markets need to be tapped or created or facilitated to absorb farm output.
Despite its disadvantage of being a water-deficit state and prevailing arid and semi-arid conditions, the performance of Gujarat in terms of State GDP, agricultural GDP, per capita income and rural development measures is consistently among the top few states in India. The State’s agricultural growth rate has never been short of seven per cent throughout the last decade. The farm income sources are also well diversified as farmers derive sizeable incomes from both crop and animal sector. With 53 per cent of its work-force dependent on non-farm operations, small-scale industries and enterprises are also flourishing in the rural areas. The state tops the charts in milk production as well. Fisheries sector has been identified as the sunrise sector and it is expected to contribute more to the farm income basket. Micro-Irrigation and Soil Health Card schemes are being well implemented in the State and the water conservation efforts through construction of over 1.25 lakh check dams and water distribution efforts through intra-state river linking have started paying dividends. In addition, Gujarat is both pioneer and leader in harnessing solar energy for irrigation purpose. Going by all this track record, it is no coincidence that the State proves to have high potential for doubling farmers’ income. Accordingly, the present report has included a host of specific strategies that are expected to exploit the natural advantage of Gujarat and to tap the entrepreneurial spirit of the farmers along with making better use of farm sector and business friendly initiatives of both the State and Central Governments alike.
A
(i)

Table of Contents 1. INTRODUCTION ................................................................................................................................... 1
2. GUJARAT STATE PROFILE .................................................................................................................... 5
3. INFRASTRUCTURE FOR AGRICULTURE & AGRICULTURE DEVELOPMENT PROGRAMMES ...............19
4. PRODUCTIVITY GAPS & MAJOR CONSTRAINTS .................................................................................25
5. POTENTIAL FOR DEVELOPMENT OF HORTICULTURE, LIVESTOCK, FISHERIES, AGRO-FORESTRY ANDPOST-HARVEST PROCESSING ............................................................................................................29
6. ROLE OF TECHNOLOGIES ..................................................................................................................31
7. VALUE-CHAIN DEVELOPMENT, MARKET LINKAGES &TRADE POTENTIAL ........................................85
8. POLICY AND INVESTMENT REQUIREMENTS AND ROLE OF GOVERNMENT ......................................94
9. IMPLEMENTATION PLAN AND INSTITUTIONAL RESPONSIBILITIES .................................................103
10. SUMMARY & RECOMMENDATIONS ................................................................................................111
List of Figures Figure 1 Agro-Climatic Zones of Gujarat State .............................................................................................. 5 Figure 2 Land Use Pattern in Gujarat State in 2014-15 ................................................................................. 7 Figure 3 Status of seed replacement rate (SRR) in Gujarat (Source: Anon., 2016c) ................................ 10 Figure 4 Fertilizer consumption in Gujarat over the last decade ................................................................. 10 Figure 5 Area and yield growth rates of major crops in Gujarat during 2001 to 2015 ............................... 13 Figure 6 Sources of income distribution of farmers in Gujarat and India ................................................... 18 Figure 7 Region-wise annual farmer’s income in Gujarat (2016-17) ......................................................... 18 Figure 8 Key challenges in improving farmers’ income .............................................................................. 26
List of Tables Table 1Details of the meetings conducted by the Gujarat SCC .................................................................. 2 Table 2 Major Characteristics of Agro-Climatic Zones of Gujarat ............................................................. 5 Table 3 Land holding pattern of farmers in Gujarat .................................................................................... 7 Table 4 Changes (%) in cropping pattern in Gujarat: TE 1982-83 to TE 20014-15 (‘000 ha) .................... 8 Table 5 Seeds requirement and availability (2011-12) ................................................................................ 9 Table 6 Annual compound growth rate (%) in crop sector of Gujarat ......................................................12 Table 7 Productivity (kg / ha) trends in major crops of Gujarat ................................................................12 Table 8 Rate of return to investments in Gujarat agriculture.....................................................................13 Table 9 District-wise percentage share and compound growth rate of output value in
Gujarat between 2001-02 and 20014-15 ..........15 Table 10 Drivers Gujarat’s agricultural development from 1980-81 to 2014-15 ......................................16 Table 11 Infrastructure availablility in rural Gujarat ................................................................................16 Table 12 Workforce profile of Gujarat state (in '000)...............................................................................16 Table 13 Farmers’ Income types and their doubling strategies ................................................................17 Table 14 Average monthly farmers’ income in Gujarat and India ...........................................................17 Table 15 Average farmer’s income in Gujarat and India (2016-17) / annum ...........................................18 Table 16 Varieties released for cultivation in Gujarat ..............................................................................23
(ii)

1. Introduction “If farmers give up farming, even the Rishis (Sages) cannot afford to survive.”- Thirukkural (300 BCE)
he above sacred verse from an ancient Indian literary text opines that no living person, however minimal his worldly needs be, could think of leading their lives without farming. The same
condition continues to be applicable to the present days as well and whatever may be the per capita incomelevels , the food cannot be simply downloaded from the internet. Though farming is the backbone of Indian economy, it is still intractably dependent on the vagaries of monsoons and dotted with small and fragmented holdings which in turn are run by resource poor farmers Agriculture in India is still dependent on the vagaries of monsoons and it is inextricably supported by small and fragmented holdings which in turn are run by resource poor farmers. Thereby, farming turns out to be a non-viable proposition and often not profitable. On the other hand, agricultural development in any region can occur only by: 1] growth in crop output; 2] increase in value of the given output; 3] diversification of agriculture towards high valued crops and livestock products (Bhalla and Singh, 2009). Here, the growth in output can result from two major phenomena: First, the output of a crop can increase due to a variety of reasons, including crop technology adoption, irrigation supplement to rain-fed crop, precision irrigation, and availability of adequate soil moisture and better soil nutrient management; or increase in area under the given crop. Second, the value of the given output in the market can increase due to changes in demand-supply situation, which is particularly important in the case of non-cereal crops and perishable products such as fruits and vegetables, and where the sufficient infrastructure for storage is either absent or economically unviable. Third, the farmers can shift to high valued crops or livestock, which give higher returns from unit of land and unit of livestock, respectively. Such a shift can be often subject to high crop risk or market risk (Kumar et al., 2009). But the availability of good credit facilities, marketing infrastructure, research and extension services and technical inputs can faster this process.
Over the years, agriculture has become an occupation marked by large-scale disguised unemployment and unending uncertainties at each and every stage of farm operations. Topping that, recent NSSO survey reveals that 40 per cent of the Indian farmers wish to leave farming if given with some other option. Coming to Gujarat, agriculture is not only a prominent feature of the state but also inextricably linked to its economy (Patel, 1977). It engages nearly half of the rural workforce (52%) despite a decline in its share in the state net domestic product (SNDP) to less than one-fifth, besides severe resource degradation. This is why despite the overall growth of 9.7 per cent per annum recorded since 2000s, the sectoral patterns of agricultural growth have been far from uniform in Gujarat. Given this background, our Hon’ble Prime Minister Shri. Narendra Modi has envisioned of doubling farmers’ income by 2022-23 – the 75th year of our Independence. To fuel his vision, he also unveiled a seven-point strategy for doubling farmers’ income viz. focused measures to scale up irrigation; providing quality seeds and assuring nutrients based on soil health; large investments in post-harvest technologies; prioritizing value addition, creating National Farm Market; leveraging PMFBY; and promoting on-farm ancillary activities. Subsequently, it has become a common understanding that in order to double the farmers’ income, there is a need to increase farm productivity, improve market access and also to develop the industrial and service sectors in rural areas, where the surplus farmers can find work.
In this context, it is pertinent to note that the latest Situational Assessment Survey of NSSO (2014) revealing nominal rise in farmers’ income pan-India between 2002-03 and 2013-14 has been an impressive 11.4 per cent but the real income has only grown by 3.5 per cent. Besides, it is also necessary to ensure that the rise in income is of inclusive nature. In other words, if large farmers alone are the focus then doubling real-time farmers’ income would be easily achievable. But that won’t be inclusive growth as the nation’s 80 per cent small and marginal farmers would be totally left out. Henceforth, more than average income of farmers, the median income (i.e. the middle-most income) is the one that
T
1

needs to be doubled. NSSO (2014) findings further substantiate this claim as they show mean farmers’ income in India to be around Rs. 6,250 per month but the median farmers’ income was found to be only around Rs. 1800 per month. Similarly, in Gujarat though the average farmers’ income was found to be Rs. 7900 per month, the median farmers’ income turned out to be Rs. 2500 per month alone. To workout feasible strategies relevant and to develop a road map to achieve this goal, the ICAR has constituted state level coordination committees (SCC) for all the Indian states vide reference F.No.5-4/2017-Cdn (Tech) Dated: 6th March, 2017. The composition of the Gujarat state Coordination Committees cobnstituted by ICAR for doubling Farmer’s income by March, 2022 is as follows:
i) Vice Chancellor, Junagarh Agrl. University, Near Motibaugh Vansthali Road, Junagarh-362 001, Gujarat
Chair
ii) Director, Directorate of Groundnut Research, Junagarh-362 001 Convener iii) Vice Chancellor, AAU, Anand-388 110, Gujarat Member iv) Vice Chancellor, Kamdhenu University, Karmayogi Bhavan, Sector-10-
A, Gandhinagar-382 010, Gujarat Member
v) Vice Chancellor, Navsari Agricultural University, Navsari. Member vi) Vice Chancellor, SKDAU, Sardarkrushinagar, Dantiwada. Member vii) Director, Directorate of Medicinal and Aromatic Plants Research Member viii) Director, ATARI Zone VIII Pune Member ix) Director, Agriculture, Govt. of Gujarat Member x) Director, Horticulture Govt. of Gujarat Member xi) Director, Animal Husbandry, Govt. of Gujarat Member xii) Director, Fisheries, Govt. of Gujarat Member xiii) Nominee of Secretary DAC&FW Member xiv) Nominee of Secretary, DAHDF Member xv) Nominee of Secretary, Ministry of Food Processing Industries Member
The details of the meetings conducted by the Co-ordination Committee for Doubling Farmers’ Income in Gujarat State are as follows:
Table 1Details of the meetings conducted by the Gujarat SCC
S. No. Date Venue Remarks 1 14 Mar., 2017 NAU, Navsari Zone: I & II 2 15 Mar., 2017 JAU, Junagadh Zone: VI & VII 3 21 Mar., 2017 AAU, Anand Zone: III & VIII 4 21 Mar., 2017 JAU, Junagadh Zone: VI & VII 5 22 Mar., 2017 AAU, Anand Zone: III & VIII 6 23 Mar., 2017 AAU, Anand All zone SLCC meeting 7 10 Apr., 2017 SDAU, Dantiwada Zone: IV & V 8 14 Apr., 2017 SDAU, Dantiwada Zone: IV & V 9 25 Apr., 2017 NAU, Navsari Zone: I & II 10 08 May, 2017 NAU, Navsari Zone: I & II 11 29 May, 2017 IIOR, Hyderabad Oilseed commodities 12 30 May, 2017 NCCSD, Ahmedabad Special reference to climate change 13 26 Oct., 2017 JAU, Junagadh Zone: VI & VII 14 28 Oct., 2017 JAU, Junagadh Zone: VI & VII 15 30 Oct., 2017 JAU, Junagadh All zone SLCC meeting
The mission of doubling farmers’ income requires accurate information on certain indicators which reflect the farmers’ income and welfare. For accounting farmers’ income, past studies have largely used data regarding growth in agricultural output (VOP/ AgGDP/ GSDP), output and input price behaviour along with price spread, rise in wages and rising indebtedness. The income data were obtained from various sources viz. (i) Farm business income from CACP data; (ii) Aggregate and disaggregate farm income using CSO and NSSO data; and (iii) Income purely on the basis of Situation Assessment Survey
2

of NSSO. Apart from these secondary sources of farm income, scientific benchmark survey at taluka level is not available and without which it will be difficult to ascertain robust changes in income levels. Thereby, before devising and implementing income doubling strategies, it is equally important to conduct benchmark surveys with a sample size of at least 100 farmers at each taluka based on land possession as well as cropping pattern. The NITI Aayog and Inter-Ministerial Committee on doubling farmers’ income have fixed the base year of income as 2016-17. Accordingly, the benchmark survey and the secondary data to be used should refer to 2016-17 as benchmark over which the farmers’ income needs to be doubled by 2022-23. In such a case, doubling of real farmers’ incomes within the next five years would require a mammoth agricultural growth rate of 10.46 per cent per annum which frankly had been never before achieved in the history of agrarian growth in independent India.But despite being an arid and semi-arid state with a high water-deficit scenario, Gujarat happens to be one of the few Indian states with consistent 7 per cent agricultural growth rate throughout the last decade. Thereby, it is in the realm of possibility for the State to achieve the goal of doubling farmers’ income. But before discussing the strategies of doubling income in Gujarat, it is vital to see how good the State is positioned in terms of agriculture and allied sectors and how much prepared is the State for achieving the goal within the targeted year.
Potential and Challenges of Gujarat state in Doubling Farmers’ Income
Agriculture growth rate at 9 % per annum throughout 2005-2015.
Large scale adoption of GM technology, irrigation and power sector reforms, targeted lab-to-land extension programmes, diversification towards high value crops and state-of-the-art infrastructure, cold storage & processing facilities.
Five crops (cotton, groundnut, wheat, sugarcane, fruits and vegetables) account for 71% of the total value of agri. output.
Monopoly in seed spices and also in castor production (70% of India).
Contribution to national production: 90% fennel, 65% cumin & 30% date palm and 35% of isabgol production.
Immense potential for organic wheat in Bhal region (Bhaliya wheat durum – GI).
Leading state in bio-fertilizer production and marketing.
First state in India to have a University exclusively for Organic Agriculture.
Presently, only 15% of the loan in the state is disbursed as investment credit.
Yield rates of all major crops are only 50% to 75% of their potential yields.
Available farm power is only about 1.20 kW/ha in Gujarat.
Challenges
Potential
3

Potential of Gujarat Horticulture in Doubling Farmers’ Income
Potential of in Agro-forestry, liovestock and fisheries in Gujarat in Doubling
Farmers’ Income
Potential
Area & production of horti. crops increased by 220% and 330% resp. during 2001 to 2015.
12% area under horticultural crops contribute 30% of state’s total farm income.
10.19 % share of fruit production & 6.49% of vegetable production in India.
Fourth leading state in fruit production & sixth leading state in vegetable production.
Highest productivity: onion (25 mt / ha.) & potato (28.81 mt / ha).
2nd highest production of banana, papaya and lime in India.
2nd highest productivity of pomegranate and sapota in India.
Biggest onion dehydration industry in the country comprising 80% of total dehydration units with processing capacity of 1 lakh tonne / annum.
Kesar (GI) mangoes famous the world over with high export potential.
Scope for HDP of mango in Saurashtra and South Gujarat ACZs.
Protected cultivation & protective irrigation has given better returns in Gujarat.
Agro-forestry:
Share of TOF (Trees Out-side Forest) is 2nd largest in India.
Anand district has the highest density of trees (66.1 trees per ha) in non-forest areas of India.
Livestock and fisheries:
19 registered breeds (13%) out of 151 registered breeds of the country.
Famous cattle breeds include Gir, Kankrej, Jaffarbadi, Mehsana, Banni, etc.
3rd largest milk producer (123 lakh MT) in 2015-16 and 7.33% growth in dairy sector during 2001-15.
Desi advantage: Largest share of local cows Saurashtra (45%) & South Gujarat (36%).
Livestock density in the tribal districts of Gujarat is highest in India.
Long coastal-line of 1600 km | 4.3 lakh hectare inland water bodies | 716 fishing villages | 3rd largest fish producing state in India.
Predominant fish breeds: Pomfret, Jew fish, Bombay duck, Shrimp, Lobster, Squid, Cuttle fish, Silver bar, Hilsa, Shark, Catfish and Mullets.
4

Legend: 1. South Gujarat (High rainfall area) 2. South Gujarat; 3. Middle Gujarat 4. North Gujarat; 5. North West Guj. 6. South Gujarat; 7. North Saurashtra 8. Bhal & coastal areas
2. Gujarat State Profile o begin with, the agro-climatic features of Gujarat are fairly diverse (as presented in figure 1), with rainfall varying from 340 mm (Western arid region) to 1800 mm (Southern hills).
Figure 1 Agro-Climatic Zones of Gujarat State
Table 2 Major Characteristics of Agro-Climatic Zones of Gujarat
Agro climatic zone Climate Type of soil Rainfall (mm) South Gujarat Semi arid to dry
sub-humid with heavy rain fall
Deep black with few patches of coastal alluvial, laterite and medium black
> 1500
South Gujarat Semi arid Deep black clayey 1000-1500 Middle Gujarat Semi arid Deep black, medium black to
loamy sand 800-1000
North Gujarat Arid to semi arid Sandy loam to sandy 625-875
Bhal and Coastal Area Arid to semi arid Medium black, poorly drained and saline
625-1000
South Saurashtra Dry sub humid Shallow medium black calcareous 625-750
North Saurashtra Dry sub humid Shallow medium black 400-700 North West Gujarat Arid to semi arid Sandy and saline 250-500
T
5

As shown in the Table 2 given above, Gujarat is divided into seven agro-climatic regions: (1) Southern Hills (Dangs and Valsad districts), having humid climate and 1793 mm average rainfall; (2) Southern Gujarat (Surat and Bharuch districts) with semi-arid climate, with 974 mm rainfall; (3) Middle Gujarat (Vadodara, Kheda and Panchmahal districts) having semi-arid climate, with 904 mm rainfall; (4) Northern Gujarat (Ahmedabad, Mehsana, Gandhinagar, Sabarkantha and Banaskantha districts) semiarid climate and average rainfall of 735mm; (5) North-west Arid (Kutch district) having extremely arid climate and 340 mm rainfall; (6) North Saurashtra (Amreli, Bhavnagar, Surendranagar, Jamnagar and Rajkot districts) having semiarid climate with 537 mm of average rainfall, and (7) South Saurashtra (Junagadh district); climate here is dry sub-humid with 844 mm average rainfall.
Cultivation of crops in each agro-climatic sub-division is conditioned by water availability among others. Nearly 20 per cent of the area of Gujarat is considered drought-prone, with high rainfall variability. The net cultivated area comprises 52 per cent of the reported area. As most of the arable land has been brought under cultivation, net sown area has ceased to grow. Land is increasingly becoming a binding constraint to agricultural expansion. Irrigation helps improve land productivity via crop intensification. Cropping intensity increased from 105 per cent in early-1960s to 113 per cent until early- 1990s. By early-2000s, the cropping intensity declined to 111 per cent and again got increased to 118% in 2015-16. A noticeable rise was seen in a few pockets in the middle and south Gujarat, while it continued to decline in the Saurashtra region. The other noteworthy feature of the land-use pattern is that forests occupy only 9.7 per cent of the reported area in Gujarat as compared to the national average of 21 per cent. Gujarat’s agriculture, besides being weather dependent, is dominated by small landholdings. In 1995-96, the average size of operational holdings was 2.6 ha, which further declined to 2.1 ha in 2015-16. Of the total holdings, 63 per cent are of less than or equal to 2 ha.
Key particulars of Gujarat State as of 2016-17
Total Geographical Area: 196 lakh ha and 66% with < 750 mm rainfall
Gujarat comprises 24.94% of arid and 33.66% of semi-arid areas of the country.
Net Area Sown: 103 lakh ha (52%) | Gross Cropped Area: 139 lakh hectares (71%).
Gross Irrigated area: 44.71% | Net Irrigated area: 43.24%
Operational land holders: 48.86 lakh | Average land holding: 2.03 ha
Land holding: < 1 ha (18.1 lakh) | 1-2 ha (14.3 lakh) | 2 to 5 ha (10.8 lakh) | 5 to 10 ha (5.1 lakh) | >10 ha (49,000)
Cropping intensity : 118% | 70% of GCA under non-food crops.
Increase in total cropped area in last the 15 years: 2.5 million ha (i.e. 1 million ha by conversion of fallow lands and 1.5 million ha in double cropping).
Water harvesting on top priority witn 1.75 lakh check dams & 2.25 lakh bori-bunds in the last decade.
Micro-irrigation (2016-17):12.2 lakh ha | Drip: 6.5 lakh ha | Sprinkler: 5.7 lakh ha
Net irrigated area to increase to 64% in the next five years due to Sardar Sarovar Narmada Ltd.
6

Land use pattern of Gujarat agriculture
As of 2014-15, in the total geographical area of 196.0 lakh ha of the State, 99.63 lakh ha (more than 50 per cent) was under net cultivable area (Figure 3). About two-third of the area of the State falls under arid and semi-arid tropics and the rainfed area in the State was about 66 lakh ha. The gross irrigated area was 56.14 lakh ha accounting for 45.97 per cent of total cropped area in which about 12.16 lakh ha was found to be saline and alkaline.
Figure 2 Land Use Pattern in Gujarat State in 2014-15
The gross cropped area was around 1.17 million ha. The cropping intensity across the State was 118.23 per cent and irrigation intensity was 132.62 per cent. Among the major crops the largest cropped area was occupied by cotton (18.95 lakh ha) followed by groundnut (16.31 lakh ha); wheat (13.21 lakh ha); pulses (8.24 lakh ha); rice (7.81 lakh ha); bajra (7.79 lakh ha); castor (7.06 lakh ha) and maize (5.13 lakh ha). The area under fruits and vegetables together comprised of 2.16 lakh ha in 2015-16. The total operational land holders in the State were 48.86 lakh with an average of 2.03 ha per land holder. Among the landholders, 37.16 per cent were marginal farmers, 29.25 per cent were small farmers, 22.10 per cent were semi- medium farmers, 10.49 per cent were medium farmers and 1.21 per cent were large farmers.
Land holding pattern in Gujarat
The size-wise distribution of operational holdings and area operated (Table 2) shows that in the year 2011-12, a majority of farm operators belonged to marginal and small farmer categories cultivating less than 2 hectares of land. Though they constituted about 62.9 per cent of total number of operational holdings, they operated only 26.8 per cent of total operational area. On the other hand, the large farmers (operating land area more than 10 hectares) and medium farmers (with operating land area of 4 - 10 ha) constituting only 24 per cent of total holdings occupied a substantial proportion (i.e., 43.9%) of total operational area.
Table 3 Land holding pattern of farmers in Gujarat Sl. No. Size class Total holdings Average size of
holdings (ha) Number Share (%) Area (ha) Share (%) 1 Marginal (0-1 ha) 15,85,042 (34.0) 7,92,149 (7.7) 0.50 2 Small (1-2 ha) 13,45,348 (28.9) 19,59,288 (19.1) 1.46 3 Semi-medium (2-4 ha) 10,80,611 (23.1) 30,04,213 (29.3) 2.78 4 Medium (4-10 ha) 5,822,29 (12.5) 33,80,443 (32.9) 5.81 5 Large (> 10 ha) 67,784 (1.5) 11,33,171 (11.0) 16.72 6 All size groups 46,61,014 (100.0) 102,69,264 (100.0) 2.20
Source: GOG (2012) 7

Cropping Pattern in Gujarat As seen in table 4, analysis of the cropping pattern in Gujarat brings out some unusual features. Up to early-1990s, bajra (pearl millet) and jowar (sorghum) were the main food crops and cotton and groundnut were the main non-food crops. Some significant changes have taken place in crop pattern of Gujarat in the post-liberalization period. Area under cereals which was around 40 per cent of the gross cropped area (GCA) in the early-1980s, declined to 36 per cent during TE 1992-93. Currently, the share of cereals is only 27 per cent (a decline of about 7 lakh ha since TE 1992-93). Area share of bajra that had remained constant at around 13 per cent till early-1990s has reduced to half in TE 2014-15. Similarly, area under jowar declined from 6.2 per cent of GCA to only 1.3 per cent during this period in 2009-10 and further decreased to 1.02 per cent in TE 2014-15.
Table 4 Changes (%) in cropping pattern in Gujarat: TE 1982-83 to TE 20014-15 (‘000 ha)
Crop 1982-83 1987-88 1992-93 1997-98 2003-04 2009-10 2014-15
Rice 5.44 5.78 6.12 6.67 5.99 6.18 7.14 Jowar 10.19 10.65 6.18 3.98 1.71 1.32 1.02 Bajra 13.80 14.82 13.32 11.8 9.56 6.50 5.56 Wheat 5.64 4.26 5.42 5.83 5.20 9.17 9.52 Maize 2.82 3.48 3.51 3.80 4.36 3.55 4.08 All cereals 40.27 40.64 35.52 32.76 27.27 26.77 27.32 Gram 0.96 0.71 0.84 0.98 0.78 1.48 2.12 Arhar 2.86 3.97 3.97 3.54 2.92 2.26 3.04 All pulses 7.87 8.43 8.66 8.11 7.04 6.79 8.96 Foodgrains 48.14 49.07 44.18 40.86 34.31 34.11 36.28 Groundnut 19.79 17.78 17.62 16.57 17.89 15.80 14.92 Sesamum 1.22 1.29 2.39 2.53 3.39 2.16 2.14 Castor 1.79 2.12 3.14 3.79 3.02 3.43 3.76 oilseeds 24.65 23.63 26.67 25.99 26.89 23.79 23.02 Sugarcane 1.02 1.27 1.62 2.13 1.84 1.76 1.72 Cotton 14.06 12.42 10.65 14.00 15.42 20.48 18.92 Tobacco 1.10 1.29 1.29 1.22 0.86 0.45 0.43 Spices 1.22 1.00 1.82 1.58 2.18 4.41 4.38 Other crops 9.81 11.32 13.77 14.22 18.50 15.00 18.50 GCA 10883 9484 10750 11088 10948 11787 11784 Source: Crop & Season Reports, Department of Agriculture, GoG (Various years)
On the other hand, average area under wheat has more than doubled, from 5.4 lakh ha in TE 1992-93 to nearly 9.5 lakh ha in TE 2014-15 and now shares 34 per cent of the total cereal area. Area under rice has remained more or less stable at 5-6 per cent of the GCA. Acreage under groundnut that was 18-19 per cent of GCA throughout the 1980s, has declined to 15.8 per cent in the recent period. Castor has gained from 2.1 per cent of GCA in TE 1982-83 to 3.5 per cent in TE 2014-15. Substantial shifts in area under cotton have been witnessed during the post-reforms period. In early 1980s, cotton was the dominant cash crop occupying 14 per cent of the GCA. By early-1990s, its share dropped to 11.9 lakh ha comprising 10.6 per cent of GCA. Since then, its share has improved considerably. The share of cotton has doubled and reached 20.5 per cent by TE 2014-15. About 12.2 lakh ha of area has been diverted from other crops, mainly coarse cereals and pulses, towards cotton in the post-reform period. Other crops that are substituting coarse cereals, pulses and oilseeds (to a lesser degree) are the spices, fruits, vegetables, floriculture and medicinal plants. The total area under spices rose from around 2 lakh ha in TE 1992-93
8

to 4.3 lakh ha in TE 2014-15. High-value crops such as spices, fruits, vegetables and medicinal plants occupy one-fifth of the GCA. The share of these crops was 8 per cent in TE 1982- 83, which rose to 14 per cent TE 1992-93 and further to 16 per cent in TE 2014-15. These trends suggest that cropping pattern in the state has changed in favour of superior, more remunerative cereals like wheat and high-value crops such as oilseeds, cotton, spices, fruits and vegetables, floricultural and medicinal plants. Groundnut and cotton, being the main cash crops, have retained their dominant position in the cropping pattern. Area under coarse cereals has declined because of their lack of competitiveness over other crops. On the other hand, area under oilseeds such as castor, mustard and sesame has expanded significantly, mainly as these crops provide better returns and promote value-added agribusiness enterprises. Castor also has a high level of global demand. India imports about half of its demand for edible oils and the international prices are a determining factor of the prices of the oilseeds. Overall, cropping pattern in the state after mid-1990s is responding to the forces of globalization. Commercialization does show the signs of deepening, as the crops having greater market-orientation are consolidating their share in the farm economy of Gujarat. Crops such as cotton, oilseeds, fruits, vegetables, spices and flowers, amenable to processing and value addition, are on the increase. This calls for expansion of post-harvest facilities (including foreign investments in processing, refrigerated transport and cold storage). These crops inherently provide higher returns per unit of land, resulting in higher incomes and employment generation in the rural areas.
Development indicators Seed requirement and availability in Gujarat
Seed is considered to be a catalyst of change in agriculture. As shown in table 3, there was significantly surplus availability of quality/certified seeds in Gujarat during both the seasons of 2011-12. Such a kind of abundant availability of quality/certified seeds has helped in enhancing agricultural production and productivity.
Table 5 Seeds requirement and availability (2011-12) Kharif Crops
Demand (in qtls.)
Supply (in qtls.)
Surplus/ Deficit
Rabi Crops
Demand (in qtls.)
Supply (in qtls.)
Surplus/ Deficit
Paddy 85,500 86,000 500 Wheat 4,25,000 4,32,500 7600 Bajra 26,250 27,006 756 Bajra 15,000 17,762 2762 Moong 15,000 15,300 300 Moong 12,000 22,100 10,100 Arhar 200,00 20,100 100 Gram 26,500 27,004 503 Groundnut 5,17,621 5,17,621 0 Groundnut 36,500 38,700 2200 Castor 2500 36,864 34,364 Mustard 6500 5610 110 Cotton 74,508 74,990 482 - - - - Total 7,41,379 7,77,881 36,502 Total 5,20,500 5,43,676 23,176
Source: GOG (2012)
Seed replacement rate in Gujarat
The Green Revolution adopted in India during the late sixties and early seventies bears witness to this truth. And lately, during the decade of 2000s, Bt cotton seeds and hybrid maize seeds have shown spectacular results, particularly in Gujarat. To complement with good agricultural growth in the state, the availability of quality/certified seeds has been made available as required in various part of Gujarat. However, the seed replacement rate (SRR) for majority of crops has been quite low. Even in the case of cotton and groundnut which are the pride of Gujarat, SRR has been as low as 25.5 per cent and 24.9 per cent respectively (Figure 3). Besides mustard and bajra, the SRR needs further improvement in case of other crops.
9

Figure 3 Status of seed replacement rate (SRR) in Gujarat (Source: Anon., 2016c)
Fertilizer consumption in Gujarat
Fertilizer consumption in Gujarat in the past decade is given in figure 4. The consumption of total fertilizer nutrients in Gujarat increased by from a total 0.51 million MT during 2000-01 to 1.565 million MT during 2013-14. During Kharif 2013, total nutrient consumption increased by 2.8% and in Rabi by 34.4% over the respective seasons in the previous year. Kharif: Rabi share in total consumption changed from 56:44 during 2012-13 to 50:50 during 2013-14. The consumption of N was at 1.159 million MT in 2013-14 and the same for P2O5 was 0.315 million MT and K2O was 0.091 million MT. NPK use ratio was reported to be 12.8:3.5:1 in 2013-14. The per hectare consumption of total fertilizer nutrients was reported to be 119.5 kg in the same period.
Figure 4 Fertilizer consumption in Gujarat over the last decade
Irrigation infrastructure in Gujarat
As of 2014-15, out of 117.4 lakh ha of cultivated land, about 49.4 lakh hectares area was irrigated. Thus, about 44.34 per cent of gross cropped area in the state was under irrigation. The net irrigated area in the state was 43.36 lakh ha and is projected to increase to 60 per cent within the next five years due to the
10

expansion under Narmada canal. Gujarat farmers rely on different sources of irrigation that include canals, tube wells, open wells and tanks. It may be noted that the share of canal irrigated area has remained unchanged at the level of 19 per cent and the combined irrigated area through tube wells and open wells has slightly declined from 79 per cent in 1990-91 to 76 per cent in 2014-15. However, the tube wells and open wells have been the major sources of irrigation in the state. Thus, the pressure on groundwater exploitation has considerably increased in Gujarat and in fact ground water has been over utilized in the state.
Shifting landscape of agriculture towards high-value and or high-yielding crops has been facilitated by irrigation development. As against 32 per cent of net cultivated area under irrigation in the period TE 1999-2000, the net irrigated area increased to nearly 42 per cent of the sown area in TE 2014-15. The dominant source of irrigation is through underground sources (78%), only 18 per cent is by canals and 4 per cent is by other sources such as tanks, and river lift. Recurrent droughts, introduction of high-yielding varieties and incentive-oriented pricing policy paved the way for extensive use of groundwater for farming. Groundwater with subsidized power to the farm sector had played an important role in sustaining the agrarian economy of North Gujarat. Here, 90 per cent of the total irrigated area is served by groundwater resources. Over-exploitation of groundwater causes drying of wells in parts of North Gujarat.
Falling groundwater table has resulted in increased initial investment in tubewell construction and has also added to variable costs of energy used for lifting water and well maintenance. It is reported that in North Gujarat the cost of irrigation amounts to nearly 36 per cent of the total input costs, with the result that the net return per unit of land for crops such as cotton and wheat remains the lowest in this region in comparison to other regions of Gujarat (Ranade and Kumar, 2004). The high cost associated with groundwater irrigation is affecting profitability of agriculture. Needless to add, groundwater over-exploitation with severely depleting water levels has serious equity implications. Shaheen and Shiyani (2005) in a study on access to groundwater in districts of North Gujarat have shown that Mehsana has the presence of company bore-wells in which farmers are shareholders. Economic access to groundwater in Mehsana is highly skewed towards small and marginal farmers. Farmers having low shares in bore-wells have been found to be better-off than farmers with higher shares in terms of access to the resource, relative to their share of investment in bore-wells. Formation of irrigation companies is an important mechanism for equity redistribution in this region as the small and fragmented landholdings make individual ownership of wells unviable.
Economic access to groundwater is skewed towards large farmers in Banaskantha where such informal bore-well organizations are absent, but the wells are shared within the family. In Gujarat, the total replenishable groundwater resource in 2010-11 was 17.3 km3 /year, utilizable groundwater resource for irrigation was 15.6 km3 /year and net draft was 10.2 km3 /year. Gujarat has potential to develop irrigation for 5.9 million ha of rainfed area through water conservation technologies and practices. Up to 2010-11, nearly 1.01 lakh small water harvesting structures had been completed under the watershed development programmes. These are in the nature of check dams, bori-bunds and farm ponds/tanks. More intensive extension efforts are needed to popularize water saving technologies such as drip and sprinkler irrigation systems for sustainable use of groundwater. The ultimate irrigation potential through surface sources is assessed at 3.9 million ha, of which 1.8 million ha is through major and medium schemes. Sardar Sarovar Project (SSP) has acultivable command area of 1.7 million ha. Minor irrigation has the potential to cover 0.4 million ha. Up to 2010-11, gravity flow irrigation from SSP had reached 72,000 ha. However, additional 2.15 lakh ha are being irrigated by lifting SSP water and transporting it by pipelines. Thus, even though the Narmada Canal has not delivered water to fields in the entire command, the completed network has enabled the farmers to tap water from the system. The gross
11

irrigated area through this could be in the range of 2.4 to 3.3 lakh ha. Further, Narmada water has replenished aquifers in North and Central Gujarat. Overall, the harnessed groundwater potential is around 2.04 million ha. Of ultimate irrigation potential by surface and ground water (excluding SSP); nearly 81 per cent has already been harnessed. Low soil moisture content, very high potential evapo-transpiration and aridity pose several limits to the choice of crops in Gujarat.
Dependency of state’s economy on agriculture
Liberalization has boosted the process of agricultural commercialization in Gujarat . This was possibly aided by enhanced availability of water due to Sardar Sarovar Project (SSP) and some proactive Government initiatives such as subsidized ectricity, extension services, soil health cards, mass based groundwater recharge through small water harvesting structures and spread of micro-irrigation. As shown in Table 5, the growth of aggregate output and land productivity for the major crops in Gujarat. Crop sector output in the period TE 1982-83 to TE 1992-93 was declining at – 2.12 per cent from 3.64 per cent recorded in TE 1972-73 to TE 1982-83, i.e., the phase coinciding with green revolution. With onset of liberalization (after TE 1992-93) decline in output growth continued. The output growth during TE 1999- 2000 and TE 2009-10, however, shows that early-2000s witnessed a significant trend break. Output after TE 1999-2000 has recorded unprecedented growth at 8.05 per cent, leading to growth in land productivity at 7.54 per cent from 0.14 per cent recorded in 1990s. Thus, early-2000s period can be considered a watershed after which output has recorded tremendous increase, making Gujarat the foremost state in India in terms of growth in value of agricultural output. The strong performance of Gujarat agriculture is also reflected in terms of increased crop yields in groundnut, wheat and rice; whereas the yield levels have been more or less sustained in all the major crops (Table 6).
Table 6 Annual compound growth rate (%) in crop sector of Gujarat
Particulars TE 1972-73
to TE 1982-83
TE 1982-83 to
TE 1992-93
TE 1992-93 to
TE 2002-03
TE 1999-00 to
TE 2009-10
TE 2010-11 to
TE 2014-15 Value of output 3.64 -2.12 -0.37 8.05 8.12 Land productivity 3.67 -0.15 0.14 7.54 7.78 Source: Crop & Season Reports, Department of Agriculture, GoG (Various years)
Table 7 Productivity (kg / ha) trends in major crops of Gujarat Crop TE 1982-83 TE 1992-93 TE 2002-03 TE 2004-05 TE 2009-10 TE 20014-15
Rice 1335 1332 1207 1483 1863 1902 Wheat 2316 2119 2223 2424 2689 2712 Jowar 566 597 733 876 1155 1190 Bajara 1194 891 1047 1170 1339 1268 Maize 1397 1193 1485 1436 1259 1250 Arhar 719 780 510 651 1001 1179 Groundnut 817 586 778 1111 1378 1562 Sugarcane 7422 8337 7056 7151 7069 7004 Cotton 205 239 1521 317 347 402 Source: Crop & Season Reports, Department of Agriculture, GoG (Various years)
12

Figure 5 Area and yield growth rates of major crops in Gujarat during 2001 to 2015 Note: All the growth rates were found significant at 1% level Source: GOG (2012)
Rate of return to investments in Gujarat agriculture
The estimated values of marginal product (EVMP) of research investment are given in Table 8. The results revealed that additional investment of one rupee in research generated more than Re 1 on an average, in all the crops, except sesamum during the period 1990-91 to 2011-12. The highest marginal product of research was achieved in castor closely, followed by cumin and cotton, where additional investment of Re. 1 generated additional output of Rs. 22.37, Rs. 19.33 and Rs 17.42, respectively. The groundnut also generated very good additional output of worth Rs. 11.89 and except Bajra. Cereals and pulses also generated additional output of above Rs. 5 for every one rupee that is invested. Further the table also shows that during the period 1990-91 to 2011-12, the overall rate of return to public agricultural research investment turned out to be 29 per cent for wheat, 34.70 per cent for paddy, 55.40 per cent for arhar, 36.70 per cent for gram, 27.10 per cent for groundnut 26.80 per cent for mustard, 53.90 per cent for castor and 41.90 per cent for cotton, while the highest being 74.90 per cent for cumin crop in Gujarat.
Table 8 Rate of return to investments in Gujarat agriculture
Crop Value of marginal product (in Rupees) Internal rate of return (in per cent)
Wheat 6.45 29.00 Paddy 8.18 34.70 Bajra 1.33 -- Arhar 8.21 55.40 Gram 6.34 36.70 Groundnut 11.89 27.10 Sesamum 0.89 -- Mustard 7.06 26.80 Castor 22.37 53.90 Cotton 17.42 41.90 Cumin 19.33 74.90
Source: Dhandhalya et al. (2017)
13

District-wise performance of Gujarat agriculture
In the 2000s decade, wheat and high-value crops, such as cotton, spices, fruits and vegetables were responsible for the rise in output. Even though the food grain area declined, the increase in its output was quite high. The overall growth of non-food grain between 2001-02 and 2014-15 was, however, higher at 8 per cent than of food grains (6 per cent); an indication of increasingly commercialized and diversified nature of Gujarat’s agriculture. The changes taking place in physical output for major crops are shown in figure 5. Among the major food crops, the yield growth of bajra (at 2.3%) between 2001 and 2015 could not offset the declining acreage under it. Jowar also recorded a decline in area growth (-0.53%) but the improvement in productivity at 3.5 per cent per annum.
Area under wheat has shown a statistically significant and phenomenal growth rate (10.7 per cent) and yield levels have also improved significantly (2.4 per cent) in the same period contributing to unprecedented rise in output. While the growth rate of area of pulses was modest at 1.6 per cent, its productivity showed a considerable breakthrough rising at 6 per cent. Among other food crops, potato, fruits & vegetables and spices (mainly chilly) have registered fairly high growth rates. The growth rate for area under spices was 12.1 per cent and its productivity also grew at 9.7 per cent significantly. State contributes 14-20 per cent share in major fruits and vegetables. Gujarat has recorded unprecedented growth in output of fruits and vegetables at 11 per cent contributed by very high growth in area (7.2 per cent) and productivity (4 per cent). The efforts of the Government to promote horticulture are actually bearing fruits. A few districts like Valsad are specializing in horticultural crops such as mango, sapota and cashew. With a view to double horticultural production and for simultaneous development of post-harvest infrastructure and marketing facilities, Gujarat State Horticultural Mission is being implemented in 15 potential districts. Output of potato has nearly doubled in the post-liberalization phase. Area growth (6%) is mainly responsible for this trend.
Sugarcane cultivation has largely been confined to the irrigated districts of Vadodara. Bharuch, Valsad, Kheda and Surat recorded high cane output growth in the decade of 1980s. However, cane cultivation is proving to be unsustainable, as can be seen from stagnation in yield and decline in area under the crop. Water logging and salinity, afflicting the canal-irrigated tracts where sugarcane is cultivated, are adversely affecting the yield of this crop. Gujarat is a major groundnut-producing state and its average contribution to the total production in the country is 37 per cent. In the post-liberalization phase, even though groundnut acreage is facing stagnation or replacement by other crops, its yield performance (2.36 per cent) is better owing to several years of good rainfall that facilitates early sowing. The area under sesame has recorded a huge growth at 5 per cent was also found to be between 2001 and 2015 which was not so earlier. Large area shifts under this crop (replacing coarse cereals) are somewhat undermined by the productivity decline, and the output growth is a modest 3 per cent annually. In contrast, while area under castor has remained more or less the same, the statistically significant growth in its output at nearly 5.8 per cent has attributed largely to improvements in productivity at 4.2 per cent. Overall, the output of oilseeds in Gujarat is growing at a high rate of 4.1 per cent almost entirely driven by the productivity growth (4.8 per cent). Oilseeds apart from technological inputs require effective measures for the post-harvest processing activities. Cotton is currently the single most important nonfood crop of Gujarat. There has been a marked improvement in cotton production in post-liberalization phase. Area under cotton increased at the rate of 5.3 per cent and its productivity grew at 11.4 per cent. During the period, this was the highest achievement for any single crop in Gujarat.
The single most important factor driving the growth in cotton is the widespread adoption of Bt cotton. Measures such as water harvesting through checkdams and water availability from the Narmada project and other irrigation projects pursued by the state, have aided the shift towards cotton quite significantly. Further, a strong local marketing system comprising agribusinesses and cooperatives, has helped to
14

deliver inputs and handle marketing of the output efficiently. A noteworthy fact is that benefits from Bt cotton in terms of yields have been scale-neutral. Bt cotton yields have been reported to be similar across different farm categories. The yield increases for Bt cotton are found to be 35 per cent higher than of traditional high-yielding varieties. Even after foregoing the higher cost of cultivation for Bt cotton due to higher seed cost, net profit is reported to increase by 75 per cent with adoption of Bt cotton. This explains the success of Bt cotton in Gujarat (Gandhi and Namboodiri, 2009).
Table 9 District-wise percentage share and compound growth rate of output value in Gujarat between 2001-02 and 20014-15
District Total food grains Other crops
% share Growth rate (%) % share Growth rate (%) Ahmedabad 6.36 8.99 3.99 4.62 Banaskantha 7.88 2.76 6.53 4.35 Bharuch 5.20 1.46 7.10 3.45 Dang 0.72 14.49 0.17 17.68 Gandhinagar 1.58 13.48 0.66 21.38 Kheda 14.06 5.64 7.34 3.81 Mehsana 9.35 5.18 6.21 1.00 Panchmahal 7.43 4.10 1.66 17.54 Sabarkantha 7.79 3.08 5.03 4.39 Surat 10.00 0.32 11.15 2.10 Baroda 7.03 -2.04 6.43 4.47 Valsad 5.23 2.24 4.63 2.79 Amreli 1.73 7.92 4.09 13.78 Bhavnagar 2.36 9.39 4.69 16.73 Jamnagar 1.45 14.00 3.86 17.80 Junagadh 4.40 18.88 10.33 7.28 Kutch 2.95 7.72 3.68 8.84 Rajkot 1.81 19.47 5.98 15.91 Surendranagar 2.67 5.04 6.46 9.34 Gujarat State 100 6.03 100 8.05 Source: Crop & Season Reports, Department of Agriculture, GoG (Various years) Note: All the growth rates were found to be significant at 1 % level.
The district-wise growth rates of food grains and other crops are presented in table 10. It can be seen that the growth rates in food grains reported to be more than 10 per cent between 2001 and 2015 in the districts of Dang, Gandhinagar, Junagadh, Jamnagar and Rajkot. At the same time, for the crops other than food crops more than 10 per cent growth rate was reported in the districts of Dang, Gandhinagar, Panchmahal, Amreli, Bhavnagar, Jamnagar and Rajkot.
Drivers of agricultural development in Gujarat
The period after 1999-2000 saw a turn-around in Gujarat, as far as agricultural growth is concerned. Between 1999-2000 and 2014-15, Gujarat agriculture (including dairying) grew at a statistically significant rate of 10 per cent. Further, its contribution to state NSDP after 2004-05 has stabilized at 17-19 per cent. Thus, despite long-term declining share of agriculture sector in the state and severe output and income fluctuations, the period of 2000s was one of high growth. Relationship between the behaviour of agriculture sector and that of NSDP has strengthened in recent times. It is important to find out the crops which have actually contributed to this growth. This is crucial to identify the factors that are driving this growth. For this, the changes in gross value of total agricultural outputs (at current prices)
15

during the period from 1980-81 to 2006-07 were analyzed using data from Central Statistical Organization, and compared against that of individual produce. Our analysis shows that the increase in gross value of agricultural outputs in the state was in the tune of 41,150 crore rupees. Five major agricultural produce, which have contributed to the growth, are: milk, followed by cotton, horticultural crops, groundnut and sugarcane, whereas wheat and paddy take 6th and 7th place (Table 10). This clearly shows that dairy production remains to be frontrunner in Gujarat’s agricultural growth parade.
Table 10 Drivers Gujarat’s agricultural development from 1980-81 to 2014-15
Sr. No
Name of Crop and Dairy Product
Total Increase in Value Output (crore)
% Contribution to the Value Increase in Gross of Agricultural Output
1 Milk 8995.70 21.90 2 Cotton 6162.90 15.00 3 Horticultural crops 5691.40 13.80 4 Groundnut 4955.60 12.00 5 Sugarcane 2422.50 5.90 6 Wheat 1943.30 4.70 7 Paddy 1167.80 2.83 Source: Crop & Season Reports, Department of Agriculture, GoG (Various years)
Rural Infrastructure and work force
Concerted efforts by the government on enhancing the rural infrastructure and to improve the livelihood has been paying consistent dividends. The current status of rural infrastructure in Gujarat is summarized in Table 4.
Table 11 Infrastructure availablility in rural Gujarat
Infrastructure Achievement (Nos.) Villages electrified 18610 Villages having agriculture power supply 15115 Villages having post office 8979 Villages having banking facilities 8251 Villages having primary schools 15501 Villages having primary health centres 1174 Villages having potable water supply 18697 Villages connected with paver approach roads 21505
Source: Agriculture Census, 2010-11
The workforce availability in the state summarized in Table 5 show that workers employed in non-farm sector form the major share (53 per cent) of total workers’ profile. The number of cultivators and agricultural labourers are almost equal in number.
Table 12 Workforce profile of Gujarat state (in '000)
Type of workforce Population (Nos.) Cultivators 4747 Agricultural labourers 4492 Workers engaged in household industries 252 Other workers 10874
Source: Agriculture Census, 2010-11
16

Status of farmers’ income in Gujarat as of 2016-17
At the outset, as Table 2 suggests, it is important to double the real income levels and not just the nominal incomes. Accordingly, the inflation factor needs to be adjusted while accounting the income change. Farmers’ income in Gujarat is more diversified when compared to the whole of India. Past trends reveal that though during 2008-09 to 2013-14 farmers‟ average income at nominal prices grew at 14.8 per cent annually on an average, the real growth was only at 3.1 per cent per annum. The latest Situational Assessment Survey of NSSO (2014) also reveals that the nominal rise in farmers‟ income pan-India between 2002-03 and 2013-14 has been an impressive 11.4 per cent but the real income has only grown by 3.5 per cent. Besides, it is also necessary to ensure that the rise in income is of inclusive nature. In other words, if large farmers alone are the focus then doubling real-time farmers‟ income would be easily achievable. But that won’t be inclusive growth as the nation’s 80 per cent small and marginal farmers would be totally left out. Henceforth, more than average income of farmers, the median income (i.e. the middle-most income) is the one that needs to be doubled. NSSO (2014) findings further substantiate this claim as they show mean farmers‟ income in India to be around Rs. 6,250 per month but the median farmers‟ income was found to be only around Rs. 1800 per month. Similarly, in Gujarat though the average farmers‟ income was found to be Rs. 7900 per month, the median farmers‟ income turned out to be Rs. 2500 per month alone. As it could be seen from both Table 4 and Figure 5, the livestock component happens to assure an income of Rs. 1930 per month which is 24 per cent of farmers’ income in the State against Rs. 763 per month in India (11.86 per cent). Moreover, the figures also reveal that farm income is just one of the components of farmers’ income as they constitute only 37 per cent and 48 per cent of the same in Gujarat and India, respectively.
Table 13 Farmers’ Income types and their doubling strategies Type of Income Doubling Strategy
Per capita farm income Can be achieved with both on-farm (crop cultivation) and off-farm (livestock, poultry) activities.
Per capita income of agricultural households
Can be achieved by diverting members in a farm household to other non-farm and wage jobs alone.
Mean farm income Can easily be doubled by encouraging large farmers farming alone. Median farm income Doubling not possible without including small and marginal farmers. Nominal farm income Inflation will take care of its doubling. Real farm income Doubling has to be achieved against prevailing inflation levels. Per capita median real income of farmers
Cannot be achieved by leaving out small and marginal farmers of the State or by focusing on farm output alone. Needs an inclusive kind of approach.
Table 14 Average monthly farmers’ income in Gujarat and India
Particulars
Net receipt from
cultivation (Rs)
Net receipt from
livestock (Rs)
Net receipt from
nonfarm business
(Rs)
Net income from wages (Rs)
Total income
(Rs)
Total consumption expenditure
(Rs)
Estd. no. of agri.
Households (‘00)
Gujarat 2933
(37.00) 1930
(24.36) 380
(4.79) 2683
(33.85) 7926 7672 39,305
India 3081
(47.95) 763
(11.86) 512
(7.96) 2071
(32.23) 6426 6223 9,02,011
17
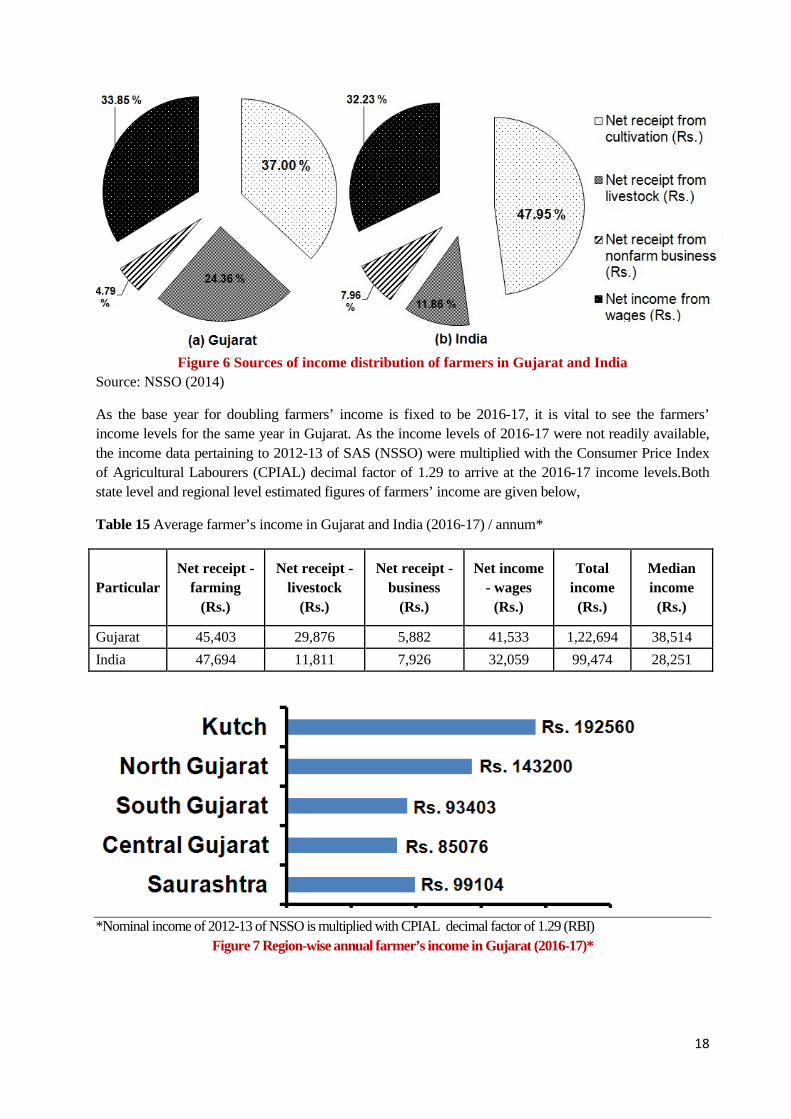
Figure 6 Sources of income distribution of farmers in Gujarat and India
Source: NSSO (2014)
As the base year for doubling farmers’ income is fixed to be 2016-17, it is vital to see the farmers’ income levels for the same year in Gujarat. As the income levels of 2016-17 were not readily available, the income data pertaining to 2012-13 of SAS (NSSO) were multiplied with the Consumer Price Index of Agricultural Labourers (CPIAL) decimal factor of 1.29 to arrive at the 2016-17 income levels.Both state level and regional level estimated figures of farmers’ income are given below,
Table 15 Average farmer’s income in Gujarat and India (2016-17) / annum*
Particular Net receipt -
farming (Rs.)
Net receipt -livestock
(Rs.)
Net receipt - business
(Rs.)
Net income - wages
(Rs.)
Total income
(Rs.)
Median income
(Rs.)
Gujarat 45,403 29,876 5,882 41,533 1,22,694 38,514 India 47,694 11,811 7,926 32,059 99,474 28,251
*Nominal income of 2012-13 of NSSO is multiplied with CPIAL decimal factor of 1.29 (RBI)
Figure 7 Region-wise annual farmer’s income in Gujarat (2016-17)*
18

3. Infrastructure for agriculture & agriculture development programmes
State Agricultural Universities
he four agricultural varsities in Gujarat to cater the needs of agricultural education, research and extension of the state are as follows:
• Junagadh Agricultural University (JAU) offers education in agriculture and allied sciences i.e. Agriculture, Agril. Engineering, Fisheries, Veterinary Science & Animal Husbandary and Agri-Business Management and consists a total of seven colleges with its jurisdiction in ten districts of the state in Saurashtra region viz., Amreli, Bhavnagar, Jamnagar, Junagadh, Porbandar, Rajkot, Surendranagar, Devbhoomi Dwarka, Gir Somnath and Morbi covering about 32.82 per cent area of the Gujarat State. Besides, there are seven multidisciplinary main research stations, five main research stations and eleven Sub-Research Stations/ Testing Centres in the university. The extension component includes six Krushi Vigyan Kendras (KVKs), one Sardar Smruti Kendra (SSK), Centre of Excellence of Training in Groundnut, Centre of Excellence on Soil-Water Management and a T & V Scheme.
• Anand Agricultural University (AAU) is comprised of seven Colleges, seventeen Research Centers and six Extension Education Institutes working in nine districts of Gujarat namely Ahmedabad, Anand, Dahod, Kheda, Panchmahal, Vadodara, Mahisagar, Botad and Chhotaudepur.
• Sardarkrushinagar Dantiwada Agricultural University (SDAU) extends its jurisdiction to seven Districts of North Gujarat region viz., Banaskantha, Sabarkantha, Mehsana, Patan, Gandhinagar, Kachchh and Aravalli. It is aimed to serve the agricultural interest for the economic development of the farming community of North Gujarat region with 8 colleges, 28 Research Stations and 3 Krishi Vigyan Kendras (KVKs) in its ambit.
• Navsari Agricultural University’s (NAU) jurisdiction covers seven districts of South Gujarat viz., Narmada, Bharuch, Surat, Tapi, Navsari, Dangs and Valsad and is comprised of ten colleges, seven polytechnic institutes, 20 research centres along with five KVKs and one SSK.
ICAR Research Institues and regional research stations
• ICAR-Directorate of Groundnut Research, Junagadh
• ICAR-Directorate of Medicinal and Aromatic Plants Research, Anand
• Regional Research Stations of the ICAR- Central Arid Zone Research Institute, Central Institute of Arid Horticulture, Central Marine Fisheries Research Institute, Central Institute of Fisheries Technology, Central Inland Fisheries Research Institute
Initiatives in agricultural sector by Government of Gujarat
Soil Health Card: Pioneer State in implementation
Gujarat was the first state to launch the most lauded initiative of preparing Soil Health Cards for its farming community. This acts like a ration card, providing permanent identification for the status of cultivated land, as well as farmers' names, account numbers, survey numbers, soil fertility status and general fertilizer dosage. Some of the major achievements of the scheme are as follows:
T
19

• Soil Health Cards have been provided to 13,66,016 farmers as on 15.11.2016.
• At present, there are total 141 soil testing laboratories in Gujarat State.
• Soil Fertility Maps are prepared and distributed for about for 9300 villages.
Krushi Mahotsavs: The flagship event of GoG
The Government of Gujarat introduced the concept of krushi mahotsavs in 2005 as an innovative approach in agriculture. Krushi mahotsavs pave way for horizontal transfer of technologies and promote scientific and sustainable method of crop production and development of agriculture and allied sector among farmers. Several studies have revealed enhanced of farm prosperity as well as better socio economic condition of the farmers as a result of successful krishi mahotsavs. Apart from providing guidance to the farmers, animal vaccination camps and artificial insemination activities are also carried out during such a flagship event. Guidance to farmers are provided for scientific farming, organic farming, farm mechanization, micro irrigation, crop value addition and information about various government schemes during krushi mahotsavs. It can be well said that krushi mahotsavs are nothing short of a unique ‘lab to land to market programme’ benefitting farmers on a larger scale with real-time information.
I-khedut Portal: An e-Extension milestone
To provide diverse agricultural information to farmers from technology to market price aspects, the online portal (http://kcc.gujarat.gov.in) for farmers was started by Department of Agriculture, Government of Gujarat. The portal has benefitted 17.13 lakh farmers as on June, 2016.
The salient features of the portal are as given below:
• Beneficiaries to get benefits of various agriculture related schemes; • Detailed list of dealers providing agricultural machineries; • Information of agencies providing agricultural credit; • Latest technical information related to agriculture; • Various APMC market price of agricultural commodities; • Solutions related to problems in agriculture.; • Details of agricultural land.
Jyotigram Yojana: One scheme, many benefits
Jyotigram Yojana is an initiative of the Government of Gujarat to ensure availability of 24-hour three phase quality power supply to rural areas and to supply power to farmers residing in scattered farm houses through feeders having specially designed transformers. The scheme separated agricultural feeders from domestic feeders resulting in agricultural connections such as irrigation pumpsets getting 24 X 7 assured electricity supply with good voltage. The scheme was dedicated to the nation by the erstwhile Hon’ble President of India, Dr. A. P. J. Abdul Kalam in 2006. Stockholm International Water Institute (SIWI) has commended the scheme saying it has radically improved the quality of village life, spurred non-farm economic enterprises, improved small-scale industries and halved the power subsidy in agriculture. Besides, Government of India also accepted Gujarat's Jyotigram project as a flagship scheme in the 12th Five-Year Plan. In a short span of two and a half years, i.e. from October 2004 to March 2006, JGY involved erection of 1.6 million electric poles installation of 15,500 transformers and laying down of 75,000 kms of electric lines. As a result of
20

which the scheme has brought down transmission and distribution losses. The model is now being followed in most of the states.
Gujarat Green Revolution Company: Micro-irrigation redefined
Gujarat Green Revolution Company Limited (GGRC) promoted by Gujarat State Fertilizers & Chemicals Limited, Gujarat Narmada Valley Fertilizers Company Limited and Gujarat Agro Industries Corporation Limited has revolutionized the concept of micro irrigation systems (MIS) in the State. The Micro Irrigation Scheme is being implemented in a uniform mode by GGRC on behalf of the Government of Gujarat and the Government of India, since May 2005. Being a State with limited source of irrigation facilities, the main objective of the Micro Irrigation Scheme is to benefit the farmers by increasing agricultural production through the adoption of scientific water management techniques so as to usher in the Second Green Revolution. In pursuance of this objective, the State Government has embarked upon Jal Sanchay Abhiyan, (Drive for Storage of Water) in which the Micro Irrigation Scheme is an integral part of the Programme. The Micro Irrigation Scheme has been made more popular by providing electricity connections, on a priority basis, to those farmers who adopt Micro Irrigation Systems on their agricultural lands. GGRC provides for the implementation of the Scheme in an integrated manner with the provision of financial assistance to beneficiary farmers for adopting MIS viz. drip/ sprinkler/ rain guns/ porous pipes. The company has been effectively utilizing ICT integration of Project, Financial and Management Information right from the start to such an extent that even physical inspection of farmer and material is carried out by GPS technology. The scheme was such a roaring success that from 16,000 ha (in 2005-06), the scheme has covered 10,34,930 ha (as of 2014-15) benefitting a total number of 6,40,853 farmers and disbursing a total amount of Rs. 2866.43 crore as subsidy. In the tribal areas alone, 1,31,293 farmers have adopted MIS over a cumulative area of 1,78,745 hectares. Thereby, it is no coincidence for the scheme to get recommended by the Central Government to other States as well in the year 2012. The major field crops covered under MIS are groundnut, cotton, sugarcane and castor while the major horticulture crops covered under the scheme include potato, banana, mango, papaya and vegetables.
Additional Income realized by Gujarat farmers due to Micro Irrigation Systems (MIS)
Source: GGRC (2016)
21

Promotion of Sardar Package
For increased adoption of MIS and to maximize benefits from the same, the Government of Gujarat has come up with an innovative Sardar Package containing the following components such as:
1. Micro Irrigation Systems (MIS): For ensuring water, energy, labour, fertilizer savingtechnology coupled with the increase in the yield.
2. Solar Pump: For promoting eco-friendly system in lifting irrigation water through pump.3. Protected Cultivation Structures: To further save water, energy, labour coupled with high
quality of produce with increase in yield.4. Water Soluble Fertilizers: For precise use of fertilizers by the way of application through
Drip Irrigation System to enhance fertilizer use efficiency.5. Bio-fertilizers: To facilitate organic farming among farmers.
Check-dam movement: A success with no parallels
With 20 per cent area of the State having 71 per cent of the water resource and 80 per cent area of the State having 29 per cent water resource, the natural distribution of water is also skewed in Gujarat. The Saurashtra region once faced endless series of droughts for almost three decades. But since 2000, the area has become self-sufficient due to the construction of check dams that prevents wastage of precious rainwater. Nowhere else in the world have check dams been built on this scale. Since 2000, the state has built 126,000 check dams at an average cost of Rs 5 lakh to Rs 6 lakh each. About 55,000 of those dams were constructed in Saurashtra alone. The check-dams have increased the period of water availability by at least four months. They have become central to efforts to promote agriculture and have immensely contributed to achieve double digit growth in agriculture throughout the last decade.
Though the check-dam movement gained traction in the early 1990’s in Gujarat through community-led initiatives in the Saurashtra region, the State government helped things along in 2000 with its Sardar Patel Participatory Water Conservation Project. Through this scheme, the state bears 80 per cent of the cost of building a check-dam and farmers or NGOs would have to pitch in the remaining 20 per cent of the cost. Andhra Pradesh, Karnataka, Maharashtra, Odisha and Rajasthan have started following in Gujarat's footsteps in check-dam movement.
Canal-top solar power project: First ever, best ever
In the year 2012, the Government of Gujarat carried out a unique project of constructing solar panels over the canals to reduce water loss due to evaporation and to increase sustainability in the command area. Soon it became the world’s first Canal-top Solar Power Project. It aims to utilize the 19,000 km long network of Narmada canals across the state for setting up solar panels to generate electricity. Accordingly, in the year 2012, the world’s first one megawatt (MW) solar power project was set up at Chandrasan village, in Mehsana district of Gujarat. Solar panels were fixed over a 750-metre stretch of an irrigation canal. Unlike many solar power projects, this one did not consume large amounts of land since the panels were constructed over the canals, and not on additional land. The Chandrasan project has been found saving 9 million litres of water every year. At present, Gujarat has about 458 km of open main canal, while the total canal length including sub-branches is about 19,000 km and Sardar Sarovar Narmada Nigam Ltd. (SSNNL) is in the process of extending the canal network to 85,000 km. As of now, even by utilizing only 10 per cent of the existing canal network of 19,000 kilometres, more than 2,200 MW of solar power generating capacity can be
22

installed by covering the canals with solar panels. In addition to that, 11,000 acres of land can be potentially conserved along with about 20 billion litres of water saved per year.
Interlinking of rivers in the State: Leading among pioneers
As per International standards if per capita availability of water is less than 1700 m3/year, the region is “water stressed”, and if less than 1000 m3/year, the region is “water scarce”. In Gujarat, Saurashtra, North Gujarat and Kutch regions are not just water scarced but also water parched as the per capita water availability is 540, 343 and 719 m3 / year, respectively. Thereby, to fulfill the water requirement of water scarce areas, the State is expediting efforts in full-swing to divert excess water from surplus basin to water deficit areas. The State has already taken up very important and pioneering steps for interlinking rivers. A few among them are given here as follows:
Inter basin transfer of water from Narmada main canal to en-route rivers: This plan is executed to divert the flow of Narmada water available during flood through Narmada main canal to eleven other rivers of Gujarat viz. Heran, Orsang, Karad, Mahi, Saidak, Mohar, Watrak, Sabarmati, Khari, Rupen and Banas. Besides, the scheme also leads to the filling of about 700 small / large village Tanks / Ponds by Narmada water.
Sujlam-Suflam Spreading Channel: This spreading channel is proposed to divert overflowing flood water from Kadana dam by gravity to the water deficit areas of Panchmahals, Gandhinagar, Sabarkantha, Mehsana and parts of Banaskantha districts. The length of the proposed channel is 332 km and is expected to help in recharging 21 rivers which include Khari, Watrak, Meshwo, Mazam, Rupen, Pushpavati, Saraswati and Banas River. It is also expected to benefit 70,000 ha in seven districts of the state.
Interlinking of coastal rivers in Saurashtra region: The Government of Gujarat has also expediting an ambitious plan to interconnect rivers through spreading channels in order to prevent salinity ingress along the coastal belt of the Saurashtra. The total length of spreading channel is planned to be 360 Km. Apart from addressing salinity ingress, it is also expected that rain water stored in the channel will recharge the aquifers of ground water and surrounding area.
Table 16 Varieties released for cultivation in Gujarat
Crop Varieties released by SAUs in Gujarat Important contribution Wheat GW-89 (1984), GW-496 and GW-503 (1989),
GW-273 (1997), GW-322 (2002) and GW-366 (2006).
Remarkably increased the yields of wheat.
GW-496 Largely adopted by the farmers due to its superiority in yield, resistant to rust and high adaptability in the soil and climate of the state
GW-366 Gaining popularity having attractive bold grain size and high yield.
Rice GR-101 in 1984, GR-103 in 1990, GR-6 in 1991, Gurjari in 1997, Dandi and GR-7 in 2000, GR-8 in 2001, GR-12 in 2004, GAR-13 in 2009 and GAR-1 in 2010
Increased productivity of paddy with improved resource use efficiency of inputs.
Groundnut GG-2 in 1986 (bunch type), GG-20 (semi-spreading) and GG-12 (spreading), in 1991, GG-13 (spreading) in 1994, GG-7 in 2000
The variety GG-20 is performing well, covering about 80 per cent of the total groundnut area in the state.
GJG-HPS-1 in 2008, GJG-9 and GJG-31 in 2010 Varieties released by JAU are gaining traction among farmers due to its high yield potential and export quality.
23

Cotton G. Cot. Hy. 6 in 1979, G. Cot. 13 in 1981, G. Cot. Deshi Hy.7 in 1984, G. Cot. Hy. 8 in 1987, GH-10 in 1995 and introduction of high yielding Bt. cotton varieties.
Gujarat state has been catapulted to be a leading state in cotton production.
Cumin Gujarat Cumin-1 in 1982, Gujarat Cumin-2 in 1992, Gujarat Cumin-3 in 1998 and Gujarat Cumin-4 in 2003
Improved productivity levels over the decades.
Bajra GHB-30 and GHB-32 in 1985, GHB- 526 & 558 in 2002, GHB-538 in 2004 and GHB-757 and GHB-732 in 2007
Moderately increased the productivity of bajra, particularly in summer season.
Castor GCH-2 in 1985, GCH-4 in 1986, GCH-5 in 1994, GCH-6 in 2000, GCH-7 in 2006 and GC-3 in 2009
Gujarat has recorded 70 per cent of India’s castor production since 1980’s.
Arhar BDN-2 in 1984, GT-100 in 1992, GT-101 in 2003 and GT-Hy-1 in 2004
Have become highly popular among the farmers as these varieties require only 2-3 irrigations after end of the monsoon. BDN 2 and GT 101
Gram GG-1 and GG-2 60 per cent irrigated and 80 per cent rainfed area under gram cultivation in the state covered by chickpea varieties.
Gujarat Junagadh Gram-3 High yield potential, earliness, large sized seeds with attractive yellow colour and wilt resistance. It covered sizable irrigated area of the state.
Til G. Til.1 in 1979, G. Til.2 in 1994, G.Til-10 in 2003 (black Til), G.Til-3 in 2005 and G.Til-4 in 2010
Improved productivity levels over the decades.
Mustard Gujarat Mustard-1 in 1989, Gujarat Mustard-2 in 1995, Gujarat Mustard-3 in 2006 and Gujarat Dantiwada Mustard-4 in 2011 in the state
Improved productivity levels over the decades.
Gujarat’s agro-vision
Gujarat is at the forefront of national exports of floricultural products, spices, castor, sesame, cotton, psyllium and processed fruits and vegetables, indicating comparative advantage of Gujarat in these products. Such developments were given policy support in the Gujarat Agro-Vision 2010 document that emphasized relationship between primary and secondary sectors through development of agro-industries. It has also been felt that barren and wastelands that occupy nearly 5 lakh ha could be well utilized by diverting less-productive dryland crops to horticultural crops.
The Government of Gujarat has adopted strategies that are geared to overcome constraints faced in cultivation of these crops. Some of them are: 1) Supply of good quality planting material (grafts, saplings and seeds) for horticultural crops; 2) Introduction of new crops; 3) Cultivation on waste/fallow land, border plantation, inter-cropping and crop rotation; 4) Increasing productivity by using sophisticated technology such as micro-irrigation systems; 5) Promoting corporate/contract farming, export oriented production practices; 6) Strengthening of marketing societies; 7) Provide training to farmers for post-harvest packaging and orchard management; and 8) Establishment of export zones for onions and fruits & vegetables processing.
24

4. Productivity gaps & major constraintsujarat agriculture is dotted with serious challenges on both production and marketing fronts but when it comes to the former there seems to be as much challenges bestowed default by nature as
that of operational and adoption constraints prevailing in the farming sector (Figure 4). Accordingly, the State is characterized by erratic and uncertain rainfall coupled with large inter-annual rainfall variability. Besides, the hard rock hydrogeology prevailing in the State only helps in rendering it highly vulnerable to frequent water scarcity conditions and droughts. This has led to the unintended overexploitation of groundwater leading to surge in salinity levels and lands becoming virtually useless. As groundwater alone accounts to more than 80 per cent of irrigation requirement in irrigation, it is no coincidence that the gross mismanagement of the resource has lowered the water table in many parts of the State and has the escalated cost of cultivation. On the other hand, rapid urbanization and land use changes have drastically decreased the infiltration rate of the soil and have diminished the natural recharging capacity of aquifers as well.
Apart from all these natural or inherited challenges, low key awareness on non-monetary inputs and limited technology adoption among the farmers is also a cause of worry. For instance, the State is found to have very low seed replacement ratio (SRR) among all the major states. The SRR in wheat, desi cotton, pulses, groundnut and soybean are less than 50 per cent. Apart from that there is also the case of low rate of replacement of varieties and cultivation of unsuitable crops and varieties. As varieties which are more than 20 years old are still in vogue, the change in cropping pattern and sequences are not adequately coping with the ongoing implications of climate variability. The challenges being both uni-directional and bi-directional with each other, as shown in figure 4, further complicate the agrarian distress and render adaptation difficult.
Driving Forces Restraining Forces Good Varietal performance in terms
of yield and recovery.
Remunerative price for produce andtimely payment.
Adequate technology back stopping.
Capacity building & farmer-ledextension.
Linkage-partnership betweenresearch-extension-farmer-industrycontinuum.
Industry backing and support.
Remunerative and stability comparedto other agricultural crops.
Group dynamics among farmers
Non-farm rural employmentopportunities.
Fragmentation of land holdings
Water and labour crisis
Increasing cost of production
Pest and Disease incidences
Wild animal menace.
Lack of mechanization and small tools andmachinery
Climate change effect – biotic and abioticpressure
Lack of quality planting materials.
Inadequate farmer field schools and FPOs.
Non-availability of credit and inadequate cropinsurance coverage.
Lack of policy and credit orientation fordeveloping rural non-farm employment.
As shown in figure 4, there is existence of yield gap as much as 50 per cent in the top productivity states in India. Most of the farmers do not follow scientific seed treatment practices and neglect the importance of non-monetary inputs despite the fact when they have become immensely relevant in the
G
25

current context of climate variability and change. For example, the rice is transplanted at 30 to 33 hill / m2 against the requirement of 20 to 25 hills / m2. Similarly, maize is cultivated with 1.75 lakhs plants / ha against the need of 1.30 to 1.40 lakhs plants / ha alone and groundnut farmers use 130 – 140 kg / ha against 100-125 kg / ha. Apart from that, both under and over use of fertilizers leading to deficiency or toxicity of certain elements in the soil coupled with development of soil salinity is also a common feature. Use of natural nitrification inhibitors and enriched organic manures is not widely prevalent. And most importantly, farmers still adopt surface irrigation methods without calculating amount and time of water requirements.
Figure 8 Key challenges in improving farmers’ income
When coming to crop cultivation, most farmers still practice hand weeding and inter-culturing operations without considering crop-weed competition period. Farmers adopt haphazard and indiscriminate use of agro chemicals for controlling pests and diseases. As a matter of fact, while spraying, insecticides and fungicides are liberally mixed and applied without worrying about the incompatibility of the chemicals. Even on the post-harvest front the scenario is not pleasing as nearly 20 to 25 per cent post harvest farm output losses due to improper handling. Even with high value horticultural crops, there is lack of awareness regarding high density plantation (HDP), canopy management, pruning, soil and leaf analysis, mulching and ratooning. On the marketing side, despite the modifications in APMC Act allowing contract farming and direct marketing, the efficacy of such reforms is not up to the mark. Direct marketing of farmers account barely 5 per cent of volume transacted. Though the e-NAM intervention has started paying dividends, it is still in the nascent stage and neither farmers are adequately aware about its benefits, nor are facilities and coverage up to the mark. Operationalization of minimum support price is not widely practiced and it doesn’t cover all the food crops either.
Challenges for doubling farmers’ income in Gujarat
1) Groundwater depletion: Gujarat agriculture is dotted with serious challenges on both production and marketing fronts but when it comes to the former there seems to be as much challenges bestowed default by nature as that of operational and adoption constraints prevailing in the farming sector. Accordingly, the State is characterized by erratic and uncertain rainfall coupled with large inter-annual
26

rainfall variability. Besides, the hard rock hydrogeology prevailing in the State only helps in rendering it highly vulnerable to frequent water scarcity conditions and droughts. This has led to the unintended overexploitation of groundwater leading to surge in salinity levels and lands becoming virtually useless. As groundwater alone accounts to more than 80 per cent of irrigation requirement in irrigation, it is no coincidence that the gross mismanagement of the resource has lowered the water table in many parts of the State and has the escalated cost of cultivation. On the other hand, rapid urbanization and land use changes have drastically decreased the infiltration rate of the soil and have diminished the natural recharging capacity of aquifers as well.
2) Lack of awareness on non-monetary inputs: Apart from all these natural or inherited challenges,low key awareness on non-monetary inputs and limited technology adoption among the farmers is also a cause of worry. For instance, the State is found to have very low seed replacement ratio (SRR) among all the major states. The SRR in wheat, desi cotton, pulses, groundnut and soybean are less than 50 per cent. Apart from that there is also the case of low rate of replacement of varieties and cultivation of unsuitable crops and varieties. As varieties which are more than 20 years old are still in vogue, the change in cropping pattern and sequences are not adequately coping with the ongoing implications of climate variability. The challenges being both uni-directional and bi-directional with each other further complicate the agrarian distress and render adaptation difficult. When coming to crop cultivation, most farmers still practice hand weeding and inter-culturing operations without considering crop-weed competition period. Farmers adopt haphazard and indiscriminate use of agro chemicals for controlling pests and diseases. As a matter of fact, while spraying, insecticides and fungicides are liberally mixed and applied without worrying about the incompatibility of the chemicals. Even on the post-harvest front the scenario is not pleasing as nearly 20 to 25 per cent post harvest farm output losses in Gujarat is due to improper handling. Even with high value horticultural crops, there is lack of awareness regarding high density plantation (HDP), canopy management, pruning, soil and leaf analysis, mulching and ratooning.
3) Limitations of area and yield expansion: There are certain problem areas in Gujarat agriculture thatmay be reviewed in the light of the recent record of achievements. Take the case of pulses which are an important component of diet in the state and a principal source of protein. On an average, area under pulses in Gujarat comprises 4 per cent of the total area in the country. Gujarat produced on an average 6 lakh tonnes of pulses during the period 2008- 09 to 2010-11. Area under pulses has been around 7-8 lakh ha and area expansion has been far from satisfactory. Further, only 12.3 per cent of area under pulses is irrigated. Heartening feature is that the average productivity of pulses in Gujarat (775 kg/ha) is far above the national average (659 kg/ha). Yield expansion has accelerated notably after 2000-01 and is responsible for a considerable rise in production of pulses. The gross value of gram has grown at 14.4 per cent, arhar on the other hand, has shown a strong decline in output value. The task of sustaining high growth in pulses would be difficult without area expansion and irrigation. Systematic efforts are required for increasing both area under pulses and stabilizing productivity at a higher level. Of the ultimate irrigation potential of around 65 lakh ha through surface and groundwater resources, total irrigation potential of surface water created up to 2010 is nearly 49 per cent. Nearly 76 per cent of the irrigation potential created is being utilized in the state (GoG, 2012). The SSP will provide annual irrigation benefits in about 18.45 lakh hectares. However, the distribution network for this is considerably underdeveloped. Distribution system for only 3.48 lakh ha or 19 per cent of command area is completed. The command areas of some major irrigation projects in Gujarat are facing problems of water-logging and salinity. Efforts are needed for evolving a more efficient system of water management. The other issue of importance is that nearly 58 per cent of the cultivated area in Gujarat is still rainfed. Hence, evolving dry farming technologies should receive much higher priority in all future efforts. Further need is to disseminate available dryland technologies to resource-poor farmers in the
27

rainfed regions. Besides promoting dryland technologies, emphasis on technology-based agricultural growth is needed, facilitated by increasing expenditure and credit-flow to remove pro-irrigation bias. Watershed development for raising yields of largely rainfed crops to cover oilseeds, pulses, fruits and vegetables, would yield promising results.
4) Existence of yield gap: There is existence of yield gap in Gujarat as much as 50 per cent of other top productivity states in India. Most of the farmers do not follow scientific seed treatment practices and neglect the importance of non-monetary inputs despite the fact when they have become immensely relevant in the current context of climate variability and change. For example, the rice is transplanted at 30 to 33 hill / m2 against the requirement of 20 to 25 hills / m2 in the State. Similarly, maize is cultivated with 1.75 lakhs plants / ha against the need of 1.30 to 1.40 lakhs plants / ha alone and groundnut farmers use 130 – 140 kg / ha against 100-125 kg / ha. Apart from that, both under and over use of fertilizers leading to deficiency or toxicity of certain elements in the soil coupled with development of soil salinity is also a common feature in Gujarat. Use of natural nitrification inhibitors and enriched organic manures is not widely prevalent. And most importantly, farmers still adopt surface irrigation methods without calculating amount and time of water requirements.
5) Implications of climate change: Ray et al. (2009) suggested that the mean temperature over Gujarat state has increased by 0.07°C in past 40 years (1969-2009). In addition, region-wise analysis revealed that increase is more over coastal Saurashtra region as compared to that of the remaining regions. Patel et al. (2017) projected climatic data (2071 to 2100) by PRECIS model for different stations (Anand, Vadodara, Junagadh, Bhavanagar, Bhuj, Rajkot and Kesod) of Gujarat to study the impact of climate change on major crops of the state. The findings showed that the annual rainfall during projected period would be 15 to 101 per cent higher than the base line rainfall (1961-90). Maximum temperature would increase by 2.8 to 7.7 0C, while minimum temperature would increase by 3.8 to 5.2 0C in different parts of Gujarat when compared to the base period. In addition, it was also revealed that climate change will adversely affect the yields of different crops including wheat, maize, pearl millet, paddy and groundnut. The maximum yield reduction (-61 %) is projected in wheat and lowest in pearl millet (-8 %). Maize during kharif season would be more affected (-47 %) than the rabi season (-10 %). Similarly pearl millet in summer season will be least affected (-8%) than kharif season (-14 %).
6) Traditional marketing problems: On the marketing side, despite the State has modified APMC act allowing contract farming and direct marketing, the efficacy of such reforms is not up to the mark. Direct marketing of farmers account barely 5 per cent of volume transacted. Though Gujarat is the frontrunner state in e-NAM, it is still in the nascent stage and neither farmers are adequately aware about its benefits, nor are facilities and coverage up to the mark. Operationalization of minimum support price is not widely practiced and it doesn’t cover all the food crops either. Despite a well-functioning cooperative structure, it has not succeeded in ensuring adequate supply of credit for weaker sections of the society. Of the total advances made by credit institutions in the state as of March 2011 (Rs.1,87,803 crore), only 7.5 per cent have gone to the weaker sections (Rs. 11,605 crore). Advances for agricultural purposes comprise 20.2 per cent of the total advances. It needs to be noted that district-wise distribution of Kisan Credit Cards (KCC) is rather skewed and districts like Kheda, Ahmedabad, Surat and Bharuch have a very low ratio of KCC per thousand operational holdings. Overall for Gujarat, 508 KCC per 1000 holdings have been reported, showing considerable mismatch in outreach (State Level Bankers’ Committee, 2011). Concerted efforts are also needed for ensuring success of new experiments, such as, farmers’ clubs.
28

5. Potential for development ofhorticulture, livestock, fisheries, agro-forestry and post-harvest processing
Agricultural sector potential
ujarat is the major producer of cotton, groundnut, castor and sugarcane. The other major crops produced in the State include rice, wheat, jowar, bajra, maize, pigeon pea and gram. Among them,
the production and yield of cotton, castor, and groundnut are notably high in Gujarat accounting for 33 per cent of both cotton and groundnut production in the country. Besides, the state has the recognition for the highest area, productivity and not less than 70 per cent of castor production in the country. Another notable feature is the accordance of GI status to Bhalia wheat (a.k.a Daudkhani wheat) grown in Bhal region of Gujarat for its desirable qualities like high carotene, low water absorption and high protein content. While various studies have shown that GI Bhalia wheat receives 25 per cent premium price opposed to other wheat varieties and 40-50 per cent higher price than the bread wheat varieties, still there is also immense potential for the State to promote organic cultivation of Bhaliya wheat to improve farmers’ income.
Horticultural sector potential
The total area under horticulture crops and their production are continuously on the rise in Gujarat. Among horticultural crops, Gir Kesar mango and Kutchi date palm of the State have been bestowed with GI status in the country. Besides, the State holds first position in the production of cumin, fennel and date palm; and 2nd place in the production of banana, papaya and lime. More than 90% of the fennel in the country is produced by Gujarat alone. Besides, the state enjoys first position in the productivity of coconut and banana and second in the productivity of pomegranate and sapota. It has the highest productivity in the country for onion (25 MT/ha.), potato (28.81 MT/ha.) and the world’s highest productivity of potato (87 MT/ha) has been reported from Deesa of Gujarat’s Banaskantha district. A number of good integrated pack houses, air cargo complex and gamma irradiation projects have been established by Gujarat Agro Industries Corporation. In addition, onion dehydration industry of the state is the biggest in the country.
Animal Husbandry and Fisheries’ sector potential
Gujarat is the home to the world acclaimed milk cooperative, Amul. Animal husbandry sector has played a pivotal role in socioeconomic development of the State providing employment and source of income for lakhs of farm families. The State is rich in various indigenous pure breeds including Gir and Kankarej breeds of cow; Mahesani, Surti, Jaffrabadi and Bunni breeds of buffalo; Marwari and Patanvadi breeds of sheep; Sirohi, Surti, Mehsani, Kuchchhi, Gohilwadi and Zalawadi breeds of goat; and Kutchi and Kharai breeds of camel and Kathiyavadi breed of Horse. Gujarat possesses 19 registered breeds forming 13 per cent of the total 151 registered breeds in the country. As per Livestock Census (2012), the State possesses 27,128,200 livestock contributing 5.30 per cent to the total 512,057,000 livestock population in India. It has been a consistent performer and leader in milk production and attained 3rd position in India with milk production of 122.62 lakhs metric tons in 2015-16. Besides, the State has a notable 7.33 per cent average growth rate in milk production during the last decade. Apart from that, Gujarat has a long coastal-line of 1600 km and is dotted with several important ports of which many like Veraval, Porbandar, Pipavav, Okha and Sikka are located in Saurashtra region as well. Important commercial varieties of fish including silver bar, shark, catfish, mullets etc are caught in large quantities.
G
29

Potential of Agro-forestry sector
ALUS (Alternate Land-Use Systems) esp. in barren/waste lands & farm bunds
1. Acacia fortilis plantation (3m X 3m spacing) is most appropriate for getting maximum biomassand monetary return up to Rs. 75,000 to 1.25 lakh / ha (in 2016-17 prices).
2. Minor fruit crops and medicinal & aromatic plants as crop diversification or cultivation inmarginal lands and field bunds can improve income levels up to 40 per cent.
3. Tree species of 4-6 years of rotation age such as Ailanthus (match stick tree), Melia dubia havethe potential to generate 40% additional monetary return.
4. Silvi-pasture system (Amla + Dichanthium annulatum) can improve fodder supply @ 20%,increment Amla yields by 20% and enhance net returns up to Rs. 6500 / ha/ annum.
5. Ailathus excelsa (6.0 X 3.0 mt spacing) based agri-silviculture system (Ardu + Green gram) canincrement farmers’ income by 25%.
6. India’s paper demand to increase by 53% by 2022: Trees with good pulpwood materials areheavily demanded by paper and pulp industry.
7. Advantage for Gujarat: Semi-arid districts (Anand, Nadiad, Mehsana & Gandhinagar) are withhigh tree cover and are already wood surplus districts.
8. Silvi-medicinal systems have the next big income potential: Teak + Ocimum spp such as O.tenuiflorum, O. gratissimum and O. basilicum increase net returns by Rs. 80,000/ha (2014-15prices). Farmers may get additional income from such land-uses till teak trees come to harvest.
9. Melia dubia trees on farm bunds: 150-170 trees / hectare: 13-14 years rotation can yield timberfor door & furniture of Rs 15,000 per tree value and 2-3 year rotation can yield10 to12.5 tonnes of pulpwood of Rs 4,000 per tonne value.
Potential of Agro-forestry sector
1. Groundnut: Cluster based emphasis on HPS groundnut for exports & table purpose inJunagadh, Kutch, Jamnagar, Porbandar & Bhavnagar will enhance farmers’ income up to 25%in 3 years.
2. Oilseed sector: Mechanization in production and post-production will reduce per unit cost ofproduction up to 50%.
3. Fruits & Vegetables: 30% of F & Vs are lost in Gujarat accounting for Rs. 9,000 crores in thestate. Processing at least 10% at farm gate level will increase farmers’ income by 15 to 20%.
4. Cluster based Agro Processing Centre for all crops: Primary processing, grading and millingof produce may increase the market rate by about 10 to 30%.
5. 81% cold storages suitable only for Potato. Need to be upgraded for multi commodities.6. High potential for improving fish processing facilities, esp. in Saurashtra zone.
30

6. Role of Technologies
he strategies for doubling farmers’ income in Gujarat by 2022-23 have been devised under the following major heads which are as follows:
1) Increasing the productivity of crop and animal sectors;2) Leveraging marketing avenues in crop and animal sectors;3) Leapfrogging post-harvest and value-addition prospects;4) Promoting on-farm ancillary activities;5) Invigorating organic farming;6) Other key strategies for doubling farmers’ income.
This particular component has been further categorized into the following sub-heads: a. Zeroing in on water management problems;b. Facilitating farm mechanization;c. Proliferating market led extension and e-extension opportunities;d. Managing Yield gap and reducing costs;e. Alleviating farm financial distress;f. Doubling the current level of exports;g. Encouraging agro-forestry;h. Harnessing solar potential;i. Promoting Agro-tourism;j. Promoting rural non-farm employment sector;k. Leveraging Pradhan Mantri Fasal Bima Yojana (PMFBY).
T
31

a) Strategy & action plan for enhancing production, cost reduction, quality improvement andgenerating additional income:
1. Increasing the productivity of crop and animal sectors:
a) Agriculture
Sl. No Issue Status
Action Plan (Including policy reforms) Implementing Strategy
(1) (2) (3) (4) 1. Low Seed
Replacement Ratio(SRR)
Low rate of replacement of varieties & cultivation of unsuitable crops and varieties.
Low awareness on scientific Seed treatment techniques
The SRR in Wheat, Desi Cotton, Pulses, Groundnut and Soybean are less than 50 % in Gujarat.
Currently, the change in cropping pattern and sequences are not adequately coping with the ongoing implications of climate variability.
Varieties which are more than 20 years old are still in cultivation.
Changes have to be brought in wheat, tobacco, maize, pearl millet and groundnut cultivation.
Most of the farmers do not follow scientific seed treatment practices.
a. Replacement of local and inferior qualityseeds with high quality seeds.
b. Conversion of breeder seed to foundationand certified seeds on university farms.
c. Promote Seed village concept forcertified and TFL seed production.
d. Crop and variety should be selected onthe basis of climatic factors, edaphicfactors, resource availability and marketsituation.
e. Adequate quantity seed of the new andhigh yielding varieties need to be madeavailable along with applicable newpackages of practices.
f. Encourage scientific seed treatmentpractices for protection against diseasesand pests.
g. Promote seed inoculation with bio-fertilizers.
a. Seed certification agency shouldencourage NGOs/ PSUs as well as SAUfarms for seed production of improvedvarieties.
b. SAUs and ICAR centres should befacilitated for large-scale breeder seedproduction.
c. University farms need to be facilitatedfor converting breeder seeds ofimproved varieties to foundation andcertified seeds
d. NGO/Public Sector participation needto be encouraged for producing timelycertified and TFL seeds.
e. Training extension functionaries andprogressive farmers.
f. Research in the context of climatevariability implications.
g. Production of required quantities ofbreeder seed of new improved varieties.
h. Imparting training to extensionfunctionaries and progressive farmerson scientific seed treatment and seedinoculation.
32

Sl. No Issue Status Action Plan
(Including policy reforms) Implementing Strategy
(1) (2) (3) (4) 2. Less exposure of
farmers to non-monetary inputs
Most of the farmers neglect the importance of non- monetary inputs despite the fact when they have become immensely relevant in the current context of climate variability and change.
a. Selection of biotic & abiotic stressresistant varieties.
b. Timely sowing/plantingc. Providing optimum plant geometry.d. Irrigating at critical growth stages.e. Timely adoption of crop protection
practices.f. Timely harvesting.g. Practicing system of intensification in
rice, sugarcane, wheat & cotton.
Imparting training to extension functionaries of SAUs, ICAR centres, Line departments, NGOs, and progressive farmers on the efficacy of non-monetary inputs in the context of climate change scenario.
3. Expedite IntegratedNutrient Management
Either under or over use of fertilizers leading to deficiency or toxicity of certain elements in the soil coupled with development of soil salinity.
Use of natural nitrification inhibitors and enriched organic manures is not prevalent.
a. Guiding farmers to use recommendeddose of nutrients as per soil test.
b. Balanced nutrition withorganic / inorganic / biofertilizers
c. Supplementing deficient nutrients.d. Reducing soil-water-air pollution.e. Incentivizing slow release fertilizers.
a. Imparting training to extensionfunctionaries of SAUs, ICAR centres,Line departments, NGOs, andprogressive farmers to ensure proper useof the soil health card
b. Production of biofertilizers in PPPmode.
4. Promoting PrecisionAgriculture
Most of the farmers are unaware of precision farming technologies
a. Mapping soil fertility status includingsecondary and micronutrients
b. Laser land levelingc. Application of fertilizer based on STR and
site specific nutrient management.
a. Imparting training to extensionfunctionaries & progressive farmers onprecision agriculture
b. Demonstrating crop specific precisionfarming techniques with real timemodels.
33

Sl. No Issue Status Action Plan
(Including policy reforms) Implementing Strategy
(1) (2) (3) (4) 5. Prioritizing Micro-
Irrigation Structures(MIS)
Farmers still adopt surface irrigation methods without calculating amount and time of water requirements.
Indiscriminate use of water especially in canal command areas.
a. MIS need to be made compulsory throughincentivized schemes.
b. Prioritize water conservation practices.c. Persuading farmers to practice irrigation
at critical growth stages.d. Promoting furrow, band and foliar
irrigation methods.e. Promoting Laser land leveling to increase
irrigation efficiency.
a. Imparting training to Extensionfunctionaries and progressive farmers onimproving WUE and FUE.
b. Policy interventions promoting theavailability of crop-specific superiorgrade liquid fertilizers/ secondary/micronutrients at affordable rates.
6. Leverage IntegratedWeed Management
Most farmers still practice hand weeding and inter-culturing operations without considering crop- weed competition period.
a. Take preventive measures to check weeddispersion.
b. Consider crop-weed competition periodfor effective & economical weed control.
c. Cultivation of green manure crops.d. Intercrop with cover crop to check weed.
a. Imparting training to extensionfunctionaries and progressive farmers oneconomical and effective weedmanagement practices.
b. Testing new and efficient molecules tobe used as weedicides
7. Prioritize IntegratedPest /DiseaseManagement
Farmers follow haphazard and indiscriminate use of agro chemicals for controlling pests and diseases.
While spraying, insecticides and fungicides are liberally mixed and applied without worrying about the incompatibility of the chemicals.
a. Select pest tolerant or resistant varietyb. Popularize cultivation with trap crops.c. Follow integrated approach for effective
and economical pest control.d. Follow mechanical control measures to
control pests/ diseases
a. Imparting training to extensionfunctionaries and progressive farmerson IPM and IDM.
b. Promoting safe use and application ofchemicals.
c. Prioritizing training of input dealers.d. Research on new or emerging/recurring
pests and diseases by SAUs and ICARcentres.
34

Sucess story 1. Mulching with Drip inGroundnut


Sucess story 2. Castor Cultivation


Sucess story 3. Cotton cultivation


Sucess story 4. Paddy Cultivation


Success story 5. Sugarcane cultivation


Success story 6. High Productivity in Potato


b) Horticulture:
Sl. No Issue Status Action Plan
( Including policy reforms) Implementing Strategy
(1) (2) (3) (4) 1. Lack of availability
of quality plantingmaterial
Shortage of quality planting materials of fruits, vegetables and flowers crops.
Planting materials obtained from outside the state are not quarantined.
a. Establish plug nurseries for fruit,vegetables and flowers.
b. Increase subsidies for nursery alongwith restructuring nursery moduleswith latest infrastructure prices.
c. Strengthen domestic quarantine toavoid introduction of newpests/disease into state.
a. Establish new nurseries on prioritycalculating demand- supply gaps.
b. Develop planting materials suitablefor processing and exports throughPPP mode.
c. Encourage Tissue culture researchand dissemination.
2. Diversifying areatoward high valuehorticultural crops
Only 16 percent of gross cultivated area in the state is under horticultural crops.
Efficient utilization of land by growing vegetables & Fruits simultaneously is not taken up on a large scale.
a. Increase awareness regardingprofitability of horticultural crops.
b. Increase area under horticultural cropsby diversifying area towardremunerative fruit crops andintercropping.
c. Popularize research and adoption ofminor fruit crops (such as jamun andjackfruit).
a. Cultivable barren lands (5 lakh ha inGujarat) need to be brought underhorticultural crops.
b. Soil reclamation and breedingmeasures need to be promoted inmarginal lands.
c. Popularize adoption of remunerativeminor fruit crops and medicinal &aromatic crops.
3. Increase productivityof horti. cropsthrough high-techtechnology
Lack of awareness regarding HDP, canopy management, pruning, soil and leaf analysis, mulching, ratooning etc.
a. Conduct training on different high-tech technologies in horticulture crops.
b. Promote & standardize PoP forprotected cultivation of vegetables andflowers during off-season.
a. Awareness through Demonstrationand training.
b. Arrange farmers’ visits to Ultra HighDensity Mango Plantations.
c. Promote affordable protectedcultivation.
47

Success story 7. Cultivation of Vegetable Crops


Success story 8. Water Melon and Tomato Cultivation under Mulch and Drip Irrigation


Success story 9. Cucumber and Capsicum Cultivation under Green House


Success story 10. Vegetable Farming in Net House


Success story 11. Rose Farming


Success story 12. Flower Cultivation


Success story 13. Pomegranate Farming


c) Livestock sector:
Sl. No Issue Status Action Plan (Including policy reforms) Implementing Strategy
(1) (2) (3) (4) 1. Improving
availability of feedand fodders
Huge shortage of dry and green forage in the state.
a. Improve fodder production by utilizingproven fodder varieties.
b. Development of pasture lands in thevillages.
c. Use of industrial and agro-forestry by-products to curtail cost of animal feeding.
d. Encourage farmers to establish fodderbanks.
e. At least 50 acres land in every villageshould be identified for the fodder banks.
f. Switch over towards forage, fodderproduction and storage, e.g. Foddercowpea- Lucern + chicory cultivation willensure availability of green fodderthroughout the year.
a. Increase availability of high-gradeseeds.
b. Identify district-wise areas forsurplus fodder crop and intimate thegram panchayat through mobileapps wherever there is shortfall infodder production.
c. Use crossbred fodder sugarcane &NB -21.
d. Identification and use of differentindustrial by-products especiallygroundnut, maize and rice industry.
e. Timely collection of agro-forestryby-products and use them with theconsultation of animal nutritionists.
f. Develop district-wise data base oncattle and buffalo productivity,availability of different feedresources and animal requirement.
g. Develop area specific mineralmixtures considering mineralavailability and requirement.
62

Sl. No Issue Status Action Plan (Including policy reforms) Implementing Strategy
(1) (2) (3) (4) 2. Promote Breeding of
livestock animalsSemen supply from good proven bulls needs to be operationalized throughout the state.
Upgradation of indigeneous breeds is yet to be prioritized.
a. Assure semen supply of good provenbulls on subsidized rates for ArtificialInsemination in dairy animals.
b. Upgradation of indigenous breedsthrough selection and crossbreedingof non-descriptive animals with thesemen of proven bulls.
c. Promote oestrus synchronizationprogram all over the state.
a. Bulls testing at molecular level.b. Performance evaluation of good
pedigree bulls at field level.c. Implementation of Progeny testing at
field level.d. Execute village level infertility
camps at regular intervals.e. Different oesterous synchronization
modules should be implemented atvillage level
3. Formulate housingManagement forlivestock sector
Scientific rearing of calves and heifers is not widely practiced in the state.
Scientific rearing of calves and heifers to minimize mortality in calves and infertility problems in heifers.
a. Conducting local vocational coursesfor creating awareness on scientificanimal husbandry practices.
b. Extensive short duration research onanimal shelter.
4. Formulate Healthmanagement oflivestock animals
Diagnostic facilities for infectious diseases and their management are not done on regular basis.
a. Operationalize mechanism fordiagnostic facilities of infectiousdiseases as well as their reporting andvaccination.
b. Timely reporting of infectious diseasesneed to be prioritized.
c. Develop modalities for prompt andaccurate diagnosis, along withh i
a. Execute health checkup camps atvillage level at regular intervals.
b. Conduct testing of infectiousmaterials in state registeredlaboratories.
c. Timely vaccination against diseasesincluding FMD, brucellosis, andHemorrhagic septicemia (HS).
63

Success story 14. Animal Husbandary


d) Poultry sector
Sl. No Issue Status Action Plan
(Including policy reforms) Implementing Strategy
(1) (2) (3) (4) 1. Develop efforts for
Breeding in poultrysector
Large existing demand for location specific poultry bird varieties in Gujarat state.
Development of location specific varieties for rural/ backyard poultry farming.
a. Develop crossbred by crossingnative / non-descript breeds withhigh yielding breeds/strains.
b. Disseminate already developedsuperior germplasm suitable forbackyard poultry farming
2. Prioritize feed &nutritiondevelopment forpoultry sector
Available suitable crop residues are only partially utilized as poultry feeds.
a. Promote maize and soybeancultivation for utilizing as poultryfeed.
b. Reduce feed cost of commercialpoultry farming.
c. Provision for poultry feed atsubsidized rate for rural/ backyardpoultry farmers.
a. Promote maize and soybean growersby providing seeds of high yieldingvarieties at a subsidized rate.
b. As soybean De-oiled cake (DOC) isbeing used in poultry feed, improvesoyabean processing facilities.
c. Explore the possibilities of usage ofalternative poultry feed resources forpartial replacement of major poultryfeed ingredients.
3. Formulate healthmanagement inpoultry sector
Emerging issues of poultry disease diagnostic facilities need to be addressed on regular basis with timely interventions.
Diagnosis and control measures for emerging and re-emerging diseases of poultry.
a. Establish poultry disease diagnosticfacilities at regional levels andschedule appropriate vaccinations.
b. Short duration training on packageof practices for rearing of birds andhealth management.
66

Success story 15. Ideal Pourltry Farm


Success story 16. Successful Pourltry Farming


e) Fisheries sector:
Sl. No
Issue Status Action Plan (Including policy reforms)
Implementing Strategy
(1) (2) (3) (4) 1. Fresh water fish
production:• Low per ha
productivity inponds & lakes.• Reservoirs lack
quality fingerlings• Low catchability• Poor utilization of
resources• Untapped
ornamental fishTrade
Fish production in ponds: • Nation- 2400 kg/ha• State – 500 kg/haFish production in reservoirs: - Nation: • 50 kg/ha/yr (Small)• 12kg/ha/yr (Medium)• 11 kg/ha/yr (Large)-State: • 55.66 kg/ha/yr (Small)• 35.01 kg/ha/yr (Medium)• 47.36 kg/ha/yr (Large)
a. Production and stocking of stuntedyearling and ranching programmes.
b. Species diversification &establishment of hatcheries.
c. Exploitation and technologicaladvancement in ornamental fishculture.
d. Maximum utilization of water bodies.e. Small scale and commercial fish feed
plant.
a. Promote cage and pen farmingpolicies in reservoirs and lakes.
b. Strengthen existing and creation ofadditional infrastructural facilities
c. Conduct research, training andextension programmes.
d. Ensure optimum utilization of waterresources for maximizingproduction.
e. Improve location specific andeconomically feasible technologygeneration.
f. Design and develop advance fishharvesting methods
g. Establish disease diagnosis centres.h. Ensure economical and critical fish
farming inputs.
71

Sl. No
Issue Status Action Plan (Including policy reforms) Implementing Strategy
(1) (2) (3) (4) 2. Brackish
water fish production:• Lack of quality seed.• Depletion of coastal
water bodies.• Lack of insurance
cover.
• Only 5.8 % is allotted of thebrackish-water area isallotted for fish culture.• Disease diagnosis
laboratories do not exist.• Poor species diversification.• Lack of infrastructure
facilities.
a. Develop & domesticate commerciallyimportant fin fishes’ brood stocks andSPF, SPR, SPT brood stocks forshrimps.
b. Promote species diversification &establishment of hatcheries.
a. Implement research, training andextension programmes on optimumutilization of water resources formaximizing per ha production.
b. Promote location specific andeconomically feasible technologiesgeneration
c. Establish disease diagnosis centres/ laboratories.
d. Provide insurance cover to shrimp/fish crop.
e. Develop proper policies at par withagriculture sector.
f. Promote land allotment on thebasis of carrying capacity of waterbodies.
3. Marine-water Capturefisheries:• Low catch per unit• Poor or unexploited
fisheries resources.
• Mariculture policy does notexist.
• Poor mechanization offishing crafts and gears
• Poor species diversification
a. Designing fishing gears, crafts,methods & equipments.
b. Effective utilization & outreachprogrammes on Potential FishingZones (PFZ).
a. Promote cage, pen, seaweed,oyster, and mussel farming policiesin marine waters.
b. Species diversification by includingseaweeds molluscs.
c. Promote research, training andextension programmes.
d. Promote sea ranching programmesand marine ornamental fish culture.
72

Success story 17. Fish Farming


Success story 18. Fresh Water Aquaculture for Pearl Production


2. Promoting on-farm ancillary activities:
Sl. No Issue Status Action Plan (including policy
reforms) Implementing
strategy (1) (2) (3) (4)
1. Promoting on-farmhoney production(Apiculture)
At present, there is no prevailing scheme / project on honey production or apiculture popularization in the state.
a. Purchase, distribution andmaintenance of honeybeecolonies.
b. Increasing awareness on beeconservation by avoidingpesticide usage at the time offlowering.
a. Devise mechanism for purchase of honeybeecolonies.
b. Identify farm pockets and distribute honeybeecolonies to farmers.
c. Train farmers on apicultural activities.d. Conduct research on beekeeping especially on bee
breeding and nucleus colonies.2. Incentivizing
mushroom cultivationA viable venture with low input and high income. However, expertise is critically lacking in the state on profitable production and marketing.
a. Prioritize training onmushroom cultivation andmarketing.
b. Strengthen spawn laboratoryand other infrastructureamong stakeholder agencies.
a. Promote training on different aspects of mushroomcultivation and marketing.
b. Create awareness on functional / nutritional benefitsof mushroom.
c. Develop Spawn availability and substratepasteurization centers along with dehydrationfacilities.
d. Incentivize mushroom growers association.
3. Invigorating organic farming:
1. Increasing area underorganic farming
• The state is most suited fororganic farming as asignificant portion of itsagricultural land is rainfed.
• Pioneer state to establish firstever Organic University in thecountry.
a. Demonstrate and organizetraining on different organicfarming techniques.
b. Conduct research on organicfarming techniques
c. Promote use of bioagents.
a. Provide special attention for bringing rainfed areasunder organic mode.
b. Bring area under cultivable barren lands into organichorticulture cultivation.
c. Develop protocols for organic production based onthe entire cropping system approach.
d. Develop preferential policy instruments by declaringone or two organic districts
76

Success story 19. Honey bee Keeping


Success story 20. Organic Farming and Value Addition


Success story 21. Banana Cultivation through Organic Farming


Success story 22. Organic Farming using Cow Urine and Dung


7. Value-Chain Development, Market Linkages &Trade Potential
a) Value-Chain Development:Sl. No
Issue Status Action Plan (including Policy Reforms) Implementing Strategy (1) (2) (3) (4)
1. Improving farm pre- andpost- harvest managementtechniques in crop sector
Nearly 20 to 25 per cent post harvest farm output losses in the state due to improper handling.
a. Demonstrate and organize training ondifferent pre- & post- harvest techniques.
b. Promote farm gate processing.c. Incentivize low-cost processing technologies
through start-ups
a. Promote taluka level cold chains, ruralgodowns and village level agro-processing industries and commoditybased value-chains.
b. Establish Quality CertificationLaboratories at APMC level
2. Improve recycling of cropresidue at farm-level
Only 5 to 10 per cent farm waste get utilized in the state.
Immense potential for recycling residues in fruit crops.
a. Organize training on available technologiesof value addition of crop residues.
b. Prioritize research on residue recycling offruit crops.
c. Commercializing crop bio-mass.
a. Create awareness about crop recyclingmeasures through demonstration andtraining.
b. Develop technologies for wasterecycling of all horticultural crops.
3. Improve milk quality &introduce value additionin livestock sector
• Poor hygienic quality ofmilk.
• There is no value additionin milk at farmers’ levelsuch as conversion of milkinto dahi, lassi, shrikhand,khoa, paneer etc.
a. Promote clean milk production.b. Increase shelf-life and quality of milk.c. Encourage small scale start-ups for value
added dairy product units.
a. Awareness training for farmers on cleanmilk production and increasing shelf-life.
b. Promote Community milking.c. Promote machine milking.d. Establish farm cooling practices using
affordable technologies.
4. Promote post-harvesttechnologies in fisheriessector
• Poor infrastructurefacilities.
• Fewer manufacturing unitsfor value added products
a. Create infrastructure facilities like fishloading & unloading devices and onsite icemaking machines
b. Establish hygienic fish collection (mobilevans), marketing and cold chain facilities.
a. Strengthen existing harbourinfrastructure facilities.
b. Create dditional infrastructural facilitiesin fish market.
c. Conduct research, training and extensionprogrammes.
85

Success story 23. Drum stick Farming and Value Addition


Success story 24. Value Addition in Ginger and Turmeric


b) Market Linkages:Sl. No
Issue Status Action Plan (including Policy Reforms) Implementing Strategy
(1) (2) (3) (4) 1. Leverage market
intelligence for allmajor agriculturalcrops
Forecasting / market intelligence system for all agricultural commodities / major crops is grossly inadequate in the state.
a. Robust price forecasting techniquesneed to be utilized on a full-timebasis.
b. Market intelligence mechanism forhorticultural crops need to bestudied.
a. SAUs need to have a separate MarketIntelligence Centre in Agricultural EconomicsDepartment.
b. Fairly accurate estimates on price forecastingshould be made available to the farmers wellbefore the harvest season.
c. Training farmers to utilize and appreciatemarket intelligence services.
2. Promote contractfarming and directmarketing, whereverfeasible
Though the State has modified APMC Act allowing contract farming and direct marketing, the efficacy of such reforms is not up to the mark.
Direct marketing of farmers account barely 5 per cent of volume transacted.
a. APMCs need to encourage contractfarming.
b. Better coordination betweenFarmers, Industry and APMC.
c. Facilitate contract farming with amechanism of assured pricing.
a. Devise appropriate policies to make thecontract farming enterprising.
b. Ensure participation of small and marginalfarmers by the firms entering into theagreement of contract farming
c. Establish Special Agricultural Zones (SAZ) tocater to special farm trade groups with specificrequirements.
d. Promote direct marketing by modernizingmarket infrastructure at taluka level.
90

Sl. No
Issue Status Action Plan (including Policy Reforms) Implementing Strategy
(1) (2) (3) (4) 3. Leapfrogging Electronic-
National AgriculturalMarket(E-NAM)
Though Gujarat is the frontrunner state in E-NAM, it is still in the nascent stage and neither farmers are adequately aware about its benefits, nor are facilities and coverage up to the mark.
a. Speedily link all APMCs and Market Yardsin Gujarat to E-NAM.
b. Encourage large mandis to activelyparticipate ine-NAM.
c. Wide publicity of e-NAM benefits
a. Create awareness about E-NAM andits usefulness to the farmers esp. small& marginal.
b. Incentivize and award farmers withmaximum transactions through E-NAM.
c. Establish select “Organic Markets” foragricultural commodities under E-NAM.
4. Involve cooperatives inmarketing of horti. produce
At present cooperatives are not involved in and marketing of horti. produce.
Promote cooperatives for marketing of horti. produce.
Plan exposure and motivation to co-operatives in the state through visits to successful co-operatives in India.
5. Leveraging FarmersProducersOrganization(FPOs)
• Number of FPOs in the stateis one of the lowest in India.
• The potential of FPOsamong small and marginalfarmers is yet to be realizedin the state.
• External CommercialBorrowings (ECBs) iscurrently permitted forNGOs and NBFCs engagedin micro-finance alone andnot for FPOs.
a. FPOs should be allowed to marketmembers’ produce directly to buyers of theirchoice, through all platforms, physical orelectronic.
b. Extend tax exemption to FPOs at par withCooperatives.
c. Incentivize FPOs for creation andmaintenance of rural agricultureinfrastructure.
d. Ensure provisions for easy issue of licensesto FPOs to trade in inputs.
a. Provide collateral free loans uptoRs.25 lakh to the FPOs.
b. Rate of interest for FPOs should be atpar with the rate charged to individualfarmers for crop loans.
c. Group insurance schemes should beestablished for members of FPO.
d. Extend external commercialborrowings (ECBs) for FPOs.
e. Single state-wide license with everypoint of sale for all agri. inputs whichwill facilitate FPOs dealing with agro-inputs.
91

Sl. No
Issue Status Action Plan (including Policy Reforms) Implementing Strategy (1) (2) (3) (4)
6. Innovate livestockmarketing
Awareness among small and marginal farmers about marketing prospects in livestock is highly skewed.
a. To conduct certificate course on creatingawareness.
b. Develop regulated livestock market forselling live animals.
a. Conduct local vocational coursesfor creating awareness amongsmall and marginal livestockkeepers about rearing, marketing,bank loan facilities andestablishment of cattle, buffaloes,sheep, goats and poultry farms.
b. Develop Apps related to livestockmanagement to disperse quickscientific information.
c. Establish indigenous milkcooperatives for facilitatingproduction and marketing of desi(A2) milk.
7. Accelerate marketing forpoultry products
Partially existing demand for poultry products in the state
Promotion of consumption of poultry products, wherever possible
a. Creating awareness regardingnutritive value of poultry productsthrough media and masscoverage.
b. Promoting local / indigenouspoultry breeds and their products.
92

c) Trade Development:
Sl. No
Issue Status Action Plan (including Policy Reforms) Implementing Strategy
(1) (2) (3) (4)
1. Doubling the currentlevel of exports
Share of India in world exports is very low and hardly 1.5 % on an average during the last decades.
Farm level awareness on SPS measures is still very poor.
Double the current level of 1.70 lakh crores worth of agri. exports within 5 years.
Boost to RTAs(Regional Tariff Agreements) to address the issue of Non-Technical Barriers such as TBT and SPS Measures and to attract investment
a. Promote Crop Stewardship Programs, GoodAgricultural Practices (GAP) and Certificationprocedures.
b. Promote Global Commodity Boards likeCalifornia Walnuts, Washington Apples for ourown farm produce like Talala Kesar Kheri orKutchi Dates.
c. Promote quality consciousness and health safetyissues among farmers for both domestic andinternational trade.
Specific strategies to improve export poytential of Gujarat:
1. Special Agricultural Zone (SAZ) may be established in the peri-urban and semi-urban areas.
2. Commodities needed by urban population like fruits, vegetables, flowers, milk and eggs can be targeted.
3. Export oriented and industrial use crops can also be focused.
4. The land in SAZ may be preserved exclusively for agriculture.
5. On the model of Special Economic Zones (SEZ), incentives may be given to farmers in the SAZ areas.
6. Promoting Crop Stewardship Programs, Good Agricultural Practices (GAP) and Certification, formation of Global Commodity
Boards (like California Walnuts, Washington Apples) for Kesar mango will add fillip to the export potential of the state.
93

8. Policy and Investment Requirements and Role of Government
Sl. No
Issue Status Policy &
Institutional Requirements
Role of Government
Agency/ Organization Stakeholders’
Responsibilities
Expected Outcome
(1) (2) (3) (4) (5) (6) 1. Zeroing in on
watermanagementproblems
Currently, 57.52 % of area of Gujarat is under rainfed agriculture.
Only 20 % of the rainfall gets utilized in the state.
Promote rainwater harvesting.
Enhance groundwater irrigation efficiency.
Using waste water from dairy and other domestic effluents
a. Promote in-situ conservation, waterharvesting and management at farms.
b. Encourage raised beds with blockfurrow irrigation.
c. Incentivize roof-water harvesting inrural/ urban areas.
d. Promote and train Water User Groups(WUGs) on a large-scale.
e. Enhance subsidy on 5 HP solar waterpumps on cooperative basis to farmers’groups.
f. Train farmers on biodegradablemulching practices.
g. Divert urban run-off to recharge zones.h. Ensure steps for reducing BOD and
COD levels of effluent irrigation water.i. Conduct crop-water balance and
optimal crop planning studies at talukalevels.
CADA; DRDA; GWDA; GLDB; GGRC; Department of Agriculture, Department of Horticulture and SAUs need to promote water harvesting and conservation measures using training programmes and workshops.
Yield may increase upto 30%
Additional 5 lakh ha in the state may get irrigated.
Increase in median farmers’ income by 5%
94

Sl. No
Issue Status Policy &
Institutional Requirements
Role of Government
Agency/ Organization Stakeholders’
Responsibilities
Expected Outcome
(1) (2) (3) (4) (5) (6) 2. Facilitating
farmmechanization
Available farm power is only about 1.20 kW/ha in Gujarat, which is less than the national average.
Farmers’ skill-sets need to be improved.
PPP mode production of machinery for top down and bottom up approach.
Providing vocational skills to youth on farm machinery.
a. Promote need based affordablefarm machineries especially forsmall and marginal farmers.
b. Identify and train rural/urbanyouth on skills relating to repair,maintenance and innovation ofsmall tools.
c. Incentivize entrepreneurs forfarm machinery productionthrough start-ups.
d. Innovate and proliferatepanchayat level custom hiringcenters (CHCs).
e. Establish AgriculturalEngineering Directorate at statelevels for better proliferation offarm mechanization.
Department of Agriculture, Department of Horticulture, KVKs, NABARD, NGOs and SAUs should conduct exposure programmes on on-farm economical mechanization.
Reduction in cost of cultivation.
Improvement in resource use efficiency.
Increase in median farmers’ income by 5-10 %
3. Proliferatingmarket ledextension &e-extensionopportunities
Market led extension is a low key affair in the state.
Utilization of available e-extension services is very poor.
Promote use of market price information and market intelligence services. Assure affordable high speed internet connectivity in villages.
a. Promote use of marketintelligence and marketinformation services in extensiontrainings and programmes.
b. Improve awareness and use of e-extension programmes like i-khedut, e-krishi kiran and othermobile applications via e-extension programmes.
Department of Agriculture; Department of Horticulture; KVKs; ATMA and SAUs need to improve farmers’ awareness on market intelligence.
Increase in median farmers’ income by 2-5 %
95

Sl. No
Issue Status Policy &
Institutional Requirements
Role of Government
Agency/ Organization Stakeholders’
Responsibilities
Expected Outcome
(1) (2) (3) (4) (5) (6) 4. Managing
yield gap andreducing costs
Yield rates of all major crops in Gujarat are only 50 per cent to 75 per cent of their potential yields.
a. Strengthening thedistribution ofquality inputs.
b. Improvising farmmechanization.
c. Increasing theproduction andutilization of bio-agents.
a. Follow-ups of krishi mahotsavsby line departments to improveadoption of technologies.
b. Increasing budget on ‘FarmersInter-State Exposure Visits andTraining Scheme’ .
c. Improving farm mechanizationby innovating small implementsand proliferating custom hiringcentres (CHCs) .
d. Encouraging use of greenmanures, biofertilizers and biopesticides among farmersthrough awareness programmes.
Department of Agriculture, Department of Horticulture, SAUs and ICAR centres need to conduct training programmes.
Short duration research on yield gap management and cost-reduction may be taken by SAUs and ICAR centres
Reduction in per unit output cost.
Increase in median farmers’ income by 5-10 %
5. Alleviatingfarm financialdistress
Financial distress alone accounted for 38.7 per cent of farmer suicides in India.
Presently, only 15 % of the loan is disbursed as investment credit.
Provisioning farm credit avenues on marketing, storage and consumption.
All financial benefits, mainly the subsidies in different forms, should be provided and transferred directly to farmers account through e-governance.
a. In line with self-liquidatingproduction loans, short durationmarketing loans may also beconsidered.
b. Increase the proportion ofinvestment credit.
c. Operationalize credit linkedwarehousing facilities at APMClevel.
d. Promote pledge financingthrough a network of ruralgodowns and negotiablewarehousing receipt system toreduce distress sale
NABARD and other banking and non-banking financial institutions, Central and State Warehousing Corporations need to support farming through affordable financial loans and incentives.
Increase in median farmers’ income upto 10 %
96

Sl. No
Issue Status Policy &
Institutional Requirements
Role of Government
Agency/ Organization Stakeholders’
Responsibilities
Expected Outcome
(1) (2) (3) (4) (5) (6) 6. Doubling the
current levelof exports
Share of India in world exports is very low and hardly 1.5 % on an average during the last decades.
Farm level awareness on SPS measures is still very poor.
Double the current level of 1.70 lakh crores worth of agri. exports within 5 years.
Boost to RTAs(Regional Tariff Agreements) to address the issue of Non Technical Barriers such as TBT and SPS Measures and to attract investment
d. Promote Crop StewardshipPrograms, Good AgriculturalPractices (GAP) andCertification procedures.
e. Promote Global CommodityBoards like California Walnuts,Washington Apples for our ownfarm produce like Talala KesarKheri or Kutchi Dates.
f. Promote quality consciousnessand health safety issues amongfarmers for both domestic andinternational trade.
APEDA, MPEDA, other Export Promotion Organizations and SAUs need to conduct training programmes on SPS standards and certification procedures.
Increase in median farmers’ income by 2-5%
7. Encouragingagro-forestry
Potential of agro-forestry lies untapped in the state
Barren lands and field bunds can be utilized such as:
1. Boundaryplantation
2. Silvi- pastoralsystem
3. Agri-Horti system4. Horti-Pastoral
system5. Horti-silvi system6. Industrial
agroforestrysystem.
a. Tree species with 8-10 yearsrotation age such as Ailanthus(match stick tree), araduso(Melia dubia) can be taken upin marginal lands and affectedsoils.
b. Encourage tissue culture labs toproduce clones which mayfurther reduce the rotation ageupto four years.
Forest Department, local government agencies, NGOs and SAUs need to promote agro-forestry in the state through appropriate awareness and training programmes.
Increase in median farmers’ incomes by 2-5%
97

Sl. No
Issue Status Policy &
Institutional Requirements
Role of Government
Agency/ Organization Stakeholders’
Responsibilities
Expected Outcome
(1) (2) (3) (4) (5) (6) 8. Harnessing
solar potentialSolar infrastructure is not affordable by majority of the farmers even after the prevailing subsidy.
Making solar infrastructure affordable.
Ensuring incomes by assured power purchase agreements
a. Conduct training programmes forimproving awareness on on-farmsolar infrastructure.
b. Mandating Power PurchaseAgreements (PPAs) for 25 yearswith feed-in tariffs of Rs 8-9 / unit.
c. Devise strategies in as such a waythat solar infrastructure need tobenefit small and marginal farmersas well.
GEDA, NGOs, NABARD and SAUs need to research on affordable solar infrastructure.
Solarising the groundwater economy will mitigate climate change implications.
Increase in median farmers’ income by 2-5%
9. PromotingAgro-tourism
Rural/AgriculturalEnvironment+FarmCommodities+ TourismServices= Agrotourism
As of 2014-15, the potential of Indian agri-tourism industry is Rs 4,300 crore, while the global agri-tourism market is $10 billion USD.
Though prospects are immense, agro-tourism in Gujarat is still at nascent stage.
Promote active participation of all stakeholders in the agro-tourism sector.
Corporate sector need to join hands with the line departments for commercial development of agro-tourism.
a. Promote active participation of allstakeholders including experts, localcommunities, hoteliers, touroperators and government agencies.
b. Organize agro-eco-tourism in a moreintegrated way by using the localresources and local folklore in thefarms to attract the tourists.
c. Establish Agro Rural Tourism(ART) centers to protect ecology byavoiding plastics, promotinggreenery, supporting biodiversityand conserving water bodies tobenefit agro-tourism sector.
Gujarat Tourism; Department of Agriculture; Department of Horticulture; Forest Department, SAUs and NGOs need to facilitate agro-tourism in the state with intense research and training programmes.
Farmers tend to have offseason earnings.
Increase in median farmers’ incomes by 2%
98

Sl. No
Issue Status Policy &
Institutional Requirements
Role of Government
Agency/ Organization/ Stakeholders’
Responsibilities
Expected Outcome
(1) (2) (3) (4) (5) (6) d. Establish Agro-Technology Parks
(e.g. Mango orchard based beekeeping farms or greenhouse basedfloriculture or olericulture) forquality production on commercialscale which may also serve as agro-tourism destinations.
e. Develop hortiSilvi-pastoral or agri-horti-silvi culture system to boostagro-eco tourism.
10. Promotingrural non-farmemploymentsector
Creation of non-farm employment opportunities within the rural areas seems to be somewhat dormant as of now.
Only 5 % of labour force in the 20-24 age category have vocational skills compared with as much as 96% for South Korea.
Provide appropriate assistance to small scale sector in rural areas in terms of information base, availability of technology, technology transfer, improved credit availability and infra-structural and marketing support.
a. Prioritize skill training programmesto sufficiently reflect the marketdemand by roping in industries asone of the collaborators.
b. Simplify licensing procedures, lawsand regulations for developing smallscale enterprises in rural areas.
c. Ensure rural works programmesachieving the twin objectives ofcreation of rural infrastructure andadditional incomes.
d. More than subsidies and welfareschemes, ensure entitlements (rawmaterials, credit and markets) ofrural enterprises as an industry.
Government of Gujarat, Central Government, NABARD, Banking and other financial institutions need to prioritize policy measures for uplifting rural non-farm employment sector.
The assets created (e.g. roads, culverts) by rural programmes can boost the marketing of rural products, thus indirectly helping the non-farm production and incomes.
Increase in median farmers’ incomes by 10-15%
99

Sl. No
Issue Status Policy &
Institutional Requirements
Role of Government
Agency/ Organization/ Stakeholders’
Responsibilities
Expected Outcome
(1) (2) (3) (4) (5) (6) 11. Leveraging
PradhanMantri FasalBima Yojana(PMFBY)
Crop and livestock insurance in Gujarat has not attracted farmers sufficiently.
Awareness among farmers about the benefits of PMFBY is being promoted by the State government machinery.
The modalities of Crop Cutting Experiments (CCEs) are cumbersome.
The man-power involved in conducting CCEs is also grossly insufficient.
a. Prioritize crop andlivestockinsurance anintegral part offarming among allsections offarmingcommunity.
b. Strong need ofawarenesscreation aboutinsuranceproducts.
c. Encourage PPPmode inagriculturalinsurance andprovide privateinsurers the samelevel of subsidyon par withgovernmentagencies.
d. Promote groupinsurance forsmall andmarginal farmersunder FPOs.
a. May be made compulsory for allfarmers so that a non-loaneefarmer is not pushed to extremesin case of crop-loss.
b. Ensure one hundred per centsubsidy on premium at least for afew years in case of small andmarginal farmers.
c. Promote PMFBY similar togeneral insurance with the helpof commission agenta.
d. Design crop insurance productswith a village as a unitrepresenting similar crops orcropping patterns.
e. To increase competition, insteadof selecting one agri-insuranceplayer through bid system for adistrict, all the districts should bemade open to all the players.
f. A separate Agriculture InsuranceRegulatory Authority needs to beestablished.
g. A Toll Free Agri Insurancenumber should be launched.
Department of Agriculture, Department of Horticulture, SAUs need to conduct training programmes and workshops on PMFBY.
GoG and Central Government need to ensure effective steps for expanding the scope of PMFBY among all the sections of farming communities.
Reduction in farm distress.
Farmers belief in institutions will considerably improve.
Will pay way for financial inclusion.
Increase in median farmers’ incomes by 5-8%, given that farmers tend to take up risks and adopt good cultivation practices once they are assured of compensation.
100

Success story 25. Development of Low Cost Farm Implements


9. Implementation Plan and Institutional Responsibilities
1. Increasing the productivity of crop and animal sectors
a) Field crops:
Sl. No Issue Agency / Organization/ Stakeholders' Responsibilities Expected Outcome
(1) (5) (6) 1. Low Seed Replacement Ratio (SRR) SAUs, ICAR centers, Department of Agriculture, Seed
Certification agencies, and NGOs need to undertake large scale seed production and distribution programmes.
Increase in productivity by 20 %
Increase in median farm income by 5-10 %
2. Low rate of replacement of varieties &cultivation of unsuitable crops andvarieties.
a. Line Departments, KVKs and Extension departments ofAgricultural Universities and NGOs should imparttraining.
b. Universities and ICAR centres need to take up short termresearch work for addressing the problems.
c. Breeder seed should be provided by the crop breederconcerned.
Increase in productivity by 5-10%
Increase in median farm income by 5-10 %
3. Low awareness on scientific Seedtreatment techniques
Line Departments, KVKs and Extension departments of Agricultural Universities should impart training on seed treatment.
Increase in productivity by 5-10 %
Increase in median farm income by 5-10 %
4. Less exposure of farmers to non-monetary inputs
Line Departments, KVKs and Extension departments of Agricultural Universities need to impart rigorous training.
Increase in productivity by 10-15 % Increase in median farm income by 8-10 %
5. Maintain optimum plant population Line Departments, KVKs and Extension departments of Agricultural Universities will impart training and ensure the availability of good quality seeds/planting materials.
Increase in productivity by 5-10 % Increase in median farm income by 5-10 %
103

Sl. No Issue Agency / Organization/ Stakeholders' Responsibilities Expected Outcome
(1) (5) (6) 6. Expedite Integrated Nutrient
ManagementLine Departments, KVKs and Extension departments of Agricultural Universities should impart training.
SAUs and ICAR centres should take up the research programs.
Reduction in cost of cultivation by 5 to 8 % Increase in productivity by 10-15 % Increase in median farm income by 8-10 %
7. Promoting Precision Agriculture SAUs, line departments and KVKs should impart training to identified farmers and extension workers. SAUs and ICAR centres should take up short duration research programs.
Increase in productivity by 5-10 %
Increase in median farm income by 5-10 %
8. Prioritizing Micro-Irrigation Structures(MIS)
a. State Department on irrigation and water use should planand design efficient water harvesting systems
b. SAUs, Line Departments, KVKs and ICAR centres needto impart training on crop-specific WUE and FUEmeasures.
Increase in productivity by 15-20 %
Increase in median farm income by 10-12 %
9. Integrated Weed Management Line Departments, KVKs and Extension departments of Agricultural Universities should impart training.
Increase in productivity by 10 %
Increase in median farm income by 7-10 %
10. Prioritize Integrated Pest /DiseaseManagement
a. State regulatory authorities need to seize spuriousproducts from market.
b. KVKs, SAUS, and Line Departments should imparttraining.
c. SAUs / ICAR centres need to training to input dealersand progressive farmers alike.
Increase in productivity by 12-15 %
Increase in median farm income by 10-12 %
104

b) Horticultural crops:
Sl. No Issue Agency / Organization/ Stakeholder’
Responsibilities Expected Outcome
(1) (5) (6) 11. Lack of availability of quality
planting materialState Department of Horticulture, NHM, NHB and SAUs need to work in tandem for establishing nurseries and conduct crop-specific training programmes.
Increase in productivity & reduction in cost of cultivation by 12-15 % Increase in median farm income by 10 %
12. Diversifying area toward high valuehorticultural crops
State Department of Horticulture, NHM, NHB and SAUs, ICAR centres need to create awareness on horticultural crops through demonstration and training. Promoting research on site-specific crop diversification studies.
Increase in production of horti. crops by 5-10% Increase in median farm income by 5 %
13. Increase productivity of horti. cropsthrough high-tech technology
State Department of Horticulture, SAUs, and KVK need to organize crop-specific effective training programmes.
Increase in productivity by 10-15% Increase in median farm income by 10 %
105

c) Livestock sector:
Sl. No Issue Agency / Organization/ Stakeholder’ Responsibilities Expected Outcome
(1) (5) (6) 14. Improving availability of feed and
fodders Department of Animal Husbandry, Department of Agriculture and Dairy Cooperatives. RFOs, GCMMF and NDDB, SAUs and Kamdhenu University should conduct training programmes.
Increase in milk production by 20-25% Increase in median farmers’ income by 5 %
15. Promote Breeding of livestock animals
SAUs and Kamdhenu University should undertake breeding and upgradation of dairy animals.
SAUs, Dept. of Animal Husbandry, Gandhinagar, Milk Unions and Kamdhenu University should conduct training programmes and ensure semen supply and its di ib i
Increase in milk production by 30-35 %
Increase in median farmers’ income by 5 %
16. Formulate housing Management for livestock sector
SAUs, Dept. of Animal Husbandry, Gandhinagar, Milk Unions and Kamdhenu University should conduct site-specific training programmes.
Increase in milk production by 5-10 %
Increase in median farmers’ income by 2 %
17. Formulate Health management of livestock animals
SAUs, Dept. of Animal Husbandry and Kamdhenu University need to conduct training programmes on the aspects of health management.
Dept. of Animal Husbandry should carry out diagnostic facilities on regular basis.
Increase in milk production by 20-25 %
Increase in median farmers’ income by 2.5 %
106

d) Fisheries sector:
Sl. No Issue Agency / Organization/ Stakeholder’ Responsibilities Expected Outcome
(1) (5) (6) 18. Fresh water fish production:
Fisheries Department, CIFRI, CIFA, CIFE, KVK, SAUs and Kamdhenu University need to conduct location specific research and transfer of technology. The stakeholders need to conduct training programmes on combating climate variability issues.
May result in increased per ha fish production, social upliftment and employment generation. Increase in median farmers’ income by 2.5 % in the state.
19. Brackish water fish production:
Fisheries Department, CIBA, CAA, MPEA, GPCB, KVKs, SAUs and Kamdhenu University need to promote location specific research and transfer of technology.
Increase in median farmers’ income by 2%
20. Marine-water Capture fisheries
Fisheries Department / CMFRI/ CIFNET/ INCOIS/ CIFE/ MPEADA/ FSI/ GOG/ GOI need to promote training programmes.
Increased catch per unit effort efficiency and export earnings. Increase in median farmers’ income by 2%
e) Poultry sector
21 Develop efforts for Breeding in poultry sector
SAUs, ICAR centres and Kamdhenu University need to prioritize breeding efforts in poultry sector.
Increase in poultry production by 30-35 % Increase in median farmers’ income by 5 %
22 Prioritize feed & nutrition
SAUs, Kamdhenu University, ICAR centres, Dept. of
Increase in poultry production by
23 Formulate health management in poultry sector
State Animal Husbandry Department, GOG need to promote diagnosis and control measures.
Increase in median farmers’ income by 1%
107
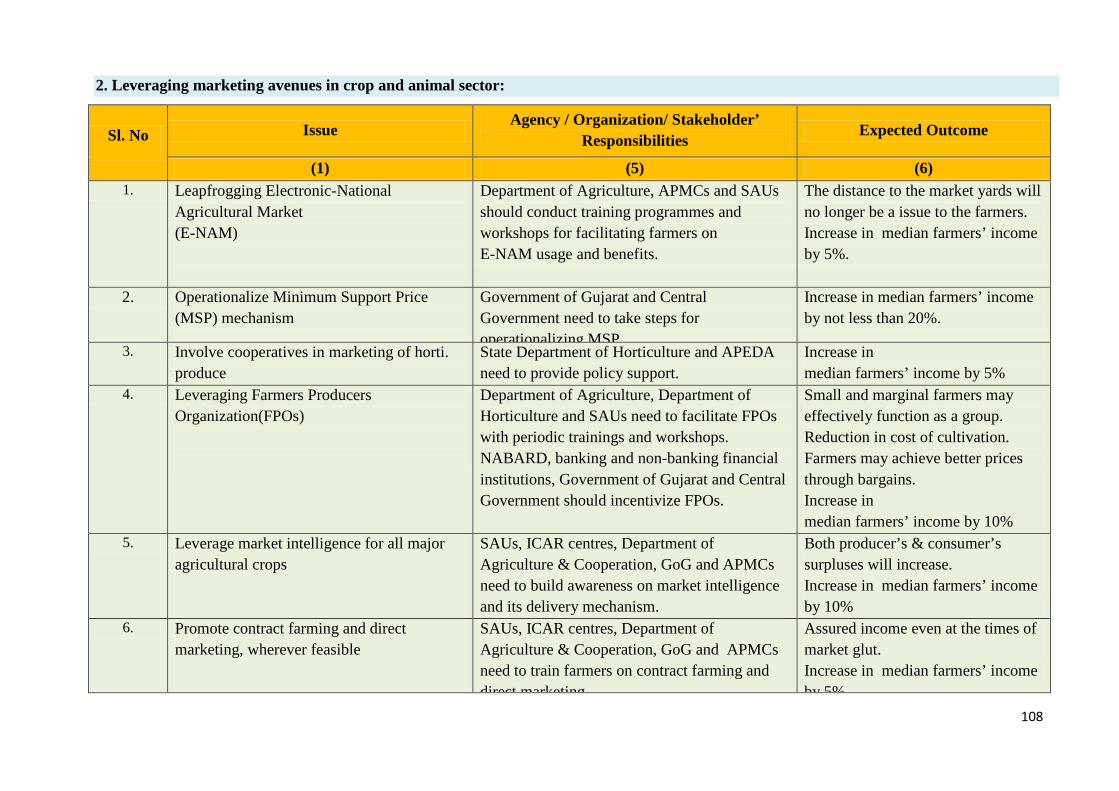
2. Leveraging marketing avenues in crop and animal sector:
Sl. No Issue Agency / Organization/ Stakeholder’ Responsibilities Expected Outcome
(1) (5) (6) 1. Leapfrogging Electronic-National
Agricultural Market (E-NAM)
Department of Agriculture, APMCs and SAUs should conduct training programmes and workshops for facilitating farmers on E-NAM usage and benefits.
The distance to the market yards will no longer be a issue to the farmers. Increase in median farmers’ income by 5%.
2. Operationalize Minimum Support Price (MSP) mechanism
Government of Gujarat and Central Government need to take steps for operationalizing MSP
Increase in median farmers’ income by not less than 20%.
3. Involve cooperatives in marketing of horti. produce
State Department of Horticulture and APEDA need to provide policy support.
Increase in median farmers’ income by 5%
4. Leveraging Farmers Producers Organization(FPOs)
Department of Agriculture, Department of Horticulture and SAUs need to facilitate FPOs with periodic trainings and workshops. NABARD, banking and non-banking financial institutions, Government of Gujarat and Central Government should incentivize FPOs.
Small and marginal farmers may effectively function as a group. Reduction in cost of cultivation. Farmers may achieve better prices through bargains. Increase in median farmers’ income by 10%
5. Leverage market intelligence for all major agricultural crops
SAUs, ICAR centres, Department of Agriculture & Cooperation, GoG and APMCs need to build awareness on market intelligence and its delivery mechanism.
Both producer’s & consumer’s surpluses will increase. Increase in median farmers’ income by 10%
6. Promote contract farming and direct marketing, wherever feasible
SAUs, ICAR centres, Department of Agriculture & Cooperation, GoG and APMCs need to train farmers on contract farming and direct marketing
Assured income even at the times of market glut. Increase in median farmers’ income by 5%
108

Sl. No Issue Agency/
Organization Stakeholder’s Responsibilities Expected Outcome
(1) (5) (6) 7. Innovate livestock marketing SAUs, Kamdhenu University, Department of
Animal Husbandry and Milk Unions need to conduct exposure programmes
5 % increase in milk production Increase in median farmers’ income by 2%
8. Accelerate marketing for poultry products
Animal Husbandry Department, Health and Family Welfare Department, SAUs should undertake research and training.
Promotion of indigenous breeds. Increase in median farmers’ income by 2%
3. Leapfrogging Post-harvest and Value-Addition Prospects:
1. Improving farm pre- and post- harvest management techniques in crop sector
Department of Horticulture, Dept. of Agriculture, State Agril. Marketing Board, NHM, MOFPI, GAIC and SAUS should conduct training on pre- and post-harvesting.
• Reduction in crop loss. • Increase in median farmers’ income by
10 %
2. Improve recycling of crop residue at farm-level
Department of Agriculture, Department of Horticulture, SAUs and ICAR centres need to conduct waste recycling training.
• Increase in productivity. • Reduction in cost of cultivation. • Increase in income by 10 %
3. Improve milk quality & introduce value addition in livestock sector
Department of Agriculture; NABARD and SAUs and Kamdhenu University need to conduct awareness programmes.
Production of hygienic premium quality milk at farm-level.
4. Promote post-harvest technologies in fisheries sector
EIA, MPEDA, CIFT, Fisheries Department, SAUs and Kamdhenu University need to take up promotional programmes in post-harvest technologies.
Increase in value added exports and foreign exchange earnings. Increase in median farmers’ income by 5%
109

4. Promoting on-farm ancillary activities:
Sl. No Issue Agency/
Organization/ Stakeholders’ Responsibilities Expected Outcome
(1) (5) (6) 1.
Promoting on-farm honey production (Apiculture)
Department of Agriculture, Department of Horticulture, KVKs, Forest Department, NGOs and SAUs need to promote apiary through training programmes and research.
Additional income to farmers by increase in crop yields and quality. Increase in median farmers’ income by 1%
2. Incentivizing mushroom cultivation Department of Agriculture, Dept. of Horticulture, KVKs, NABARD, APEDA, NGOs; and SAUs need to conduct training programmes on production and marketing of mushroom products.
Crop by-products / wastes can be effectively utilized. Increase in median farmers’ income by 1%
5. Invigorating organic farming:
Sl. No Issue Agency/
Organization/ Stakeholders’ Responsibilities Expected Outcome
(1) (5) (6) 1. Increasing area under organic
farming Department of Agriculture, Department of Horticulture, NHM, NHB, PSUs, SAUs and ICAR centres need to conduct programmrs for promoting organic cultivation in the state.
Initially 10-15% decrease in farm yields but higher price premium for farm outputs by 10-15 % Reduction in cost of production. Improvements in soil health (physical and biological properties) and reduce chemical load in the soil.. Increase in median farmers’ income by 5-10%
110

10. Summary & Recommendations rop output in Gujarat after 2000-01 has shown a trend break; performance, however, has varied. Foodgrains area has plateaued but its output in terms of value has increased considerably on account of spurt in growth of
wheat. Rice production has also consolidated, both in terms of physical output and gross value. Amongst non-foodgrains, noteworthy contributions to gross value and output have been made by cotton, spices and fruits & vegetables. Technological advancements in terms of adoption of higher-yielding varieties of food crops and Bt cotton have caused high yield enhancement. Moreover, during this period contribution of yield to total output has been quite remarkable. Yet, factors responsible for fluctuations in output of these crops need a careful attention. Technological advancement needs to encompass a wider range of crops as it is crucial for output growth. Growth of real income in the agricultural sector appears to have caused buoyancy in the farm sector and prosperity amongst rural households is providing wider markets for industry and service sectors, leading to high overall income acceleration. The production technology seems to be the major key to improve the prospects of agriculture in the state. Research should be encouraged for evolving suitable production technologies to push up the prevailing technological frontiers. Investments in this direction may be envisaged, particularly for the rainfed regions with scarce water resources, and for regions where there is possibility of water harvesting. Also, the problem of agricultural development in Gujarat has to be considered in the wider perspective of integrated rural development. Agricultural development has to be integrated with the overall economic growth and generation of livelihood opportunities in the rural sector. Diversified and high value agriculture is the pre-requisite for high growth of non-farm sector as it opens possibilities for value addition and strengthens backward and forward linkages with non-agricultural sectors, leading to livelihood opportunities for the indigent. Specific recommendations for doubling farmers’ income in Gujarat state:
Agriculture sector
• District and Taluka wise crop planning & cluster approach should be practiced to enhance yields. • The technologies available today in Gujarat can increase yield levels up to 75%, improve farm profitability up
to 100%, besides reducing per unit production cost. Strategy: Follow-ups of krushi mahotsava by the line departments in a phased manner need to carried out to improve the adoption of technologies / GAPs.
• Though Soil Health Cards (SHCs) can bring down cultivation costs by 10-25%, it is still found to be supply driven as farmers fail to realize nutrient management. Strategy: Demonstrate & train the usefulness of the recommendations of SHCs by applying recommended doses of fertilizer on experimental plots at every GP.
• Focus on production of pulses by utilization of rice fallows and intercropping with coarse cereals, oilseeds and commercial crops (sugarcane, cotton).
• Incentivizing the use of improved varieties such as: GAR 13, GAR-1,2,3, GNR-3 and 4 and Mahisagar in rice; Vaishali, GT-103 and GJP- 1 in tur; Meha, Gujarat 4, GM-5, GNM – 6 in moong; Guj 2, Guj Gram 3, Guj Gram 3, Guj Gram 5 in gram; and GW 366, GW 11, GJW 463, GW 451, GAD- 3 (rainfed) in wheat.
• Low SRR in wheat, desi cotton, pulses, groundnut and soybean. Quality seed production need to be scaled up on war footing which will improve productivity by 20-30%.
• Tribal areas have relative advantage in organic farming due to: i) low level of input use, ii) shorter conversion period and iii) smaller yield reductions. These areas should be identified as organic zones and training support need to be provided
C
111

• In situ moisture conservation practices (ISMCP) to reduce irrigation cost by 50% and improve yield levels and popularizing of ride and furrow makers improves the adoption of ISMCP by 75%, thereby their access have to be ensured by CHCs & localized subsidies.
• Promoting INM modules with biofertilizers: E.g. Rhizobia for legumes and Azotobacter and Azospirillum for non-legumes and PSB / ZSB / KSB can reduce cost up to Rs. 5400 / ha.
• Special Agricultural Zones (SAZs) need to be established in the peri-urban and semi-urban areas for fruits, vegetables, milk and egg production focusing on exports and urban areas.
Horticulture sector
• Reclaiming 5 lakh ha of barren lands within the next two years by encouraging contract farming for horticultural crops (which will improve income levels up to 25% to 40%) and buyback arrangement by the institutional agencies can attract and retain next generation farmers.
• Area expansion in date palm, pomegranate, papaya and coconut (hybrid) is possible. But the constraint lies in the growing incidences of drying roots and wilting shoots. The effective strategy could be tissue culture units for date palm and pomegranate plantlets and by establishing plug nurseries for F &Vs & flowers.
• South Gujarat has high rainfall & humidity which can be exploited by promoting the cultivation of black pepper, turmeric, ginger, cashewnut and banana.
Livestock sector
• By Fertility Improvement Programme (FIP) conducted between 2011-12 and 2015-16: 6.95 lakh animals have become fertile. If the average milk yield is 5 Lit./animal/day then total milk production is 34.74 LLPD & additional income is Rs.14 crore /day @Milk price of Rs. 40 / litre. Thereby, there is an urgent need that FIP programme be implemented across Gujarat through aggressive campaign to reduce NPA besides improving milk availability.
• Encourage artificial insemnination with proven bulls. • Establish indigenous milk co-operatives for production and marketing of desi (A2 milk). • Improve fodder production by utilizing proven fodder varieties. E.g. CO (GG)-3 dry matter yield of
553.7q/ha/year which was up to 85% higher. Fodder banks need to be encouraged at village level.
Fisheries sector
• Marine water fish production: Promote cage, pen, seaweed, oyster, and mussel farming policies in marine waters (Except North and Middle Gujarat agro-climatic zones).
• Fresh water fish production: Promote cage & pen farming policies in reservoirs and lakes. • Improve fish processing and export infrastructure
Processing and Value Addition sector
• Cluster based emphasis on HPS groundnut for exports & table purpose in Junagadh, Kutch, Jamnagar, Porbandar and Bhavnagar will enhance farmers’ income up to 25% in 3 years.
• Mechanization in production and post-production will reduce per unit cost of production up to 50%. • Roughly, 30% of fruits and vegetable are lost in Gujarat accounting for Rs. 9,000 crores in the state.
Processing at least 10% at farm gate level will increase farmers’ income by 15 to 20%. • Cluster based Agro Processing Centre for all crops: Primary processing, grading and milling of produce may
increase the market rate by about 10 to 30%.
112

• Not less than 81% cold storages suitable only for Potato. There is a need to upgrade the facilities for multicommodities.
• High potential for improving fish processing facilities, especially in Saurashtra zone.
References
1. Anonymous (2016a). Annual Report of the Gujarat Green Revolution Company Limited, Accessed atwww.ggrc.co.in on 23 Oct., 2017.
2. Anonymous. (2016b). Compartmental Bunding for Moisture Conservation and Higher Productivity of PearlMiller in North Gujarat. Annual report of AICRP on Dryland Agriculture, SDAU, Dantiwada, Gujarat.
3. Anonymous. (2016). PM Narendra Modi outlines 7 point strategy to double farmers’ income. Indo-Asian News Service, March 29, 2016.
4. Anonymous. (2016c). Annual Development Programme of Crop Husbandry, GoG. Gandhinagar.5. Anonymous. (2016d). Annual Growth Rates of Agriculture and Allied Activities, NITI Aayog, GOI.6. Anonymous (2016e). Report on Task Force to Derive Suggestions to Increase Agricultural Development in
Guj. Nov. 2015, DAC, GoG.7. Anonymous. (2016f). Monograph on Doubling Farmers' Income by 2022. NABARD.8. Anonymous. (2016g). State Focus Paper: Gujarat (2016-17). NABARD.9. Bhalla, G. S. and Gurmail, S. (2009). Economic Liberalization and Indian Agriculture: A
Statewise Analysis. Economic and Political Weekly, 44 (52): 34-4410. Chand, R. (2016a). Doubling Farmers’ Income: Strategy and Prospects. Lectured delivered in the 76th
Annual Conference of the Indian Society of Agricultural Economics, Assam Agricultural University,Jorhat, November 21-23, 2016.
11. Chand, R. (2016b). Why Doubling Farmers’ Income is Possible, The Indian Express, July 27.12. Chand, R. and Singh, J. (2016). A Study Report on Agricultural Marketing and Farmer Friendly Reforms
across Indian States and UTs. NITI Aayog, GOI.13. Chand, R., Saxena, R. and Rana, S. (2015). Estimates and Analysis of Farm Income in India, 1983-84 to
2011-12. Economic and Political Weekly, 22: 139-145.14. Chandrasekar, S. and Mehrotra, N. (2016). Doubling Farmers' Income by 2022: What would it take.
Economic and Political Weekly, 18: 10-30.15. Dhandhalya, M. G., Shiyani, R. L., Tarapara, V. D. and Chavda, H. (2016). Total Factor Productivity of
Major Crops and Contribution of Research Investment to Agricultural Growth in Gujarat, AGRESCOreport – 2016-17, JAU, Junagadh.
16. Gandhi, V and Namboodiri, N. V. (2009). Economics of Bt Cotton vis-a-vis non-Bt Cotton in
India: A Study across four major Cotton Growing States, Centre for Management in Agriculture,
IIM-Ahmedabad.
17. GoG. (2012). State Agriculture Profile, (http://agri.gujarat.gov.in/informations/state_agri_profile. html,Accessed on 25th Sep., 2017), Government of Gujarat.
18. Kumar, M. Dinesh and Upali Amarasinghe (Eds). (200)9. Water Productivity Improvements inIndian Agriculture: Potentials, Constraints and Prospects, Strategic Analysis of the NationalRiver Linking Project (NRLP) Series 4, Colombo: International Water Management Institute.
113

19. NSSO. (2014). Situation Assessment Survey of Agricultural Households, 2012-13, NationalSample Survey Organization, GOI, New Delhi.
20. Patel, Gunvant. (1977). Gujarat Agriculture. Overseas Book Traders’ Publication, Ahmedabad.21. Patel, H. R., Lunagaria, M.M., Karande, B.I., Yadav, S.B., Shah, A.V., Sood, V.K. and Pandey,
Vyas. (2015). Climate change and its Impact on Major Crops in Gujarat, Journal ofAgrometeorology, 17 (2): 190-193.
22. Ranade, R. and Kumar, D. M. (2004). Narmada water for groundwater recharge in north gujarar:conjunctive management in large irrigation projects, Economic and Political Weekly, 39 (31):3498-503.
23. Ray, K., Mohanty, M. and Chincholikar, J. R. (2009). Climate variability over Gujarat, India,ISPRS Archives XXXVIII-8/W3 Workshop Proceedings: Impact of Climate Change onAgriculture.
24. Shah, T., Ashok, G., Hemant P., Ganga, S. and Jain, R. C. (2009). Secret of Gujarat’s Agrarian Miracle after 2000. Economic and Political Weekly, 44 (52): 498-503.
25. Shaheen, F. A. and Shiyani, R. L. (2005). Equity redistribution: Groundwater Borewells in NorthGujarat. Economic and Political Weekly, 40 (4): 307-312
114
All Succes stories adapted from "101 Success Stories to Double the Income of Farmers" Department of Agricutlure and Cooperation, Govt. of Gujarat.