For data to solve problems, what
7
10/14/11 1 How can computation… help visualize data? UNIVERSITY of WISCONSIN-MADISON Computer Sciences Department CS 202 Introduction to Computation Professor Andrea Arpaci-Dusseau For data to solve problems, what do we need to do? Capture • Collect or obtain Store • Where? what if it gets lost? Share • Who should have access? Anonymize for privacy Organize • Sort it? put in categories? Process it • Search through it, analyze it, mine it for correlations Visualize it • What is useful for humans to look at? Use results to inform our decision Data Visualization TED talk (Technology, Entertainment, Design) “Demo: Stunning data visualization in the AlloSphere” • See, hear and interpret scientific data • Dive into the brain, feel electron spin, hear the music of the elements • 6 minutes http://www.ted.com/talks/ joann_kuchera_morin_tours_the_ allosphere.html Data Visualization TED talk Hans Rosling: “Let my dataset change your mindset” • Visualizing time-series data sets can give new insights • Data-bubble software bursts myths about the developing world (health, wealth) • 20 minutes http://www.ted.com/talks/ hans_rosling_at_state.html# Similar goal to Homework 5 data visualization
Transcript of For data to solve problems, what
10/14/11
1
How can computation… �help visualize data?�
UNIVERSITY of WISCONSIN-MADISON �Computer Sciences Department �
CS 202�Introduction to Computation �
Professor Andrea Arpaci-Dusseau �
""�
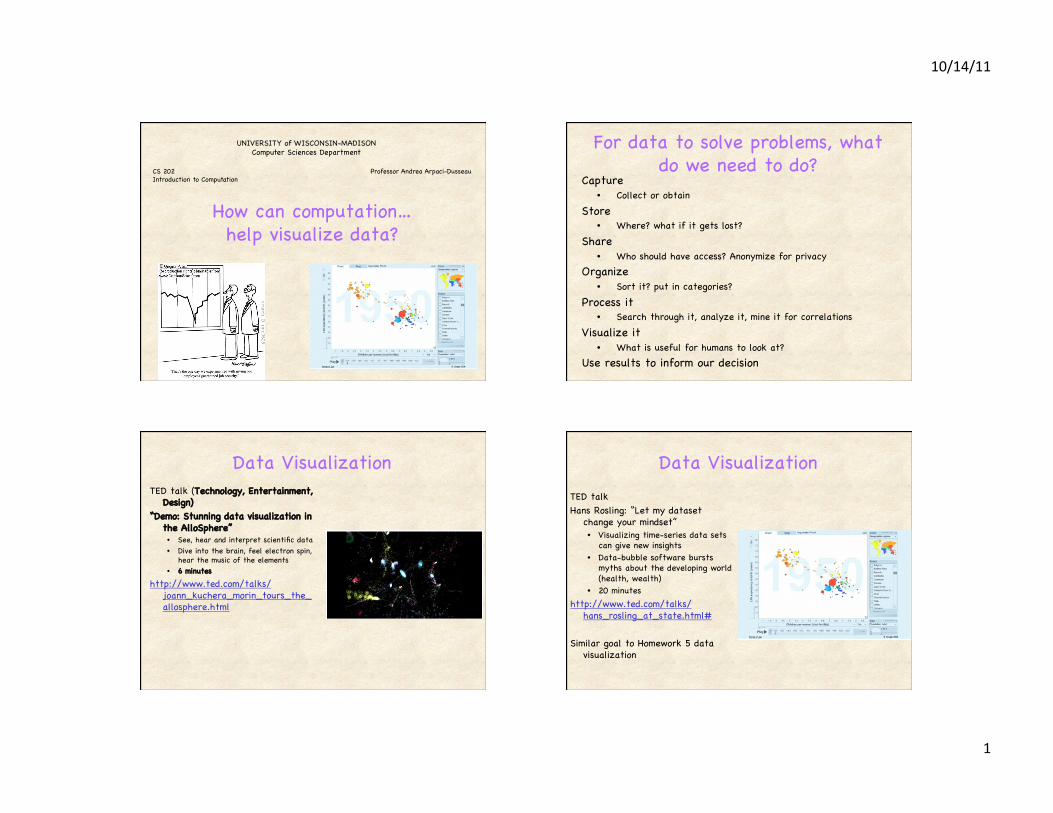
For data to solve problems, what do we need to do?�
Capture �• Collect or obtain �
Store�• Where? what if it gets lost?�
Share �• Who should have access? Anonymize for privacy�
Organize �• Sort it? put in categories?�
Process it �• Search through it, analyze it, mine it for correlations�
Visualize it �• What is useful for humans to look at?�
Use results to inform our decision �
Data Visualization �TED talk (Technology, Entertainment,
Design)�“Demo: Stunning data visualization in
the AlloSphere”�• See, hear and interpret scientific data�• Dive into the brain, feel electron spin,
hear the music of the elements�• 6 minutes�
http://www.ted.com/talks/joann_kuchera_morin_tours_the_allosphere.html�
Data Visualization �TED talk �Hans Rosling: “Let my dataset
change your mindset”�• Visualizing time-series data sets
can give new insights�• Data-bubble software bursts
myths about the developing world (health, wealth)�
• 20 minutes�http://www.ted.com/talks/
hans_rosling_at_state.html#�
Similar goal to Homework 5 data visualization �

10/14/11
2
Data Visualization �
http://flowingdata.com/�
Steps towards�Visualization in Scratch�
Forever�• Goto random location on grid�• Random size within space�• Stamp random shade of blue�
What is result of running Scripts?�
Forever�• Goto random location
on grid�• Stamp random shade
of blue�• Random size within
space�
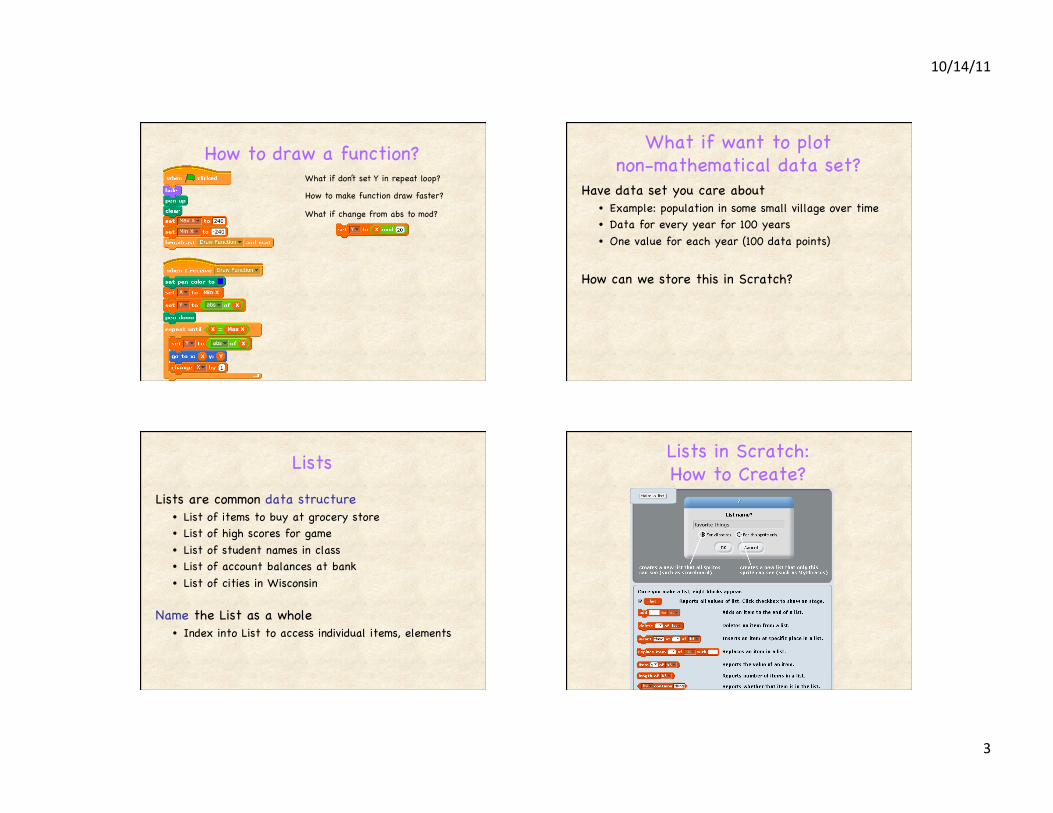
How to draw a function?�
How to use Scratch to draw:�
Y = absolute (X)�
Use pen and go to all (X,Y) coordinates such that Y = absolute (X)�
Initialize X, Y (-240, 240)�Put pen down �Repeat until X = 240 �
• Set Y to abs (X)�• Goto X,Y�• Change X by 1 �
10/14/11
3
How to draw a function?�
What if change from abs to mod?�
What if don’t set Y in repeat loop?�
How to make function draw faster?�
What if want to plot �non-mathematical data set?�
Have data set you care about �• Example: population in some small village over time�• Data for every year for 100 years�• One value for each year (100 data points)�
How can we store this in Scratch?�
Lists �
Lists are common data structure�• List of items to buy at grocery store�• List of high scores for game�• List of student names in class�• List of account balances at bank �• List of cities in Wisconsin �
Name the List as a whole�• Index into List to access individual items, elements�
Lists in Scratch: �How to Create?�

10/14/11
4
Example List in Scratch�• Name: Valuable Numbers�
• List of N elements: Element1, Element2, …, ElementN �
• N=100 for Valuable Numbers�– What value is at element 1?
element 10?�– At what location (or
element or index) is value 73? �
Lists: �How to Look at Contents?�
Lists: �How to Change the Contents?�
Lists: �How to Change the Contents?�

10/14/11
5
Lists: �How to Change the Contents?�
Lists: �How to Remove Items?�
Lists: �How to Remove Items?�
Lists: �How to Look at the Contents?�

10/14/11
6
Lists: �How to Look at the Contents?�
Lists: �How to Delete Entire List?�
How to Make List with 100 �Random Numbers?�
New script: Create Valuable Numbers�• Puts result in List: Valuable Numbers�
– Contains 100 elements�– Each element: Integer between 1 and 1000 �
How to plot contents of List?�
Same approach as drawing function for y�
Just grab next value of y from list instead�

10/14/11
7
Check-Up �How many items can you put in a list?�How do you find the number of items
in a list?�What is the difference: �
What is the difference: �
For the given list, what would this code do?�
Today’s Summary�
Today’s topic �• Visualizing data can help everyone better understand
the world we live in �“Reading”�
• TED talks linked on Course Schedule page�Announcements�
• Exam 1 graded, returned�• Homework 5 available – compose music w/ lists,
visualization �