For Citation Please use: van Lierop, D., Badami, M., & El...
31
1 What Influences Satisfaction and Loyalty in Public Transport? A Review of the Literature For Citation Please use: van Lierop, D., Badami, M., & El‐Geneidy, A. (2018). What influences satisfaction and loyalty in public transit? A critical review of the literature. Transport Reviews, 38(1), 52‐72.
Transcript of For Citation Please use: van Lierop, D., Badami, M., & El...

1
WhatInfluencesSatisfactionandLoyaltyinPublicTransport?AReviewoftheLiterature
For Citation Please use: van Lierop, D., Badami, M., & El‐Geneidy, A. (2018). What influences satisfaction and loyalty in public transit? A critical review of the literature. Transport Reviews, 38(1), 52‐72.

Abstract
Public transport ridership retention is a challenge for many cities. To develop comprehensive
strategies aimed at retaining riders, it is necessary to understand the aspects of public transport
that influence users to become loyal to the system. This paper analyses relevant literature
regarding the causes of satisfaction and loyalty in public transport. We find that the service
factors most associated with satisfaction are on-board cleanliness and comfort, courteous and
helpful behaviour from operators, safety, as well as punctuality and frequency of service. On the
other hand, loyalty is associated with users’ perceptions of value for money, on-board safety and
cleanliness, interactions with personnel and the image and commitment to public transport that
users feels. Furthermore, the results elucidate that the concept of loyalty is best defined based on
users’ intentions to continue using the service, their willingness to recommend it to others, their
overall satisfaction, but also and most importantly, their image of and involvement with public
transport. Public transport users who have a positive image of the agency and consider public
transport an integral component of city life are more likely to demonstrate loyalty and act like
ambassadors for public transport agencies.
Keywords:Public transport; satisfaction; loyalty; service factors; ridership retention; literature review
Word count: 7382

What Influences Satisfaction and Loyalty
3
Introduction
Public transport is a service that many cities recognize as being an important aspect in the
development of socially, environmentally, and economically sustainable communities. However,
current public transport usage is still much lower than automobile usage in many regions around
the world, and thus, novel strategies need to be developed to promote the use of this sustainable
mode. One way to increase public transport mode share is to face the continuous challenge of
retaining current users while at the same time attracting new ones. Although many people go
through periods in their lives when they use public transport regularly, common reasons for
public transport users to stop using the system include becoming dissatisfied with service,
gaining access to a car, or changing the location of their job or home which is sometimes
associated with changes in family size (Perk, Flynn, & Volinski, 2008). One example of a study
that illustrates the effects that lifecycle changes have on mode shifts away from public transport
is a cohort analysis of public transport users in Montreal, Canada, by Grimsrud and El-Geneidy
(2014). This study not only found that public transport use decreases with age, but also that
cohorts which have higher usage in their youth tend to decrease their public transport mode share
less than cohorts that rely more on other modes when they are young. These findings are rather
insightful and useful, as they suggest that lasting ridership via sustained loyalty could be
stimulated through the implementation of policies that address the changing mobility needs of
public transport users as they proceed through lifecycle changes. In addition, new riders will also
always make up a proportion of public transport markets (Barlow & Clark, 2006), and efforts
should be made to attract and retain this group as well. Therefore, Perk et al. (2008) state that
“because even a small reduction in turnover would add significantly to the growth of the transit
market, strategies designed to increase ridership should focus as much on retaining current
riders as on attracting new ones.”
In order for practitioners and policy makers to develop comprehensive strategies aimed at
retaining riders, it is necessary to understand and identify which aspects of public transport
influence satisfaction and loyalty (Fornell, Johnson, Anderson, Cha, & Bryant, 1996; Friman &
Fellesson, 2009). In this context, the purpose of this paper is to review studies that provide
insight into the causes of satisfaction and loyalty in public transport with the goal of identifying
key strategies that can be implemented to increase ridership retention.

First, to clarify the distinction between satisfaction and loyalty we discuss how these
concepts have been defined and used in previous literature. Second, we describe the
methodology that is used to select the relevant literature that is reviewed. Next, based on the
review of the literature, we discuss and analyse which service factors we find to be the most
important with regard to both satisfaction and loyalty. We discuss recommendations for
increasing satisfaction and loyalty throughout the text, and recognize that strategies influencing
satisfaction tend to address trip specific issues, and those motivating loyalty often address larger,
agency-wide issues. Finally, we provide suggestions for further research.
Defining Satisfaction and Loyalty
Customer satisfaction in public transport has been studied since the mid-1960s (Transportation
Research Board, 1999, 2002), and since the 1990s, the application of marketing techniques has
provided transportation researchers with a tool to study satisfaction with respect to travel
(Fornell et al., 1996). The concept of satisfaction with travel has therefore been well-established
over time, and frequently discussed and used in the literature. More recently, since the beginning
of the twenty-first century, a number of studies have focused on aiming to understand what
drives satisfaction compared to loyalty, and it has become important to understand the
differences between these two commonly-used terms.
In the context of public transport, satisfaction is defined as a customer’s overall
experience with a service compared to his or her pre-defined expectations (Morfoulaki,
Tyrinopoulos, & Aifadopoulou, 2010), and loyalty as a customer’s intention to use the service in
the future based on previous experiences (Transportation Research Board, 1999). Although it is
possible to measure satisfaction without considering loyalty (Stuart, Mednick, & Bockman,
2000; Tyrinopoulos & Antoniou, 2008), the results of recent studies suggest that the reverse
would be theoretically illogical as satisfaction tends to influence loyalty (Chou & Kim, 2009; Lai
& Chen, 2011; van Lierop & El-Geneidy, 2016). In addition, the concept of satisfaction is well-
established in the literature and it may relate to one specific component of the overall transport
service, a combination of components, or the overall service as a composite. Loyalty, however, is
more complex to define, and debate exists about how this concept should be measured.

What Influences Satisfaction and Loyalty
5
The loyalty debate
The concept of loyalty is not well defined in the transport literature, and due to the fact that it is a
more recent topic of study, researchers have not yet agreed on how to measure it. While some
researchers claim that satisfaction should be included in the definition of loyalty, others claim
that it should not. For example, several authors have suggested that public transport users who
(1) are satisfied overall, but also (2) have the intention of continuing to use public transport, and
(3) are willing to recommend the service to others, will demonstrate behavioural and emotional
loyalty towards public transport (Allen & Allen, 2004; Transportation Research Board, 1999;
van Lierop & El-Geneidy, 2016). However, although these three aspects are important in
generating loyal customers overall, most authors make the claim that overall customer
satisfaction strongly influences customer loyalty rather than being a part of the loyalty construct
itself, and therefore should not be included in the definition (Bloemer, De Ruyter, & Peeters,
1998; Chou & Kim, 2009; Lai & Chen, 2011; Minser & Webb, 2010; Oliver, 1999; Olsen &
Johnson, 2003; Zhao, Webb, & Shah, 2014). More generally, Zhao et al. (2014) suggest that
loyalty can be divided into two aspects: the first being related to a person’s continuous behaviour
to purchase or use a product or service, and the second having to do with the consumer’s
attitudes and emotions towards a service on an ongoing basis. This means that many authors
claim that loyalty should be based only on (1) intended future usage, and (2) willingness to
recommend (Lai & Chen, 2011; Minser & Webb, 2010; Zhao et al., 2014). This two-part
definition of loyalty is commonly used because intention to use is often considered a proxy for
actual future usage (Lai & Chen, 2011), and users who are willing to recommend the service to
others are commonly loyal customers (Reichheld, 2003). There is an underlying assumption
throughout the literature that users will continue to use public transport and recommend it to
others only when they are satisfied with the service performance (van Lierop & El-Geneidy,
2016).
However, researchers who believe that it is not enough to define loyalty with only
variables that describe intended future usage and willingness to recommend, often insist that
users’ overall satisfaction with the public transport agency should be included in the definition of
loyalty; this is because it is possible that some public transport users continue to use the system
because they do not have an alternative choice, but are not actually satisfied with the system they
are dependent on. (Figler, Sriraj, Welch, & Yavuz, 2011; Transportation Research Board, 1999).

These “captive users,” who in contrast to “choice users,” tend to use transport out of necessity,
(Krizek & El-Geneidy, 2007; van Lierop & El-Geneidy, 2017), may change their mode if given
an alternative option that they prefer. Yet, in contrast, Zhao et al. (2014) comment that a reverse
effect also can take place when highly satisfied passengers defect from the system simply
because a preferred mode becomes available. There may also be people who never have used, or
will never use, public transport, but yet are strongly committed to supporting it in their
communities. For these reasons, many authors who do not include overall satisfaction as part of
the loyalty variable, recognize that overall satisfaction with the public transport agency strongly
influences loyalty (Carreira, Patrício, Natal, & Magee, 2014; Kim & Ulfarsson, 2012; Lai &
Chen, 2011; Zhao et al., 2014).
In addition to the debate about whether or not overall satisfaction should be included in a
loyalty construct, several authors developed loyalty variables that include additional aspects that
complement likeliness to use and willingness to recommend. For example, Carreira et al. (2014)
developed a loyalty variable that in addition to asking about future usage and positively
discussing the agency’s service with other people, also assessed whether users considered the
service provided by the public transport agency to be their first choice to travel from an origin to
a destination. Other researchers asked survey participants to evaluate different travel scenarios
and assessed the likeliness to continue using public transport based on the responses (Imaz,
Habib, Shalaby, & Idris, 2015). In addition, some studies have used single-question variables to
assess public transport users’ likeliness to continue using the system (Kim & Ulfarsson, 2012;
Şimşekoğlu, Nordfjærn, & Rundmo, 2015). Because of this on-going debate about how loyalty
should be measured, and whether satisfaction should be seen as contributing to loyalty, this paper
reviews studies that define loyalty in a variety of ways.
Methodology
This study utilizes the realist literature review method to identify and systematically analyse all
of the relevant literature regarding the causes of satisfaction and loyalty in public transport.
Rather than the solely critical approach of conventional systematic reviews, the realist method
incorporates a more explanatory focus (Pawson, Greenhalgh, Harvey, & Walshe, 2005). To
define the relevant literature, we conduct a three phase search strategy. The first phase consisted
of gathering literature through an extensive search utilizing Scopus, Web of Knowledge, and the

What Influences Satisfaction and Loyalty
7
Transportation Research Board archive, TRID. During the second phase, the inclusion and
exclusion criteria presented in Table 1 were applied to the search results. The final phase used
snowballing techniques to track down and gather other relevant sources from the reference lists
of the selected literature. Accordingly, the same inclusion and exclusion criteria were applied to
articles found through this method.
Table 1: Inclusion and exclusion criteria for the literature review
Included Excluded
English language Non-English language
January 1999 – October 2015 Before January 1999 – after October 2015
Full journal articles Conference proceedings, lectures, grey literature, presentations, policy documents
Peer-reviewed Not peer-reviewed
Empirical qualitative and quantitative studies that focus on a case
Studies that focus on simulation techniques, mathematical optimization methods, mode choice models, or quality management frameworks such as SERVQUAL
Focuses on urban public transportation (Bus, Rail, Subway, Metro, Monorail, Streetcar, Light Rail)
Focuses on walking, cycling, automobiles, freight, airlines or other modes
Main focus is on the service factors that measure the quality of service
Main focus is on the users’ emotions or characteristics
Local modes, intra-urban travel High Speed Rail, coach buses, inter-urban travel
Focuses on everyday usage of the mode Focuses on tourism
Focuses on satisfaction, loyalty, or quality of service
If no mention of satisfaction, loyalty, or quality of service
Empirical model driven analysis or in-depth and systematically analysed interviews
Summary statistics only
The search criteria for studies assessing public transport user satisfaction and loyalty consisted of
the following terms within the “title” search field: “(satisfaction OR loyalty) AND (transit OR
transport* OR bus OR rail) NOT (Marine OR Air)” In addition the searches were limited to
English, being categorized as (Research Area = Transportation), and being published between
January 1999 and October 2015. This timeframe was chosen as the Transit Cooperative Research
Program (TCRP) report on Customer Satisfaction and Service quality was published in 1999, and
this document made a call for increased research in this area (Transportation Research Board,
1999). A total of 116 papers were found in the first phase of the search, of which 100 were
excluded after the inclusion and exclusion criteria were applied to the title and key words (Table

1). The second phase of the search yielded an additional five papers, and a final number of 21
were read in full. The final selection of papers that met the inclusion and exclusion criteria has
been separated into two tables. Table 2 lists 13 articles that focus on gaining a better
understanding of the service attributes influencing overall satisfaction, and Table 3 shows eight
articles focusing specifically on the derivers of loyalty.

9
TABLE 2: Literature review results for satisfaction
SATISFACTION Year Author(s) Title Location Kind of transportation Sample size Data Source Type of analysis
2000 Stuart, K., Mednick, M., & Bockman, J.
Structural Equation Model of customer satisfaction for the New York City subway city
New York City, USA
Subway 1,500 Transportation Panel of the MTA’s NYC Transit (Telephone interviews)
Structural Equation Modelling (SEM)
2000 Weinstein, A. Customer Satisfaction among transit riders: How customers rank the relative importance of various service attributes
San Francisco, USA
Rail >5000 On-board customer satisfaction survey
Bivariate correlation analysis and factor and regression analysis
2003 Burkhardt, J. Critical measures of transit service quality in the eyes of older travellers
United States Bus 88 Focus groups Qualitative
2007 Krizek, K. & El-Geneidy, A.
Segmenting preferences and habits of transit users and non-users
Minneapolis-St. Paul-Bloomington, Minnesota, USA
Bus users and non-users 4408 Metro Transit users and non-users surveys
Factor analysis & cluster analysis
2008 Tyrinopoulos, Y. & Antoniou, C.
Public transit user satisfaction: Variability and policy implications
Athens & Thessaloniki, Greece
Bus, trolley bus, & rail/metro
1,473 (202, 556, 177, 165, 374)
Passenger questionnaires from five transit agencies
Factor analysis & Ordered logit model
2010 Githui, J., Okamura, T., & Nakamura, F.
The structure of users’ satisfaction on urban public transport service in developing country: The case of Nairobi
Nairobi, Kenya
Bus & matatu (mini-bus)
140 Questionnaires (home and office-based interviews)
SEM
2011 dell’Olio, L., Ibeas, A., & Cecín, P.
The quality of service desired by public transport users
Santander, Spain Bus 305 Focus groups & stated preference surveys
Discrete choice models
2013 Das, A., Ladin, M., Ismail, A., & Rahmat, R.
Consumers satisfaction of public transport monorail user in Kuala Lumpur
Kuala Lumpur, Malaysia
Monorail 400 Questionnaires at rail stations
Importance Performance Analysis
2013 de Oña, J., de Oña, R., Eboli, L., & Mazzulla, G.
Perceived service quality in bus transit service: A structural equation approach
Granada, Spain Bus 1,200 Transport Consortium of Granada’s customer satisfaction survey
SEM
2014 Grujičić, D., Ivanović, I., Jović, J., & Đorić, V.
Customer perception of service quality in public transport
Belgrade, Serbia Bus 449 Surveys at stops Importance Performance Analysis
2014 Nwachukwu, A. Assessment of passenger satisfaction with intra-city public bus transport services in Abuja, Nigeria
Abuja, Nigeria Bus 300 Questionnaires, field observations, & oral interviews
Principal Component Analysis & regressions

Year Author(s) Title Location Kind of transportation Sample size Data Source Type of analysis
2014 Susilo, Y. & Cats, O.
Exploring key determinants of travel satisfaction for multi-modal trips by different traveller groups
Eight European cities
Public transport, car, bicycle, and walking (61% use PT as main mode)
554 European-wide survey: in-person, online, and phone
Multi-variate statistical analyses
2015 Mouwen, A. Drivers of customer satisfaction with public transport services
The Netherlands Bus, tram, train, & metro
180,000 Nation-wide on-board survey
Linear regression
TABLE 3: Literature review results for loyalty
LOYALTY
Year Author(s) Title Location Kind of transportation Sample size Data Source Type of analysis
2010 Minser, J., & Webb, V.
Quantifying the benefits: Application of customer loyalty modeling in public transportation context
Chicago, Illinois, USA
Bus and train 264 Chicago Transit Authority Customer Satisfaction Survey
SEM
2011 Figler, S., Sriraj, P., Welch, E. & Yavuz, N.
Customer loyalty and Chicago, Illinois Transit Authority buses: Results from 2008 customer satisfaction survey
Chicago, USA Bus 364 Chicago Transit Authority Customer Satisfaction Survey
Quadrant Analysis, Multivariate regression
2011 Lai, W. & Chen, C.
Behavioural intentions of public transit passengers – The roles of service quality, perceived value, satisfaction and involvement
Kaohsiung, Taiwan
Rail 763 Self-administered questionnaire at transit stations
SEM
2012 Kim, S. & Ulfarsson, G.
Commitment to light rail transit patronage
St. Louis, Missouri & Illinois, USA
Light rail 824 On-board customer satisfaction survey
Binary logit model
2014 Carreira, Rui, Patrício, L., Jorge, R., & Magee, C.
Understanding the travel experience and its impact on attitudes, emotions and loyalty towards the transportation provider – A quantitative study with mid-distance bus trips
Portugal Bus 1,226 On-board questionnaires SEM
2014 Zhao, J., Webb, V., & Shah, P.
Customer loyalty differences between captive and choice transit riders
Chicago, USA Bus and rail 264 Chicago Transit Authority Customer Satisfaction Survey
Multiple-Indicator Multiple Cause Analysis and Multiple Group Analysis
2015 Imaz, A., Habib, K., & Shalaby, A., Idris, A.
Investigating the factors affecting transit user loyalty
Toronto, Canada Subway, streetcar, and bus
270 Revealed and Stated Preference Commuting survey
Binary logistic regression model
2015 Şimşekoğlu, Ö., Nordfjærn, T., & Rundmo, T.
The role of attitudes, transport priorities, and car use habit for travel mode use and intentions to use public transportation in an urban Norwegian public
Six urban regions of Norway
Public transport (bus, train, tram & metro)
546 Self-administered mail questionnaires
SEM & logistic regression

11
Findings
Summarizing the Literature
The goal of this review of the literature is to identify which service attributes are most commonly
associated with satisfaction and loyalty in local public transport. Accordingly, studies about long
distance modes and modes such as walking and cycling are not included, and instead the review
focuses on intra-urban bus and rail systems, with several papers including analyses of multiple
modes. Table 2 shows that the majority of the literature attempts to understand which service
factors derive satisfaction among bus users (7), while fewer focus specifically on rail (3), or
multiple modes (3). It is unsurprising that more satisfaction papers focus specifically on bus use;
bus is often cited as being the least favourable mode, yet, because it is more economical
compared to rail, many transport authorities and cities would benefit from increasing passenger
satisfaction among bus users. On the other hand, it is also logical that researchers who focus on
loyalty would assess multiple modes, as it is more interesting to know which service factors
encourage overall passenger loyalty to public transport services as a whole, and not just to a
single mode or specific route. While understanding user satisfaction of specific routes or modes
can be useful to encourage and plan specific service changes, it is likely more useful for public
transport agencies to focus on increasing loyalty among all kinds of users – including both
“captive” and “choice” passengers – as it serves as a reflection of how individuals experience
public transport overall. However, as previously discussed, satisfaction is often related to loyalty
and therefore it is important to understand specifically which factors increase satisfaction among
public transport users.
This review of the literature is not geographically constrained, and papers from different
continents have been included. For example, with regard to satisfaction, the majority of the
papers come from Europe (6), but studies from North America (4), Africa (2), and Asia (1) are
also included. With regard to loyalty, however, the large majority are North American cases (5),
with only a few coming from Europe (2) and Asia (1). We have included studies from all regions
as they represent cases that assess formal public transport services in cities that have a developed
central business district. Another notable difference between the studies presented in Tables 2
and 3 is that they have a wide variety of sample sizes, ranging from Burkhardt’s (2003)
qualitative research of focus groups that yielded 88 participants, to Mouwen’s (2015) nation-
wide study with 180,000 participants. The variation in sample sizes stems from the difference in
data sources as some researchers used data collected by transport authorities and others collect
their own primary data. Data for these studies was collected in a variety of ways including,
telephone interviews, on- and off-board surveys, focus groups, and mixed-methods. While
different forms of regression analysis are the most common, Structural Equation Modelling
(SEM), Importance Performance Analysis, Factor-Cluster Analysis, and focus groups have been
used.
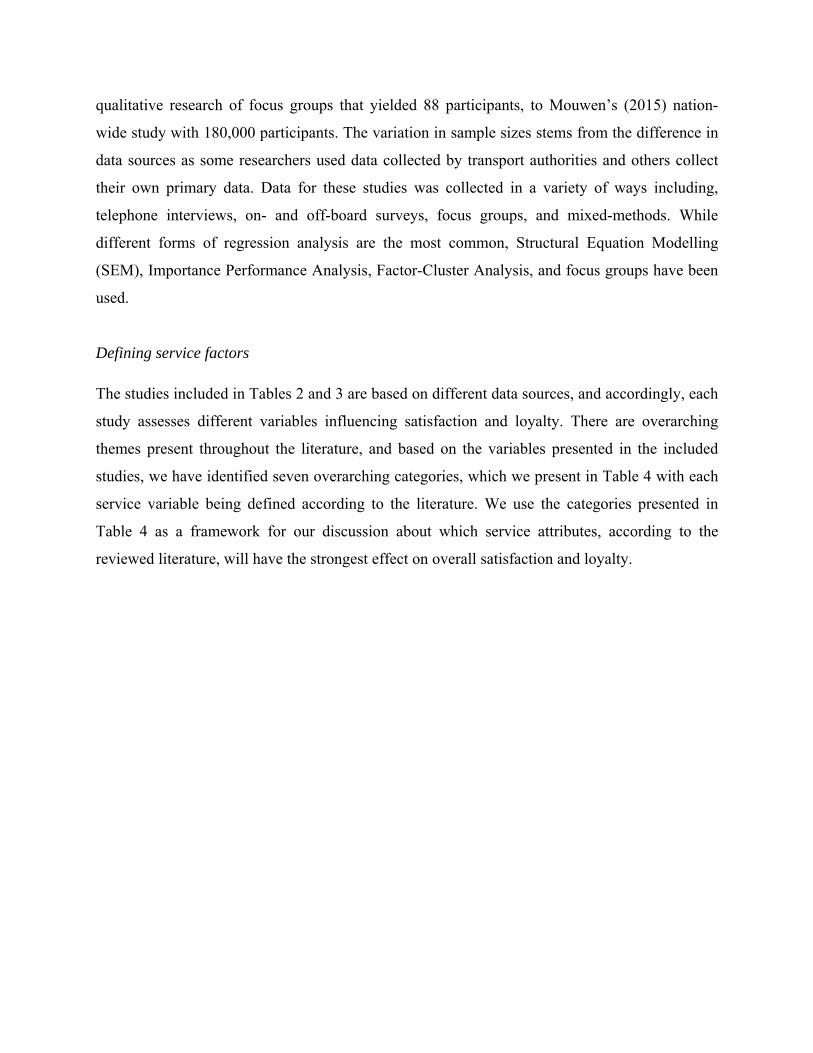
Defining service factors
The studies included in Tables 2 and 3 are based on different data sources, and accordingly, each
study assesses different variables influencing satisfaction and loyalty. There are overarching
themes present throughout the literature, and based on the variables presented in the included
studies, we have identified seven overarching categories, which we present in Table 4 with each
service variable being defined according to the literature. We use the categories presented in
Table 4 as a framework for our discussion about which service attributes, according to the
reviewed literature, will have the strongest effect on overall satisfaction and loyalty.

13
TABLE 4: Overarching categories and service factor definitions ONBOARD EXPERIENCE
Cleanliness: the level of cleanliness and lack of garbage inside the vehicle
Comfort: the comfort of the seats, ceiling height, leg space available on-board
Seating capacity: the number of seats on-board
Accessibility (physical): the ease with which people can board and alight the vehicle
On-board information: the presence of maps and stop announcement on-board
Crowding: passengers’ personal space on-board
Quality of vehicle: the physical condition and age of the vehicle
Safety: passengers perception of being safe from crime and traffic while on-board
Temperature: on-board temperature control such as ventilation, air conditioning and heating
SERVICE DELIVERY Reliability: the consistency of a vehicle’s punctuality and travel time according to scheduled departures and arrivals
On-time performance / punctuality: the punctuality of the service
Frequency: the scheduled frequency of the service
Travel time: how quickly passengers travel from their origin to destination using a specific mode
Access time: the time it takes passengers to get from their origin to the public transport stop or station
Network coverage: the extent to which the transport system provides passengers with access to the different locations in the region
Number of transfers: the number of times that a passenger has to change from one vehicle to another in a single trip
Service provision hours: the operating hours of the system
Convenience: the extent to which the agency provides an effective and easy-to-use service
Stop location: whether the location of the stops is convenient for users
Station parking: the availability of park-and-ride facilities at public transport stations
Waiting time: the amount of time a passenger must wait before boarding a vehicle
WAITING CONDITIONS Waiting conditions: the quality of the waiting environment at stops and stations
Information at stops: the information provided at stops and stations including the presence of real-time-information systems
Safety at stops: passengers perception of being safe from crime and traffic while waiting at a stop of station
COSTS Value: passenger perception of value-for-money
Types of tickets and passes: the existence of a variety of ticket types such as student passes or day, week, and month passes
Ticket selling network: the availability of vending locations
CUSTOMER SERVICE Driver and personnel's attitudes: the attitude of the driver and personnel as well as the courteousness of the staff and personnel
Personnel skills: the ability of the driver and other staff
Complaint dealing: the way in which the agency deals with passengers’ complaints
QUALITY OF TRANSFERS Transfer time: the amount of time it takes a passenger to transfer between vehicles
Ease of transfer: the ease at which a passenger transfers between vehicles
IMAGE Image: how a passenger views public transport or their involvement with the service
Environmentally friendly: whether a passenger chooses the mode because it is more ecologically responsible compared to a private car

14
The presence of specific service factors
Table 5 demonstrates which service factors are statistically significant or deemed to be important
for increasing satisfaction according to the studies included in this review of the literature.
Additionally, Table 6 shows the results for loyalty. The outcome is based on our analysis of the
statistical outputs, summary charts, and qualitative findings of the papers presented in Tables 2
and 3 taken all together. More specifically, in the tables an “x” represents that the service factor
has been found to be statistically significant in the analysis or discussed by the authors as being
important. When no “x” is assigned, it means that either the result was not statistically
significant, or that it was not accounted for in the analysis. Because negative results are not often
published due and contributing to publication bias (Easterbrook, Gopalan, Berlin, & Matthews,
1991), it is not possible to report what has been tested but not been included, and therefore we
can only include what the authors have reported in their models and other results. Nevertheless,
we analyse and interpret the results of each paper, and thereby go beyond the results published in
the abstracts and conclusions of the included literature to avoid bias. The following section uses
the results of Tables 5 and 6, to frame our discussion of the service factors influencing
satisfaction and loyalty.

15
TABLE 5: Service factors influencing satisfaction
x= statistically significant
in the analysis or discussed by the authors
as being important
On-board Experience Service Delivery Waiting
conditions Transfers
Customer service
Costs Image
clea
nlin
ess
com
fort
seat
ing
capa
city
acce
ssib
ilit
y (p
hysi
cal)
on-b
oard
info
rmat
ion
crow
ding
qual
ity
of v
ehic
le
safe
ty
tem
pera
ture
reli
abil
ity
on-t
ime
perf
orm
ance
/ pun
ctua
lity
freq
uenc
y
trav
el ti
me
acce
ss ti
me
netw
ork
cove
rage
num
ber
of tr
ansf
ers
serv
ice
prov
isio
n ho
urs
conv
enie
nce/
eff
ecti
ve
stop
loca
tion
stat
ion
park
ing
wai
ting
tim
e
wai
ting
con
diti
ons
info
at s
tops
safe
ty a
t sto
ps
tran
sfer
tim
e
ease
of
tran
sfe r
/dis
tanc
e
driv
er a
nd p
erso
nnel
’s b
ehav
iour
an
d at
titu
des
pers
onne
l ski
lls
com
plai
nt d
eali
ng
valu
e
type
s of
tick
ets
and
pass
es
tick
et s
elli
ng n
etw
ork
imag
e
envi
ronm
enta
lly
frie
ndly
Stuart et al. (2000) x --- --- --- --- x --- x --- x --- x x --- --- --- --- --- --- --- --- --- --- --- --- --- x --- --- x --- --- --- ---
Weinstein (2000) x x x x x --- x x x --- x x --- --- --- --- x --- --- x --- x --- x x x x --- --- --- --- x --- ---
Burkhardt (2003) --- x x x x --- --- x --- x --- --- --- x --- --- x --- --- --- --- x x --- --- --- x --- x x --- --- --- ---
Krizek and El-Geneidy (2007)
x x --- --- x --- --- x --- x x --- x --- x --- x --- --- x x --- --- --- x x x x --- --- --- --- --- ---
Tyrinopoulos and Antoniou (2008) x --- --- x x --- x x --- --- x x --- --- x --- --- --- --- --- x x x --- --- x x --- --- x x --- --- ---
Githui, Okamura, and Nakamura (2010)
--- x --- --- --- --- --- x --- --- x x --- --- --- --- --- --- x --- --- x --- --- --- --- x --- --- x x --- --- ---
dell’Olio, Ibeas, and Cecín (2011) x x --- --- --- x --- --- --- --- --- --- x --- --- --- --- --- --- --- x --- --- --- --- --- x --- --- --- --- --- --- ---
Das, Ladin, Ismail, and Rahmat (2013) x x x x x --- --- x --- --- x --- --- --- x --- --- --- --- x --- x --- --- --- --- --- --- --- --- --- x --- x
de Oña, de Oña, Eboli, and Mazzulla (2013) x x --- x x x --- x x --- x x x x --- --- --- --- x --- --- --- --- --- --- --- x --- --- x --- --- --- ---
Grujičić, Ivanović, Jović, and Đorić (2014) x --- --- --- --- x --- --- x --- x --- --- --- x --- --- --- --- --- x --- --- --- --- --- x --- --- x --- --- --- ---
Nwachukwu (2014) x x x x --- --- x --- --- --- --- x x x x --- --- --- --- --- x x --- --- --- --- --- --- --- --- --- --- --- ---
Susilo and Cats (2014) --- x x --- --- --- --- --- --- x --- x x --- --- x --- --- --- --- --- x --- x --- x --- --- --- --- --- --- --- ---
Mouwen (2015) x x x x x --- --- x --- --- x x x --- --- --- --- --- --- --- --- --- x x --- --- x --- --- x --- x --- ---
TOTAL 10 10 6 7 7 4 3 9 3 4 8 8 7 3 5 1 3 0 2 3 5 7 3 3 2 4 10 1 1 7 2 3 0 1
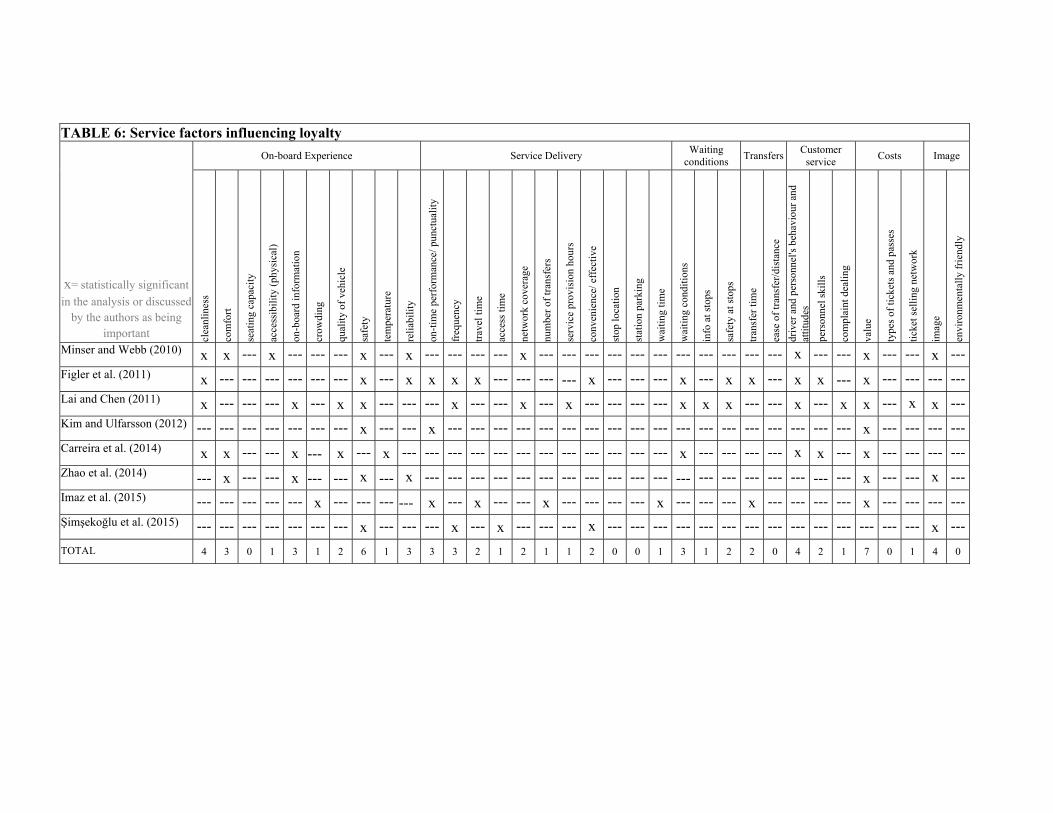
TABLE 6: Service factors influencing loyalty
x= statistically significant
in the analysis or discussed by the authors as being
important
On-board Experience Service Delivery Waiting
conditions Transfers
Customer service
Costs Image
clea
nlin
ess
com
fort
seat
ing
capa
city
acce
ssib
ilit
y (p
hysi
cal)
on-b
oard
info
rmat
ion
crow
ding
qual
ity
of v
ehic
le
safe
ty
tem
pera
ture
reli
abil
ity
on-t
ime
perf
orm
ance
/ pun
ctua
lity
freq
uenc
y
trav
el ti
me
acce
ss ti
me
netw
ork
cove
rage
num
ber
of tr
ansf
ers
serv
ice
prov
isio
n ho
urs
conv
enie
nce/
eff
ecti
ve
stop
loca
tion
stat
ion
park
ing
wai
ting
tim
e
wai
ting
con
diti
ons
info
at s
tops
safe
ty a
t sto
ps
tran
sfer
tim
e
ease
of
tran
sfer
/dis
tanc
e
driv
er a
nd p
erso
nnel
's b
ehav
iour
and
at
titu
des
pers
onne
l ski
lls
com
plai
nt d
eali
ng
valu
e
type
s of
tick
ets
and
pass
es
tick
et s
elli
ng n
etw
ork
imag
e
envi
ronm
enta
lly
frie
ndly
Minser and Webb (2010) x x --- x --- --- --- x --- x --- --- --- --- x --- --- --- --- --- --- --- --- --- --- --- x --- --- x --- --- x ---Figler et al. (2011) x --- --- --- --- --- --- x --- x x x x --- --- --- --- x --- --- --- x --- x x --- x x --- x --- --- --- ---Lai and Chen (2011) x --- --- --- x --- x x --- --- --- x --- --- x --- x --- --- --- --- x x x --- --- x --- x x --- x x ---Kim and Ulfarsson (2012) --- --- --- --- --- --- --- x --- --- x --- --- --- --- --- --- --- --- --- --- --- --- --- --- --- --- --- --- x --- --- --- ---Carreira et al. (2014) x x --- --- x --- x --- x --- --- --- --- --- --- --- --- --- --- --- --- x --- --- --- --- x x --- x --- --- --- ---Zhao et al. (2014) --- x --- --- x --- --- x --- x --- --- --- --- --- --- --- --- --- --- --- --- --- --- --- --- --- --- --- x --- --- x ---Imaz et al. (2015) --- --- --- --- --- x --- --- --- --- x --- x --- --- x --- --- --- --- x --- --- --- x --- --- --- --- x --- --- --- ---Şimşekoğlu et al. (2015) --- --- --- --- --- --- --- x --- --- --- x --- x --- --- --- x --- --- --- --- --- --- --- --- --- --- --- --- --- --- x ---
TOTAL 4 3 0 1 3 1 2 6 1 3 3 3 2 1 2 1 1 2 0 0 1 3 1 2 2 0 4 2 1 7 0 1 4 0

17
KeyVariables
The results presented in Table 5 clearly demonstrate that the service attributes most commonly
influencing satisfaction are: on-board cleanliness (10/13 papers) and comfort (10/13), the
behaviour and attitudes of the personnel (10/13), safety (9/13), as well as the punctuality (8/13)
and frequency of the service (8/13). Consequently, these service factors should be the focus of
public transport agencies who intend to increase ridership satisfaction in the short-term.
However, with regard to long-term planning, it is important that public transport agencies focus
on the service attributes which are strongly associated with overall loyalty. Accordingly, the
service factors that are important to motivating loyalty in the long-term both overlap and are
different from those affecting satisfaction and are: the perception of value for money (7/8), on-
board safety (6/8) and cleanliness (4/8), interactions with personnel (4/8) and the image and
commitment to public transport that the user feels (4/8).
These service attributes are discussed in detail in the sections below. For example,
because cleanliness and comfort are categorized as being on-board service attributes in Table 4,
these factors are discussed in the context of other factors that are associated with passengers’ on-
board experiences. Furthermore, the following subsections present analyses not only of the most
frequently assessed and important service factors influencing satisfaction and loyalty, but also
include a discussion of other less-researched, and sometimes also less influential, service
attributes that have been presented in the literature.
On‐boardexperience
On-board experience is based on the level of overall comfort that passengers experience while
on-board a public transport vehicle. Whereas at its most basic, on-board comfort can be
determined by the comfort of the seats inside the vehicles (Lee, Jin, & Ji, 2009), it generally will
encompass the quality of the overall on-board experience. On-board experience is therefore often
a reflection of on-board comfort and ranges from the physical aspects such as vehicle quality
(Carreira et al., 2014; Lai & Chen, 2011; Tyrinopoulos & Antoniou, 2008; Weinstein, 2000), to
interpersonal interactions such as those with drivers and other personnel (Burkhardt, 2003; Figler
et al., 2011; Krizek & El-Geneidy, 2007; Lai & Chen, 2011).

In-vehicle cleanliness and comfort are, according to the review of the literature, the most
important factors influencing users’ on-board experiences and are significant factors influencing
perceived satisfaction and loyalty overall (Carreira et al., 2014; Das et al., 2013; de Oña et al.,
2013; Mouwen, 2015). Weinstein (2000) groups cleanliness along with comfort as it influences
how individuals perceive the inside of the vehicle, and both cleanliness and comfort may also
vary depending on seasonality (Jacques, Manaugh, & El-Geneidy, 2013).
Users’ perceptions of safety are also associated with overall satisfaction and loyalty
(Githui et al., 2010; Krizek & El-Geneidy, 2007; Şimşekoğlu et al., 2015), and it can relate to
safety from traffic (Peden et al., 2004), or safety from crime (Smith & Clarke, 2000). Overall,
safety appears to be a stronger indicator of satisfaction outside of Europe (Das et al., 2013;
Githui et al., 2010; Krizek & El-Geneidy, 2007), even though this factor is commonly included
in surveys in European studies (Carreira et al., 2014; dell’Olio et al., 2011; Eboli & Mazzulla,
2012; Mouwen, 2015). However, further research is needed to understand why safety performs
strongly in non-European studies.
In-vehicle crowding is also an important factor influencing passengers’ experiences in
public transport and is related to overall comfort and safety (Carreira et al., 2014; dell’Olio et al.,
2011; Imaz et al., 2015), as crowded vehicles can be perceived as an encroachment on personal
space, and a personal safety concern (Cox, Houdmont, & Griffiths, 2006). A similar measure to
crowding is the seating capacity of the vehicle, and while seating capacity influences satisfaction
(Mouwen & Rietveld, 2013; Nwachukwu, 2014), on-board crowding has a stronger effect on
loyalty (Carreira et al., 2014; Imaz et al., 2015). The most common way to decrease crowding is
to increase service frequency, a topic that will be discussed later in this paper.
Other factors that are related to passengers’ on-board experiences include in vehicle
temperature (Chou & Kim, 2009; de Oña et al., 2013), and the quality and physical accessibility
of the vehicle (Carreira et al., 2014; dell’Olio et al., 2011; Hussein & Hapsari, 2015; Lai & Chen,
2011). These factors will likely influence the satisfaction of riders in different ways, with
seniors, for example, being more strongly influenced by the physical accessibility of the service
(Rosenbloom, 2004).
Accessible and accurate on-board information is also essential to increase satisfaction
among users. For example, Weinstein (2000) found service information to be the most critical
aspect needed to motivate satisfaction. One way that on-board information could be improved is

What Influences Satisfaction and Loyalty
19
by increasing the availability of scheduling information and maps; furthermore, several
researchers have suggested that on-board information that is either displayed or announced can
be an effective way to increase overall satisfaction (Burkhardt, 2003; Krizek & El-Geneidy,
2007). Good communication and effective wayfinding can also serve as helpful tools to assist
passengers in optimizing their experience with the overall public transport network.
Servicedelivery
While on-board experience is an essential determinant influencing satisfaction and loyalty
among public transport users, improvements to on-board comfort will only be beneficial if
passengers are satisfied with the reliability of the service. The review of the literature shows that,
passengers who are satisfied with the frequency of service and the on-time performance or
punctuality are very likely to be satisfied with the service overall (de Oña et al., 2013; Githui et
al., 2010; Mouwen, 2015; Tyrinopoulos & Antoniou, 2008; Weinstein, 2000). The fact that
compared to frequency and on-time performance, reliability tends to be a weaker indicator of
satisfaction, may stem from the fact that assessing whether a bus or train is generally on-time, or
whether it runs frequently tends to be an easier task for a passenger to comment on compared to
assessing the vaguer concept of reliability. Assessing reliability is a comparatively more complex
issue as it involves knowledge of the full public transport schedule over time. With this in mind,
Chakrabarti and Giuliano (2015) define a reliable service “as one which consistently operates
according to its schedule or plan.” To clarify this further, a frequently operating service that is
punctual at the beginning of the route may not be considered reliable if there often is variation in
on-time performance farther along the route. Therefore, a user may have reported that a service
was punctual and frequent, but may be unreliable due to inconsistencies in journey times from
day to day. While waiting time is related to overall satisfaction (dell’Olio et al., 2011;
Nwachukwu, 2014; Tyrinopoulos & Antoniou, 2008), waiting time due to unreliability can have
especially negative consequences and be burdensome to passengers with several transfers
(Rietveld, Bruinsma, & van Vuuren, 2001). Passengers are likely to be especially vulnerable to
unexpected waiting times associated with unreliable services, compared to expected waiting
times that are clearly communicated to passengers. However, the studies included in the review
did not include information about passengers experience with and without the use of real-time
arrival tracking on personal mobile phones, which may be changing transport users’ waiting
experiences and opinions about transport reliability. Overall, while on-time performance and

frequency have been found to be associated with overall satisfaction, to ensure loyalty to
transport in the long-term, agencies should also focus on increasing users’ perceptions of
reliability.
Several other service factors also influence service delivery, and according to Stuart et
al. (2000), travel time, or speed, is at least as important as the frequency of service. Other authors
also agree that total travel time is an important factor influencing passenger satisfaction
(dell’Olio et al., 2011; Mouwen, 2015; Susilo & Cats, 2014), and speed is often a determinant in
choosing public transport over another mode (Şimşekoğlu et al., 2015). Therefore, Figler et al.
(2011) suggest that it is good news for a public transport agency when there are “riders who use
the bus because of its convenience and not because it is the lesser evil of transportation modes.”
Convenience will, however, only be viewed positively if the network coverage allows passengers
to travel from their origin to destination at a time of their preference with minimized access time
(Burkhardt, 2003; de Oña et al., 2013), waiting time (dell’Olio et al., 2011; Tyrinopoulos &
Antoniou, 2008), travel time (Mouwen, 2015; Stuart et al., 2000), and number of transfers (Imaz
et al., 2015; Susilo & Cats, 2014). In addition, convenience could also be increased by
developing station amenities such as park-and-ride facilities (Das et al., 2013; Krizek & El-
Geneidy, 2007). Accordingly, service delivery improvements should include developing waiting
areas that are well thought-out, as they are an integrated aspect of the public transport network.
Waitingconditions
Many researchers have surveyed passengers about how they experience waiting conditions, and
although several studies found that the quality of waiting conditions influenced both overall
satisfaction and loyalty (Lai & Chen, 2011; Nwachukwu, 2014; Tyrinopoulos & Antoniou,
2008), in many studies it did not. More specifically, the quality of the information, including
real-time information on personal mobile phones, and at stops and stations does not have a strong
track record of influencing overall satisfaction and loyalty. Therefore, further research is needed
to assess how satisfaction and loyalty are influenced by passengers’ access to different mediums
of information and as well as the variation in the quality of information. This is in contrast to on-
board information which is reported as influencing satisfaction in a greater number of studies
(Burkhardt, 2003; de Oña et al., 2013; Lai & Chen, 2011; Tyrinopoulos & Antoniou, 2008;
Weinstein, 2000). These results demonstrate that waiting conditions may not be as important as
researchers previously anticipated, or that the wrong questions about waiting conditions are

What Influences Satisfaction and Loyalty
21
being asked in researchers’ surveys. Moreover, mode type does not appear to be a factor and
waiting conditions seem to be more important outside of Europe, which may be due to harsher
temperatures in the non-European examples included in this study (Burkhardt, 2003; Das et al.,
2013; Githui et al., 2010; Nwachukwu, 2014; Weinstein, 2000). In addition, none of the studies
included information about passengers accessing information through their own mobile phones
while at the stops. Perhaps these findings demonstrate that the way that passengers’ access
information about public transport at stops and stations is changing; rather than using the
information available at stops and stations passengers may be relying more on personal public
transport apps on their mobile phones. However, to better understand how information at stops
and stations influences overall satisfaction and loyalty further studies are needed.
Qualityoftransfers
Transferring between vehicles is often considered undesirable and a burden to public transport
users (Iseki & Taylor, 2009). Nevertheless, few studies survey passengers about their satisfaction
with transfer times or the ease of transferring between vehicles. However, when researchers have
asked about passengers’ transferring experiences, they usually highlight the importance of
planning for a smooth and seamless transfer between vehicles. For example, Tyrinopoulos and
Antoniou (2008) found that both transfer distance and waiting time influence overall satisfaction,
and several other European and American studies revealed that the ease of transferring relates to
overall satisfaction (Krizek & El-Geneidy, 2007; Susilo & Cats, 2014; Weinstein, 2000). In the
future, transport agencies and public transport researchers could incorporate detailed questions
about passengers’ transfer experiences in order to better understand which aspects of a transfer
are most strongly associated with overall satisfaction.
Customerservice
Customer service is an important aspect deriving customers’ overall satisfaction with public
transport. How a public transport user perceives his or her interaction with a public transport
agency’s bus drivers and personnel is an important indicator of overall satisfaction (Burkhardt,
2003; de Oña et al., 2013; Githui et al., 2010; Grujičić et al., 2014; Krizek & El-Geneidy, 2007;
Mouwen, 2015; Stuart et al., 2000; Tyrinopoulos & Antoniou, 2008; Weinstein, 2000). For
example, de Oña et al. (2013) found that the behaviour of the staff responsible for Granada,
Spain’s bus services was one of the main factors explaining passengers’ perceptions of overall

service quality. In addition, Carreira et al. (2014) found passengers’ perceptions of staff skills
influenced overall loyalty. Interestingly, passengers’ perceptions of the behaviours and attitudes
of drivers and personnel appear to be more strongly related to satisfaction than loyalty. This
might be because in many cases users do not interact with personnel on a regular basis, and
instead judge customer service based on an experience they had with a particular bus driver or
staff member. When a user perceives poor customer service, they are likely to become
unsatisfied, but might not become disloyal. However, the finding that users’ perceptions of staff
skills influence loyalty may be related to the fact that skills are often representative of road
safety, and if safety conditions are found to be poor, users might switch modes.
The way in which agencies deal with customer complaints is also associated with both
satisfaction and loyalty (Burkhardt, 2003; Lai & Chen, 2011). Some authors recognize the
importance of agencies’ abilities and willingness to deal with customer complaints in a
responsive and efficient matter as a contributor to overall satisfaction and loyalty. While
customer complaints are often perceived as a negative reflection of an agency’s services, it is
important to recognize that customer complaints can be used as a tool to improve overall
customer satisfaction. For example, in the context of South Korea and Taiwan, Chou and Kim
(2009), measured the impact of customer complaints on loyalty, and found that as passenger
complaints increased in Korea, loyalty decreased and that in Taiwan, passengers’ complaints
increased loyalty. Although Chou and Kim’s (2009) research was not included in either Table 2
or 3 because of its focus on high-speed rail, these findings are likely to be helpful for agencies
operating different modes as they suggest that in the Taiwanese context, complaints are handled
well, turning them into an asset for passenger loyalty. Other public transport agencies can learn
from the Taiwanese example by developing strategies that aim at using customer complaints as a
tool for improving customer satisfaction and loyalty.
Costs
For many users the cost of using public transport is a major determinant of their likeliness to be
satisfied with the system. For example, Tyrinopoulos and Antoniou (2008) demonstrate that it is
important for public transport agencies to offer a variety of tickets and passes with different price
structures to reflect the needs of the users. Furthermore, these authors also discuss the
importance of having a ticket selling network that is efficient and easy to use and is available at
various vending locations. In addition, Lai and Chen (2011) discussed the importance of

What Influences Satisfaction and Loyalty
23
distinguishing between actual and perceived travel costs, and their results demonstrated that it is
important for public transport agencies to distinguish between actual costs, users’ perceptions of
service value, and users’ understanding of public transport agency spending.
Customer satisfaction and loyalty are related to users’ perceptions of the costs associated
with public transport services (de Oña et al., 2013; Githui et al., 2010; Grujičić et al., 2014;
Mouwen, 2015; Stuart et al., 2000; Tyrinopoulos & Antoniou, 2008). For example, the variety of
tickets and passes (Githui et al., 2010; Tyrinopoulos & Antoniou, 2008) and the ticket selling
network of a transport agency is associated with how satisfied users are overall (Das et al., 2013;
Weinstein, 2000). Yet, while these factors are related to overall satisfaction, they do not clearly
influence user loyalty which is more strongly associated with users’ opinions about whether they
are receiving the service they believe they should be, given the amount of money they are
spending. For example, out of the eight loyalty papers included in Table 3, all – except for one
(Şimşekoğlu et al., 2015) – revealed the importance that users’ perceptions of value have on
loyalty. This likely has to do with the fact that for public transport users who also have access to
a car, and who are spending on the upkeep of a personal vehicle, public transport costs are often
viewed as an addition to their monthly transport costs.
Image
The concept of image is based on how passengers view public transport as contributing not only
to their own welfare, but to society at large. Having a positive image of public transport
influences customer satisfaction (Minser & Webb, 2010), but more importantly, it is strongly
associated with loyalty (Lai & Chen, 2011; Minser & Webb, 2010; Şimşekoğlu et al., 2015;
Zhao et al., 2014). The review of the literature has revealed that recent research has found that
passengers’ positive attitudes towards using public transport are a significant predictor of their
intention to use the mode and therefore also of their overall loyalty (Şimşekoğlu et al., 2015;
Zhao et al., 2014). In addition, positive attitudes towards using public transport also increase
passenger involvement and significantly affect behavioural intentions towards continuing to use
public transport in the future (Lai & Chen, 2011). Therefore, Lai and Chen (2011) suggested that
public transport agencies should focus on developing strategies that aim to motivate passengers
to strongly identify with public transport. Using strategies to motivate customers to develop a
positive connection with a product or service is a commonly discussed marketing strategy that
involves the development of schemes that influence potential customers to have an emotional

association with a product or service (Mahajan & Wind, 2002; Zaichkowsky, 1994). While these
types of strategies are common within the automobile industry (Sheller, 2004), they are not
frequently used to promote public transport, even though they are likely to increase loyalty to the
mode (Lai & Chen, 2011), and should be a focus of future studies.
Furthermore, when public transport agencies and transportation researchers survey users
about their satisfaction and loyalty, questions regarding passengers’ perceptions of the public
transport agency are rarely included. Similarly, customer satisfaction questionnaires seldom ask
respondents whether using public transport constitutes a part of their personal identity. However,
when customer satisfaction surveys do include questions about passengers’ image or
involvement with public transport, the results demonstrate that these concepts are exceptionally
important for increasing loyalty among public transport users. Moreover, other researchers have
suggested that passengers’ emotional feelings towards a mode are associated with their mode
choice (Shiftan, Barlach, & Shefer, 2015). Therefore, due to the finding that image or
involvement with public transport is associated with loyalty, public transport agencies should
focus on developing communication strategies that influence users’ emotional attachment to
public transport.
Conclusions
This review of the literature has revealed which service factors are frequently cited as increasing
satisfaction and loyalty among public transport bus and rail users. While there is evidence that
there is a large variety of service attributes influencing public transport users’ reported
satisfaction, the discussion above has highlighted which ones are most commonly discussed in
the literature. Accordingly, figure 1 illustrates which service factors are most associated with
satisfaction and loyalty by pictorially representing the relative importance of service attributes
that, according to the selected literature, contribute the most to increased overall satisfaction and
loyalty among public transport users. The figure includes only the service factors which were
deemed to be important in at least half of the papers assessed in this review of the literature
(present in ≥ 50% of the papers in Tables 2 and 3). Also, the larger the font size of a word, the
more frequently it occurs in the literature, meaning that the larger words appear in a higher
number of papers. The following section discusses how transport agencies can use these findings
to improve (1) passengers’ experiences, and (2) passengers’ perceptions of public transport.

What Influences Satisfaction and Loyalty
25
Fig. 1: Service factors to focus on for improving satisfaction (left), and loyalty (right)
PassengerExperience
Experiencing a high level of comfort has been found to increase overall satisfaction with public
transport. However, the context in which researchers assess this service attribute varies greatly
across studies; for example, while several authors highlight the importance of decreasing
crowding (Carreira et al., 2014; dell’Olio et al., 2011; Imaz et al., 2015), others focus on
developing comfortable seats (Das et al., 2013; Nwachukwu, 2014) desirable temperature and
airflow (dell’Olio et al., 2011; Grujičić et al., 2014), or good waiting conditions (Susilo & Cats,
2014; Tyrinopoulos & Antoniou, 2008). Yet, regardless of context, transport agencies must strive
to develop services that are clean, safe, and physically accessible to those who wish to use them.
Another aspect of comfort can be related to the customer experience that a public transport user
has with the driver and staff. For example, dell’Olio et al. (2011) suggests that to increase
passenger comfort, drivers are given a course on calm driving, and Burkhardt (2003) emphasized
the need for polite and courteous drivers who would exhibit good customer service by, for
example, calling out stops. Users who have a positive perception of personnel behaviour are
more likely to be satisfied overall (Grujičić et al., 2014). The results of these studies demonstrate
the need for public transport agencies to improve trip comfort in a multifaceted manner.
On time performance, frequency, and travel time have also been found to be associated
with overall satisfaction (de Oña et al., 2013; Figler et al., 2011; Tyrinopoulos & Antoniou,
2008). Krizek and El-Geneidy (2007) discuss specific interventions such as the use of swipe
cards in order to decrease travel times by speeding-up the boarding process. These authors also
suggest the use of next arrival systems in order to improve passengers’ perceptions about

punctuality. dell’Olio et al. (2011) similarly develop suggestions to improve passengers’
perceptions with regard to service quality by providing better information about schedules and
routes. Most interestingly, several authors have argued that the key to overall satisfaction is to
offer a personalized service where transport is closely geared to the individual user so that each
traveller can have his or her needs met for every specific trip (Burkhardt, 2003; Susilo & Cats,
2014). Personalizing users’ travel experiences with regard to mode, fare, and schedule will be
important for the future of public transport as it would present options for travellers to choose
which service features they prefer to maximize for a specific trip. With this in mind, agencies
should work to ensure that personalized travel does not motivate competition between public
transport modes, but instead maximizes the use of each mode based on the specific temporal and
utilitarian needs of each user.
Although factors that are related to the service delivery and on-board comfort appear to
be conceptually unrelated, operationally they are rather connected. For example, increasing
service frequency would likely lead to increased comfort as crowding would decrease. In
addition, passenger comfort would likely also be increased with shorter journey times and
improvements to driver and personnel behaviour. In addition, drivers might be able to provide
better customer service if their schedule increased their chances of being consistently punctual.
Users’ perceptions of the drivers might also improve if the names of stops were to be announced
electronically and payment did not involve interactions with the driver.
PassengerPerception
The above discussion has demonstrated that strategies which aim to improve overall satisfaction
directly target user experience. However, those implemented to increase loyalty aim to involve
users by improving their overall perceptions of different aspects of public transport services. For
example, rather than providing a discussion about actual value-for-money, Lai and Chen (2011)
claim that customers’ perceptions of value is important, and that it is the role of the public
transport agency to effectively communicate cost savings (compared to other modes) to their
users. In addition, to increase passenger loyalty, public transport agencies should communicate
the societal benefits of public transport as a public good to both users and potential users. Minser
and Webb (2010) further demonstrate this point by revealing that users who have a positive

What Influences Satisfaction and Loyalty
27
perception of service quality will also have a better public image of the system. These authors
make clear that a customer’s loyalty is not based on a singular positive trip experience, but rather
that loyalty, like trust, takes time. Minser and Webb (2010) also claim that loyalty is also not
only a result of consistent service delivery, but that loyalty is “the development and maintenance
of trust in the agency’s customer base.” This reveals that while satisfaction can be instant,
loyalty is developed over time. Accordingly, it is in the best interest of public transport agencies
to manage customer expectations by providing customers with the services that they expect to
receive.
For example, with regard to reliability, Tyrinopoulos and Antoniou (2008) comment that
the goal of public transport agencies should be to develop a service in which public transport
users perceive service frequency and trip time as being implicitly guaranteed. These authors
place a greater emphasis on increasing passenger perception of reliability rather than developing
goals based on frequency and travel time that do not involve the perception of the passenger.
Such a strategy is one way for an agency to communicate to its users that it can fulfil specific
travel needs. Furthermore, Lai and Chen (2011) recognize that it is important to develop
strategies that influence users to identify with using public transport. These authors suggest that
public transport agencies use advertisements and even celebrity endorsements as a way to
motivate passenger involvement with public transport. Similarly, Zhao et al. (2014) reminds
agencies of the importance of developing market-specific strategies for different populations of
public transport users. And finally, Şimşekoğlu et al. (2015) highlight the importance of
promoting the benefits of using public transport in general.
RecommendationsforFutureResearch
This review of the literature discussed the service factors that are most associated with overall
satisfaction and loyalty in urban public transport. Furthermore, the analysis has revealed that
whereas overall satisfaction is primarily related to travel experience, loyalty is a result of a
longer-term and trusting relationship between the user and the agency. While the majority of
studies focusing on understanding loyalty in public transport develop variables based on a user’s
intention to continue using public transport in the future as well as on his or her likeliness to
recommend it to others, future research may benefit from incorporating agency trust and an

assessment of the image and commitment to public transport that a user experiences. In addition,
future studies should aim to improve the understanding of what is not being measured, as
researchers are always limited to analysing only the questions that were included in the customer
satisfaction questionnaires. Although a debate exists about how loyalty should be defined, we
have attempted to highlight common threads and have elucidated that the concept of loyalty is
best defined based on a user’s intention to continue using the service, willingness to recommend
it to others, overall satisfaction, and most importantly, the user’s image of or involvement with
public transport. However, further research is needed to resolve the debate on how loyalty should
be defined in the context of public transport research. Future studies should also attempt to
quantify which service factors most influence satisfaction and loyalty in specific geographic and
cultural contexts in order to clarify to practitioners how to prioritize service improvements, and
similar research could be applied to intercity, long-distance, travel. Finally, because the results of
this review suggest that public transport users who have a positive image of the agency and
consider public transport an integral component of a city dweller’s daily life are more likely to
demonstrate loyalty, more research is needed to explore how user’s image of public transport
influences loyalty across modes, populations, and geographic regions.

29
References Allen, D., & Allen, D. (2004). Customer satisfaction research management: A comprehensive guide to
integrating customer loyalty and satisfaction metrics in the management of complex organizations: Asq Press.
Barlow, S., & Clark, H. (2006). Findings of customer surveys conducted for Sacramento Regional Transit. Bloemer, J., De Ruyter, K., & Peeters, P. (1998). Investigating drivers of bank loyalty: The complex
relationship between image, service quality and satisfaction. International Journal of Bank Marketing, 16(7), 276‐286.
Burkhardt, J. (2003). Critical measures of transit service quality in the eyes of older travelers. Transportation Research Record: Journal of the Transportation Research Board, 1835(1), 84‐92.
Carreira, R., Patrício, L., Natal, J., & Magee, C. (2014). Understanding the travel experience and its impact on attitudes, emotions and loyalty towards the transportation provider–A quantitative study with mid‐distance bus trips. Transport Policy, 31, 35‐46.
Chakrabarti, S., & Giuliano, G. (2015). Does service reliability determine transit patronage? Insights from the Los Angeles Metro bus system. Transport Policy, 42, 12‐20.
Chou, J., & Kim, C. (2009). A structural equation analysis of the QSL relationship with passenger riding experience on high speed rail: An empirical study of Taiwan and Korea. Expert Systems with Applications, 36(3), 6945‐6955.
Cox, T., Houdmont, J., & Griffiths, A. (2006). Rail passenger crowding, stress, health and safety in Britain. Transportation Research Part A: Policy and Practice, 40(3), 244‐258.
Das, A., Ladin, M., Ismail, A., & Rahmat, R. (2013). Consumers satisfaction of public transport monorail user in Kuala Lumpur Journal of Engineering Science and Technology, 8(3), 272‐283.
de Oña, J., de Oña, R., Eboli, L., & Mazzulla, G. (2013). Perceived service quality in bus transit service: A structural equation approach. Transport Policy, 29, 219‐226.
dell’Olio, L., Ibeas, A., & Cecín, P. (2011). The quality of service desired by public transport users. Transport Policy, 18(1), 217‐227.
Easterbrook, P., Gopalan, R., Berlin, J., & Matthews, D. (1991). Publication bias in clinical research. The Lancet, 337(8746), 867‐872.
Eboli, L., & Mazzulla, G. (2012). Structural equation modelling for analysing passengers’ perceptions about railway services. Procedia‐Social and Behavioral Sciences, 54, 96‐106.
Figler, S., Sriraj, P., Welch, E., & Yavuz, N. (2011). Customer Loyalty and Chicago, Illinois, Transit Authority Buses: Results from 2008 Customer Satisfaction Survey. Transportation Research Record: Journal of the Transportation Research Board(2216), 148‐156.
Fornell, C., Johnson, M., Anderson, E., Cha, J., & Bryant, B. (1996). The American customer satisfaction index: Nature, purpose, and findings. Journal of marketing, 60(4).
Friman, M., & Fellesson, M. (2009). Service supply and customer satisfaction in public transportation: The quality paradox. Journal of Public Transportation, 12(4), 57‐69.
Githui, J., Okamura, T., & Nakamura, F. (2010). The structure of users’ satisfaction on urban public transport service in developing country: The case of Nairobi. The Journal of the Eastern Asia Society for Transport Studies, 8.
Grimsrud, M., & El‐Geneidy, A. (2014). Transit to eternal youth: lifecycle and generational trends in Greater Montreal public transport mode share. Transportation, 41(1), 1‐19.
Grujičić, D., Ivanović, I., Jović, J., & Đorić, V. (2014). Customer perception of service quality in public transport. Transport, 29(3), 285‐295.

Hussein, A., & Hapsari, R. (2015). How quality, value and satisfaction create passenger loyalty: An empirical study on indonesia bus rapid transit passenger The International Journal of Accounting and Business Society, 22(2), 95‐115.
Imaz, A., Habib, K., Shalaby, A., & Idris, A. (2015). Investigating the factors affecting transit user loyalty. Public Transport, 7(1), 39‐60.
Iseki, H., & Taylor, B. (2009). Not all transfers are created equal: Towards a framework relating transfer connectivity to travel behaviour. Transport Reviews, 29(6), 777‐800.
Jacques, C., Manaugh, K., & El‐Geneidy, A. (2013). Rescuing the captive [mode] user: An alternative approach to transport market segmentation. Transportation, 40(3), 625‐645.
Kim, S., & Ulfarsson, G. (2012). Commitment to light rail transit patronage: Case study for St. Louis Metrolink. Journal of Urban Planning and Development, 138(3), 227‐234.
Krizek, K., & El‐Geneidy, A. (2007). Segmenting preferences and habits of transit users and non‐users. Journal of Public Transportation, 10(3), 71.
Lai, W., & Chen, C. (2011). Behavioral intentions of public transit passengers—The roles of service quality, perceived value, satisfaction and involvement. Transport Policy, 18(2), 318‐325.
Lee, J., Jin, B., & Ji, Y. (2009). Development of a Structural Equation Model for ride comfort of the Korean high‐speed railway. International Journal of Industrial Ergonomics, 39(1), 7‐14.
Mahajan, V., & Wind, Y. (2002). Got emotional product positioning? Marketing Management, 11(3), 36. Minser, J., & Webb, V. (2010). Quantifying the Benefits: Application of customer loyalty modeling in
public transportation context. Transportation Research Record: Journal of the Transportation Research Board, 2144(1), 111‐120.
Morfoulaki, M., Tyrinopoulos, Y., & Aifadopoulou, G. (2010). Estimation of satisfied customers in public transport systems: A new methodological approach. Paper presented at the Journal of the Transportation Research Forum.
Mouwen, A. (2015). Drivers of customer satisfaction with public transport services. Transportation Research Part A: Policy and Practice, 78, 1‐20.
Mouwen, A., & Rietveld, P. (2013). Does competitive tendering improve customer satisfaction with public transport? A case study for the Netherlands. Transportation Research Part A: Policy and Practice, 51, 29‐45.
Nwachukwu, A. (2014). Assessment of passenger satisfaction with intra‐city public bus transport services in Abuja, Nigeria. Journal of Public Transportation, 17(1).
Oliver, R. (1999). Whence consumer loyalty? the Journal of Marketing, 33‐44. Olsen, L., & Johnson, M. (2003). Service equity, satisfaction, and loyalty: From transaction‐specific to
cumulative evaluations. Journal of Service Research, 5(3), 184‐195. Pawson, R., Greenhalgh, T., Harvey, G., & Walshe, K. (2005). Realist review ‐ A new method of systematic
review designed for complex policy interventions. Journal of Health Services Research and Policy, 10(SUPPL. 1), 21‐34. Retrieved from http://www.scopus.com/inward/record.url?eid=2‐s2.0‐22244490024&partnerID=40&md5=1925cac76b69e346f3fc4d5550ae6188
Peden, M., Scurfield, R., Sleet, D., Mohan, D., Hyder, A., Jarawan, E., & Mathers, C. (2004). World report on road traffic injury prevention. World Health Organization, Geneva.
Perk, V., Flynn, J., & Volinski, J. (2008). Transit ridership, reliability and retention. Retrieved from Reichheld, F. (2003). The one number you need to grow. Harvard business review, 81(12), 46‐55. Rietveld, P., Bruinsma, F., & van Vuuren, D. (2001). Coping with unreliability in public transport chains: A
case study for Netherlands. Transportation Research Part A: Policy and Practice, 35(6), 539‐559. Rosenbloom, S. (2004). The mobility needs of older Americans. Taking the high road: A transportation
agenda of strengthening metropolitan areas, 227‐254. Sheller, M. (2004). Automotive emotions feeling the car. Theory, culture & society, 21(4‐5), 221‐242.

What Influences Satisfaction and Loyalty
31
Shiftan, Y., Barlach, Y., & Shefer, D. (2015). Measuring Passenger Loyalty to Public Transport Modes. Journal of Public Transportation, 18(1), 7.
Şimşekoğlu, Ö., Nordfjærn, T., & Rundmo, T. (2015). The role of attitudes, transport priorities, and car use habit for travel mode use and intentions to use public transportation in an urban Norwegian public. Transport Policy, 42, 113‐120.
Smith, M., & Clarke, R. (2000). Crime and public transport. Crime and Justice, 169‐233. Stuart, K., Mednick, M., & Bockman, J. (2000). Structural equation model of customer satisfaction for the
New York City subway system. Transportation Research Record: Journal of the Transportation Research Board, 1735(1), 133‐137.
Susilo, Y., & Cats, O. (2014). Exploring key determinants of travel satisfaction for multi‐modal trips by different traveler groups. Transportation Research Part A: Policy and Practice, 67, 366‐380.
Transportation Research Board. (1999). A Handbook for Measuring Customer Satisfaction and Service Quality (Vol. 47). Washington, DC: Transportation Research Board: United States Federal Transit Administration.
Transportation Research Board. (2002). A guidebook for developing a transit performance‐measurement systemTransit Cooperative Research Program (Vol. 88). Washington, DC: Transportation Research Board: United States Federal Transit Administration.
Tyrinopoulos, Y., & Antoniou, C. (2008). Public transit user satisfaction: Variability and policy implications. Transport Policy, 15(4), 260‐272.
van Lierop, D., & El‐Geneidy, A. (2016). Enjoying loyalty: The relationship between service quality, customer satisfaction, and behavioral intentions in public transit. Research in Transportation Economics, In Press.
van Lierop, D., & El‐Geneidy, A. (2017). Getting committed: A perspective on public transit market segmentation. Journal of Public Transportation, Volume 20.1.
Weinstein, A. (2000). Customer satisfaction among transit riders: How customers rank the relative importance of various service attributes. Transportation Research Record: Journal of the Transportation Research Board(1735), 123‐132.
Zaichkowsky, J. (1994). The personal involvement inventory: Reduction, revision, and application to advertising. Journal of advertising, 23(4), 59‐70.
Zhao, J., Webb, V., & Shah, P. (2014). Customer loyalty differences between captive and choice transit riders. Transportation Research Record: Journal of the Transportation Research Board(2415), 80‐88.


![Sl No. DISTRICTS Taluk Name WSD FPD SHOP NAME … FPD Distance.pdfkfcsc badami [61-61-rural] maruti yuvaka mandala hullikeri inam 20 kfcsc badami [62-62-rural] youth association mumaraddikoppa](https://static.fdocuments.us/doc/165x107/5e2988d3d1c7b30bbe44f734/sl-no-districts-taluk-name-wsd-fpd-shop-name-fpd-kfcsc-badami-61-61-rural-maruti.jpg)