FOR 373: Forest Inventory Techniques - University of Idaho
14
1 FOR 373: Forest Inventory Techniques Monitoring and Statistics Made Sensible? Reading Listen to your Customers (website) Elementary Forest Sampling • Pages 1-13 FOR 474: Forest Inventory Techniques Course Overview: • Principals of a Forest Inventory • What Can Monitoring Tell Us? • What Sampling Designs Should We Use? • How Do We Analyze Monitoring Data? • How Do We Monitor at Landscape Scales? • How Do We Monitor Forest Disturbances? • Why do we care about Standard Error? “The person ho knows HOW to do the work will always have a job … and the person who knows WHY … will be his boss.” Forest Inventory: Principals Accurate forest inventory data is necessary for good forest management and vice versa The lower the commercial value of a forest, the higher the cost to conduct an inventory Occums Razor: “Entities must not be multiplied beyond necessity” – the simplest techniques/solutions are often the best The simplest techniques are often the most abused New Zealand Forest Service (1998)
Transcript of FOR 373: Forest Inventory Techniques - University of Idaho
1
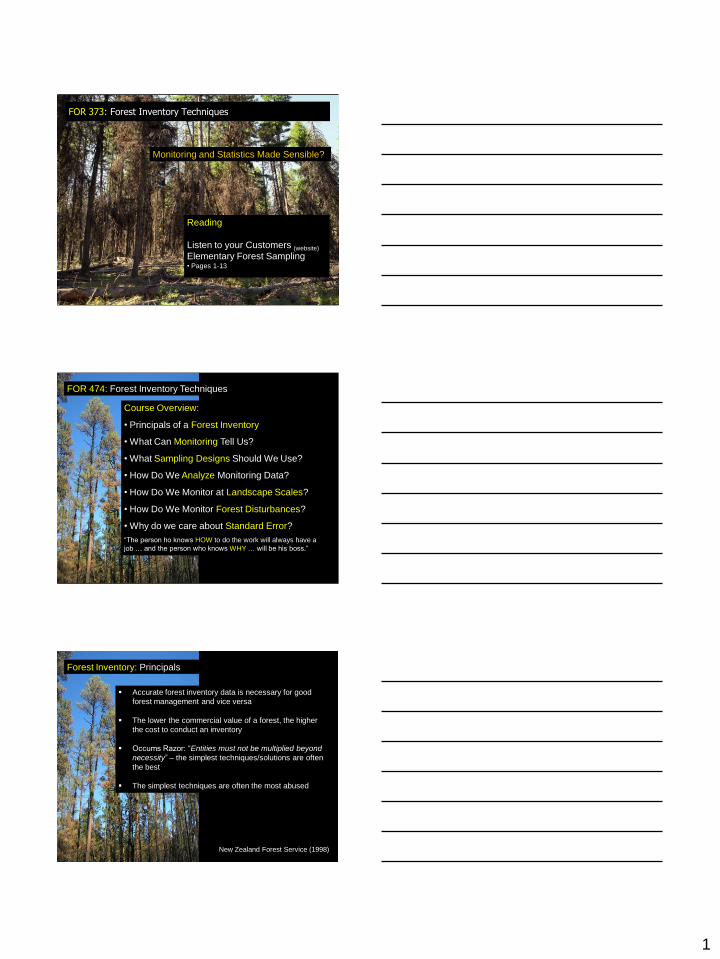
FOR 373: Forest Inventory Techniques
Monitoring and Statistics Made Sensible?
Reading
Listen to your Customers (website)
Elementary Forest Sampling • Pages 1-13
FOR 474: Forest Inventory Techniques
Course Overview:
• Principals of a Forest Inventory
• What Can Monitoring Tell Us?
• What Sampling Designs Should We Use?
• How Do We Analyze Monitoring Data?
• How Do We Monitor at Landscape Scales?
• How Do We Monitor Forest Disturbances?
• Why do we care about Standard Error?
“The person ho knows HOW to do the work will always have a
job … and the person who knows WHY … will be his boss.”
Forest Inventory: Principals
Accurate forest inventory data is necessary for good
forest management and vice versa
The lower the commercial value of a forest, the higher
the cost to conduct an inventory
Occums Razor: “Entities must not be multiplied beyond
necessity” – the simplest techniques/solutions are often
the best
The simplest techniques are often the most abused
New Zealand Forest Service (1998)

2
Forest Inventory: Principals
Forest Measurements deal with the measurement of
features (diameter, heights, etc) that make up a forest.
Forest Inventory is the process of measuring and analyzing
characteristics of a forest. This requires knowledge of why
particular forest metrics are measured and how they are
used to inform management.
Forest Inventories are often conducted to generate
defensible data for use in planning silvicultural treatments
or control of forest operations.
A plan is a systematic set of tasks that maximizes future
benefits, while control refers to actions that keep the plan
on track.
New Zealand Forest Service (1998)
Forest Inventory: Principals
Example: “A unit that currently only supplies firewood, might
be able to supply poles.”
Planning based on a forest inventory may lead to a
management rotation that harvests these poles, leading to
a financial gain for the landowner.
Control preserves these potential assets. This could include
thinning to ensure potential pole trees do not get
suppressed.
Planning and Control must be based on quantitative data!
New Zealand Forest Service (1998)
Forest Inventory: Don’t Forget the Costs
The costs of performing an inventory must be weighed
against the potential financial gain from the plan.
A $10k inventory is not worth the cost for $10k of pulp …!
Make use of any Prior Information, whether past cruises,
soil surveys, or remote sensing / GIS data.
Consider the cost of access & the cost of measurement. If
access $/measurement $ is high, then extra measurements
will get you a higher return on your costs.
Gain of the inventory is a function of the purpose, the
precision required, and the measurement cost.
New Zealand Forest Service (1998)
3
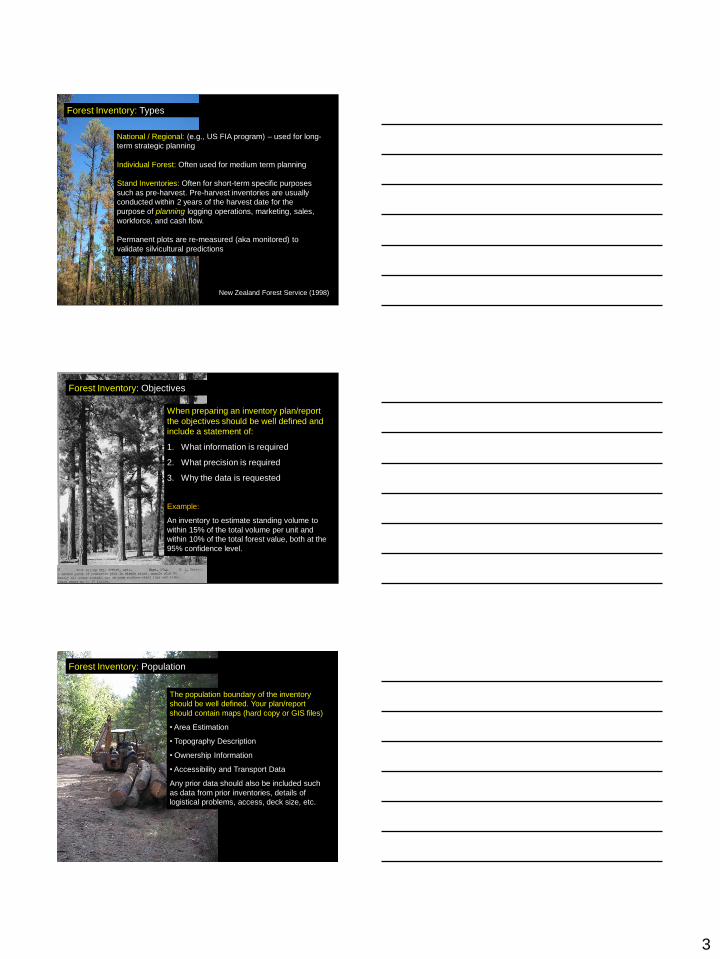
Forest Inventory: Types
National / Regional: (e.g., US FIA program) – used for long-
term strategic planning
Individual Forest: Often used for medium term planning
Stand Inventories: Often for short-term specific purposes
such as pre-harvest. Pre-harvest inventories are usually
conducted within 2 years of the harvest date for the
purpose of planning logging operations, marketing, sales,
workforce, and cash flow.
Permanent plots are re-measured (aka monitored) to
validate silvicultural predictions
New Zealand Forest Service (1998)
Forest Inventory: Objectives
When preparing an inventory plan/report
the objectives should be well defined and
include a statement of:
1. What information is required
2. What precision is required
3. Why the data is requested
Example:
An inventory to estimate standing volume to
within 15% of the total volume per unit and
within 10% of the total forest value, both at the
95% confidence level.
Forest Inventory: Population
The population boundary of the inventory
should be well defined. Your plan/report
should contain maps (hard copy or GIS files)
• Area Estimation
• Topography Description
• Ownership Information
• Accessibility and Transport Data
Any prior data should also be included such
as data from prior inventories, details of
logistical problems, access, deck size, etc.

4
Forest Inventory: The Need for Pilot Inventories
Uses of a pilot inventory (or study):
-To obtain preliminary data necessary to
properly design full inventories (SRS lecture)
- To test an untried technique or treatment on a
small scale
- Assessment of logistical issues (access) such
as topography, understorey, visibility issues, etc
- Initial assessment of stem and basal area
densities for potential strata (Stratified lectures)
- Definition of stand or unit boundaries
Pilot studies can be conducted using aerial
photography, SRS, quick field methods such as
using prisms
Field Sheets: The Usual Suspects
OVERSTORY TREE DATA, UNDERSTORY TREE DATA, SITE INDEX University of Idaho Experimental Forest: Fuels Monitoring Program
Unit Elevation Crown class code
Plot center coordinates
Stand Date Dominant D
Plot # Collectors Co-dominant C x
Habitat type Slope placement
bottom, low, mid, upper,
ridge
Intermediate I y
Aspect Fuel Model
Suppressed S Overstory 1/10ac = 37.2ft radius
% slope
Understory 1/100ac = 11.8ft radius
OVERSTORY UNDERSTORY
Tree #
Species
code DBH (in)
Total height
(ft)
Crown base
height (ft) Crown class code
live (L) dead
(D)
Damage
Code Notes Species code Count Mean height (ft)
1
0-1
.9" d
bh
2
3
4
5
6
7
8
9
2.0
- 3.9
" dbh
10
11
12
13
14
15
16
(A) Site Info
(B) Vegetation Info
(C) Note Space
Monitoring: Why and What Can it Tell Us?
Definition: The process through which repeated observations and
analyses can evaluate the condition of an object

5
Monitoring: Why and What Can it Tell Us?
Adaptive Management: The process where activities are implemented
(with uncertainty in their effectiveness), the response of these activities are
monitored and analyzed, and the results drive future decisions.
Nyberg (1998)
Terry Spivey, USDA Forest Service,
www.forestryimages.org
Monitoring: Why and What Can it Tell Us?
Adaptive Management: The process where activities are implemented
(with uncertainty in their effectiveness), the response of the activities are
monitored and analyzed, and the results drive future decisions.
Nyberg (1998)
Terry Spivey, USDA Forest Service,
www.forestryimages.org
Develop model
of species of
system
Implement
Management
Sample &
Monitor
Resource
Objective
Achieved?
Adapt
Management
Elzinga Chapter 1
Monitoring: What Can Monitoring Tell us?
Inventories: Only provide a snap-shot of how much is present
Monitoring: Allows the measurement and analysis of “rates of change”
AND how that information impacts the management objective
• Mortality => Volume of trees initially
measured that died and not utilized
• Ingrowth => Volume of trees grown after
start of the growth period (e.g., seedlings)
• Gross Growth => change in total volume of a
stand (including mortality)
• Net Growth => excluding mortality
• Productivity = Net Growth + Ingrowth Rate
Age
Height
Age

6
Monitoring: Common Sampling Challenges
Lecture 7
Forestry 3218
Technical Problems:
- Poor sampling designs lead to inconclusive results
- Poor training of observers or differences in
measurements across observers (bias)
- Data entry errors or poor recording practices, poor
long-term data storage
- Data analyzed by third parties
- Natural changes in the resource obscures potential
change due to treatment
Elzinga Chapter 1
Monitoring: Why and What Can it Tell Us?
The Operational Monitoring and Research Continuum
Elzinga Chapter 1
Monitoring: An Example of an Adaptive Management Process
Background Tasks:
• Compile existing data (maps, data)
• Review management and NEPA docs
• Identify key species / populations
• Evaluate available resources
• Determine Scale
• Determine monitoring intensity
• Review and brief management
Elzinga Chapter 2
7
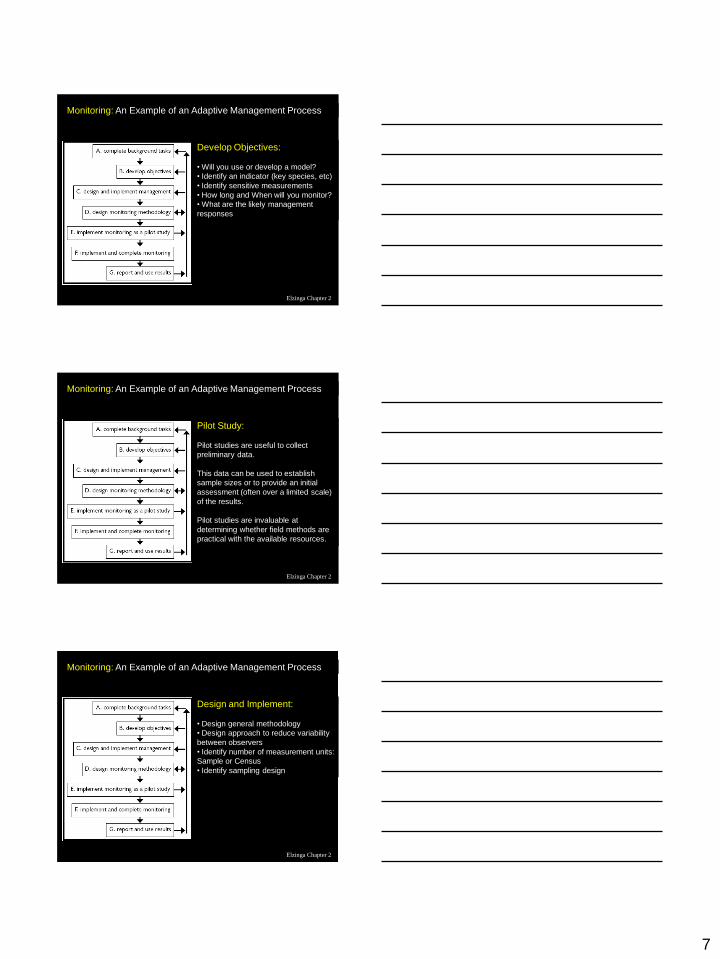
Monitoring: An Example of an Adaptive Management Process
Develop Objectives:
• Will you use or develop a model?
• Identify an indicator (key species, etc)
• Identify sensitive measurements
• How long and When will you monitor?
• What are the likely management
responses
Elzinga Chapter 2
Monitoring: An Example of an Adaptive Management Process
Pilot Study:
Pilot studies are useful to collect
preliminary data.
This data can be used to establish
sample sizes or to provide an initial
assessment (often over a limited scale)
of the results.
Pilot studies are invaluable at
determining whether field methods are
practical with the available resources.
Elzinga Chapter 2
Monitoring: An Example of an Adaptive Management Process
Design and Implement:
• Design general methodology
• Design approach to reduce variability
between observers
• Identify number of measurement units:
Sample or Census
• Identify sampling design
Elzinga Chapter 2

8
Sampling Design: Representative Measures
When dealing with vast amounts of data we
often seek to reduce all the data down to a
single representative number.
We call these numbers or metrics averages
or measures of central tendency.
As with the different sampling methods,
these measures are only appropriate in
certain cases.
Johnson
Sampling Design: Representative Measures
Given the wide variety of metrics that can be
used, the metrics should exhibit the following
criteria (Waugh, 1952):
1. Robust to repeatable observations; i.e.
calculating the metric multiple times should
produce the same result
2. Easy to understand and interpret
3. Should make use of all, or at least the main
trends of all the data, in the distribution
4. Should not be unduly influenced by single
outliers or so called rogue-values
5. Statistically stable (value for group of samples
reasonably similar to value of another group)
Johnson
Sampling Design: Representative Measures
There are several ways that we can
describe the most common occurrences of
data. The different measures you will come
across include:
1. The Arithmetic Mean
2. The Median
3. The Mode
4. The Quadratic Mean
5. The Geometric Mean

9
Sampling Design: The Arithmetic Mean
This is the most commonly used and is
also called the mean or average.
=AVERAGE(B3:B12) = 8.6
N
yN
i
i 1
n
y
x
n
i
i 1
Population:
Sample:
Sampling Design: The Arithmetic Mean
Weighted Mean
When dealing with per unit area data collected in stands of
variable area we need to use a weighted mean
n
i
i
n
i
ii
w
A
yA
y
1
1
Sampling Design: The Arithmetic Mean
The mean of both your X and Y data should produce a X-Y
coordinate that is a real value on the function fitted to your data
10
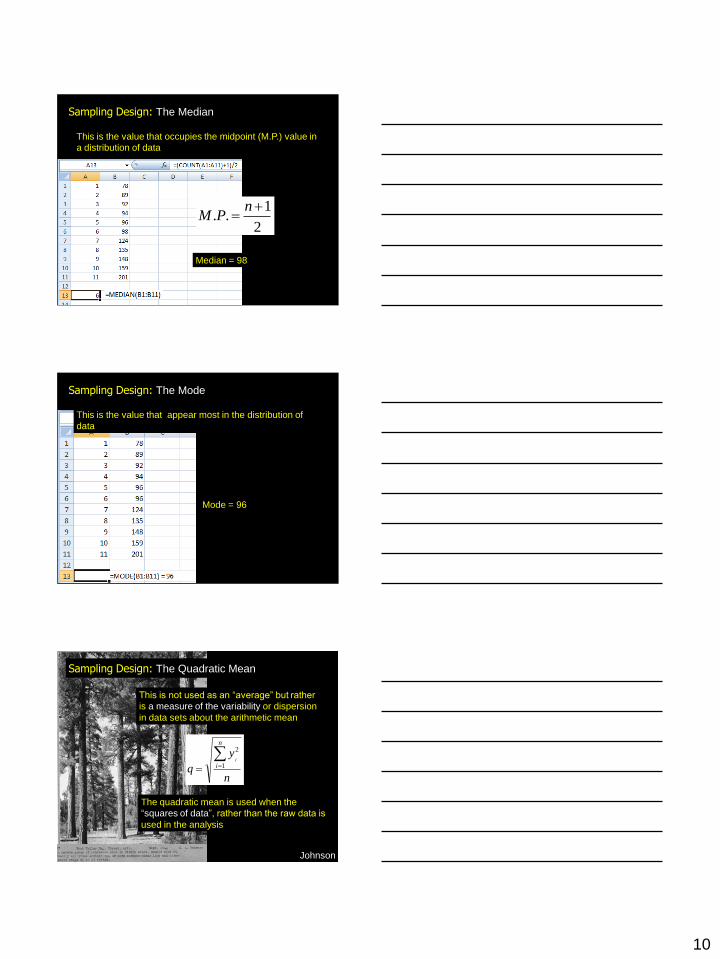
Sampling Design: The Median
This is the value that occupies the midpoint (M.P.) value in
a distribution of data
2
1..
nPM
Median = 98
Sampling Design: The Mode
This is the value that appear most in the distribution of
data
Mode = 96
Sampling Design: The Quadratic Mean
This is not used as an “average” but rather
is a measure of the variability or dispersion
in data sets about the arithmetic mean
Johnson
n
y
q
n
ii
1
2
The quadratic mean is used when the
“squares of data”, rather than the raw data is
used in the analysis

11
Sampling Design: The Quadratic Mean
A common example where we use the
Quadratic Mean is the standard deviation
and the Quadratic Mean Diameter (QMD):
QMD is used to calculate the diameter of the
tree with the average basal area
The quadratic mean is justified as we use
Basal Area and not the raw DBH values:
Basal Area = 0.005454 * DBH2
Johnson
Sampling Design: The Geometric Mean
nn
n
i
i yyyyyg1
321
1
)*...***(
The geometric mean is used when the values of the distribution
approximate those of a geometric series:
Sampling Design: Geometric Mean for Tree Growth
Assessing average PIPO growth (e.g., DBH) in a stand over
a period of 60 years may look like this:
Note: The Geometric Mean is always smaller than both the
Arithmetic Mean or the Quadratic Mean

12
Measures of Dispersion
Measures of Dispersion define the amount
by which individual data points vary from the
Measures of Central Tendency.
The term variation describes the differences
that exist in data that make up a population.
Common measures include the Variance,
the Standard Deviation, the Coefficient of
Variation, the Covariance, and the Standard
Error of the Mean.
Variance and Standard Deviation:
Coefficient of Variation:
Standard Error of the Mean:
Covariance:
Why we care about Variability?
• The amount of variability influences our confidence in
management decisions
• Can we defend/justify our decision
• Potentially large financial implications
Where is this all headed?

13
Why we care about Variability?
What if we wanted to know the maximum potential profit
from a harvest operation?
What must we consider?
• Mean and variability of volume
• Composition of merchantable material (species
mixture)
• Value of individual material (price for species)
• Harvest and delivery cost
What if?

14
Without accounting for SE $510,336