Energy Optimization and Reduction of Carbon Footprint in Cement Manufacturing_final_rev

Footprint 2020 Expansion and optimization approaches for US manufacturers
The expansion vs. optimization balancing act
A seismic shift in manufacturing location trends has occurred over the past 20 years as manufacturers sought to take advantage of labor arbitrage opportunities and gain access to raw materials, while accommodating an increasingly more global customer base. The growing global economy has enabled manufacturers to open new markets while surfacing opportunities to increase shareholder value through improved margins, reduced operating costs, shorter supply chains, and refinement of global tax structures.
However, balancing these potential advantages with challenges, such as protectionist tariffs, the inherent risks of expanding into new operating environments in which companies have limited experience, and a dynamic manufacturing environment can be challenging. As the global manufacturing environment evolves, the value proposition of each country changes as well. For example, what was once a cost play evolves into a market play or an opportunity to access talent for Research & Development, as has been the case with China.
The next shift in manufacturing locations is imminent. To prepare, it is important to consider forward looking footprint strategies that examine realignment trends and offer expansion and optimization perspectives. To that end, Deloitte collaborated with the Manufacturers Alliance for Productivity and Innovation (MAPI) to conduct the Global Manufacturing Footprint 2020 study. The study asks companies which geographies they plan to invest in next and which levers do the intended countries pull in terms of increasing shareholder value. The objectives of the study are to understand trends driving global manufacturing footprint strategy shifts and to identify the next generation of locations manufacturers are considering as markets and strategic imperatives evolve.
However, single location expansion cannot be considered in isolation. The delivery of products and services to the global portfolio of customers and value to shareholders must be managed. Manufacturers can better position themselves for success by viewing their growth and expansion decisions as a dynamic fluid strategy, encompassing their entire footprint. Maintaining a proactive stance on managing the global footprint using cyclical planning can help manufacturers ensure their assets are aligned to changing market and manufacturing conditions and can avoid issues associated with business as usual approaches that result in severe misalignment.
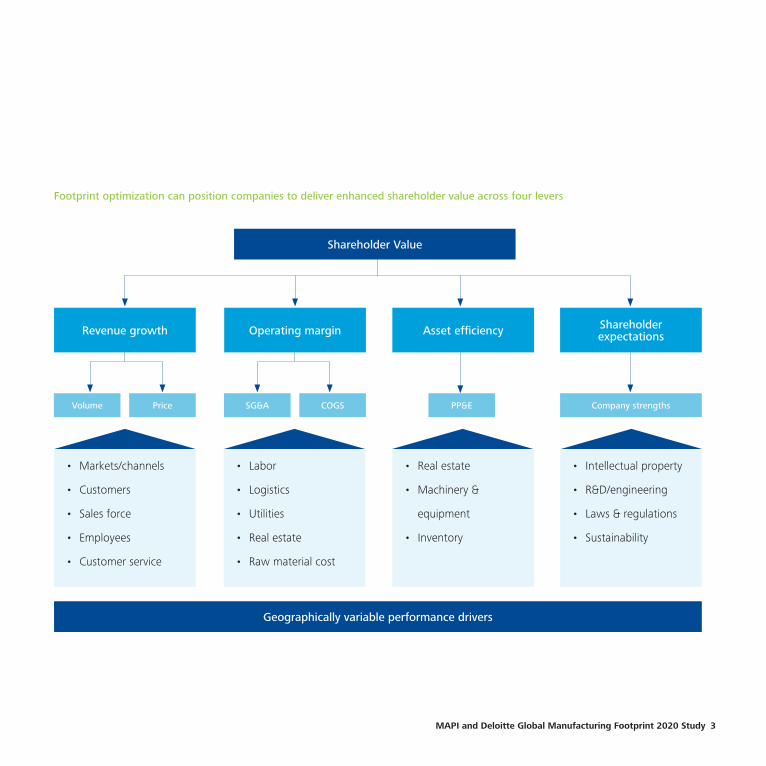
Revenue growth Operating margin
Geographically variable performance drivers
Volume SG&A PP&E Company strengthsPrice COGS
Asset efficiency Shareholder expectations
• Intellectual property
• R&D/engineering
• Laws & regulations
• Sustainability
• Real estate
• Machinery &
equipment
• Inventory
• Labor
• Logistics
• Utilities
• Real estate
• Raw material cost
• Markets/channels
• Customers
• Sales force
• Employees
• Customer service
Shareholder Value
MAPI and Deloitte Global Manufacturing Footprint 2020 Study 3
Footprint optimization can position companies to deliver enhanced shareholder value across four levers

MAPI and Deloitte Global Manufacturing Footprint 2020 Study 5
Contents
Keeping pace with the complex global manufacturing environment 6
What factors are driving investment? 8
Where is next? 10
Marrying expansion with optimization considerations 14
Effective investment strategies 18
The path forward 24
Methodology 26
6
Keeping pace with the complex global manufacturing environment
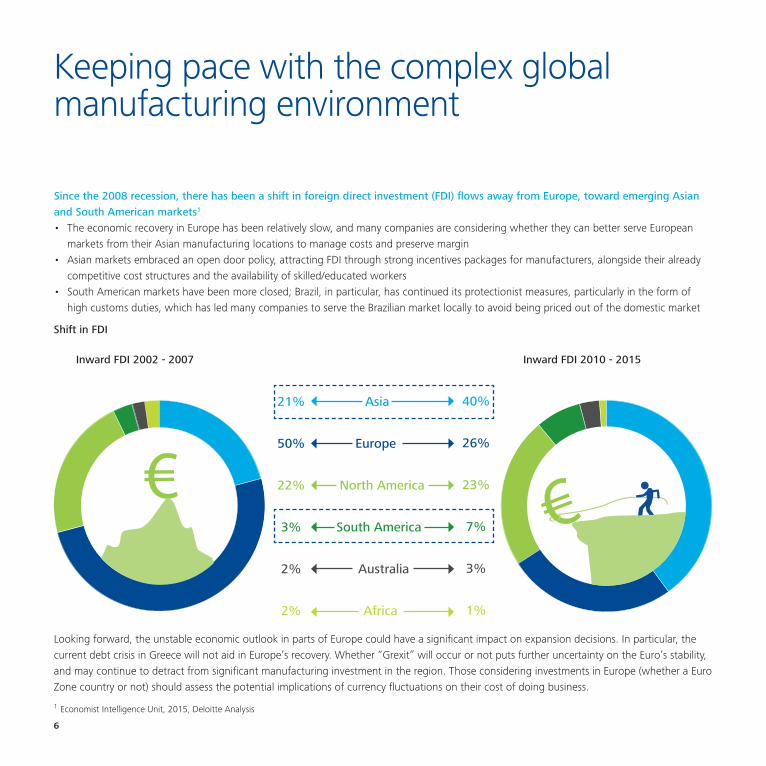
Since the 2008 recession, there has been a shift in foreign direct investment (FDI) flows away from Europe, toward emerging Asian and South American markets1 • The economic recovery in Europe has been relatively slow, and many companies are considering whether they can better serve European
markets from their Asian manufacturing locations to manage costs and preserve margin• Asian markets embraced an open door policy, attracting FDI through strong incentives packages for manufacturers, alongside their already
competitive cost structures and the availability of skilled/educated workers• South American markets have been more closed; Brazil, in particular, has continued its protectionist measures, particularly in the form of
high customs duties, which has led many companies to serve the Brazilian market locally to avoid being priced out of the domestic market
Looking forward, the unstable economic outlook in parts of Europe could have a significant impact on expansion decisions. In particular, the current debt crisis in Greece will not aid in Europe’s recovery. Whether “Grexit” will occur or not puts further uncertainty on the Euro’s stability, and may continue to detract from significant manufacturing investment in the region. Those considering investments in Europe (whether a Euro Zone country or not) should assess the potential implications of currency fluctuations on their cost of doing business.
Inward FDI 2002 - 2007
Shift in FDI
Inward FDI 2010 - 2015
Asia
Europe
North America
South America
Australia
Africa
21%
50%
22%
3%
2%
2%
40%
26%
23%
7%
3%
1%
1 Economist Intelligence Unit, 2015, Deloitte Analysis
MAPI and Deloitte Global Manufacturing Footprint 2020 Study 7
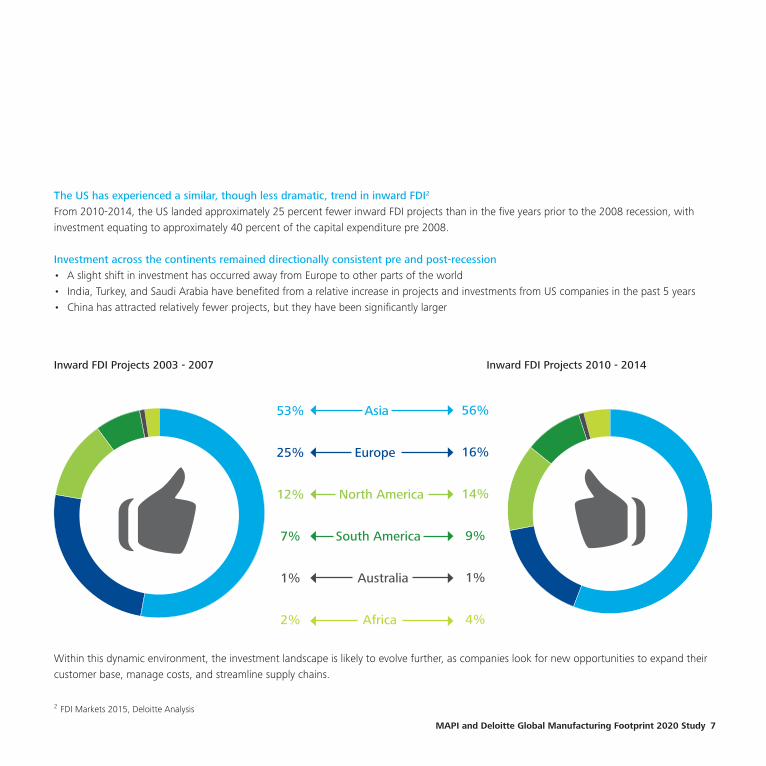
The US has experienced a similar, though less dramatic, trend in inward FDI2
From 2010-2014, the US landed approximately 25 percent fewer inward FDI projects than in the five years prior to the 2008 recession, with investment equating to approximately 40 percent of the capital expenditure pre 2008.
Investment across the continents remained directionally consistent pre and post-recession • A slight shift in investment has occurred away from Europe to other parts of the world• India, Turkey, and Saudi Arabia have benefited from a relative increase in projects and investments from US companies in the past 5 years• China has attracted relatively fewer projects, but they have been significantly larger
Within this dynamic environment, the investment landscape is likely to evolve further, as companies look for new opportunities to expand their customer base, manage costs, and streamline supply chains.
Inward FDI Projects 2003 - 2007 Inward FDI Projects 2010 - 2014
Asia
Europe
North America
South America
Australia
Africa
53%
25%
12%
7%
1%
2%
56%
16%
14%
9%
1%
4%
2 FDI Markets 2015, Deloitte Analysis

8
What factors are driving investments?
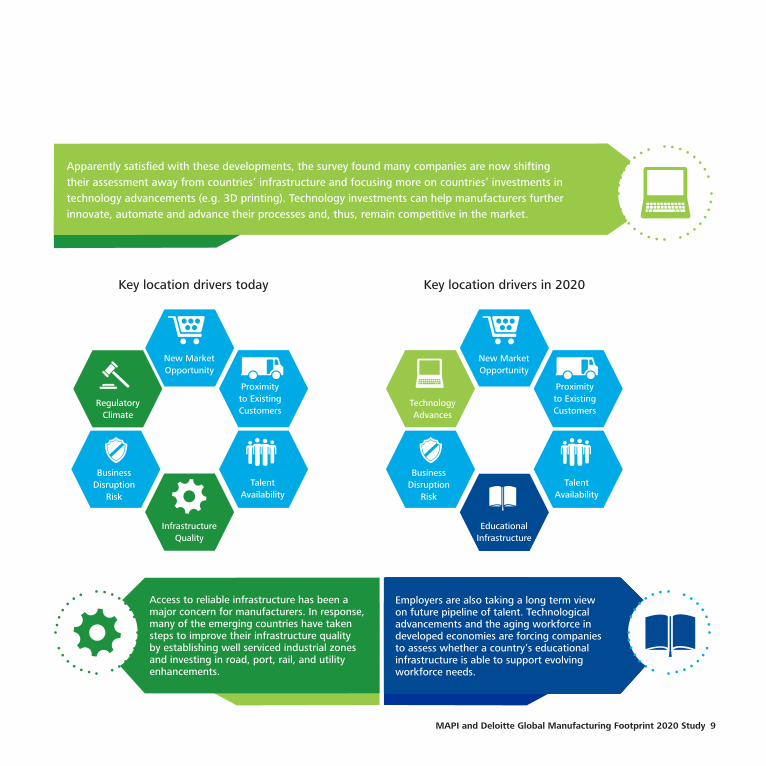
Today: Manufacturing executives responding to the survey indicate market opportunities, the search for talent, and business disruption concerns top their priority list when determining where to set up or expand their facilities. In 2020: Executives responding to the survey anticipate a shift in these primary location drivers. They project the need to establish their operations in locations that can support and provide access to the latest technological advances. In addition, they are more aware of the importance of a strong talent pipeline, as measured by investment in the local educational infrastructure.
MAPI and Deloitte Global Manufacturing Footprint 2020 Study 9
Apparently satisfied with these developments, the survey found many companies are now shifting their assessment away from countries’ infrastructure and focusing more on countries’ investments in technology advancements (e.g. 3D printing). Technology investments can help manufacturers further innovate, automate and advance their processes and, thus, remain competitive in the market.
Access to reliable infrastructure has been a major concern for manufacturers. In response, many of the emerging countries have taken steps to improve their infrastructure quality by establishing well serviced industrial zones and investing in road, port, rail, and utility enhancements.
Employers are also taking a long term view on future pipeline of talent. Technological advancements and the aging workforce in developed economies are forcing companies to assess whether a country’s educational infrastructure is able to support evolving workforce needs.
Key location drivers today Key location drivers in 2020
New Market Opportunity
New Market Opportunity
Proximity to Existing Customers
Proximity to Existing Customers
Talent Availability
Talent Availability
Business Disruption
Risk
Business Disruption
Risk
Regulatory Climate
Technology Advances
Infrastructure Quality
Educational Infrastructure

10
Where is next?
Due to the shifting priorities, and the evolving global manufacturing landscape, two complementary trends emerge: new locations are emerging as targets for investment, while manufacturers continue to invest in countries with existing operations.
According to the Global Manufacturing Footprint study findings, over 50 percent of respondents plan to enter new markets by 2020. Continuing the trend since 2008, investments outside of companies’ existing footprint are dominated by countries in Asia and South America. While some respondents appear to lag entry into Brazil, China and India, interesting entry targets include South Africa, Turkey and Vietnam, all of which have experienced a boom in the middle class and thus spending power.
Number of Companies Looking to Enter New Markets
Saudi Arabia
Russia
Poland
Vietnam
Turkey
Mexico
South Africa
India
China
Brazil 7
7
7
4
6
5
4
4
3
2
2

CzechRepublic
Italy
Poland
UnitedKingdom
Germany
Brazil
India
Mexico
US
China 24
24
14
8
7
4
3
4
4
3
3
3
2
2
5 2 2
5 4 5
5 3 6
5 7 3
9 9 8
16 17 2
23 20 22
30 21 16
Additionally, 98 percent of companies surveyed plan to either expand existing sites, or open new facilities, in countries with existing operations. This trend is true for virtually all types of facilities, from production to assembly to R&D. China and the US are anticipated to receive the highest number of existing country expansions.
Number of investments by 2020 in countries where companies have existing manufacturing presence
Number of investments identified by survey respondents
Primary Production
Secondary Production
Assembly & Packaging
Research & Development

12
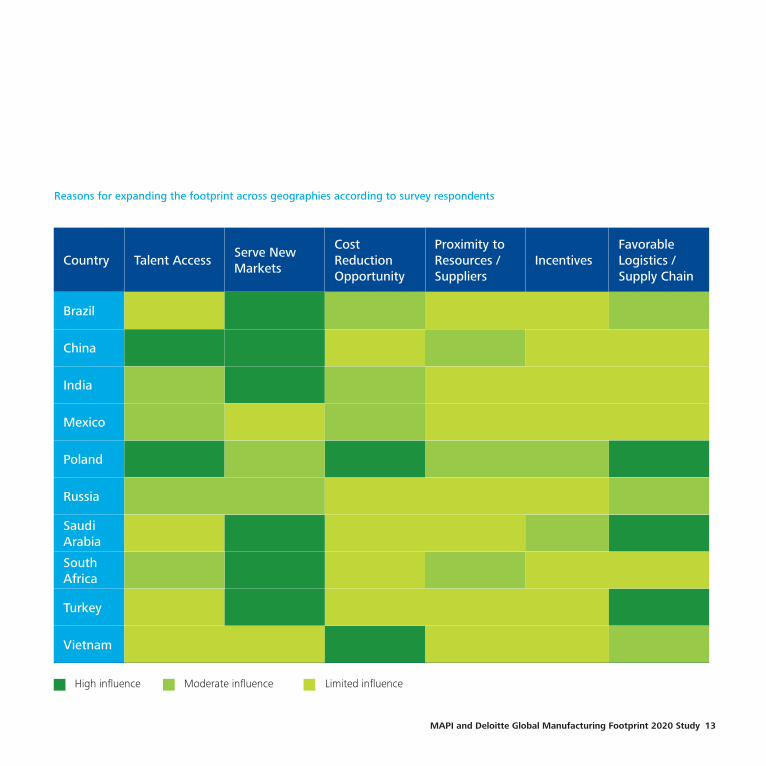
What is driving investment?For the top 10 countries identified by survey respondents as targets for future investment, the main focus for companies is to serve new markets, not only because of the size of the consumer base (e.g., Brazil, China, India), but also because countries, such as Brazil, have imposed barriers that make it cost prohibitive for companies to serve those markets from the outside.
China entrants appear to be drawn to availability of talent, growing market opportunities and favorable logistics, instead of traditional cost reduction opportunities.
Brazil, Turkey, and South African investments are primarily due to sizable local markets with growing middle class.
Poland offers investors a favorable physical location (supply chain) moderate cost structure relative to the rest of Europe, and access to high quality technical talent.
MAPI and Deloitte Global Manufacturing Footprint 2020 Study 13
Reasons for expanding the footprint across geographies according to survey respondents
Country Talent AccessServe New Markets
Cost Reduction Opportunity
Proximity to Resources / Suppliers
IncentivesFavorable Logistics / Supply Chain
Brazil
China
India
Mexico
Poland
Russia
Saudi Arabia
South Africa
Turkey
Vietnam
High influence Moderate influence Limited influence
14
Marrying expansion with optimization considerations
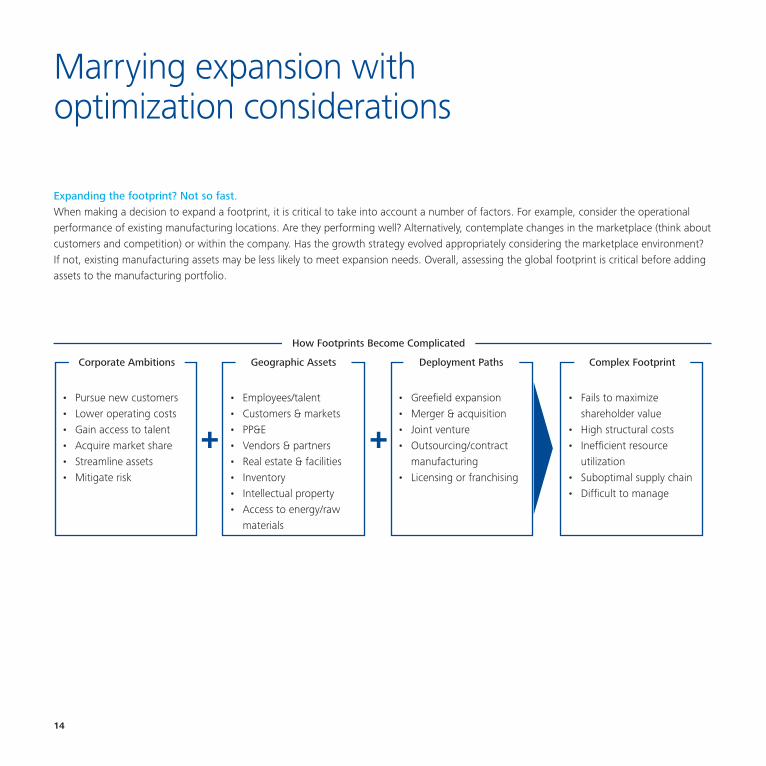
Expanding the footprint? Not so fast.When making a decision to expand a footprint, it is critical to take into account a number of factors. For example, consider the operational performance of existing manufacturing locations. Are they performing well? Alternatively, contemplate changes in the marketplace (think about customers and competition) or within the company. Has the growth strategy evolved appropriately considering the marketplace environment? If not, existing manufacturing assets may be less likely to meet expansion needs. Overall, assessing the global footprint is critical before adding assets to the manufacturing portfolio.
• Pursue new customers• Lower operating costs• Gain access to talent• Acquire market share• Streamline assets• Mitigate risk
• Employees/talent• Customers & markets• PP&E• Vendors & partners• Real estate & facilities• Inventory• Intellectual property• Access to energy/raw
materials
• Fails to maximize shareholder value
• High structural costs• Inefficient resource
utilization• Suboptimal supply chain• Difficult to manage
• Greefield expansion• Merger & acquisition• Joint venture• Outsourcing/contract
manufacturing• Licensing or franchising
Corporate Ambitions Geographic Assets Deployment Paths Complex Footprint
How Footprints Become Complicated
+ +

MAPI and Deloitte Global Manufacturing Footprint 2020 Study 15
In recent decades, many manufacturers expanded rapidly and deployed geographic assets in pursuit of singular objectives – to either increase revenues, or reduce costs, mitigate risk, gain access to talent. This linear deployment, combined with rapidly changing economic conditions, can put many manufacturers at risk of having a misaligned footprint – a situation that exacerbates the challenges posed by the dynamic global climate.
Furthermore, evolving market trends are often overlooked, causing inefficient and misaligned manufacturing footprints. Some of these current trends include:• Market Opportunities: The developing Asian countries are now becoming major markets for manufacturers.3 As such, manufacturers need
to understand local market preferences and their ability to serve these markets when competing with well-known, cost competitive local manufacturers.
• Search for Talent: With a push to increase production automation, manufacturers need to focus their talent search on technicians who can operate and maintain advanced manufacturing equipment.
• Business Disruption Risk: Recent natural disasters in southeast Asia have created a pressing need for manufacturers to assess redundancies needed to have in place for inventory, supply chain, and manufacturing locations to hedge against business disruption.
Why does optimization need to go hand-in-hand with expansion?The enterprise footprint is a key driver of corporate performance. When the footprint is optimized, a manufacturer can strike the right balance between lowering operating costs, generating new revenue, and attracting and retaining talent. In an optimized footprint state, corporate strategies and market realities are better aligned with geographic variables, which can better position the company to deliver enhanced shareholder value.
3 Deloitte analysis
16
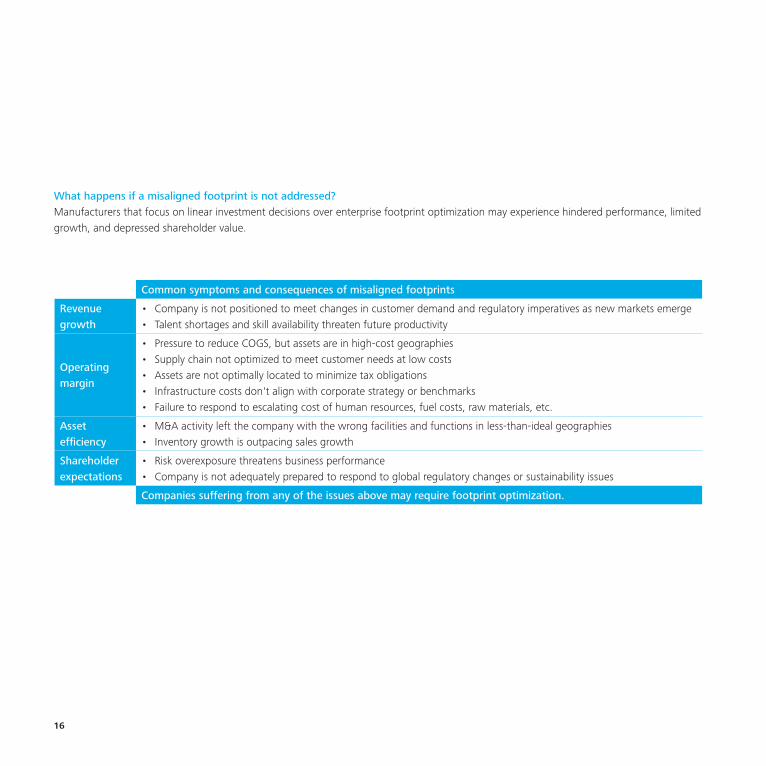
What happens if a misaligned footprint is not addressed?Manufacturers that focus on linear investment decisions over enterprise footprint optimization may experience hindered performance, limited growth, and depressed shareholder value.
Common symptoms and consequences of misaligned footprints
Revenue growth
• Company is not positioned to meet changes in customer demand and regulatory imperatives as new markets emerge• Talent shortages and skill availability threaten future productivity
Operating margin
• Pressure to reduce COGS, but assets are in high-cost geographies • Supply chain not optimized to meet customer needs at low costs• Assets are not optimally located to minimize tax obligations• Infrastructure costs don't align with corporate strategy or benchmarks• Failure to respond to escalating cost of human resources, fuel costs, raw materials, etc.
Asset efficiency
• M&A activity left the company with the wrong facilities and functions in less-than-ideal geographies• Inventory growth is outpacing sales growth
Shareholderexpectations
• Risk overexposure threatens business performance• Company is not adequately prepared to respond to global regulatory changes or sustainability issues
Companies suffering from any of the issues above may require footprint optimization.

MAPI and Deloitte Global Manufacturing Footprint 2020 Study 17
Optimizing a manufacturer’s footprint can yield benefitsWhile optimization of the enterprise footprint takes more effort due to the continuous monitoring required to ensure assets are in the right place at the right time, there are significant benefits to be had. Typically, manufacturers can experience significant savings when they make a concerted effort to engage in footprint optimization.
• Reduced lead times• Improved service• Reduced logistics cost
7-10%
Supply chain / logistics
Supp
liers
Custom
ers
Outbound to Distributers and
Customers
Transfers
Inbound from Suppliers
Inbound and Outbound Freight
• Reduced turnover• Realigned culture• Reduced labor cost
10-20%
Labor
Labor-Management Relations
Productivity
Benefits
Wages
• Right-sized footprint• Ready for expansion• Right operations in the
right locations• Reduced operations
15-20%
Facilities / real estate
Cost
Support Infrastructure
Capacity
Suitability
• Reduced tax exposure• Maximized incentives
opportunities
10-20%
Taxes and incentives
Incentives
Property Tax
Customs/Duties
Corporate Income Tax
The manufacturing footprint
Typical Focus Areas-Footprint Optimization
Typical Improvements-Footprint Optimization
Typical Savings
18
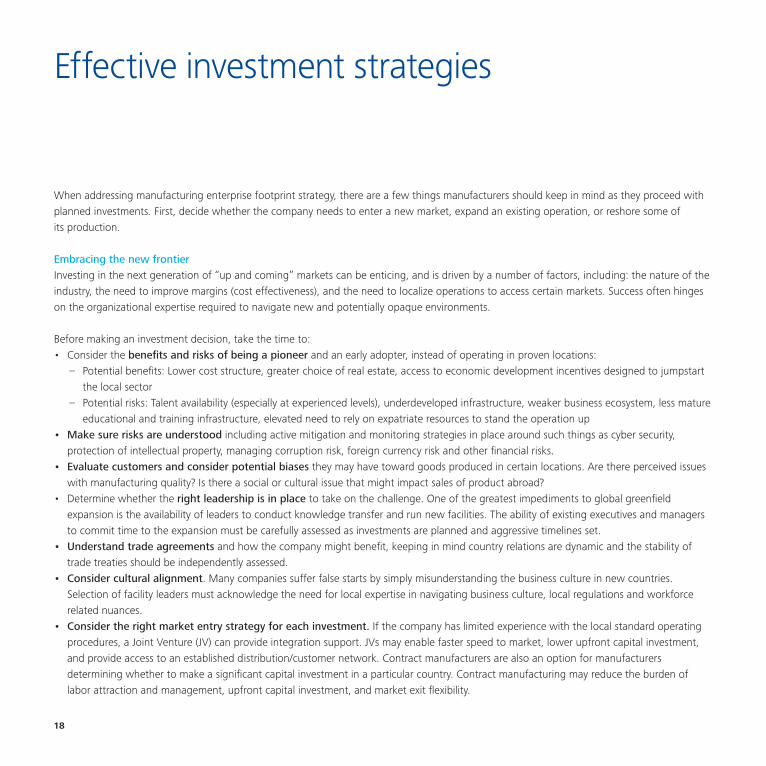
Effective investment strategies
When addressing manufacturing enterprise footprint strategy, there are a few things manufacturers should keep in mind as they proceed with planned investments. First, decide whether the company needs to enter a new market, expand an existing operation, or reshore some of its production.
Embracing the new frontierInvesting in the next generation of “up and coming” markets can be enticing, and is driven by a number of factors, including: the nature of the industry, the need to improve margins (cost effectiveness), and the need to localize operations to access certain markets. Success often hinges on the organizational expertise required to navigate new and potentially opaque environments.
Before making an investment decision, take the time to:• Consider the benefits and risks of being a pioneer and an early adopter, instead of operating in proven locations:
– Potential benefits: Lower cost structure, greater choice of real estate, access to economic development incentives designed to jumpstart the local sector
– Potential risks: Talent availability (especially at experienced levels), underdeveloped infrastructure, weaker business ecosystem, less mature educational and training infrastructure, elevated need to rely on expatriate resources to stand the operation up
• Make sure risks are understood including active mitigation and monitoring strategies in place around such things as cyber security, protection of intellectual property, managing corruption risk, foreign currency risk and other financial risks.
• Evaluate customers and consider potential biases they may have toward goods produced in certain locations. Are there perceived issues with manufacturing quality? Is there a social or cultural issue that might impact sales of product abroad?
• Determine whether the right leadership is in place to take on the challenge. One of the greatest impediments to global greenfield expansion is the availability of leaders to conduct knowledge transfer and run new facilities. The ability of existing executives and managers to commit time to the expansion must be carefully assessed as investments are planned and aggressive timelines set.
• Understand trade agreements and how the company might benefit, keeping in mind country relations are dynamic and the stability of trade treaties should be independently assessed.
• Consider cultural alignment. Many companies suffer false starts by simply misunderstanding the business culture in new countries. Selection of facility leaders must acknowledge the need for local expertise in navigating business culture, local regulations and workforce related nuances.
• Consider the right market entry strategy for each investment. If the company has limited experience with the local standard operating procedures, a Joint Venture (JV) can provide integration support. JVs may enable faster speed to market, lower upfront capital investment, and provide access to an established distribution/customer network. Contract manufacturers are also an option for manufacturers determining whether to make a significant capital investment in a particular country. Contract manufacturing may reduce the burden of labor attraction and management, upfront capital investment, and market exit flexibility.

20
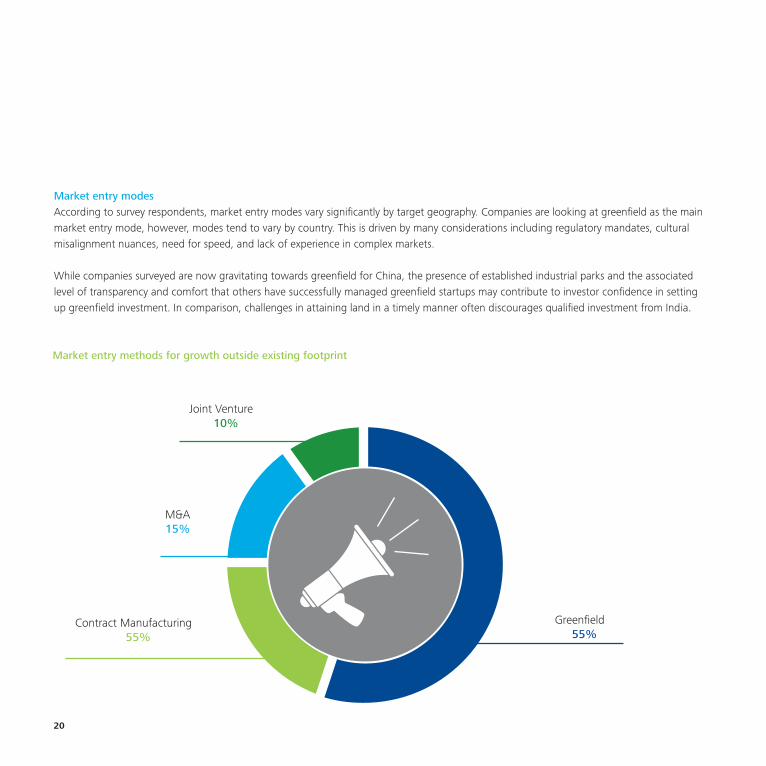
Market entry modesAccording to survey respondents, market entry modes vary significantly by target geography. Companies are looking at greenfield as the main market entry mode, however, modes tend to vary by country. This is driven by many considerations including regulatory mandates, cultural misalignment nuances, need for speed, and lack of experience in complex markets.
While companies surveyed are now gravitating towards greenfield for China, the presence of established industrial parks and the associated level of transparency and comfort that others have successfully managed greenfield startups may contribute to investor confidence in setting up greenfield investment. In comparison, challenges in attaining land in a timely manner often discourages qualified investment from India.
Market entry methods for growth outside existing footprint
Greenfield 55%
Contract Manufacturing 55%
Joint Venture 10%
M&A15%
MAPI and Deloitte Global Manufacturing Footprint 2020 Study 21
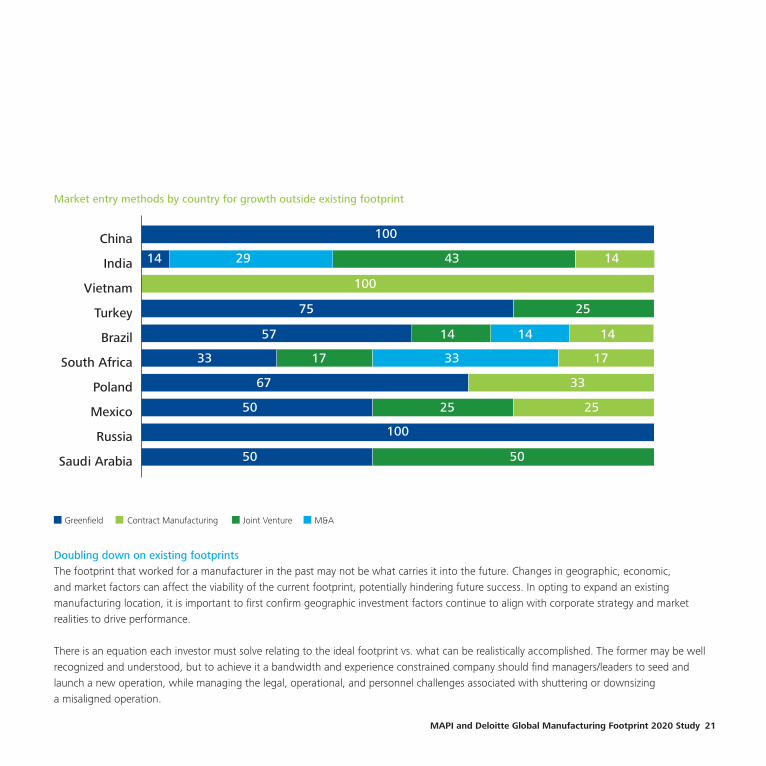
Doubling down on existing footprintsThe footprint that worked for a manufacturer in the past may not be what carries it into the future. Changes in geographic, economic, and market factors can affect the viability of the current footprint, potentially hindering future success. In opting to expand an existing manufacturing location, it is important to first confirm geographic investment factors continue to align with corporate strategy and market realities to drive performance.
There is an equation each investor must solve relating to the ideal footprint vs. what can be realistically accomplished. The former may be well recognized and understood, but to achieve it a bandwidth and experience constrained company should find managers/leaders to seed and launch a new operation, while managing the legal, operational, and personnel challenges associated with shuttering or downsizing a misaligned operation.
Greenfield Contract Manufacturing Joint Venture M&A
Market entry methods by country for growth outside existing footprint
Saudi Arabia
Russia
Mexico
Poland
South Africa
Brazil
Turkey
Vietnam
India
China 100
14
100
75 25
57
33
67 33
50
100
50 50
25 25
17 33 17
14 14 14
29 43 14

22
ReshoringA lot of optimism has emerged surrounding the US manufacturing renaissance, fueled by the concept of reshoring. While reshoring is a real phenomenon; a common misconception is it represents a return of previously offshored operations to US soil. In practicality, reshoring may include returning operations to Mexico. This offers greater access to the US market, but allows companies to maintain advantageous operating cost structures.
Sixty-six percent of survey respondents offshored their operations in the past 20 years, and a third are now considering bringing them back to North America. These moves focus on primary production and assembly operations currently located in China, India, and/or Brazil. Mexico is the first choice destination to re-shore operations, followed by the US.
Destinations of offshored investment from North America in the last 20 years
44%
11%
7%5%
4%3%
2% 2% 2%
China India Brazil Japan Czech Rep.
Germany Poland S.Africa Malaysia Others
20%
MAPI and Deloitte Global Manufacturing Footprint 2020 Study 23
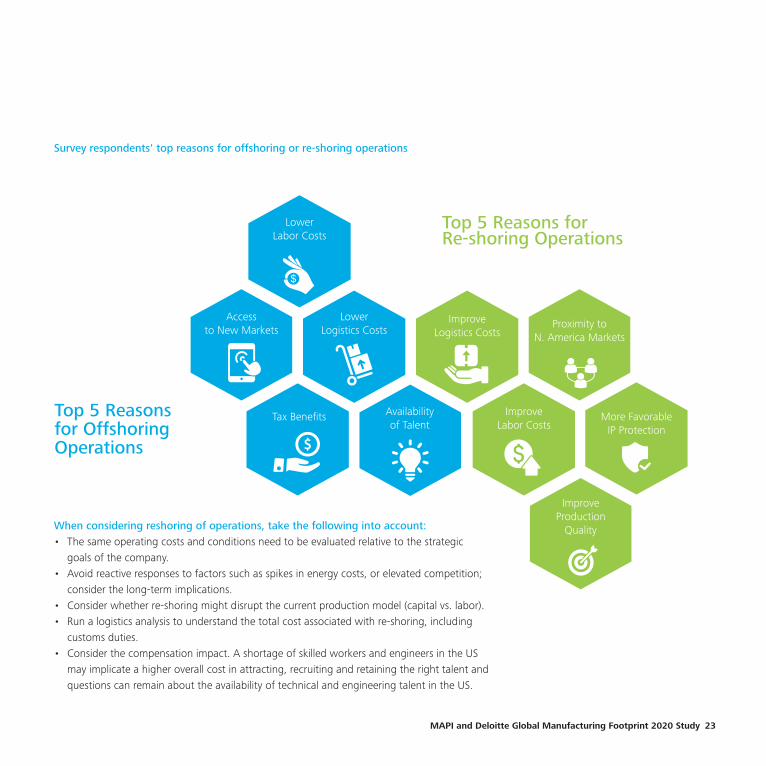
Top 5 Reasons for Offshoring Operations
Survey respondents' top reasons for offshoring or re-shoring operations
Top 5 Reasons for Re-shoring Operations
Lower Labor Costs
Lower Logistics Costs
Improve Logistics Costs
Access to New Markets Proximity to
N. America Markets
Availability of Talent
Improve Production
Quality
Tax Benefits Improve Labor Costs
More Favorable IP Protection
When considering reshoring of operations, take the following into account:• The same operating costs and conditions need to be evaluated relative to the strategic
goals of the company.• Avoid reactive responses to factors such as spikes in energy costs, or elevated competition;
consider the long-term implications. • Consider whether re-shoring might disrupt the current production model (capital vs. labor). • Run a logistics analysis to understand the total cost associated with re-shoring, including
customs duties. • Consider the compensation impact. A shortage of skilled workers and engineers in the US
may implicate a higher overall cost in attracting, recruiting and retaining the right talent and questions can remain about the availability of technical and engineering talent in the US.

24
The path forward
Ultimately, to be effective, enterprise footprint optimization needs to be a continuous process. Proactively responding to dynamic company strategy, revenue growth and cost containment, in concert with growth decisions, can create a framework for continuous improvement that heightens value by ensuring operations are in the right place, at the right time. As manufacturers embark on the journey of global expansion, here are a few key things to keep in mind:
Understand the complexities created by a global footprint
Large businesses with highly diversified global portfolios face greater complexities in volatile markets. The global optimization process should consider market, cost, talent, risks, functional requirements, and legacy footprint restraints while aligning with the corporate strategy.
Assess the risksGeopolitical risk may arise from a recession (e.g., protectionism), market volatility can increase financial risk and regional imbalances can lead to security risks that severely affect the success of a business. It’s difficult to project forward, but take action to balance the portfolio of risks.
Make optimization a sustainable and repeatable process
Ultimately, footprint optimization is a continuous process, creating competitive advantage by keeping structural costs in check and assets aligned with market realities.
Focus on the long-termA footprint realignment effort should focus on and plan beyond the current economic environment. Make actions deliberate, with a long-term focus on overall business success.
Lead from the topExecutive leadership, stakeholder engagement, as well as alignment across business units and geographies is important to the success of a global footprint realignment. Assessing and realigning resources can potentially affect the entire organization.
26
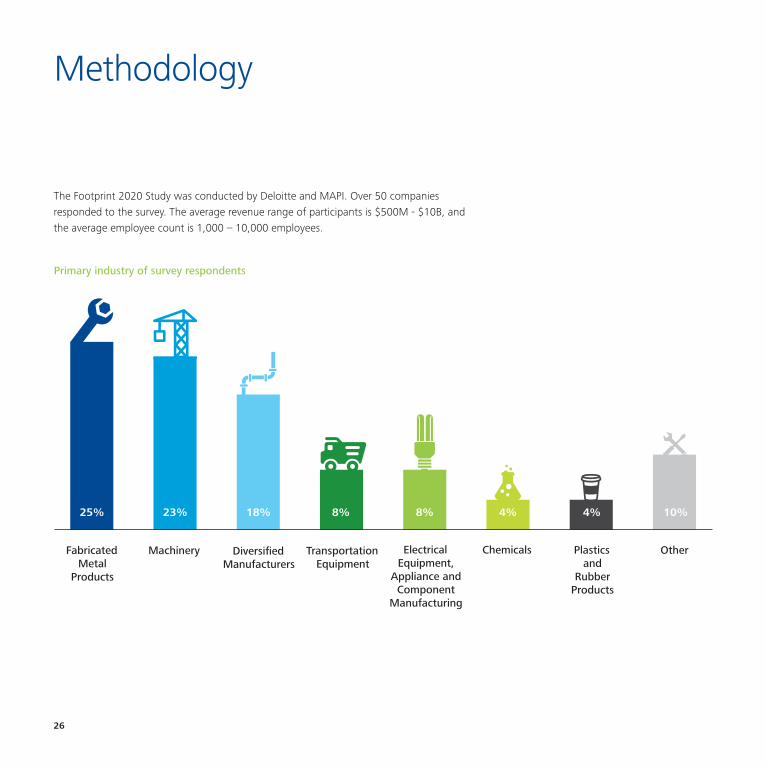
Methodology
The Footprint 2020 Study was conducted by Deloitte and MAPI. Over 50 companies responded to the survey. The average revenue range of participants is $500M - $10B, and the average employee count is 1,000 – 10,000 employees.
Primary industry of survey respondents
Fabricated Metal
Products
Machinery Diversified Manufacturers
Transportation Equipment
Electrical Equipment,
Appliance and Component
Manufacturing
Chemicals Plastics and
Rubber Products
Other
25% 23% 18% 8% 8% 4% 4% 10%
AcknowledgementsWe would like to thank the following professionals who have contributed to the Manufacturing Footprint 2020 Study and this publication: Anirudh Kashyap, Manager, Deloitte Consulting LLP, Delphine Jacquin, Manager, Deloitte Consulting LLP, Tara Nicholson, Manager, Deloitte Consulting LLP, René Stranghoner, US Industrial Products Marketing Sector Leader, Deloitte Services, LP, Surendra Dakoju, Senior Designer, Deloitte Support Services India Pvt Limited.
Authors
Matt HighfieldDirectorDeloitte Consulting [email protected]
Jennifer CallawayCouncil [email protected]
Contributors
Sarah RaehlSenior ManagerDeloitte Consulting [email protected]
Jovana TrkuljaSenior ManagerDeloitte Consulting [email protected]

This publication contains general information only and Deloitte is not, by means of this publication, rendering accounting, business, financial, investment, legal, tax, or other professional advice or services. This publication is not a substitute for such professional advice or services, nor should it be used as a basis for any decision or action that may affect your business. Before making any decision or taking any action that may affect your business, you should consult a qualified professional advisor. Deloitte shall not be responsible for any loss sustained by any person who relies on this document.
About The Manufacturers Alliance for Productivity and Innovation (MAPI)The Manufacturers Alliance for Productivity and Innovation (MAPI) is a member organization focused on building strong leadership within manufacturing, and driving the growth, profitability, and stature of global manufacturers. MAPI contributes to the competitiveness of US manufacturing. MAPI provides the timely and unbiased information that business executives need to improve their strategies, boost productivity, and drive innovation. For more information, please visit www.mapi.net/about.
About DeloitteAs used in this document, "Deloitte" means Deloitte Consulting LLP, a subsidiary of Deloitte LLP. Please see www.deloitte.com/us/about for a detailed description of the legal structure of Deloitte LLP and its subsidiaries. Certain services may not be available to attest clients under the rules and regulations of public accounting.
Copyright © 2015 Deloitte Development LLC. All rights reserved.Member of Deloitte Touche Tohmatsu Limited