Food Waste Auditing at Three Florida Schools -...
18
Sustainability 2015, 7, 1370-1387; doi:10.3390/su7021370 sustainability ISSN 2071-1050 www.mdpi.com/journal/sustainability Article Food Waste Auditing at Three Florida Schools Ann C. Wilkie *, Ryan E. Graunke and Camilo Cornejo Soil and Water Science Department, University of Florida-IFAS, P.O. Box 110960, Gainesville, FL 32611-0960, USA; E-Mails: [email protected] (R.E.G.); [email protected] (C.C.) * Author to whom correspondence should be addressed; E-Mail: [email protected]; Tel.: +1-352-392-8699; Fax: +1-352-392-7008. Academic Editor: Kirrilly Thompson Received: 17 November 2014 / Accepted: 12 January 2015 / Published: 27 January 2015 Abstract: School cafeterias are a significant source of food waste and represent an ideal opportunity for diverting food waste from landfills. In this study, cafeteria waste audits were conducted at three Florida schools. Food waste comprised the largest fraction of school cafeteria waste streams, ranging from 47% to 58%, followed by milk, paper products (tissue, milk cartons, pasteboard, paper plates, and cardboard), and plastics (plastic wrap, packaging, and utensils). Metal and glass comprised the smallest fraction of the waste stream. Average total waste generation ranged from 50.5 to 137.6 g·student −1 ·day −1 . The mean generation rates for food waste ranged from 24.7 to 64.9 g·student −1 ·day −1 . The overall average for cafeteria waste generation among all three schools was 102.3 g·student −1 ·day −1 , with food waste alone contributing 52.2 g·student −1 ·day −1 . There are two primary approaches to diverting school food waste from landfills: reduction and recycling. Food waste can be reduced through educating students and staff in order to change behaviors that cause food waste. Food waste can be collected and recycled through composting or anaerobic digestion in order to generate beneficial end products, including soil amendments and bioenergy. Over 75% of the cafeteria waste measured in this study could be recycled in this manner. Keywords: cafeteria waste; school food waste; waste audit; recycling; waste generation rates; landfill diversion; anaerobic digestion; composting; bioenergy; sustainability OPEN ACCESS
Transcript of Food Waste Auditing at Three Florida Schools -...

Sustainability 2015, 7, 1370-1387; doi:10.3390/su7021370
sustainability ISSN 2071-1050
www.mdpi.com/journal/sustainability
Article
Food Waste Auditing at Three Florida Schools
Ann C. Wilkie *, Ryan E. Graunke and Camilo Cornejo
Soil and Water Science Department, University of Florida-IFAS, P.O. Box 110960, Gainesville,
FL 32611-0960, USA; E-Mails: [email protected] (R.E.G.); [email protected] (C.C.)
* Author to whom correspondence should be addressed; E-Mail: [email protected];
Tel.: +1-352-392-8699; Fax: +1-352-392-7008.
Academic Editor: Kirrilly Thompson
Received: 17 November 2014 / Accepted: 12 January 2015 / Published: 27 January 2015
Abstract: School cafeterias are a significant source of food waste and represent an ideal
opportunity for diverting food waste from landfills. In this study, cafeteria waste audits were
conducted at three Florida schools. Food waste comprised the largest fraction of school
cafeteria waste streams, ranging from 47% to 58%, followed by milk, paper products (tissue,
milk cartons, pasteboard, paper plates, and cardboard), and plastics (plastic wrap, packaging,
and utensils). Metal and glass comprised the smallest fraction of the waste stream. Average
total waste generation ranged from 50.5 to 137.6 g·student−1·day−1. The mean generation
rates for food waste ranged from 24.7 to 64.9 g·student−1·day−1. The overall average for
cafeteria waste generation among all three schools was 102.3 g·student−1·day−1, with food
waste alone contributing 52.2 g·student−1·day−1. There are two primary approaches to
diverting school food waste from landfills: reduction and recycling. Food waste can be
reduced through educating students and staff in order to change behaviors that cause food
waste. Food waste can be collected and recycled through composting or anaerobic digestion
in order to generate beneficial end products, including soil amendments and bioenergy. Over
75% of the cafeteria waste measured in this study could be recycled in this manner.
Keywords: cafeteria waste; school food waste; waste audit; recycling; waste generation
rates; landfill diversion; anaerobic digestion; composting; bioenergy; sustainability
OPEN ACCESS

Sustainability 2015, 7 1371
1. Introduction
Food waste and its consequent environmental, societal, and economic impacts are attracting
increasing attention across the globe [1]. The Food and Agriculture Organization of the United Nations
(FAO) estimates that approximately one-third of global food production is lost or wasted [2]. Global
efforts, such as the Food Loss and Waste Protocol, are currently underway to help identify, quantify, and
reduce food waste [3]. In developed countries, large quantities of preventable food waste are generated
further down the food production chain at the post-retail, consumption level. While food waste from
households represents a significant source of consumption-level food waste [4], the institutional food
service sector (schools, prisons, hospitals) is also a major source of food waste in developed countries [5].
Schools in particular are ubiquitous in our communities and play an important role in all of our lives.
Schools typically serve meals at a single location (i.e., cafeteria) to a large number of individuals and
the resulting food waste is collected at a single point. By comparison, an equal number of meals served
at households would span a large area of a municipality, making collection more difficult. The
concentrated food waste stream from school cafeterias presents an ideal opportunity for diverting food
waste from landfills by reducing and/or recycling this food waste. The first step in assessing the potential
of efforts to divert food waste from schools is to quantify the amount of food waste generated at the
individual school level. The aim of this study was to measure the total cafeteria waste and specifically
the food waste from three local schools by conducting waste audits on the waste stream generated from
their school cafeterias.
Uneaten food from school-provided lunches is a major source of cafeteria food waste. Numerous
studies have been conducted to directly or indirectly measure the amount of food discarded from
school-provided lunches in order to assess students’ nutritional intake [6–8]. These studies considered
many different factors and measured the amount of waste from each constituent of the lunch provided.
Typical values ranged from 20% to 50% of the items served being wasted, with vegetables and fruit in
the higher range and entrée (meat and grain) in the lower range. In the United States, the National School
Lunch Program (NSLP) sponsored by the United States Department of Agriculture (USDA) provides
subsidies to schools that serve lunches in accordance with the NSLP nutrition requirements, with lunches
provided to 31 million students in 2012 [9]. The Healthy, Hunger-Free Kids Act of 2010, which took
effect in the 2012–2013 school year, was a major revision to the nutrition requirements of the NSLP and
made several changes to school-provided meals. One of the most significant changes, as it pertains to
food waste, is that all students are now required “to be served” a fruit or vegetable with lunch [10]. Prior
to these changes, schools were required “to offer” fruit or vegetable, but not required to serve the fruit
or vegetable to every student. There is concern among the public, school administrators, and elected
officials that this change is causing an increase in food waste, particularly fruit and vegetable waste, and
additional costs to schools for serving fruits or vegetables to students who will not eat them [11]. Studies
comparing food waste before and after the implementation of this rule show mixed results. Just and
Price [12] found that requiring students to take at least one serving of fruit or vegetable at three
elementary schools (kindergarten through 5th grade) in Utah significantly increased the amount of fruits
and vegetables wasted, from 0.17 to 0.92 servings discarded per student. Cohen et al. [13], however,
found that after implementation of the new rules at three primary schools (3rd through 8th grade) in a
low-income, urban school district in Massachusetts, the percent of vegetables wasted actually decreased

Sustainability 2015, 7 1372
from 74.2% to 59.7%, but fruit wasted increased slightly from 40.9% to 43.1%. Byker et al. [14]
measured food waste generated from pre-school and kindergarten students receiving NSLP lunches after
implementation of the new regulations at an elementary school in an urban cluster of a rural county in
the southwestern United States. Over the course of a week, overall food wastage was 45.3%, with
vegetables discarded in the highest amount (51.4%) and fruit in the lowest amount (33.0%). However,
there was significant variability in the amount of food wasted during the week; vegetables ranged from
26.1% to 80%, depending on the day. These studies show the effect of students’ preferences and
behavior, and the effect of food service regime, on food waste from school-provided lunches, especially
in light of the new NSLP requirements. However, these studies are not complete food waste audits and
do not account for food waste from lunches that students bring from home, waste from kitchen
preparation, or waste from schools not participating in the NSLP program.
School cafeteria waste audits measuring the amount of cafeteria waste and total food waste generated
from school kitchens and dining areas are less well documented in the United States than plate waste
studies, and the few studies reported give widely varying generation rates. Based on literature reviews,
the Connecticut Department of Energy and Environmental Protection (CDEEP) [15] used a value of
159 g·student−1·day−1 to estimate school food waste for their spatial analysis of food waste generation
in the state. In a study of food waste generation in a single county in upstate New York (Tompkins
County), Griffin et al. [16] estimated the rate of discarded food waste at schools to be
227 g·student−1·day−1 based on their review of the literature. Hollingsworth et al. [17] measured total
cafeteria waste generation rates in four middle schools and two elementary schools in Baton
Rouge Parish, Louisiana for a 5-day period and found an average food waste generation rate of
130 g·student−1·day−1. Hollingsworth et al. [18] also measured total cafeteria waste generation rates at
seven schools (2 elementary, 2 middle and 3 primary; kindergarten through 8th grade) in Ascension
Parish, Louisiana for a 10-day period and found an average food waste generation rate of
171 g·student−1·day−1. Johnson et al. [19] used an estimate for school food waste production of
0.7 kg·employee−1·day−1 at public schools in Florida which translates to 83.3 g·student−1·day−1 based on
the current Florida public school full-time staff (320,349) to public school student (2,691,322)
ratio [20,21]. In Minnesota over a 2-day period, the Minnesota Pollution Control Agency (MPCA) [22]
audited both urban and suburban total school waste at two elementary schools, two middle schools, and
two high schools and determined that the average food waste production at public schools was
56.4 g·student−1·day−1. A waste audit conducted at a dining hall at the University of Florida found a food
waste generation rate of 158.8 g·student−1·day−1 [23]. These few studies show that there are scant data
with a wide range of waste generation rates, and demonstrate the need for more current waste audits that
thoroughly measure the amount of waste generated by school cafeterias.
Focusing on food waste at schools represents an ideal opportunity for addressing institutional food
waste for several reasons. First, the fact that public schools fall under the jurisdiction of the local school
board could allow unified educational campaigns to reduce food waste and coordinated food waste
recycling programs that could improve the cost effectiveness of such programs. Also, cafeterias are a
more controlled environment than other food service areas due to a regular, daily attendance by the same
students eating in the same cafeteria, often for several years. Further, educational campaigns, which
could be incorporated into existing science and engineering curricula, to minimize food waste, to divert
this food waste from landfills, and to transform these materials into energy and soil amendments through

Sustainability 2015, 7 1373
composting or anaerobic digestion, offer unique educational opportunities in resource conservation,
environmental stewardship, and sustainability that are critical for our future citizens, especially for
developing leaders among them. These educational campaigns could have even greater impacts for
fostering sustainability as these students, upon becoming aware of food waste and learning techniques
to reduce or recycle food waste, bring these lessons home and influence their parents to also reduce their
household food waste [24].
The objectives of this study were to determine the amount of total cafeteria waste and food waste
generated at three schools in Gainesville, Florida and to compare the composition of cafeteria waste at
these schools. Such data are an essential first step towards future research to assess the potential for
reducing and recycling food waste at schools. Before any comprehensive food waste reduction or
recycling regime can be implemented, it must first be known how much food waste is generated.
2. Materials and Methods
Three schools located in Alachua County, Florida in the vicinity of Gainesville, were chosen for
sequential cafeteria waste audits: a public elementary school, a technical alternative high school, and a
private combined middle and high school (Table 1). These three schools represent a cross-section of
schools in the local area and were selected in an effort to compare cafeteria waste generation at different
types of schools with different food service regimes. The audits were conducted over consecutive
two-week periods of the school year, prior to implementation of the Healthy, Hunger-Free Kids Act in
the 2012–2013 school year.
Table 1. Characteristics of three Florida schools selected for a cafeteria waste audit.
Characteristic School A School B School C
Type Public Elementary Public Technical High Private Middle/High
Grades kindergarten–5th 9th–12th 6th–12th
Student enrollment a 436 247 355
Free or reduced-cost
meals eligibility a 52.56% 59.22% N/A
Auditing days 8 7 5
Meal source School kitchen or
brought from home
School kitchen or
brought from home
Catered boxed lunches
or brought from home
Breakfast served Yes Yes No
Number of breakfast
meals served per day a,b 98 67 N/A
Lunch served Yes Yes Yes
Number of lunch meals
served per day a,b 282 89 130
All students eat in
cafeteria Yes Yes Yes
Kitchen waste c No Yes No
Recycling bins No No Yes
Vending machines No Yes Yes a Data provided by a representative at each school; b Mean number of meals served daily over the whole school year; c Waste generated by food preparation activities in the cafeteria’s kitchen.

Sustainability 2015, 7 1374
2.1. School A (Public Elementary School)
School A is a suburban public elementary school (kindergarten–5th grade) located in Gainesville,
Florida. During the school year of this audit, the school had 436 enrolled students. All waste generated
from the dining area during the breakfast and lunch periods was collected and sorted. This included all
post-consumer waste from students who purchased or received a school-provided meal and all waste
from students who brought food from home. At School A, the kitchen food waste was minimal, as
reported by the cafeteria staff, because the kitchen received most food items pre-prepared or
pre-packaged. Therefore, kitchen wastes were not collected in the waste audit. Cafeteria waste was
collected on eight consecutive school days.
2.2. School B (Public Technical High School)
School B is a suburban public, career and technical alternative high school (9–12th grade) located in
Gainesville, Florida and had 247 students enrolled during the school year of the audit. A career and
technical high school is one in which the curricula focus more on specific career preparation rather than
general education. Food was prepared in the kitchen at School B more than at School A and generated
large amounts of food waste. Therefore, School B kitchen waste was included in the audits. Kitchen
waste included all waste from trash cans in the food preparation area. Dining room waste included all
post-consumer waste from school-provided food as well as waste from food brought from home. Kitchen
waste was sorted separately from dining waste. However, for simplicity of presenting the data, kitchen
and dining wastes are combined. Vending machines that provided drinks and snack foods were present
in the dining area. At School B, kitchen and dining wastes from breakfast and lunch were collected on
seven school days.
2.3. School C (Private Middle and High School)
School C is a suburban private school combining elementary (kindergarten–5th grade), middle
(6–8th grade) and high (9–12th grade) schools located in Gainesville, Florida. The combined dining area
for the middle and high school grades is separate from that of the elementary grades. The waste audit
was conducted in the cafeteria for the middle and high schools, in which 355 students were enrolled in
the school year of the audit. School C, unlike the other two schools, does not have a kitchen and all food
is either catered (e.g., pizza or boxed lunches) to the lunch room from off-campus vendors or brought
from home by the students themselves. Breakfast was not offered at School C. Vending machines that
provided drinks and snack foods were present in the dining area, and separate recycling bins for bottles
and cans were in place next to waste bins in the dining area. The recyclables in these bins were not
included in the audit as the goal of the study was to examine waste currently disposed of in landfills.
Cafeteria waste was collected on five consecutive school days.
2.4. Waste Audit Methodology
At all three schools, dining area waste is normally deposited into waste bins by the students. At School
B, kitchen waste was deposited in waste bins by staff. Bins are then emptied into dumpsters for landfill
disposal. Given the inherent issues with sampling heterogeneous materials, such as solid waste [25], the

Sustainability 2015, 7 1375
entire daily waste stream from the schools’ food service areas was collected and sorted for the duration
of the audits. School staff cooperated in the audits through carefully setting aside the waste collected
from the dining and/or kitchen areas in separate garbage bags and providing access to pick up the bagged
waste from the schools for transport to the Bioenergy and Sustainable Technology Laboratory at the
University of Florida. The totality of the waste was sorted by hand into tared 18-L plastic buckets and
weighed on an Ohaus D-5 digital scale (Ohaus Corporation, Parsippany, NJ, USA). Sorting was
performed immediately after daily pick-up to reduce evaporation. The entire contents of each bag was
sorted in impermeable trays to prevent run-off and allow collection of free-standing liquids. Any opened
or unopened drink containers and any residual liquids in the sorting tray were poured into a tared
container and weighed. These liquids consisted overwhelmingly of milk, as was evidenced by the
minimal amount of plastic bottles and aluminum cans in the waste, but also included some soda, juice,
or water. Other than food and milk, the waste was further sorted into different components including:
cardboard, milk cartons, office paper, pasteboard, paper plates, tissue paper, plastic bags, plastic bottles,
plastic containers, plastic packaging, plastic wrap, Styrofoam, straws, utensils, plastic zipper bags,
aluminum cans, aluminum foil, and glass. These components are described in Table 2.
Table 2. Description of waste components measured in cafeteria waste audits.
Component Description Waste type
Food Plate waste from school-provided meals and meals brought from home, food
preparation waste (School B only), includes lunch and breakfast (if applicable) Food
Milk Milk in opened or unopened cartons, includes any residual liquids in the waste
(minimal compared to volume of milk) Milk
Cardboard Corrugated cardboard, such as pizza boxes or boxes collected in the kitchen
waste (School B only) Paper
Milk cartons Empty milk cartons (paper material with a wax or plastic coating) Paper
Office paper Sheets or scraps of white or colored office paper Paper
Pasteboard Un-corrugated cardboard Paper
Paper plates Standard paper plates Paper
Tissue paper Napkins, paper towels, deli paper, paper bags Paper
Plastic bags Standard plastic shopping bags Plastic
Plastic bottles Plastic water, juice, or soda bottles Plastic
Plastic containers Plastic cups, clamshell containers, and similar items Plastic
Plastic packaging Plastic chip bags, wrappers, and similar items Plastic
Plastic wrap Clear plastic sheet wrap, such as cellophane or Saran wrap, clear plastic bags for
utensils, etc. Plastic
Styrofoam Expanded polystyrene cups, plates, or serving trays Plastic
Straws Disposable plastic straws Plastic
Utensils Disposable plastic utensils Plastic
Zipper bags Re-sealable plastic storage bags Plastic
Al cans Aluminum soda or juice cans Al & Glass
Al foil Aluminum foil sheets or aluminum trays from the kitchen Al & Glass
Glass Glass soda or juice bottles Al & Glass

Sustainability 2015, 7 1376
2.5. Data Analysis
The various components of the waste stream were grouped into five main fractions based on waste
type: food, milk, paper (cardboard, milk cartons, office paper, pasteboard, paper plates, and tissue paper),
plastic (bags, bottles, containers, packaging, wrap, Styrofoam, straws, and utensils), and aluminum (cans
and foil) and glass (Table 2). The mean percentage contribution of each waste fraction to the total waste
collected at each school was determined using the mean daily generation rate of each fraction as a percent
of the mean daily total waste generation rate. Daily attendance data from the schools were used to
calculate the mean and standard deviation of the generation rate on a per student basis for waste
components at the three schools based on the mean daily per student generation of each component at
each school. Finally, the mean per student generation rates for food service waste and fractions were
compared to levels found in the literature.
3. Results
The daily total waste and waste fractions from the cafeteria waste audit at each school are shown in
Figures 1–3. School A showed the greatest variability in total daily waste (Figure 1). This may be due
to the nature of the younger elementary school students who may be more selective about what they eat
from a certain day’s menu. The mean daily component weights and student attendance data from the
cafeteria waste audit at each school are shown in Table 3. For all three schools, food waste was the
predominant component found in the collected waste. The mean percentage contribution of each
cafeteria waste fraction to the daily total waste generation rate at each school is depicted in Figure 4.
Figure 1. Total waste and waste fraction weights from a cafeteria waste audit at School A,
a public elementary school in Alachua County, Florida.

Sustainability 2015, 7 1377
Figure 2. Total waste and waste fraction weights from a cafeteria waste audit at School B, a
public technical high school in Alachua County, Florida.
Figure 3. Total waste and waste fraction weights from a cafeteria waste audit at School C,
a private middle and high school in Alachua County, Florida.
Figure 4. Mean percentage of waste fractions from cafeteria waste audits at three Florida schools.
Sustainability 2015, 7 1378
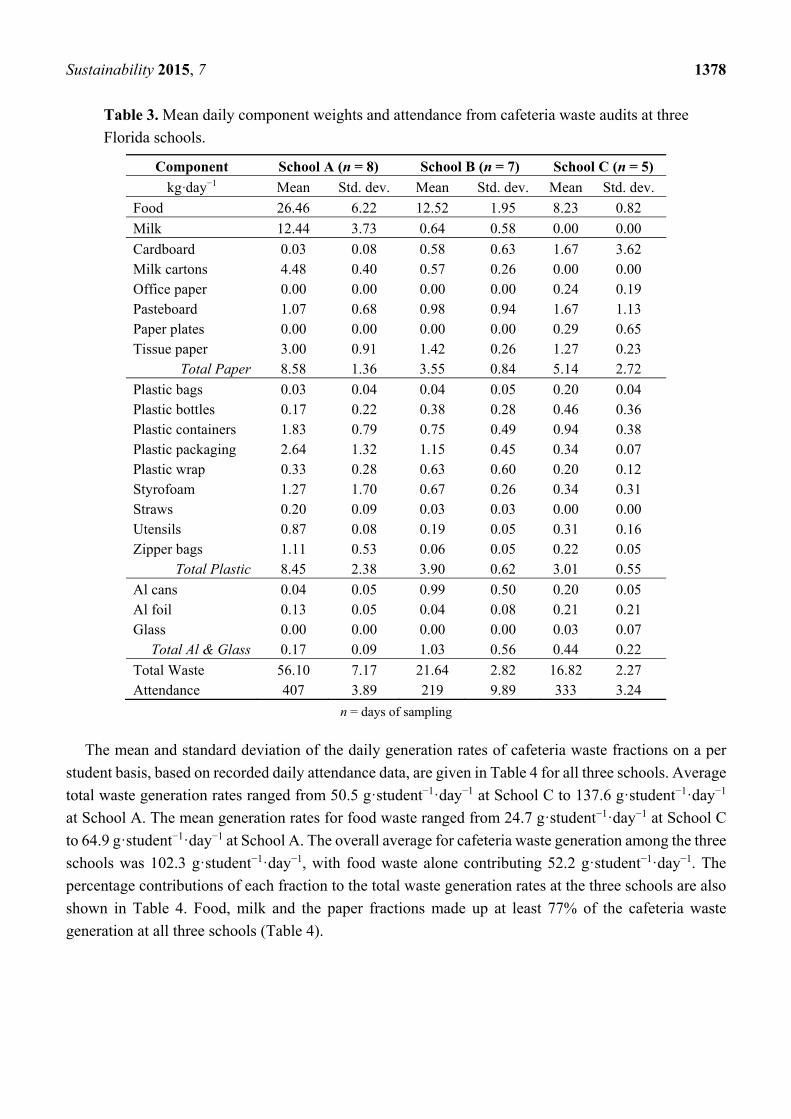
Table 3. Mean daily component weights and attendance from cafeteria waste audits at three
Florida schools.
Component School A (n = 8) School B (n = 7) School C (n = 5)
kg·day−1 Mean Std. dev. Mean Std. dev. Mean Std. dev.
Food 26.46 6.22 12.52 1.95 8.23 0.82
Milk 12.44 3.73 0.64 0.58 0.00 0.00
Cardboard 0.03 0.08 0.58 0.63 1.67 3.62 Milk cartons 4.48 0.40 0.57 0.26 0.00 0.00 Office paper 0.00 0.00 0.00 0.00 0.24 0.19 Pasteboard 1.07 0.68 0.98 0.94 1.67 1.13 Paper plates 0.00 0.00 0.00 0.00 0.29 0.65 Tissue paper 3.00 0.91 1.42 0.26 1.27 0.23
Total Paper 8.58 1.36 3.55 0.84 5.14 2.72
Plastic bags 0.03 0.04 0.04 0.05 0.20 0.04 Plastic bottles 0.17 0.22 0.38 0.28 0.46 0.36 Plastic containers 1.83 0.79 0.75 0.49 0.94 0.38 Plastic packaging 2.64 1.32 1.15 0.45 0.34 0.07 Plastic wrap 0.33 0.28 0.63 0.60 0.20 0.12 Styrofoam 1.27 1.70 0.67 0.26 0.34 0.31 Straws 0.20 0.09 0.03 0.03 0.00 0.00 Utensils 0.87 0.08 0.19 0.05 0.31 0.16 Zipper bags 1.11 0.53 0.06 0.05 0.22 0.05
Total Plastic 8.45 2.38 3.90 0.62 3.01 0.55
Al cans 0.04 0.05 0.99 0.50 0.20 0.05 Al foil 0.13 0.05 0.04 0.08 0.21 0.21 Glass 0.00 0.00 0.00 0.00 0.03 0.07
Total Al & Glass 0.17 0.09 1.03 0.56 0.44 0.22
Total Waste 56.10 7.17 21.64 2.82 16.82 2.27 Attendance 407 3.89 219 9.89 333 3.24
n = days of sampling
The mean and standard deviation of the daily generation rates of cafeteria waste fractions on a per
student basis, based on recorded daily attendance data, are given in Table 4 for all three schools. Average
total waste generation rates ranged from 50.5 g·student−1·day−1 at School C to 137.6 g·student−1·day−1
at School A. The mean generation rates for food waste ranged from 24.7 g·student−1·day−1 at School C
to 64.9 g·student−1·day−1 at School A. The overall average for cafeteria waste generation among the three
schools was 102.3 g·student−1·day−1, with food waste alone contributing 52.2 g·student−1·day−1. The
percentage contributions of each fraction to the total waste generation rates at the three schools are also
shown in Table 4. Food, milk and the paper fractions made up at least 77% of the cafeteria waste
generation at all three schools (Table 4).

Sustainability 2015, 7 1379
Table 4. Mean generation rates of cafeteria waste fractions from three Florida schools based on waste audits.
Fraction School A (n = 8) a School B (n = 7) School C (n = 5) Overall (n = 20)
g·student−1·day−1 Mean Std. Dev. % of Total Mean Std. Dev. % of Total Mean Std. Dev. % of Total Mean Std. Dev. % of Total
Food 64.86 14.77 47.1 57.24 8.45 57.8 24.70 2.31 48.9 52.15 19.49 51.0 Milk 30.56 9.19 22.2 2.86 2.54 2.9 0.00 0.00 0.0 13.22 15.66 12.9
Paper b 21.06 3.34 15.3 16.22 3.56 16.4 15.47 8.36 30.6 17.97 5.44 17.6 Plastic c 20.73 5.81 15.1 17.94 3.07 18.1 9.00 1.66 17.8 16.82 6.24 16.4
Al & Glass d 0.40 0.22 0.3 4.75 2.71 4.8 1.32 0.67 2.6 2.16 2.53 2.1 Total 137.60 16.75 100.0 99.01 11.86 100.0 50.49 7.22 100.0 102.32 37.33 100.0
a n = days of sampling; b Paper includes: Cardboard, milk cartons, office paper, pasteboard, paper plates, and tissue paper; c Plastic includes: Plastic bags, plastic bottles,
plastic containers, plastic packaging, plastic wrap, Styrofoam, straws, utensils, and zipper bags; d Al & Glass includes: Aluminum cans, aluminum foil, and glass.
Sustainability 2015, 7 1380
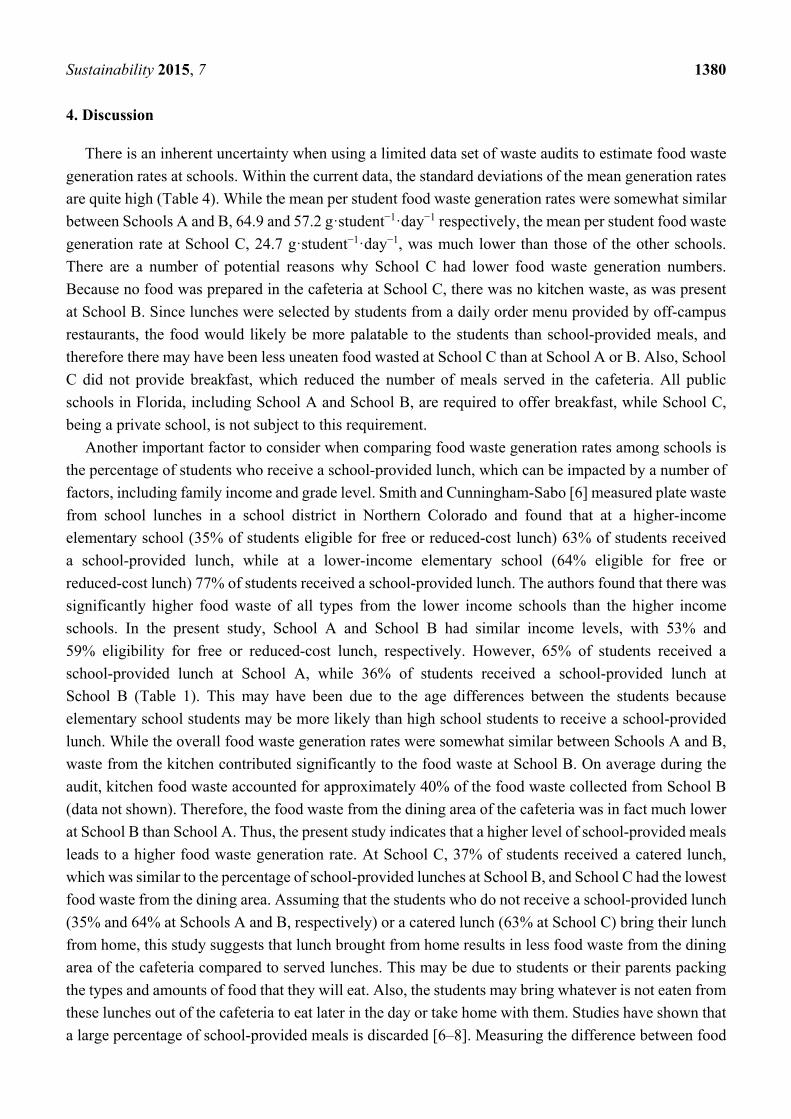
4. Discussion
There is an inherent uncertainty when using a limited data set of waste audits to estimate food waste
generation rates at schools. Within the current data, the standard deviations of the mean generation rates
are quite high (Table 4). While the mean per student food waste generation rates were somewhat similar
between Schools A and B, 64.9 and 57.2 g·student−1·day−1 respectively, the mean per student food waste
generation rate at School C, 24.7 g·student−1·day−1, was much lower than those of the other schools.
There are a number of potential reasons why School C had lower food waste generation numbers.
Because no food was prepared in the cafeteria at School C, there was no kitchen waste, as was present
at School B. Since lunches were selected by students from a daily order menu provided by off-campus
restaurants, the food would likely be more palatable to the students than school-provided meals, and
therefore there may have been less uneaten food wasted at School C than at School A or B. Also, School
C did not provide breakfast, which reduced the number of meals served in the cafeteria. All public
schools in Florida, including School A and School B, are required to offer breakfast, while School C,
being a private school, is not subject to this requirement.
Another important factor to consider when comparing food waste generation rates among schools is
the percentage of students who receive a school-provided lunch, which can be impacted by a number of
factors, including family income and grade level. Smith and Cunningham-Sabo [6] measured plate waste
from school lunches in a school district in Northern Colorado and found that at a higher-income
elementary school (35% of students eligible for free or reduced-cost lunch) 63% of students received
a school-provided lunch, while at a lower-income elementary school (64% eligible for free or
reduced-cost lunch) 77% of students received a school-provided lunch. The authors found that there was
significantly higher food waste of all types from the lower income schools than the higher income
schools. In the present study, School A and School B had similar income levels, with 53% and
59% eligibility for free or reduced-cost lunch, respectively. However, 65% of students received a
school-provided lunch at School A, while 36% of students received a school-provided lunch at
School B (Table 1). This may have been due to the age differences between the students because
elementary school students may be more likely than high school students to receive a school-provided
lunch. While the overall food waste generation rates were somewhat similar between Schools A and B,
waste from the kitchen contributed significantly to the food waste at School B. On average during the
audit, kitchen food waste accounted for approximately 40% of the food waste collected from School B
(data not shown). Therefore, the food waste from the dining area of the cafeteria was in fact much lower
at School B than School A. Thus, the present study indicates that a higher level of school-provided meals
leads to a higher food waste generation rate. At School C, 37% of students received a catered lunch,
which was similar to the percentage of school-provided lunches at School B, and School C had the lowest
food waste from the dining area. Assuming that the students who do not receive a school-provided lunch
(35% and 64% at Schools A and B, respectively) or a catered lunch (63% at School C) bring their lunch
from home, this study suggests that lunch brought from home results in less food waste from the dining
area of the cafeteria compared to served lunches. This may be due to students or their parents packing
the types and amounts of food that they will eat. Also, the students may bring whatever is not eaten from
these lunches out of the cafeteria to eat later in the day or take home with them. Studies have shown that
a large percentage of school-provided meals is discarded [6–8]. Measuring the difference between food
Sustainability 2015, 7 1381
waste generation rates from school-provided lunches and lunches brought from home is an area of
potential future research.
A notable difference between the schools was the amount of milk wasted. School A showed the
highest amount of milk waste, as expected, due to the younger elementary school children being
routinely served milk over other beverages. High school students may be less likely to take milk with
their meals and, since there were vending machines in the cafeteria, they may have elected to drink soda,
juice, or water instead. Also, since School B had much fewer students that were served a school-provided
meal, there was less opportunity for students to receive milk. Another factor in milk waste was the
volume provided to the students. At both School A and School B, milk was provided in half-pint
(0.24 L) cartons. This may have been too much milk for the average elementary student to drink. In fact,
unopened cartons of milk were commonly found in the waste at School A. School C did not provide
milk and there was no measurable amount of liquids collected in the cafeteria waste.
The mean weight of food waste generated from the school cafeterias in the present study varied
from 64.9 g·student−1·day−1 at School A to only 24.7 g·student−1·day−1 at School C, with an overall
average for all schools of 52.2 g·student−1·day−1 (Table 4), which is approximately the weight of half
a small apple or one and a half slices of bread. These measurements are significantly lower than school
food waste generation values estimated by CDEEP [15] and Griffin et al. [16] that ranged from 159
to 227 g·student−1·day−1 respectively, but are closer to the level estimated by MPCA [22] of
56.4 g·student−1·day−1. The levels are also lower than food waste generation rates measured by
Hollingsworth et al. [17,18] of 130 and 171 g·student−1·day−1, respectively. One reason that food waste
generation rates found in the current study are lower could be an increased reliance on pre-packaged and
pre-prepared food at these schools, which was empirically observed during the audits and through
discussions with the cafeteria staff. For instance, at School A, instead of serving a whole apple, the
students received pre-packaged slices of apples which would eliminate the disposal of apple cores into
the food service waste stream. Graunke and Wilkie [23] also found a high food waste generation rate of
158.8 g·student−1·day−1 at a university dining hall. However, this dining hall was operated as a buffet
and all food was prepared on-site. The kitchen waste from food preparation accounted for
72.6 g·student−1·day−1 in this study, while post-consumer food waste was 86.2 g·student−1·day−1 [23].
Although food waste was the main focus of the present study, the generation rates of other
components of the cafeteria waste that were measured in the audits were compared to available literature.
Data from the Hollingsworth et al. [17,18] studies, which date from the early 1990s, was used to calculate
the contribution of only the paper fraction (cardboard, pasteboard, paper bags, and napkins) of the school
cafeteria waste stream, yielding paper fraction generation rates of 34 and 40 g·student−1·day−1,
respectively. The current study found paper fraction generation rates ranging from 15.5 g·student−1·day−1
at School C to 21.1 g·student−1·day−1 at School A (Table 4) that are close to half of the estimated
generation rates from the Hollingsworth studies. In contrast, the plastic fraction in the current study
ranged from 9.0 to 20.7 g·student−1·day−1 (Table 4), while plastic fraction generation rates in the
Hollingsworth et al. [17,18] studies were calculated to range from only 3.4 to 3.8 g·student−1·day−1,
much lower than in the current study. The difference in paper and plastic generation rates in the present
study compared to the Hollingsworth et al. [17,18] studies may be traced to the fact that the use of plastic
as a packaging material has increased substantially in recent years. This was empirically observed during
the waste audits with a predominance of plastic packaging compared to paper or cardboard packaging

Sustainability 2015, 7 1382
in evidence. The apparent change in waste generation over time highlights the need for current audits in
order to determine accurate component generation rates.
The waste audits revealed that food waste comprised the majority of the cafeteria waste stream.
Diverting this food waste from disposal at landfills presents a clear opportunity for increasing the
sustainability of school cafeterias. Also, because this food waste is generated at a single point, diverting
school cafeteria food waste can be a low-hanging fruit in addressing the problem of food waste. There
are two primary approaches to diverting school food waste: reduction and recycling.
Reducing the amount of food waste generated at schools by preventing food from being discarded
offers perhaps the most impactful solution to diverting school food waste from landfills. With the rules
set by the NSLP standards, school-provided lunches must meet certain criteria and, especially with the
Healthy, Hunger-Free Kids Act requiring each student to take a fruit or vegetable, there are some unique
challenges to reducing food waste from school-provided lunches. This can be compounded by younger
children’s tendency to be selective eaters [26]. However, there are a number of strategies that have been
researched in order to reduce the amount of food waste from lunches provided under the NSLP. One
strategy includes providing adequate time for students to eat and serving lunch at an appropriate time of
day. Studies have shown that scheduling recess prior to lunch can significantly increase consumption
and reduce food waste [4,27]. Other strategies include improving the quality and acceptance of food,
launching nutrition education campaigns, using appropriate portion sizes, and allowing self-service fruit
and vegetable bars [28]. Involving students in cooking and food preparation through classroom activities
could increase their acceptance of different foods and increase consumption of fruits and vegetables [29].
Providing incentives or rewards to students for eating their fruits and vegetables is another effective food
waste reduction strategy [12]. Even serving food with an attractive name may reduce the amount of food
waste. One study found that calling carrots “X-ray vision carrots” approximately doubled the amount of
carrots eaten (65.9% eaten) versus calling the carrots “Food of the day” (32.0% eaten) or unnamed
(35.1% eaten) [30]. These studies show that, with some research and creativity, there is great potential
to reduce the amount of food waste generated from schools by adjusting how food is served and/or
employing behavior change strategies.
The second route for diverting school food waste is through collecting and recycling food waste.
Waste is typically collected at a single point at the school, such as a dumpster behind the cafeteria, which
allows collection of a large quantity of food waste in one location. Also, because school cafeterias are
typically a more controlled environment than other food service locations, employing strategies for
source separation and collection would be more feasible. Many of the plastic waste items found in the
present study could be replaced with durable products that would be washed and reused, such as plates
and metal utensils. Not only would this reduce the overall waste from the cafeteria, but a “cleaner” food
waste stream would be generated. By reducing the number of disposable items used in the cafeteria,
combined with focused training of students and cafeteria staff, and interpretive signage to highlight
designated receptacles for food waste, a source-separated food waste stream could be generated from
school cafeterias, which would greatly facilitate opportunities for food waste recycling. Also, recycling
programs offer valuable educational experiences for students that will continue to provide long-term
benefits to society.
Although food waste recycling is lower than food waste reduction on the Food Recovery Hierarchy
developed by the United States Environmental Protection Agency [31], food waste recycling has many
Sustainability 2015, 7 1383
benefits and is useful for diverting unavoidable food waste (e.g., food preparation waste or inedible
portions of food) from landfills. Food waste has high moisture content, is readily degradable, and
contains significant plant nutrients [32]. The most beneficial means of recycling food waste is either by
composting into soil amendments or by conversion via anaerobic digestion into biogas and fertilizer
products. In both composting and anaerobic digestion, nutrients contained in the food waste can be
recovered and reused. Anaerobic digestion has the added benefit of generating a renewable bioenergy
(biogas) that can be used as a replacement for natural gas [33]. Depending on available space at a school
or the technology available in the surrounding community, on-campus composting or anaerobic
digestion could feasibly be incorporated into the school’s facility operations. Composting is already
being practiced on a small scale at many schools and, with some investment, composting operations
could be expanded to handle cafeteria food waste. These operations could generate a steady supply of
compost that could be incorporated synergistically to promote on-campus gardening and food
production. This could in turn further help reduce food waste because school gardens have been shown
to increase students’ consumption of fruits and vegetables [34]. Anaerobic digestion could be
implemented on school campuses using small-scale digesters. These could be operated through
partnerships with local anaerobic technology providers, or by the school’s facility operations themselves.
Biogas, with appropriate equipment, could be used for cooking in the cafeteria’s kitchen, offsetting fossil
fuel use at the cafeteria. The biofertilizer by-product of anaerobic digestion could also be used to support
on-campus gardening activities. Alternatively, a centralized anaerobic digester could be constructed to
handle food waste from several schools within a school district.
The State of Florida Department of Environmental Protection has set a goal of reducing the level of
recyclable municipal solid waste (MSW) sent for landfill disposal by at least 75% by 2020 to improve
environmental sustainability [35]. Therefore, focusing on recycling the non-food waste materials is
critical to meeting this goal. Through separating food waste from the other materials, there is a
synergistic effect that can improve recycling of the other materials in the cafeteria waste. Most of the
materials collected during the audits were heavily soiled with food residues from contact with food waste
in the waste bins. This contamination can be particularly problematic for recycling some of these
materials. Therefore, establishing or improving the existing source separation of recyclables through
education and awareness is essential in order to divert clean recyclables from the waste stream. The types
of these materials that are recyclable will depend on the recycling facilities in the area. It should be noted
that School C, which had vending machines in the cafeteria, was already collecting recyclables in the
cafeteria. School C showed lower generation rates of aluminum cans than School B (1.2% versus 4.6%
of total cafeteria waste, respectively), which also had vending machines but did not collect recyclables.
Paper materials, such as napkins, may be more difficult to separate from food waste for recycling.
However, even when contaminated, it is possible to compost or anaerobically digest some or all of the
paper fraction in combination with the food waste (including milk). This combination could recycle
more than 75% of the cafeteria waste measured in the present study.
One limitation of this study is the short duration of measurements, with data collection occurring over
two weeks or less. The study does not account for seasonal variation within the schools. However, meals
at these schools consisted largely of pre-packaged or processed foods with little seasonal fresh produce
and, therefore, the seasonal variation of the meals at these particular schools is presumed to be minimal.
Regional differences may also exist as different school districts could operate their food services

Sustainability 2015, 7 1384
differently. Differences in student demographics (age, ethnicity, socio-economic status) also affect
student eating habits, which impacts waste generation. To mitigate the effects of these differences, the
three schools were purposefully selected to represent students of various backgrounds from a public
elementary school, a public technical high school, and a private middle/high school.
5. Conclusions
The present study found that food waste comprised the majority of the waste generated from the
cafeterias at three different types of schools in Alachua County, Florida. The overall mean waste
generation rate on a per student basis was 102.3 g·student−1·day−1, with food waste contributing 51.0%
of this waste or 52.2 g·student−1·day−1. Total organic wastes (food, milk and paper) contributed 81.5%
of the overall per student mean waste generation rate. Because of the high amount of organic waste
generated, efforts to reduce or recycle organic waste have the potential to greatly reduce the quantity of
waste discarded from school cafeterias.
The daily food waste generation rates showed considerable variation between the different schools.
This was likely due to the different ages of students and methods of food service. For example, at School
C, a private middle and high school where food was catered from off-campus vendors, the food waste
generation rates were less than half the food waste generation rates from Schools A and B, which are
public schools where food was served in traditional cafeteria style. School B also had a large amount of
food waste from the cafeteria’s kitchen due to more food preparation in the School B kitchen. School A
had the highest mean food waste generation rates of all three schools, even though the kitchen did not
generate a measurable amount of food waste. This may be due to a higher number of school-provided
meals and a student population of elementary school children who may be more selective eaters or served
larger portions than they can eat. The latter may be particularly important in view of the recent Healthy,
Hunger-Free Kids Act that requires every child to be served a fruit or vegetable at lunch. Schools B and
C had a higher percentage of students that brought lunch from home compared to School A, which
suggests that lunch brought from home results in less food waste from the dining area of the cafeteria.
The variable waste generation rates among the different schools highlight the importance of conducting
onsite waste audits and understanding where and why food waste is generated in the cafeteria when
planning future studies on food waste reduction and recycling at school cafeterias.
Acknowledgments
This research was funded by the Hinkley Center for Solid and Hazardous Waste Management,
Gainesville, Florida. The authors thank the administration and staff at the participating schools for their
cooperation. We also acknowledge interns from the BioEnergy and Sustainability School (BESS),
a summer research internship program for undergraduates funded by the Florida Agricultural Experiment
Station, UF-IFAS for assistance in sorting the school cafeteria waste.

Sustainability 2015, 7 1385
Author Contributions
All authors (Ann C. Wilkie, Professor; Ryan E. Graunke, Graduate Student; Camilo Cornejo,
Postdoctoral Research Associate) contributed substantially to the research presented in this paper and
to the preparation of the final manuscript.
Conflicts of Interest
The authors declare no conflict of interest.
References
1. Food and Agriculture Organization of the United Nations (FAO). Food Wastage Footprint:
Impacts on Natural Resources, Summary Report; FAO: Rome, Italy, 2013. Available online:
http://www.fao.org/docrep/018/i3347e/i3347e.pdf (accessed on 27 October 2014). 2. Food and Agriculture Organization of the United Nations (FAO). Global Food Losses and Food
Waste: Extent, Causes, and Prevention; FAO: Rome, Italy, 2011. Available online:
http://www.fao.org/docrep/014/mb060e/mb060e.pdf (accessed on 27 October 2014). 3. World Resources Institute (WRI). Food Loss and Waste Protocol: Overview; WRI: Washington,
DC, USA, 2014. Available online:
http://www.wri.org/sites/default/files/uploads/Food_loss_and_waste_protocol_Summary_Overview_Oct_2014.pdf
(accessed on 27 October 2014).
4. Quested, T.; Ingle, R.; Parry, A. Household Food and Drink Waste in the United Kingdom 2012;
Waste & Resources Action Programme (WRAP): Banbury, UK, 2013. Available online:
http://www.wrap.org.uk/content/household-food-and-drink-waste-uk-2012 (accessed on 27 October 2014).
5. Cordingley, F.; Reeve, S.; Stephenson, J. Food Waste in Schools; Waste & Resources Action
Programme (WRAP): Banbury, UK, 2011. Available online:
http://www.wrap.org.uk/sites/files/wrap/Food%20waste%20in%20schools%20full%20report%20.pdf (accessed on 27
October 2014).
6. Smith, S.L.; Cunningham-Sabo, L. Food choice, plate waste and nutrient intake of elementary and
middle-school students participating in the US National School Lunch Program. Public Heath
Nutr. 2014, 17, 1255–1263. http://dx.doi.org/10.1017/S1368980013001894
7. Marlette, M.A.; Templeton, S.B.; Panemangalore, M. Food type, food preparation, and
competitive food purchases impact school lunch plate waste by sixth-grade students. J. Am. Diet.
Assoc. 2005, 105, 1779–1782. http://dx.doi.org/10.1016/j.jada.2005.08.033
8. Adams, M.A.; Pelletier, R.L.; Zive, M.M.; Sallis, J.F. Salad bars and fruit and vegetable
consumption in elementary schools: A plate waste study. J. Am. Diet. Assoc. 2005, 105, 1789–
1792. http://dx.doi.org/10.1016/j.jada.2005.08.013
9. Food and Nutrition Service, United States Department of Agriculture (FNS/USDA). National
School Lunch Program Fact Sheet; FNS/USDA: Washington, DC, USA, 2013. Available online:
http://www.fns.usda.gov/sites/default/files/NSLPFactSheet.pdf (accessed on 27 October 2014).

Sustainability 2015, 7 1386
10. Healthy, Hunger-Free Kids Act of 2010. 111th Congress of the United States of America, 2010.
Available online: http://www.gpo.gov/fdsys/pkg/PLAW-111publ296/pdf/PLAW-111publ296.pdf (accessed on 27
October 2014). 11. Watanabe, T. Solutions sought to reduce food waste at schools. Los Angeles Times, April 1, 2014.
Available online: http://www.latimes.com/local/la-me-lausd-waste-20140402-story.html#page=1 (accessed on 27
October 2014). 12. Just, D.; Price, J. Default options, incentives and food choices: Evidence from elementary-school
children. Public Heath Nutr. 2013, 16, 2281–2288. http://dx.doi.org/10.1017/S1368980013001468
13. Cohen, J.F.W.; Richardson, S.; Parker, E.; Catalano, P.J.; Rimm, E.B. Impact of the new U.S.
Department of Agriculture school meal standards on food selection, consumption, and waste.
Am. J. Prev. Med. 2014, 46, 388–394. http://dx.doi.org/10.1016/j.amepre.2013.11.013
14. Byker, C.J.; Farris, A.R.; Marcenelle, M.; Davis, G.C.; Serrano, E.L. Food waste in a school
nutrition program after implementation of new lunch program guidelines. J. Nutr. Educ. Behav.
2014, 46, 406–411. http://dx.doi.org/10.1016/j.jneb.2014.03.009
15. Connecticut Department of Energy and Environmental Protection (CDEEP). Updated Mapping of
Food Residual Generation in Connecticut; CDEEP: Hartford, CT, USA, 2012. Available online:
http://www.ct.gov/deep/lib/deep/compost/compost_pdf/ct_food_residual_generator_report_2012.pdf (accessed on 27
October 2014). 16. Griffin, M.; Sobal, J.; Lyson, T.A. An analysis of a community food waste stream. Agric. Hum.
Values 2009, 26, 67–81. http://dx.doi.org/10.1007/s10460-008-9178-1
17. Hollingsworth, M.D.; Shanklin, C.; Gench, B.; Hinson, M. Composition of waste generated in six
selected school food service operations. Sch. Foodserv. Res. Rev. 1992, 16, 125–130. Available
online: http://docs.schoolnutrition.org/newsroom/jcnm/archives/SFSRR%201992%20Issue%202.pdf#page=43
(accessed on 27 October 2014). 18. Hollingsworth, M.D.; Shanklin, C.W.; Cross, E.W. Waste stream analyses in seven selected
school food service operations. Sch. Foodserv. Res. Rev. 1995, 19, 81–87. Available online:
http://docs.schoolnutrition.org/newsroom/jcnm/archives/SFSRR%201995%20Issue%202.pdf#page=27 (accessed on
27 October 2014). 19. Johnson, H.; Shiralipour, A.; Palmi, S. Food residuals diversion in Florida. Biocycle 1999, 40(5),
74–78.
20. Florida Department of Education (FDOE). Membership in Florida’s Public Schools, 2013–2014;
FDOE: Tallahassee, FL, USA, 2013. Available online:
http://www.fldoe.org/core/fileparse.php/7584/urlt/0069368-pk-12mem1314.xls (accessed on 27 October 2014).
21. Florida Department of Education (FDOE). Staff in Florida’s Public Schools, 2013–2014; FDOE:
Tallahassee, FL, USA, 2013. Available online:
http://www.fldoe.org/core/fileparse.php/7584/urlt/0069353-staff1314-fulltime.xls (accessed on 28 October 2014).
22. Minnesota Pollution Control Agency (MPCA). Digging Deep through School Trash: A Waste
Composition Analysis of Trash, Recycling and Organic Material Discarded at Public Schools in
Minnesota; MPCA: St Paul, MN, USA, 2010. Available online:
http://www.pca.state.mn.us/index.php/view-document.html?gid=14235 (accessed on 28 October 2014).
23. Graunke, R.E.; Wilkie, A.C. Converting food waste to biogas: Sustainable gator dining. Sustain. J.
Rec. 2008, 1, 391–394. http://dx.doi.org/10.1089/SUS.2008.9914

Sustainability 2015, 7 1387
24. Istead, L.; Shapiro, B. Recognizing the child as knowledgeable other: Intergenerational learning
research to consider child-to-adult influence on parent and family eco-knowledge. J. Res. Child.
Educ. 2014, 28, 115–127. http://dx.doi.org/10.1080/02568543.2013.851751
25. Dahlen, L.; Lagerkvist, A. Methods for household waste composition studies. Waste Manag.
2008, 28, 1100–1112. http://dx.doi.org/10.1016/j.wasman.2007.08.014
26. Dovey, T.M.; Staples, P.A.; Gibson, E.L.; Halford, J.C.G. Food neophobia and “picky/fussy”
eating in children: A review. Appetite 2008, 50, 181–193. http://dx.doi.org/10.1016/j.appet.2007.09.009
27. Getlinger, M.J.; Laughlin, C.V.T.; Bell, E.; Akre, C.; Arjmandi, B.H. Food waste is reduced when
elementary-school children have recess before lunch. J. Am. Diet. Assoc. 1996, 96, 906–908.
http://dx.doi.org/10.1016/S0002-8223%2896%2900245-3
28. Buzby, J.C.; Guthrie, J.F. Plate Waste in School Nutrition Programs: Final Report to Congress;
E-FAN-02–009; Economic Research Service/United States Department of Agriculture: Washington,
DC, USA, 2002. Available online: http://www.ers.usda.gov/media/887982/efan02009.pdf (accessed on 28
October 2014).
29. Liquori, T.; Koch, P.D.; Contento, I.R.; Castle, J. The Cookshop Program: Outcome evaluation of
a nutrition education program linking lunchroom food experiences with classroom cooking
experiences. J. Nutr. Educ. 1998, 30, 302–313. http://dx.doi.org/10.1016/S0022-3182%2898%2970339-5
30. Wansink, B.; Just, D.R.; Payne, C.R.; Klinger, M.Z. Attractive names sustain increased vegetable
intake in schools. Prev. Med. 2012, 55, 330–332. http://dx.doi.org/10.1016/j.ypmed.2012.07.012
31. United States Environmental Protection Agency (US EPA). The Food Recovery Hierarchy.
Available online: http://www.epa.gov/foodrecovery/ (accessed on 28 October 2014).
32. Graunke, R.E.; Wilkie, A.C. Examining the mechanisms of short-term solubilization of ground
food waste for high-rate anaerobic digestion. Int. Biodeterior. Biodegrad. 2014, 86, 327–333.
http://dx.doi.org/10.1016/j.ibiod.2013.10.007
33. Wilkie, A.C. Biomethane from biomass, biowaste, and biofuels. In Bioenergy; Wall, J.D.,
Harwood, C.S., Demain, A., Eds.; American Society for Microbiology: Washington, DC, USA,
2008; pp. 195–205. Available online: http://biogas.ifas.ufl.edu/publs/bioenergy_ch16_asm_press_2008.pdf
(accessed on 28 October 2014).
34. Robinson-O’Brien, R.; Story, M.; Heim, S. Impact of garden-based youth nutrition intervention
programs: A review. J. Am. Diet. Assoc. 2009, 109, 273–280.
http://dx.doi.org/10.1016/j.jada.2008.10.051 35. Florida Department of Environmental Protection (FDEP). 75% Recycling Goal Report to the
Legislature; FDEP: Tallahassee, FL, USA, 2010. Available online:
http://www.dep.state.fl.us/waste/quick_topics/publications/shw/recycling/75percent/75_recycling_report.pdf
(accessed on 28 October 2014).
© 2015 by the authors; licensee MDPI, Basel, Switzerland. This article is an open access article
distributed under the terms and conditions of the Creative Commons Attribution license
(http://creativecommons.org/licenses/by/4.0/).