Food Tourism and Culinary Tourism
219
FOOD TOURISM AND THE CULINARY TOURIST ___________________________________ A Thesis Presented to the Graduate School of Clemson University ___________________________________ In Partial Fulfillment of the Requirements for the Degree Doctor of Philosophy Parks, Recreation, and Tourism Management ___________________________________ by Sajna S. Shenoy December 2005 Advisor: Dr. William C. Norman
-
Upload
stefanie-kaye-poblete-balen -
Category
Documents
-
view
508 -
download
8
Transcript of Food Tourism and Culinary Tourism
FOOD TOURISM AND THE CULINARY TOURIST
___________________________________
A Thesis
Presented to
the Graduate School of
Clemson University
___________________________________
In Partial Fulfillment
of the Requirements for the Degree
Doctor of Philosophy
Parks, Recreation, and Tourism Management
___________________________________
by
Sajna S. Shenoy
December 2005
Advisor: Dr. William C. Norman
ABSTRACT
The subject matter of this dissertation is food tourism or tourists’ participation in
`food related activities at a destination to experience its culinary attributes. In addition,
the culinary tourist or the tourist for whom food tourism is an important, if not primary,
reason influencing his travel behavior, is its focus.
The empirical objectives of this dissertation concerned identifying the underlying
dimensions of food tourism, developing a conceptual framework that explains
participation in food tourism, develop taxonomy of food tourists by segmenting the
tourists based on their participation in food tourism, and finally identifying the variables
that predict membership in these food tourist segments. The effect of sociodemographic
variables on participation in food tourism, and their association with the food tourist
segments were also examined. Further, all the findings were analyzed within the
theoretical framework of the world culture theory of globalization and the cultural capital
theory.
Based on the survey responses of 341 tourists visiting the four coastal counties of
South Carolina, the analyses revealed that food tourism is composed of five dimensions
or classes of activities. These include dining at restaurants known for local cuisines,
purchasing local food products, consuming local beverages, dining at high quality
restaurants, and dining at familiar chain restaurants and franchises. The conceptual
variables significant in explaining participation in food tourism were food neophobia,
variety-seeking, and social bonding. The sociodemographic variables that effect
participation in food tourism were age, gender, education, and income.
iii
Segmentation of tourists revealed the presence of three clusters: the culinary
tourist, the experiential tourist, and the general tourist. The culinary tourist was identified
as the tourist who, at the destination, frequently dines and purchases local food, consumes
local beverages, dines at high-class restaurants, and rarely eats at franchisee restaurants.
In addition, the culinary tourist segment was more educated, earned higher income than
the other two segments, and was characterized by its variety-seeking tendency towards
food and absence of food neophobia.
The dissertation’s findings highlight the role of diverse culinary establishments
(restaurants, farmer’s market, pubs etc.) that contribute to the food tourist experience, and
emphasize the importance of destination marketing organizations and the small and
medium enterprises working in tandem. Further, the findings also suggest that
destinations targeting the culinary tourism market should articulate the availability of
indigenous local dishes, varied culinary cultures and food tourism activities.
The evidence that the fundamental structure of food tourism revolves around the
local, along with the presence of eating familiar food at chain and franchisees, as a
dimension of food tourism, shows that the dialectics between the local and the global is at
play, lending credence to the implications of the globalization theory to the food tourism
context. The findings also support the use of cultural capital theory in explaining the
culinary tourists, as seen by their possession of the indicators of cultural capital, namely
an advanced education, and ‘cultural omnivorousness’ typified by their variety-seeking
tendency.
TABLE OF CONTENTS
............................................................................................................................ Page
TITLE PAGE ........................................................................................................... i ABSTRACT ............................................................................................................. ii DEDICATION ........................................................................................................ iv ACKNOWLEDGEMENTS ..................................................................................... v CHAPTER
1. INTRODUCTION ......................................................................................... 1
1.1 Food and Tourism: What is the Connection? ........................................ 1 1.2. Culinary Tourism as Special Interest Tourism ..................................... 4 1.3 Food Consumption and the Social Sciences .......................................... 7 1.4 Problem Statement ................................................................................. 12 1.5 Objectives of the Study .......................................................................... 13 1.6 Research Questions for the Dissertation ................................................ 15 1.7 Delimitations and Limitations ................................................................ 16 1.8 Definitions .............................................................................................. 17 1.9 Organization of the Dissertation ............................................................ 19
2. LITERATURE REVIEW AND CONCEPTUAL DEVELOPMENT ........... 20
2.1 World Culture Theory of Globalization ................................................. 20 2.2 Theory of Cultural Capital ..................................................................... 24 2.3 Towards a Theory of Tourist Food Consumption .................................. 29 2.4 Conceptual Development ....................................................................... 31 2.5 Sociodemographic Status and Food consumption ................................. 56 2.6 Synopsis of the Chapter ......................................................................... 60
3. RESEARCH METHODS .............................................................................. 61
3.1 Presentation of the Hypotheses .............................................................. 61 3.2 Questionnaire construction .................................................................... 66 3.3 Research Design ..................................................................................... 78 3.4 Data Collection Process ......................................................................... 80 3.5 Statistical Approach to Hypotheses ....................................................... 82 3.6 Synopsis of the Chapter ......................................................................... 89
v
Table of Contents (Continued)
Page
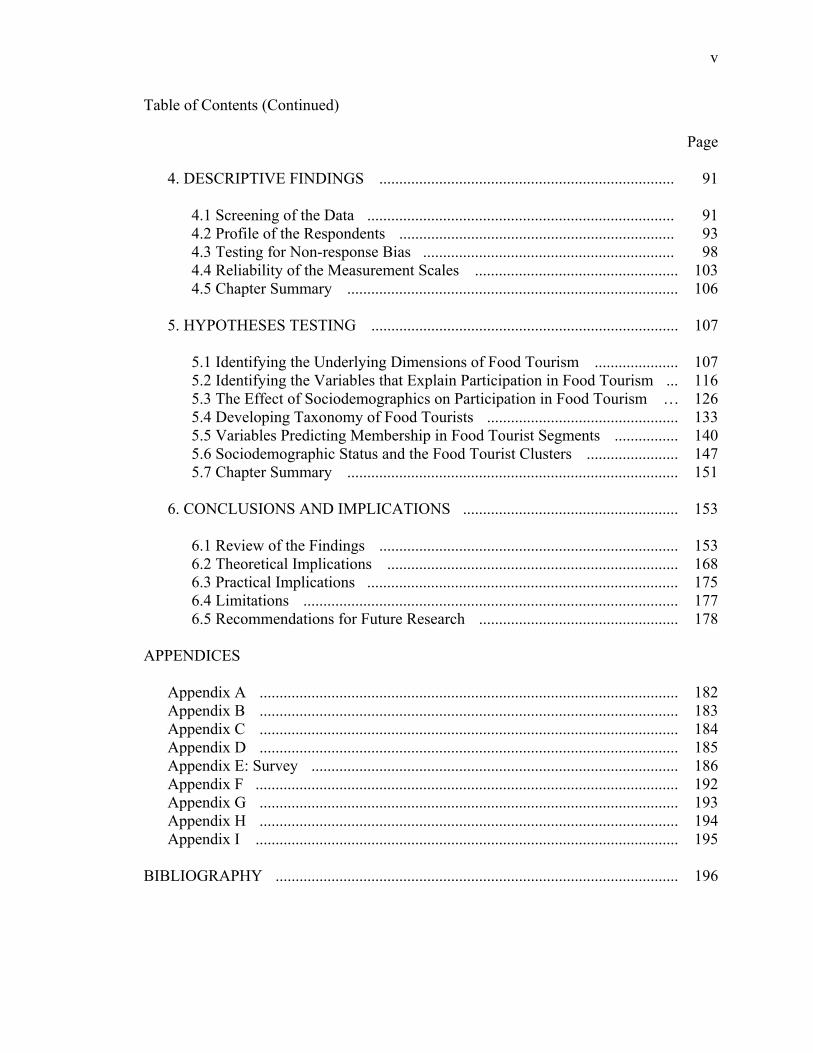
4. DESCRIPTIVE FINDINGS .......................................................................... 91
4.1 Screening of the Data ............................................................................. 91 4.2 Profile of the Respondents ..................................................................... 93 4.3 Testing for Non-response Bias ............................................................... 98 4.4 Reliability of the Measurement Scales ................................................... 103 4.5 Chapter Summary ................................................................................... 106
5. HYPOTHESES TESTING ............................................................................. 107
5.1 Identifying the Underlying Dimensions of Food Tourism ..................... 107 5.2 Identifying the Variables that Explain Participation in Food Tourism ... 116 5.3 The Effect of Sociodemographics on Participation in Food Tourism…… ...126 5.4 Developing Taxonomy of Food Tourists ................................................ 133 5.5 Variables Predicting Membership in Food Tourist Segments ................ 140 5.6 Sociodemographic Status and the Food Tourist Clusters ....................... 147 5.7 Chapter Summary ................................................................................... 151
6. CONCLUSIONS AND IMPLICATIONS ...................................................... 153
6.1 Review of the Findings ........................................................................... 153 6.2 Theoretical Implications ......................................................................... 168 6.3 Practical Implications .............................................................................. 175 6.4 Limitations .............................................................................................. 177 6.5 Recommendations for Future Research .................................................. 178
APPENDICES
Appendix A ......................................................................................................... 182 Appendix B ......................................................................................................... 183 Appendix C ......................................................................................................... 184 Appendix D ......................................................................................................... 185 Appendix E: Survey ............................................................................................ 186 Appendix F .......................................................................................................... 192 Appendix G ......................................................................................................... 193 Appendix H ......................................................................................................... 194 Appendix I .......................................................................................................... 195
BIBLIOGRAPHY ..................................................................................................... 196
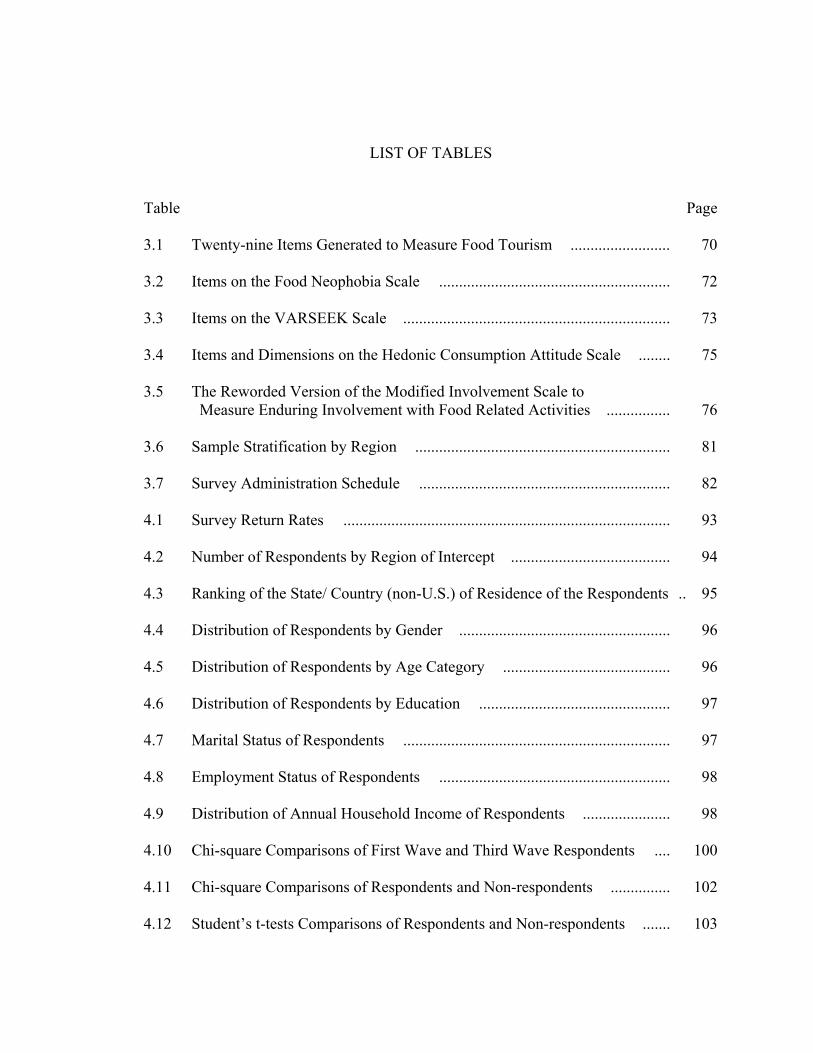
LIST OF TABLES
Table .............................................................................................................................. Page
3.1 Twenty-nine Items Generated to Measure Food Tourism ......................... 70 3.2 Items on the Food Neophobia Scale .......................................................... 72 3.3 Items on the VARSEEK Scale ................................................................... 73 3.4 Items and Dimensions on the Hedonic Consumption Attitude Scale ........ 75 3.5 The Reworded Version of the Modified Involvement Scale to Measure Enduring Involvement with Food Related Activities ................ 76 3.6 Sample Stratification by Region ................................................................ 81 3.7 Survey Administration Schedule ............................................................... 82 4.1 Survey Return Rates .................................................................................. 93 4.2 Number of Respondents by Region of Intercept ........................................ 94 4.3 Ranking of the State/ Country (non-U.S.) of Residence of the Respondents .. 95 4.4 Distribution of Respondents by Gender ..................................................... 96 4.5 Distribution of Respondents by Age Category .......................................... 96 4.6 Distribution of Respondents by Education ................................................ 97 4.7 Marital Status of Respondents ................................................................... 97 4.8 Employment Status of Respondents .......................................................... 98 4.9 Distribution of Annual Household Income of Respondents ...................... 98 4.10 Chi-square Comparisons of First Wave and Third Wave Respondents .... 100 4.11 Chi-square Comparisons of Respondents and Non-respondents ............... 102 4.12 Student’s t-tests Comparisons of Respondents and Non-respondents ....... 103
vii
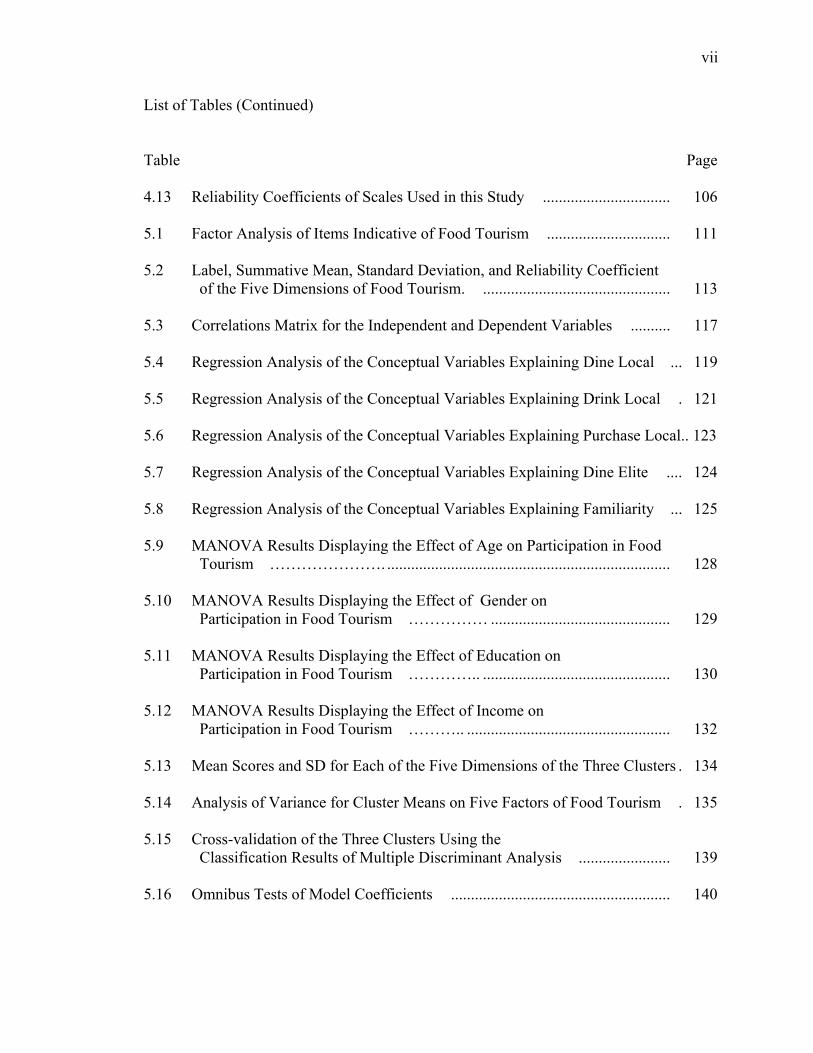
List of Tables (Continued) Table ............................................................................................................... Page 4.13 Reliability Coefficients of Scales Used in this Study ................................ 106 5.1 Factor Analysis of Items Indicative of Food Tourism ............................... 111 5.2 Label, Summative Mean, Standard Deviation, and Reliability Coefficient of the Five Dimensions of Food Tourism. ............................................... 113 5.3 Correlations Matrix for the Independent and Dependent Variables .......... 117 5.4 Regression Analysis of the Conceptual Variables Explaining Dine Local ... 119 5.5 Regression Analysis of the Conceptual Variables Explaining Drink Local . 121 5.6 Regression Analysis of the Conceptual Variables Explaining Purchase Local.. 123 5.7 Regression Analysis of the Conceptual Variables Explaining Dine Elite .... 124 5.8 Regression Analysis of the Conceptual Variables Explaining Familiarity ... 125 5.9 MANOVA Results Displaying the Effect of Age on Participation in Food Tourism …………………. ....................................................................... 128 5.10 MANOVA Results Displaying the Effect of Gender on Participation in Food Tourism …………… ............................................. 129 5.11 MANOVA Results Displaying the Effect of Education on Participation in Food Tourism ………….. ............................................... 130 5.12 MANOVA Results Displaying the Effect of Income on Participation in Food Tourism ……….. ................................................... 132 5.13 Mean Scores and SD for Each of the Five Dimensions of the Three Clusters . 134 5.14 Analysis of Variance for Cluster Means on Five Factors of Food Tourism . 135 5.15 Cross-validation of the Three Clusters Using the Classification Results of Multiple Discriminant Analysis ....................... 139 5.16 Omnibus Tests of Model Coefficients ....................................................... 140
viii
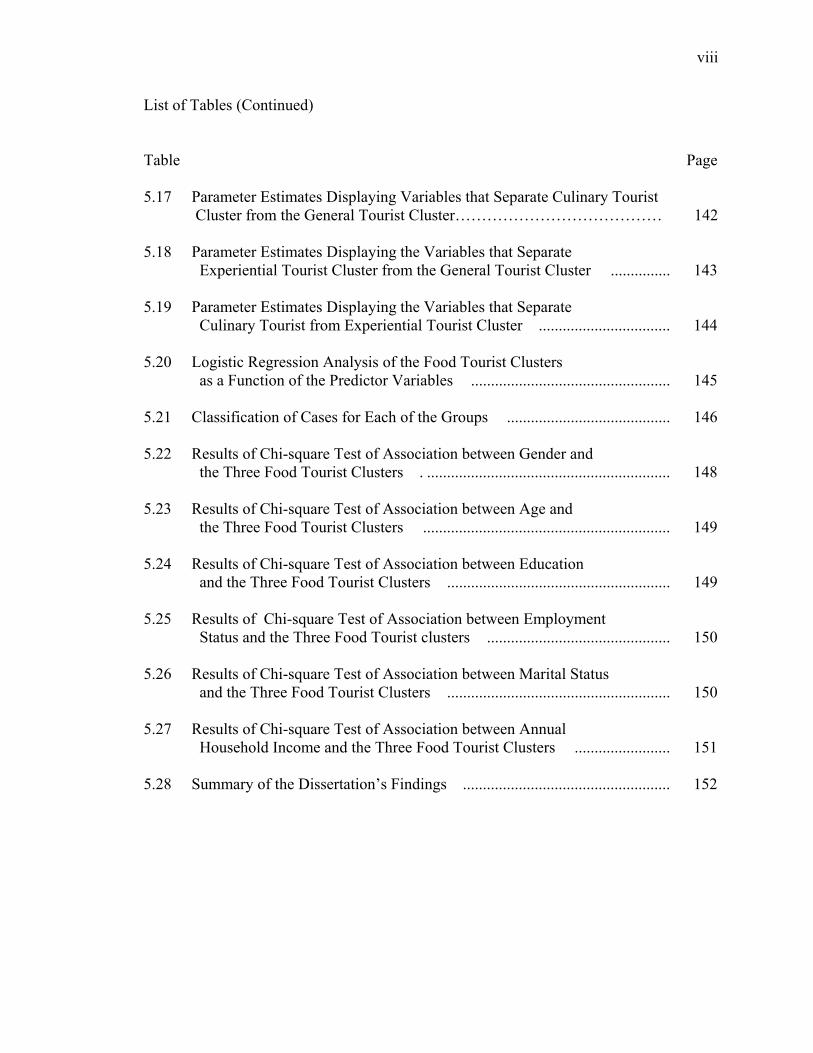
List of Tables (Continued) Table ............................................................................................................... Page 5.17 Parameter Estimates Displaying Variables that Separate Culinary Tourist Cluster from the General Tourist Cluster………………………………………142 5.18 Parameter Estimates Displaying the Variables that Separate Experiential Tourist Cluster from the General Tourist Cluster ............... 143 5.19 Parameter Estimates Displaying the Variables that Separate Culinary Tourist from Experiential Tourist Cluster ................................. 144 5.20 Logistic Regression Analysis of the Food Tourist Clusters as a Function of the Predictor Variables .................................................. 145 5.21 Classification of Cases for Each of the Groups ......................................... 146 5.22 Results of Chi-square Test of Association between Gender and the Three Food Tourist Clusters . ............................................................. 148 5.23 Results of Chi-square Test of Association between Age and the Three Food Tourist Clusters .............................................................. 149 5.24 Results of Chi-square Test of Association between Education and the Three Food Tourist Clusters ........................................................ 149 5.25 Results of Chi-square Test of Association between Employment Status and the Three Food Tourist clusters .............................................. 150 5.26 Results of Chi-square Test of Association between Marital Status and the Three Food Tourist Clusters ........................................................ 150 5.27 Results of Chi-square Test of Association between Annual Household Income and the Three Food Tourist Clusters ........................ 151 5.28 Summary of the Dissertation’s Findings .................................................... 152
LIST OF FIGURES
Figure ............................................................................................................................. Page
2.1 Proposed Conceptual Framework for Explaining Participation in Food Tourism ................................................................... 52 5.1 Line Graph of the Mean Scores on each Dimensions of Food Tourism for the Three Food Tourist Clusters ............................... 138 6.1 The Revised Conceptual Model that Explains Food Tourism . .................. 173
CHAPTER ONE
1. INTRODUCTION
1.1 Food and Tourism: What is the Connection?
Consumption is an integral aspect of the tourist experience, with the tourist
consuming not only the sights and sounds, but also the taste of a place. Nearly, all tourists
eat and dine out. Food is a significant means to penetrate into another culture as “…it
allows an individual to experience the ‘Other’ on a sensory level, and not just an
intellectual one” (Long, 1998, p.195). Local food is a fundamental component of a
destination’s attributes, adding to the range of attractions and the overall tourist
experience (Symons, 1999). This makes food an essential constituent of tourism
production as well as consumption.
Dining out is a growing form of leisure where meals are consumed not out of
necessity but for pleasure, and the atmosphere and occasion are part of the leisure
experience as much as the food itself. A recent profile of the tourists by the U.S.
Department of Commerce, Office of Travel and Tourism Industries (OTTI) shows that
dining in restaurants was ranked as the second most favorite activity by the overseas
visitors to the U.S. (Appendix A) and the number one favorite recreational/ leisure
activity by U.S. travelers visiting international destinations (Appendix B).
However, when it comes to tourists, dining out can both be a necessity and a
pleasure. While some tourists dine to satisfy their hunger, others dine at a particular
restaurant to experience the local food and cuisine, because for the latter these form an
2
important component of their travel itinerary. This makes the study of tourists’ food
consumption interesting as well as complex.
The growth of eating out as a form of consumption and the market forces of
globalization have made the food products and cuisines from all over the world more
accessible. This has stimulated the emergence of food as a theme in magazines (Cuisine,
Gourmet Traveler, Food and Travel), radio shows (Chef’s Table, Splendid Table), and
television, particularly cable television, with food shows focusing on travel and travel
shows on food. In fact, the popularity of twenty-four hour television channels, such as the
Food Network devoted to food and the place that food comes from, intertwines food with
tourism so much that quite often it is hard to determine whether one is watching a food
show or a travel show.
Such developments have spurred an interest in experiencing the unique and
indigenous food, food products and cuisines of a destination, so much so that people are
often traveling to a destination specifically to experience the local cuisines or to taste the
dishes of its ‘celebrity chef’ (Mitchell & Hall, 2003). Traveling for food has taken an
entirely new meaning from what it used to when voyages were undertaken for spice trade,
but voyagers still carried dried food, as the local cuisines were looked upon with
suspicion (Tannahill, 1988). The importance of local cuisines to tourists today is
demonstrated by the results of a survey of visitors to Yucatan Peninsula where 46% of
the meals consumed by the tourists were local cuisines (Torres, 2002).
From an economic point of view, nearly 100% of tourists spend money on food at
their destination. Data shows that more than two-thirds of table-service restaurant
operators reported that tourists are important to their business, with check sizes of US$25
3
or above coming from tourists (National Restaurant Association, 2002). In Jamaica, for
example, the daily expenditure on food by the tourist is five times greater than that of the
average Jamaican (Belisle, 1984). According to Pyo, Uysal, and McLellan (1991),
among all possible areas of expenditures while traveling, tourists are least likely to make
cuts in their food budget. All these suggest that tourists’ food consumption makes a
substantial contribution to the local restaurants, dining places, the food industry, and
thereby the destination’s economy.
In an increasingly competitive world of tourism marketing, every region or
destination is in a constant search for a unique product to differentiate itself from other
destinations. Local food or cuisines that are unique to an area are one of the distinctive
resources that may be used as marketing tools to get more visitors. This is particularly
evident from the studies on wine tourism (Charters & Ali-Knight, 2002; Hall &
Macionis, 1998; Telfer, 2001), which have demonstrated that tourists travel to
destinations that have established a reputation as a location to experience quality local
products (e.g., Napa Valley in California, Provence in France, Niagara in Ontario, Yarra
Valley in Victoria, Australia).
Countries like Canada and Australia have already begun to target the culinary
tourism segment in their marketing strategy promoting local cuisines to their tourists as a
main part of their tourism policy. The Canadian Tourism Commission has identified
culinary tourism as an important component of the rapidly growing cultural tourism
market. So has the Tourism Council of Tasmania. The Council adopted a strategy in 2002
to develop high quality wine and food tourism experiences, events and activities, and a
multi-regional approach. This has resulted in longer stays and increased visitor spending,
4
resulting in benefits to the local agriculture and the local economy (Tourism Council of
Tasmania, 2002).
Finally, a relevant example of the economic importance of local food products to
tourism is the case of the Southern Seafood Alliance in South Carolina. The organization
funded projects, including this dissertation, with the goal of developing strategies to make
consumption of South Atlantic wild-caught shrimp an integral element of South Carolina
coastal tourism experience. The project’s ultimate objective was to revive the struggling
local shrimp industry through tourism.
1.2. Culinary Tourism as Special Interest Tourism
The growth of special interest tourism is seen as a reflection of the increasing
diversity of leisure interests of the early twenty-first century leisure society ( Douglas,
Douglas, & Derret, 2001). Post-modern tourism is slowly moving away from the ‘Four
S’s of Tourism’ (sun, sand, sex, and surf), to being a part of an overall lifestyle that
corresponds to people’s daily lives and activities (Hobson & Dietrich, 1994). The growth
of culinary tourism is seen as an outcome of a trend where people spend much less time
cooking, but choose to pursue their interest in food as a part of a leisure experience such
as watching cooking shows, dining out and the like (Sharples, 2003).
Leisure researchers have studied special interest tourism like ecotourism (Acott,
Trobe, & Howard, 1998) and wine tourism (Charters & Ali-Knight, 2002) to show how
tourists may be segmented based on their activities along the ‘tourism interest continuum’
(Brotherton & Himmetoglu, 1997). The culinary tourist is thus a special interest tourist
whose interest in food is the primary reason influencing his travel behavior and falls on
5
the upper end of the food tourism interest continuum. At the same time, eating and
drinking being ultimately cultural affairs (Murcott, 1986), the culinary tourist is also a
cultural tourist. Thus, the obvious overlap of food as a special interest component as well
as a cultural component makes the culinary tourist possibly both a special interest tourist
and a cultural tourist.
A survey of Special Interest Tours on the internet demonstrates that there are
numerous tour operators conducting culinary tours as well as the more popular wine tours.
An examination of these websites reveals that the culinary tours can be roughly classified
into three types. These are: 1) the cooking school holidays, 2) dining at restaurants
famous for their local cuisines or their celebrity chefs and visiting food markets, and 3)
visiting food producers with tours specifically related to just one product (e.g. coffee
plantation tours, tea plantation tours, chocolate lovers tours, the ubiquitous wine tours,
and the like). Most culinary tours include a combination of all three types.
The cost of a normal six day cooking school tour can range from US$ 1500 for
the more popular destinations like France (Provence), Italy (Piedmont, the Italian Riviera,
Sicily, Tuscany, and Venice), and Spain, to US$ 5000 for South Africa and Australia,
which have recently entered the international wine tourism market. These tours usually
include demonstrations by celebrity chefs (where the tourist may be a participant), wine
tasting at vineyards, and visits to places known for its art, history, and culture. Thus, the
cooking school holiday spectrum covers a wide range from rural to urban, field- based to
school-based, single commodity to multi–commodity, residential to non- residential, and
total holiday to a part of holiday experience (Sharples, 2003).
6
The second type of culinary tours is one where the itineraries chiefly include
visiting restaurants, local food producers, and food markets. Though the Californian Napa
and Sonoma Valleys and the wine country have recently become extremely popular,
other popular destinations for such tours are Spain, Portugal, France, Oaxaca (Mexico),
Morocco and Canada. Other than eating at restaurants known for their distinctive local
cuisines, a customized tour, for example, might include olive oil tasting in Italy, cheese
tasting in France, and the popular Tapas Tours in Spain. Variations of such culinary
tours, for the more adventurous, may include cycling and walkabout gourmet
explorations throughout the gourmet regions. For the less adventurous or for the traveler
with a lower budget, cities like San Francisco and New York with their ethnic
communities such as Little Italy and China Town, offer such experiences within one’s
own country or city. In addition, events like Taste of Chicago, where almost a hundred
restaurants come together to display their best chefs and the food associated with the
city’s ethnic diversity, present a wonderful opportunity for culinary tourism experience.
The third type of culinary tours is the extremely specialized tour pertinent to just
one product alone. Examples of these are the Coffee Tours to Costa Rica, Nicaragua,
Peru, Panama, Peru, Brazil, and Ethiopia. Here, the culinary tourists indulge in coffee
tasting, or on-site experiences such as coffee picking and sorting, or learn about the
history of coffee through guided tours in coffee museums. Similarly, Tea Tours in Sri
Lanka and Japan offer tea plantations as attractions with tea museums dedicated to
exhibiting the details of tea cultivation, production and manufacturing, along with tours
of tea plantations, demonstrations of tea ceremonies, and tearooms. Another popular
product-related tour is the Chocolate Tours of Belgium and Switzerland that offer similar
7
experiences for chocolate lovers. Thus, culinary tourism satisfies the motive of
combining love for food and travel.
1.3 Food Consumption and the Social Sciences
Ritchie & Zins (1978) list food as one of the components of cultural tourism,
implying that food is representative of a culture. One of the dominant approaches in the
social sciences used to explain food consumption is the cultural approach, with the others
being the economic and the psychological. Food theorists in the disciplines of
anthropology, discursive psychology, and sociology have contributed significantly with
their disciplinary perspectives on food consumption.
Anthropology, specifically social anthropology, accounts for the majority of
cultural studies on food. The symbolic structuralist perspective analyzes food
consumption as a psychological and behavioral system that originates in the human brain
and how food transforms from a natural object to a cultural one (Levi-Strauss, 1966). The
cultural materialistic perspective of Douglas (1975) examines the role of food as a code
conveying information about social events and social relations and the commonalities of
the structure of each meal across culture. The discipline of discursive psychology, food
semiology in particular, inspects how foods and food preparation rituals of a given
society represent a linguistic system, conveying social information that helps create and
maintain its social identity (Barthes, 1973).
The sociology of food consumption mostly looks into whether the social patterns
of food consumption are shaped by the ‘structure’ of society, or whether they are shaped
8
actively by the actions of the ‘agents’ or members of the society (Germov & Williams,
1999; McIntosh, 1996). In particular, sociological research pertinent to food consumption
has dealt with determination of interrelationships between food and cultures (Goody,
1982; Mennell, 1985), food habits as a function of changing environmental, social and
ecological conditions ( Mennell, 1992), food consumption as a means of social
differentiation (Bourdieu, 1984 (1979); Warde, 1997), and the impact of modernization
and globalization on food consumption (Ritzer, 1996,1999; Ritzer, Goodman, &
Wiedenhoft, 2001). According to McIntosh (1996) and Germov and Williams (1999), the
theories of globalization and the theories of social differentiation are useful in explaining
the trends in modern food consumption.
Food theorists, however, have normally confined themselves to studying
consumption patterns within structured environments like the home, family dinners,
festivals and restaurants with hardly any reference at all to the tourists. Studying tourists’
food-related activities is unique in that the tourists leave their structured environments,
where the demands of the tourist lifestyle prevent them from going through the normal
eating rituals thus forcing them to make do with what is available. Structure, which
appear as a result of rules governing presentation, varieties and rules of precedence and
combination of food (Douglas, 1975; Marshall, 1993) is mostly overlooked by the
tourists. The role of food alters in that consumption of food becomes a form of recreation
as well as an important component of overall tourist activity and experience.
9
1.3.a Food Consumption and Globalization Theories
The modern macro-sociological theories of globalization have been used to
explain the dramatically changing food consumption patterns all over the world.
Globalization has been attributed to the destruction of food related traditions like home
cooking and individualized family restaurants while increasing nutritional issues and
concerns such as balanced and healthy diet. The world cultural theory, one of the theories
of interpreting globalization, defines globalization as “the diffusion of practices, values
and technology that have an influence on people’s lives worldwide” (Albrow, 1997, p.88
and “the compression of the world and the intensification of consciousness of the world
as whole”(Robertson, 1992, p.8).
According to this theory, there is a constant struggle between the homogenizing
forces of globalization and its oppositional dynamics of heterogenization, and the
resistance to the global from the local. So, on one hand, there is the proliferation of chain
restaurants, pre-cooked and processed foods, foreign foods, and ethnic restaurants all
over the world, resulting in a more ‘globalized palate.’ On the other hand, there is a
considerable effort to re-establish and articulate the local food systems, resulting in the
continuation or resurgence of the local cuisines (Henderson, 1998; Lang, 1999). The
emphasis of the globalization theory is on the dynamics of opposing processes and not on
the outcome.
With respect to tourism, even though tourists come across potentially unfamiliar
foods to a greater degree at the destination than at home, globalization with its time and
space compression has permitted more people to experience ethnic and foreign foods at
their home. This begs a question as to how the tourist’s need for novelty, change, and the
10
exotic is satisfied, when diversity is being supplanted by uniformity, predictability, and
familiarity. Furthermore, with dining becoming a recreational tourist activity and
destinations marketing local food as a tourist attraction, the concept of globalization
questions the strength of the classic hypothesis of tourist seeking experiences not
available in daily life (Richards, 2002). Thus, there is a quandary in the impact of
globalization for tourism in that as foodways become global, there is a problem for
destinations promoting tourism to stress the uniqueness of their local cuisines to those
who can taste the same at home.
The globalization theory of world culture (Robertson, 1992), which encompasses
the homogeneity versus the heterogeneity dispute (Robertson, 1995) and the significance
of the local as an essential ingredient of the overall globalization process (Robertson,
1997), theorizes how globalization is actually presenting people with diverse experiences
despite the convergence in tastes. The emphasis on eating the cuisine where it is native
rather than the processed food via franchising worldwide, the growing resurgence of the
local through resistance movements like the Slow Cities and Slow Food which offer the
tourists a taste of ‘real’ local food, are all example of the dialectical relationship between
globalization and localization. The globalization theory is hence employed in this
dissertation to analyze the role of macro-structural forces in explaining food tourism.
1.3.b Food Consumption and Theories of Social Differentiation
While theories of globalization explain how structural forces operating on a macro-level
influence our consumption, the theories of social differentiation explain consumption
patterns on the micro-level. The theories of social differentiation examine how food is
11
used as a means to maintain and establish hierarchy, inclusion and exclusion, social
distinction, and self-identity, thereby reinforcing symbolic boundaries and conveying
social information. Cultural capital theory (Bourdieu, 1984), a theory of social
differentiation, has been often used by sociologists (Germov & Williams, 1999;
McIntosh, 1996; Warde, 1997; Warde & Martens, 2000) to explain why different patterns
of consumption exist within a society.
Cultural capital theory treats the physical necessity of eating as a cultural practice,
and food as one of the cultural resources by which people maintain a symbolic distance,
social stratification, and quite often even social exclusion. Cultural capital is not the
prerogative of the rich and the elite, who are endowed with economic capital, but it is
transmitted through: 1) endowed or symbolic form as internalized culture, 2) objectified
form in material objects and media, and 3) institutionalized form like education and
degree certificates. With respect to food, possession of cultural capital is manifested in a
refined sense of taste and a quest and appreciation for obscure local, regional foods and
distinctive cuisines that suggest cultural heritage (Pietrykowski, 2004).
The cultural capital theory (Bourdieu, 1984), with its underlying assumption
about developing familiarity, interest, involvement and knowledge about certain cultural
products as a means to maintain social stratification systems, is proposed as an
explanation of the emergence of food tourism and the culinary tourist. Eating is more
than just a biological act, and the tourist deploys as well as accrues cultural capital by
participating in food tourism, with food being a source of pleasure, as well as a cultural
resource.
12
Tourism researchers have stressed the importance of analyzing the tourist both at
the micro–level as well as at the structural macro-level for the theoretical framework to
be relevant and to provide a broader social context to explain tourist experiences
(McGehee, 1999; Pearce, 1993; Sharpley, 1999). Food theorists in sociology have also
stressed on the need to study food consumption, combining both the macro and micro-
level (Germov & Williams, 1999; McIntosh, 1996). Using this approach to the theoretical
framework, the current investigation uses the macro-sociological theory of globalization
and the micro-sociological theory of cultural capital as the two overarching theories to
understand and explain food tourism.
1.4 Problem Statement
In the book Food Tourism around the World, Mitchell and Hall (2003) state:
“Studies of consumer behavior in the area of food tourism are rare and, as
a result, the picture we have of the food tourist, is at best sketchy, and
considerable amount of research is required to understand food tourism
consumer behavior more effectively. To date the material that does exist
has been borrowed from more general tourism studies or has been inferred
from studies not directly related to tourism” (p.80).
This quote illustrates the relevance of the current investigation to the tourism literature.
Empirical evidence of the culinary tourist and activities that constitute food
tourism is difficult to locate, although there are anecdotal references in the literature
connecting food and tourism. Food has been viewed as a necessary element of survival,
and probably as a component of another attraction such as food in festivals, but has
13
hardly been studied as an attraction or as a tourist recreational activity by itself (Smith,
1983). Food and dining is typically lumped together with accommodations in an
assemblage of tourism statistics (Selwood, 2003). In general, food has been the
overlooked, unsung component and largely a terra incognita of tourism research.
Studies in tourism where food has been the focus of research have mainly been
case studies (Boniface, 2003; Hall, Sharples, Mitchell, Macionis, & Cambourne, 2003;
Hjalager & Richards, 2002; Telfer & Hashimoto, 2003) and ethnographies (Long, 1998,
2004). These studies have contributed to the field by providing analysis of the
relationship between food and tourism with practical examples of success stories of cities
and countries that have used culinary tourism as a positioning strategy. In addition, they
have attempted to define the parameters within which to study food in tourism. However,
the data that is available on food-centric tourism activities is disparate and owes its origin
to unrelated range of sources.
Thus, there is a need for conceptually based research set in a positivistic paradigm
within the framework of social sciences that empirically examines food tourism and
identifies the characteristics of culinary tourist. The obvious lacuna that exists in terms of
research that specifically examines food in tourism needs to be addressed. This
dissertation contributes to that end.
1.5 Objectives of the Study
For the purposes of this dissertation, food tourism is defined as tourist’s food
related activities at the destination, such as dining, purchasing local food products, and
experiencing the characteristics of a unique food-producing region. In addition, the
14
culinary tourist is defined as the special interest tourist whose major activities at the
destination are food-related and for whom food tourism is an important, if not primary,
reason influencing his travel behavior.
The goals of this dissertation are two-fold. The first objective is pertinent to food
tourism. It is concerned with identifying the underlying dimensions of food tourism.
Drawing from tourism literature that focuses on food, a conceptual framework is
proposed and tested to identify the concepts that explain participation in food tourism.
The second objective concerns the culinary tourist market segment. It involves
classification of tourists based on their participation in food tourism and identification of
the culinary tourist. Finally, the variables that predict membership in the food tourist
segments are determined.
Further, using theoretical pluralism, this dissertation combines the theoretical
framework of globalization and cultural capital to understand food tourism. However, the
purpose of this dissertation is not to test the two theories, but to use them as overarching
theories to explain food tourism. The theoretical and empirical objectives of the
dissertation are outlined as follows:
Theoretical Objectives:
1. To understand how the world culture theory of globalization and the cultural
capital theory together contribute to the explanation of food tourism.
Empirical Objectives:
1. To determine the underlying dimensions of food tourism;
2. To formulate and test a conceptual framework to identify the variables that
explain participation in food tourism;
15
3. To examine the effect of the sociodemographic variables on participation in food
tourism;
4. To develop a taxonomy of tourists based on their participation in food tourism;
5. To identify the variables that predict membership in the food tourist clusters;
6. To examine significant association between sociodemographic variables and the
food tourist clusters.
1.6 Research Questions for the Dissertation
The research questions that arise out of the empirical objectives of the dissertation
are stated next:
1. What are the underlying dimensions of food tourism?
2. What variables explain participation in food tourism?
3. Are there any differences in participation in food tourism with respect to age,
gender, marital status, occupation, education, annual income?
4. Can tourists be segmented into homogenous groups based on their participation in
food tourism?
5. What variables predict membership in each of the food tourist clusters (arrived at
as a result of the classification of tourists based on their participation in food
tourism)?
6. Is there an association between the food tourist clusters and age, gender, marital
status, occupation, education, and annual income of the tourists?
Propositions are developed and stated for each of these research questions in
Chapter Two along with the literature review, which provides a conceptual foundation for
16
the dissertation’s hypotheses. The hypotheses are presented in Chapter Three. The
outcome of the hypotheses testing is finally explained within the framework of the two
theories in Chapter Six.
1.7. Delimitations and Limitations
The dissertation is subject to following delimitations:
1. The dissertation is delimited to tourists visiting the four coastal counties of South
Carolina;
2. The dissertation does not take into account the amount of money spent by the
tourists on food and food-related activities;
3. The dissertation is limited to tourists vacationing during the summer season only;
4. The dissertation does not explore and identify the primary travel motivations of
the tourists with respect to food, and limits itself to tourists’ participation in food
related activities.
5. The dissertation limits itself to being an empirical generalization and does not test
any theory/ theories.
17
1.8 Definitions
Tourism: According to Mathieson and Wall, 1982 “The temporary movement of people
to destinations outside their normal places of work and residence, the activities
undertaken during their stay in those destinations, and the facilities created to cater to
these needs” (Gunn, 1988, p.2).
Food Tourism: The tourist’s food related activities at a destination, such as dining,
purchasing local food products or food pertinent products, and experiencing the
characteristics of a unique food-producing region.
Special Interest Tourism: When satisfying particular leisure pursuit or interest is the
major motive influencing travel behavior and sometimes even selection of a destination
for pleasure travel.
Culinary Tourist: A special interest tourist, whose major activities at the destination are
food-related, and for whom food tourism is an important, if not primary, reason
influencing his travel behavior.
Cultural Tourism: Visiting a place with a motivation to explore and immerse intentionally
to learn about aspects of culture like customs, arts, heritage, and lifestyle in an informed
way.

18
Other: “the anthropological notion of humans defining the world according to their own
socially constructed perceptions of reality, perceptions that divide the world into the
known and the familiar as opposed to the unknown or the other” (Long, 2004, p.23)
Foodways: The culinary culture of a region or a country that includes its cuisines, the
eating practices of its people, and its culinary history and heritage.
Globalization: Combining the definitions of Robertson (1992 p.8) and Albrow (1997,
p.88) “Diffusion of practices, values and technology due to spatio–temporal compression
of the world, resulting in the intensification of consciousness of the world as a whole.”
Cultural Capital: The accumulation of knowledge of cultural practices, its symbolic
mastery, and the ability to perform tasks in culturally acceptable ways and participate in
high culture events.
Structure: The social force that determines the way the society is organized through
social institutions and social groups, resulting in predictable patterns of social interaction.
Agency: The ability of people, individually and collectively, to influence their own lives
and the society in which they live.
19
1.9 Organization of the Dissertation
Chapter One presented an introduction to this dissertation, discussed the role of
food in tourism, and the emergence of the niche travel market of culinary tourism. It
briefly discussed the relevance of the theories of globalization and cultural capital in
explaining food consumption, and their potential in explaining food tourism. In addition,
the problem statement, the objectives, the research questions that arise out of the
objectives of the dissertation, the key terms, delimitations and limitations were defined.
In Chapter Two, the theories of globalization and cultural capital are reviewed.
Next, the literature where the twin themes of food and tourism intermingle is reviewed
with an aim to answer the research questions that were presented in Chapter One. At
appropriate points in the text, the major propositions arrived at after the literature review
are presented and finally summarized as the conceptual framework that explains
participation in food tourism.
Chapter Three presents the hypotheses for each of the research questions of the
dissertation, discusses the methodology employed for the current dissertation, and
presents the operationalization of the variables. Chapter Four reports the descriptive
results of the research. Chapter Five discusses the results from the testing of conceptual
framework and the segmentation of the tourists, and other hypotheses.
Chapter Six concludes the dissertation by summarizing the findings, discussing
their implications, and offering suggestions for further research.
CHAPTER TWO
2. LITERATURE REVIEW
AND
CONCEPTUAL DEVELOPMENT
This chapter is divided into two sections. The first section reviews the two main
theories of consumption, the world culture theory of globalization and the cultural capital
theory, to offer a theoretical explanation for tourist food consumption. The second section
demonstrates how the review of tourism literature that focus on food resulted in the
formulation of the research propositions and a conceptual framework that explains
participation in food tourism. In the final section, the relevance of socioeconomic and
demographic status in tourist food consumption is reviewed. At appropriate points in the
text, assumptions and major propositions underlying the dissertation are presented.
2.1 World Culture Theory of Globalization
Globalization theories are theories of modernity and are significant in explaining
the development of the new means of consumption (Ritzer, 1996, 1999). There are
different perspectives on globalization theory, with the three main interpretations of
globalization in the field of sociology being: 1) the world culture theory, 2) the world
system theory, and 3) the world polity theory. Since this dissertation views food as a
cultural component, the world culture theory of globalization is used as a means of
understanding tourists’ food consumption.

21
The term globalization was first used around 1960 to connote something that is
happening worldwide (Waters, 1995). Economics, business, technology, politics, culture,
and environmental studies have used this term from different perspectives and with
different definitions. Sociologists have defined globalization in the following ways:
“…diffusion of practices, values and technology that have an influence on
people’s lives worldwide” (Albrow, 1997, p.88);
“…spatio-temporal processes of change which underpin a transformation in the
organization of human affairs by linking together and expanding human activity across
regions and continents” (Held, McGrew, Goldblatt, & Perraton, 1999, p14), and
“…interconnectedness of the world as a whole and the concomitant increase in
reflexive, global consciousness” (Robertson, 2001, p.8).
According to world culture theory of globalization (Robertson, 1992), the process
of globalization operates independent of societal and other socio-cultural processes
though it has an impact on them. Movement of religious ideas, money, tourism, food and
technology exist globally, breaking old social orders and enabling new solidarities.
Though the popular notion is that the there is an economic causality (through
transnational corporations) to the globalization process, Robertson (1992) theorizes that
there is no single driving force to globalization. Different forces such as religion, culture
and technology have been dominant causal forces in the process of globalization at
different times throughout the history of humanity.
An important theme of world culture theory of globalization is that globalization
is not a monolithic concept but has a multidimensional aspect to it. It is a complex
mixture of homogenization and heterogenization. People interpret globalized goods and
22
ideas in a variety of ways and incorporate them into their lives in diverse ways. There is a
tension between the global and the local. These result in societies either incorporating the
global, or annexing the global selectively to suit the local by what economists and
sociologists term as ‘glocalisation,’ or by sometimes rejecting it, as manifested through
the resurgent affirmation of local identities (Robertson, 1997). Relatively few products
are sold in a globally standardized form, as most are modified to suit to the local culture,
values and tastes.
To summarize, the stress upon the local and the dynamics of the local’s
interaction with the global is the hallmark of the globalization theory. Globalization is
thus neither a civilizing nor a destructive force, and is quite often a consequence of
modernity. Its impact across countries and time has been haphazard, discontinuous and
even contradictory.
The World Culture Theory of Globalization and Food Consumption
Sociologists studying food consumption (Germov & Williams, 1999; McIntosh,
1996) have used the world culture theory of globalization to explain the patterns of
modern food consumption. The theory when applied to food consumption reflects the
same dynamics in that there is dialectical relationship between the global and the local,
and convergence as well as divergence of tastes.
With respect to food consumption, the homogenizing aspect of globalization has
been attributed to economic forces, particularly because the economic process of trade
liberalization makes it possible for food to be sourced from any part of the world. In
addition, the most powerful reason for the convergence of tastes has been attributed to the
role of food corporations, making branded food products, recipes, and ready-to-eat
23
processed foods available throughout the world (Lang, 1999; Nygard & Storstad, 1998;
Sklair, 1991). The flow of tastes has predominantly been from the overproducing western
nations to the south, infiltrating the more regionally self-reliant markets (Lang, 1997).
Even though the west has adopted many immigrant foods, the foods that have been
adopted have been mostly transformed and popularized in their processed and ready-to-
eat form to such an extent that centuries old diets in many countries are being altered
(Barnet & Cavanagh, 1994).
This standardization of tastes, although stimulated in the economic sphere, results
in cultural phenomena with certain images and symbols accepted the world over as
aesthetics / lifestyle (Sklair, 1991). The example of a young French population
increasingly getting attracted to foods served at international franchisees and chains
(Fantasia, 1995) is often cited as an example of how a country such as France, which is
generally perceived as culturally insular, cannot escape from the overall trend of
globalization of tastes.
Even though globalization has been accused of suppressing regional food
differences, major local and regional variations in our eating patterns remain. The world
culture theory of globalization (Robertson, 1992) attributes this to the tension that exists
between the global and the local. The opposition and public protests to the fast food
chains such as McDonald’s and Kentucky Fried Chicken in many parts of the world are
prime examples of such dynamics. Even western countries like Australia have small
communities and towns fighting for Mac-free zones (www.mcspotlight.org/campaigns/
current/residents/index.html).
24
Further, the significance of the local as an opposing force to the global is also
seen in the movements like the Slow Food Movement in Italy and many small
communities of Europe and the USA. In many western countries, extensive efforts are
being undertaken by local communities to reconstruct and emphasize local food systems
to protect their endangered gastronomic traditions (Henderson, 1998; Mayer & Knox,
2005; Stille, 2001). Thus, even though Mennell (2000) states that globalization is
facilitating a trend of ‘diminishing contrasts and increasing varieties,’ the dynamics of
globalization ensures that regional and national differences still exist and there are still
more differences than varieties (Nygard and Storstad, 1998).
To summarize, the counteracting forces of globalization and localization act
simultaneously leading to people becoming familiar with foods and cuisines from
different parts of the world and being introduced to a variety of local versions. This has
resulted in convergence in consumptive behavior on one hand and increased variety on
the other.
2.2 Theory of Cultural Capital
While theories of globalization explain how macro level forces influence the
modern consumption, other forces obviously function. According to Germov and
Williams (1999), “…while the social structure clearly affects the production, distribution,
and consumption of food, a sole focus on structural determinants obscures the agency of
the people and the counter trend away from rationalization, represented by the concept of
social differentiation”(p. 303).
25
The cultural capital theory (Bourdieu, 1984) is one such theory of social
differentiation that explains differences in consumption across groups in terms of tastes,
pleasures, and desires (Warde, 1997). Warde, Martens, and Olsen (1999) define cultural
capital as “the cultural knowledge, competence and disposition, identified through
embodied traits, educational qualifications, material possessions, and involvement in
cultural practices” (p.125). The theory views culture as complex rule-like structures that
constitute resources that can be put to strategic use, as opposed to the view of culture as
the values that suffuse aspects of belief, intention, and the collective life (DiMaggio,
1997; Hays, 1994).
According to Bourdieu (1984), class hierarchy is based on a combination of
wealth and education. An individual’s combined returns from these two determine his or
her class position. The class positions generate different experiences, determine cultural
choices, and generate internal commonalities and a system of shared preferences, norms,
and symbols. The rich elites and the educated elites maintain exclusivity through their
preference for certain genres and forms of non-material culture (visual art, music and
literature) and material cultures (food, clothing, furniture).
However, people rich in economic capital may not necessarily be high in cultural
capital because even though they value the arts, they may lack the capability to appreciate
varied cultural arts. Studies that have empirically tested the cultural capital theory have
attested this by demonstrating strong correlation between education level and the
knowledge and ability to appreciate varied cultural activities like music, visual arts,
literature, cuisines, movies, and other leisure practices (DiMaggio, 1982; DiMaggio &
Mohr, 1985;Gartman, 1991; Glynn, Bhattacharya, & Rao, 1996; Katz-Gerro & Shavit,
26
1998; Ostrower, 1998; Wilson, 2002) . The reason given for this relationship is that
education transmits culture inter-generationally in the form of dispositions, tastes, and
knowledge, in the sense that once preferences evolves, these are maintained from one
generation to another in large measure by educational reinforcement (DiMaggio & Mohr,
1985; Holt, 2000).
This focus on class and the way cultural capital passes on inter-generationally
makes the theory of cultural capital static in nature, and sociologists studying
consumption (Adema, 2000; Erickson, 1996; Katz-Gerro & Shavit, 1998; Warde,
Martens, & Olsen, 1999) have criticized the cultural capital theory for that reason.
According to them, the emphasis on class is too narrow to cover the dynamic diffusion of
objects of consumption. In addition, the theory underestimates the role of social network
diversity and other complex modern social structures that contribute to cultural capital
(Erickson, 1996). This makes the cultural capital theory, a theory of reproduction of
status. Featherstone's (1991) statement that “…we are moving towards a society without
fixed status groups in which the adoptions of styles of life, which are fixed to specific
groups, have been suppressed” (p.83), provides an apt criticism of the cultural capital
theory.
With this criticism in mind, recent studies on cultural capital theory have looked
into the stratification of consumption and differentiation in tastes as a product of lifestyle
choices (Adema, 2000; DiMaggio, 1987; Erickson, 1996; Katz-Gerro and Shavit, 1998;
Lamont, 1992; Warde, 1999). According to these studies, people rich in cultural capital
are those who are knowledgeable about a wide variety of cultural practices, understand
the relevance and rules of these practices and can use these as a conversational resource.
27
These culturally varied people are known as cultural omnivores (Peterson, 1992) and they
characterize the modern cultural consumption. According to Erickson (1996), “It is not a
hierarchy of tastes (from soap opera to classical opera) but a hierarchy of knowledge
(from those who have little knowledge about soap opera or opera to those who can take
part in a conversation about both)” (p.219) that determines one’s cultural capital and its
possession.
One of the major weakness of the cultural capital theory is that too many variables
denote cultural capital (DiMaggio & Mukhtar, 2002; Kingston, 2001) and there is no
consensus on its operationalization. It has been operationalized as knowledge about
cultural art forms, participation in cultural art forms, involvement in cultural arts, and
sometimes even as the degree of appreciation of the arts.
Cultural Capital Theory and Food Consumption
According to Mattiacci and Vignali (2004), “…from the birth of nouvelle cuisine
onwards, there has been a growing trend towards considering food as an intellectual
experience, together with exploration and rediscovery, love for history and culture, search
for traditional identity and, at the same time, for something new.” (p.704)
The cultural capital theory uses a similar perspective with respect to food and
views eating as a cultural act. The culinary field functions like other domains of ‘high’
culture and art such that there is a hierarchy of cuisines and hierarchy of food outlets and
there are group of professional practitioners and critics engaged in aesthetic discourse
about restaurants and their dishes (Warde, 2004). The cultural capital theory revolves
around the differential ability to control the definition of what is ‘good to eat.’
28
According to this theory, ‘taste’ becomes a social issue when the meal distances
itself from its function of satisfying hunger and transforms into a social form or a means
of interaction. The function expected from food is indicative of one’s cultural capital.
Those low in cultural capital demand substantial meals with a taste for things that are
functional and non-formal. Those high in cultural capital, on the other hand, abandon
substance in favor of form and are committed to the symbolic. Thus, the principle
governing these differences in tastes in food is the opposition between the “tastes of
luxury (or freedom) and the tastes of necessity” (Bourdieu, 1984, p.198).
As stated earlier, the ‘cultural omnivore’ perspective of cultural capital views the
breadth of knowledge about various cultural forms and practices as cultural capital. With
respect to food, cultural capital may reside in knowledge about gourmet foods, exotic
flavors, foods that are acquired tastes, and familiarity with advanced preparation
techniques (Adema, 2000). In addition, the growing popularity of cooking shows, a
concern for where the food originates from, a desire to resist the dominant culture of
franchised food and restaurants, and the quest for obscure local and regional cuisines and
artisan-produced foods are all indicative of cultural capital (Pietrykowski, 2004; Warde,
2004).
Empirical studies on cultural capital and food have studied dining patterns in
restaurants extensively (Erickson, 1996; Warde et al, 1999; Warde, 2004). According to
these studies, ethnic restaurants are the hotbeds for accruing as well as deploying cultural
capital and “…the appeal of ethnic cuisines other than one’s own is symbolic in that it
links specialized knowledge with a cosmopolitan orientation” (Warde et al, 1999, p.123).
As for the foods served at franchisee restaurants, even though their consumption cuts
29
across social classes, fast food chains are so standardized that their conversational
possibilities end quickly and are therefore not frequented by people with high cultural
capital (Erickson, 1996). Thus, “distinction is conferred through selection of both places
to eat and of dishes” (Warde, 2004, p. 23), which results in members of different social
classes systematically picking certain foods and restaurants in preference to others,
thereby displaying class differences in a recognizable form, facilitating cohesion and
social exclusion among its possessors
To sum up, cultural capital theory is a theory of stratification, which lays the
claim that consumption of food is a socially constructed affair. People accrue cultural
capital by extending their knowledge, involvement, and familiarity with wide variety of
foods and cuisines, especially the non-standardized foods that symbolize refinement,
consequently resulting in their social exclusion.
2.3 Towards a Theory of Tourist Food Consumption
Though this dissertation does not seek to test any theory, a discussion on
globalization, cultural capital and the tourists’ food consumption is helpful in
understanding food tourism. Combining the macro theory of globalization and the micro
theory of cultural capital to explain food tourism, a theoretical framework is proposed in
this section.
The dynamics of world culture theory of globalization (Robertson, 1991, 1992)
are at play in the tourist food consumption. On one hand, the homogenizing forces of
globalization are at play, as evidenced by popularity of consumption at franchised fast-
food outlets and chain restaurants among tourists in the case studies of Caribbean islands
30
and Yucatan peninsula (Belisle, 1983,1984; Torres, 2002). On the other hand, the counter
trend against homogenization is seen in the successful strategic alliances of Niagara
region (Telfer, 2001), and Mallorca (Alcock, 1995) where efforts on the part of
destinations to promote local food boosted tourism and the local economy. The forces of
globalization have exposed people to foreign foods at home, made them less wary of the
food of foreign foods, and stimulated them to experience those foods when they travel.
Moreover, the presence of both local food, and the global in the form of chain restaurants,
provides them with more variety than ever.
However, the level of exposure to the foreign foods and cuisines at home depends
on one’s position in the socio-cultural echelon. Extrapolating from the cultural capital
theory, tourists who possess the cultural capital to appreciate and enjoy foreign food at
home are the ones who are more likely to experience the local food at the destination
(Cohen & Avieli, 2004). By ordering a particular dish, pronouncing it the way the natives
pronounce, and dining at places that are not ‘touristy’ but are frequented by locals, they
show cultural competence rather than adventurousness (Molz, 2004; Richards, 2002).
Since cultural omnivorousness is characteristic of people with high cultural capital,
tourists who possess cultural capital frequent places of all types and derive as much
satisfaction from consuming peasant foods, as they do from eating at high quality
restaurants. More importantly, since eating out is a necessary element of the vacation
experience, and almost all tourists eat out, destinations become a playground for accruing
as well as deploying one’s cultural capital. Where the tourist eats and what he eats
exhibits the socio-cultural echelons he belongs to, and makes food an ideal tool for social
cohesion and social stratification.
31
2.4 Conceptual Development
This section presents the conceptual foundations of the dissertation. Prior tourism
literature that focused on food is reviewed with an aim to delineate the activities that
constitute food tourism and understand its characteristics. Next, the concepts that
literature suggests are significant in explaining food tourism are located in order to
develop a conceptual model.
2.4.a Food Tourism
The lack of empirical studies with respect to food tourism calls for a detailed discussion
of literature that has focused on this form of tourism in order to describe food tourism. In
the literature where one sees the interface between food and tourism, food tourism as a
form of tourism makes its appearance as gastronomic tourism (Hjalager & Richards,
2002; Zelinsky, 1985), culinary tourism (Long, 1998) and food tourism (Hall & Mitchell,
2001; Hall, Sharples, Mitchell, Macionis, & Cambourne, 2003). These different
terminologies connote almost the same notion, i.e. tourists’ participation in food related
activities, with food being the focus of travel behavior rather than a by-product.
Gastronomic Tourism
According to Zelinsky (1985) eating at ethnic and regional cuisine restaurants is a
form of gastronomic tourism, implying that a person need not be a tourist in the
conventional sense to take part in food tourism. However, Zelinsky’s study is limited in
its approach in that it confines itself to just one activity: eating at ethnic restaurants. The
32
study’s contribution to the literature lies in being the first to identify and define this form
of tourism, thus laying the foundations for future research.
Culinary Tourism
Long (1998) uses an anthropological perspective and defines culinary tourism as
“…an intentional, exploratory participation in the foodways of an ‘Other,’ participation
including the consumption or preparation and presentation for consumption of a food
item, cuisine, meal system, or eating style considered as belonging to a culinary system
not one’s own”(p.181).
What is noteworthy about the definition is its similarity to the idea conceived by
Zelinsky (1985), the key characteristic being that one need not travel to a place away
from home to be a culinary tourist. According to Long (1998), a culinary tourist’s
participation in the foodways of the ‘Other’ is either ‘intentional’ or ‘exploratory’ or both
‘intentional and exploratory.’ This implies that culinary tourist may be positioned on a
continuum from low to high based on interest, curiosity, and intention.
Long (2004) posits that the culinary ‘Other’ can be classified into five categories:
culture, region, time, ethos/ religion, and socio-economic class (p.24). The first category
of culinary tourism is based on the cultural ‘Other.’ This refers to experiencing foodways
of ethnicities not one’s own. The cultural other is the most frequent category in which
culinary tourism is enacted, and represents the common notion of culinary tourism.
The culinary tourism based on the regional ‘Other’ refers to experiencing a food
system that is physically removed from one’s own. Thus, geography plays a considerable
part in this category of culinary tourism. The concept of the terroir, that is, the
combination of the local soil, the physical environment and the local culture that makes
33
the local produce and the cuisine unique to the region, plays a significant role here. So
much so that sometimes the local produce becomes iconic of the region alone. A classic
example of this is Maine lobster, which though being a part of the Maine coast has
become symbolic of the state (Lewis, 1998), and is an integral part of the Maine tourist
itinerary.
The third category of the culinary ‘Other’ is that of experiencing foodways that
are separated by time, both historic and futuristic. Activities for this type of culinary
tourism would include visiting an attraction where one could savor historic reenactments
of feasts from a different era, sampling foods of the past and food products like heirloom
tomatoes, watching demonstrations of old style cooking, buying cookbooks with recipes
from the past, and sampling “futuristic foods” (p.184).
The fourth category of the culinary ‘Other’ is experiencing the culinary ethos that
is not one’s own. Examples of this would be experiencing foods cooked for a religious
dietary requirement (e.g. Ramadan food, Hallal, and Kosher food), church festivals, foods
cooked with respect to belief systems like vegetarianism, vegan, and foods cooked using
organically grown local produce.
The final category of culinary ‘Other’ is the socio-economic other. Examples
include dining at an upscale restaurants, attending a gourmet cooking class, or
experiencing lower class cuisines like mountain foods, Southern working class food,
down-home diners, home cooked plain food of the middle class that is served at the mom
and pop’s outlets, and buying “White Trash cookbooks” (p.184).
The sites for participation in culinary tourism, according to Long (1998), include
restaurants, ethnic restaurants, festivals, festive food events especially dedicated to a
34
particular produce like apple, peach, pumpkin, shrimp, oysters and the like, and cooking
demonstrations using home grown, freshly picked product at community festivals.
Long’s (1998) study thus contributes to the understanding of culinary tourism in
three ways. For one, it defines culinary tourism. Next, it demonstrates that culinary
tourism is composed of different categories of activities, implying that culinary tourism is
multidimensional. Finally, it shows that there are, in fact, multiple sites for participating
in culinary tourism. This seminal work, though influential in defining the parameter of
food tourism, is more of an anthropological discourse and lacks empirical analysis.
Food Tourism
An opertionalizable definition of food tourism, and a much more extensive work,
comes from Hall and Mitchell (2001) and Hall and Sharples (2003). According to Hall
and Sharples (2003), food tourism is “visitation to primary and secondary food producers,
food festivals, restaurants and specific locations for which food tasting and/or
experiencing the attributes of specialist food production region are the primary
motivating factor for travel” (Hall & Mitchell, 2001, p.10). Thus, they narrow the scope
of food tourism by stating that food tourism occurs only when the food of a place acts as
a primary motivator to travel to the destination.
Further, Hall and Sharples (2003) propose segmentation of food tourism based on
the “importance of a special interest in food as a travel motivation” (p.11). The
segmentation is based on the following criteria: 1) a high interest in food tourism in
indicated by traveling to a destination with the primary motive of visiting a restaurant,
market or winery, and all tourist activities are food related. They label this segment as
gourmet/ cuisine/gastronomic tourism; 2) participation in food related activities as a part
35
of wider range of activities at the destination indicates a moderate interest. They term this
segment as culinary tourism; 3) a low interest is indicated by participation in food related
activities just out of curiosity or because ‘it is something different.’ They label this
segment as the rural/urban tourist; 4) a segment that shows no interest in food related
activities, or considers food subsidiary to all other interests as a tourist is the final
segment. This segment is an unlabeled segment. Hall and Mitchell’s (2001), and Hall and
Sharples’ (2003) main contributions lie in providing an opertionalizable definition of
food tourism and also in conceptualizing different types of food tourism based on one’s
level of interest in food as a travel motivating factor.
Despite Hall and Sharples’ (2003) view that there is spectrum of food tourism
activities and a food tourism continuum, apparently, there seems to be a mismatch
between their definition of food tourism and their subsequent segmentation of food
tourism. If, as they propose, food tourism is defined as tourism where food is the
“primary motivating factor for travel” (p.10), then segmentation of food tourism based on
the criterion “interest in food as a travel motivation” (p.11) seems inappropriate and
cannot be tested empirically.
This dissertation addresses this shortcoming by taking a broader approach in
defining food tourism and using the frequency of participation in food related activities as
a criterion to segment tourists. Modifying Hall and Mitchell’s (2001) definition, this
dissertation redefines food tourism as a tourist’s food related activities at the destination,
such as consuming ethnic and distinctive cuisines, visiting primary and secondary food
producers, purchasing local food products or food pertinent products, and experiencing
the characteristics of a unique food producing region. Thus, although all tourists may
36
participate in food tourism, it is the degree of participation which determines where the
tourist stands along the ‘tourism interest continuum’ (Brotherton & Himmetoglu, 1997),
with high participation indicating special interest tourism. This dissertation views
culinary tourism as a special interest tourism, defining culinary tourism as special interest
tourism where an interest in food and activities related to food is a major, if not primary
reason influencing travel behavior.
Thus, the segmentation criterion is based on the degree of interest as observed
through the frequency of activities and not on motivation, and the decisive factor of
segmentation is not food tourism, but tourists participating in food tourism. By doing so,
this dissertation hopes to address the inadequacies of Hall and Mitchell’s (2001)
definition of food tourism and its apparent mismatch with the criterion used for Hall and
Sharples’ (2003) segmentation.
Other Important Contributions
Other important contributions to the understanding of food tourism come from
Kirshenblatt-Gimblett (2004) and Shortridge (2004). According to Kirshenblatt –
Gimblett (2004), gastronomic or culinary tourism occurs “when food is the focus of
travel, and itineraries are organized around cooking schools, wineries, restaurants, and
food festivals” (p.xi). The restaurants are prime sites for culinary/ gastronomic tourism,
and its raison d’etre lies in “the specificity of experiencing the food on the spot, in
relation to season, ripeness, freshness, perishability, and the total world of which it is the
part”(p. xiv).
Shortridge (2004) studies the popularity of ethnic theme towns and the role of
their communities in providing the culinary experience of their native countries to
37
tourists. The popular culinary tourism activities in the New Glarus, Wisconsin (a Swiss
settlement) and Lindsborg, Kansas (a Swedish settlement) include buying food and food
products, cookbooks and cooking utensils-both traditional and modern- that have been
imported from the county of origin, eating at food festivals, watching cooking
demonstrations, sampling food, and collecting souvenir recipes. The hallmark of this type
of tourism is the concerted efforts on the part of the ethnic community to provide an
authentic experience, not only in terms of the food, but also by creating a landscape that
resembles the country the ethnic community represents.
To synopsize, all these studies contribute to the understanding of food tourism by
driving home two important points. For one, food tourism encompasses numerous classes
of food-related activities, and has a multidimensional aspect to it. Secondly, there is a
continuum of tourists based on their participation in food-related activities. That is, there
are different categories of food tourists. These two conclusions provide the foundations to
the formulation of the first two propositions of the dissertation:
Proposition I. Food Tourism is composed of different classes of activities.
Proposition II. Tourists can be classified into homogenous groups based on their
participation in food tourism.
2.4.b Concepts that Explain Participation in Food Tourism
The food in tourism literature suggests the relevance of four concepts that
influence participation in food tourism. The next section reviews literature pertinent to
these four concepts that owe their origin to disparate fields such as food studies, social
psychology, and consumer behavior.
38
2.4. b.1 Food Neophobia
The concept of food neophobia has been used widely in the food and nutrition
literature to understand why people have the propensity to avoid or approach novel,
unfamiliar, and foreign foods. Based on Otis' (1984) findings that a person’s willingness
to taste new food is significantly and positively related to how adventurous one thinks he
is, Pliner and Hobden, (1992) conceptualized food neophobia as a personal trait and
defined it as “the reluctance to eat and/ or avoidance of novel foods.” Studies in food and
nutrition have demonstrated significant gender and age differences regarding this trait,
with men being more food neophobic than women, and older people more neophobic
than younger people (Hobden & Pliner, 1995; Otis, 1984; Pliner, Eng, & Krishnan, 1995;
Pliner & Hobden, 1992; Pliner & Melo, 1997; Pliner, Pelchat, & Grabski, 1993; Ritchey,
Frank, Hursti, & Tuorila, 2003; Tuorila, Lahteenmaki, Pohjalainen, & Lotti, 2001).
Further, these studies have found that low exposure to new foods, perceived
dangerousness of novel foods, and social influence are significant predictors of food
neophobia.
Food Neophobia and Food Tourism
According to Long (2004), food consumption is a dynamic process running along
three axes: from the exotic to the familiar, from the inedible to the edible, and from the
unpalatable to the palatable. In food / culinary tourism, there is usually a shift from the
familiar to the exotic, where the exotic could be an ingredient, dish, eating style or
preparation method of the host community. For food to function as a tourist attraction, it
needs to fall sufficiently outside of the mundane and suitably inside the boundaries of
what is palatable (Jochnowitz, 1998). In addition, the perception of what constitutes

39
exotic, inedible or unpalatable depends on personal tastes, personalities, cultural
preferences and aesthetics.
Food neophobia is one such personal trait that has been proposed as a barrier for
tourists to experience the local cuisines (Cohen & Avieli, 2004), affecting the food
tourism experience (Mitchell & Hall, 2003). Local food might not be an attraction to
many tourists because they are afraid of experimenting with novel foods and ingesting
something strange (Cohen & Avieli, 2004). However, the empirical significance of food
neophobia in explaining participation in food tourism remains untested.
Food borne diseases has been cited as a cause for concern by tourists traveling to
developing countries, and “traveler’s diarrhea” is reported as the most common ailment
(MacLaurin, 2001). In a study of perceived risks of travel, Lepp and Gibson (2003) found
strange food as being one of the risk factors for tourists. The study revealed that
institutionalized tourists, the organized mass tourists, female tourists, and tourists with
least experience in traveling abroad perceived strange food to be more of a risk.
The crucial role of food neophobia is illustrated in the literature by the following
examples, each falling at the extreme ends of food consumption spectrum. On one
extreme, there are the food neophilic tourists who demand for the exotic in dishes like
cuitlacoche (made of corn fungus), and cactus worms, ant eggs, tacos of chapulines
(grasshoppers), when they travel to Mexico (Pilcher, 2004, p.78). At the other end of the
spectrum, there are the adventurous but food neophobic backpackers, who though
adventurous enough to trek the extremely dangerous terrain of the Himalayas, are too
reluctant and fastidious to try the local Nepalese fare and carry along packaged toasts,
pizzas, and apple pies (Cohen & Avieli, 2004, p.759). This implies that novelty-seeking
40
as a tourist motivational factor is not an all-pervading trait applicable to all of the
tourist’s activities. Even though novelty-seeking may motivate a tourist to choose a
destination or activities at the destination (Crompton, 1979; Lee & Crompton, 1992), it
may not function within the realm of food.
From the destinations’ perspective, food neophobia is a major hurdle in increasing
the demand for regionally produced food, as seen in Belisle’s (1983, 1984) case studies
of the Caribbean Islands. The Caribbean economy, which survives on tourism, imports
most of its food because the conservative eating habits of the sun and sand tourists
prevent them from experiencing local dishes. This pattern seems to be recurring as
evidenced by McAndrews' (2004) study on Hawaiian tourists, who despite showing
interest in Hawaiian culture like Hula, fire-twirlers and the like, seem least interested in
the local food, so much, that many a time the local food went untested.
As a result, destinations and restaurants have attempted to surmount the tourists’
neophobic tendencies by developing strategies such as renaming the exotic dishes, or
translating it and putting it within American or Anglicized context (e.g. Khmichi as the
Korean pickle). Yet another strategy is the development of tourism-oriented culinary
establishments (Cohen & Avieli, 2004), serving innovative and creative version of the
local dishes that are transformed to suit the tourist palate. These function as a “culinary
environmental bubble” (p.775) for the food neophobic tourists.
To sum up, food’s capacity to affect the tourist’s physical health makes it one of
the risk elements of tourism. In addition, the inherent trait within a person to avoid novel
foods plays a crucial factor in determining the extent of participation in food tourism. The
41
proposition arrived as a consequence of the literature review of the concept is stated
below.
Proposition III. Food neophobia is negatively related to food tourism.
2.4. b.2 Variety-seeking Tendency
The concept of variety-seeking is borrowed from the consumer behavior
literature. It is defined as the consumer’s inherent desire for variety due to factors such as
changes in tastes, changes in constraints, and changes in feasible alternatives (McAlister
& Pessemier, 1982). In general, the concept of variety-seeking is identified as an offshoot
of the need for stimulation, and is acknowledged as an underlying explanatory variable
for the consumption of hedonic products like food, vacations, entertainment gadgets, and
the like (Ratner, Kahn, & Kahneman, 1999).
VanTrijp and Steenkamp (1992) define variety-seeking tendency with respect to
food as “the factor that aims at providing variation in stimulation through varied food
product consumption irrespective of the instrumental/ functional value of the food
product alternatives.” Variety may be sought in the following conditions: 1) when there
are changes in feasible set, that is, when the type of food that is normally consumed is not
available; 2) when there are changes in constraints, such as, access to more money or
restaurants; 3) when there are changes in tastes due to advertising; 4) when changes are
sought as a goal in itself (McAlister & Pessemier, 1982). From a sociologist’s point of
view, variety- seeking with respect to food is a manifestation of cultural experimentalism
and a search for innovation in consumption (Warde, Martens & Olsen, 1999). Further, it
42
is considered a significant feature of contemporary food consumption habits (Gabaccia,
1998).
Variety-seeking Tendency and Food Tourism
In tourism literature where food is the focus of study, variety-seeking tendency
towards food is seen as an important variable explaining tourist food consumption.
According to Shortridge (2004), the diversity of opportunities provided to the tourist to
experience varieties of food is seen as the hallmark of food tourism. At the same time,
the culinary tourists are characterized by their openness to variety (Kirshenblatt-
Gimblett, 2004). A tourist’s variety-seeking tendency with respect to food is manifested
in a demand for variety of culinary traditions, and/or a demand for variety within a
culinary system (Molz, 2004; Reynolds, 1993).
Molz’s (2004) ethnographic study of diners at Thai restaurants evidences the
demand for variety of culinary traditions as a form of variety-seeking tendency.
According to her, culinary tourists seeking ethnic dining experiences are set apart by their
demand for variety rather than seeking authentic differences. The subjects under study
not only went to Thai restaurants, but also frequently ate at Japanese, Korean, Caribbean,
Indian, Ethiopian, and several other ethnic restaurants. To these tourists, eating at a
variety of restaurants was more pleasurable and a crucial factor in their overall culinary
experience.
Availability of a variety of culinary experiences notwithstanding, the importance
of the presence of variety of dishes with reference to an indigenous culinary system is
also important to the tourists (Reynolds, 1993). In his longitudinal study of the menu
offerings at twenty-eight local restaurants in the island of Bali, Reynolds (1993) found
43
that the percentage of local Balinese dishes in tourist towns dropped from 52% of the
total dishes available per restaurant in 1988 to 16% in the year 1992. More than half of
the tourists interviewed complained about the lack of a wider selection of indigenous
dishes and rated it as an important criterion in their rating of overall tourist experience in
Bali.
From a destination’s perspective, the availability of a variety of dishes and the
presence of an array of ethnic restaurants that provide a multiplicity of culinary
experiences are considered important attributes of a tourist destination (Nield, Kozak, &
LeGrys, 2000; Sparks, Bowen, & Klag, 2003). These contribute to the overall image and
reputation of a destination, and ultimately the tourist’s satisfaction with the destination.
New York, London and San Francisco are examples of cities that have created a
reputation of “foodie” destinations not just by being representative of any single regional
cuisine or an iconic culinary system, but by the sheer variety of culinary cultures they
offer.
To summarize, literature suggests that the tourist’s variety-seeking tendency
towards food is a form of cultural experimentation. Moreover, according to the literature,
a destination’s ability to provide variety of culinary traditions along with a multiplicity of
dishes within a culinary tradition, undoubtedly adds to its overall attraction and
satisfaction as a holiday destination. Thus, tourism literature pertinent to food
consumption shows that variety-seeking tendency towards food plays a crucial role in
explaining participation in food related activities. The proposition arrived at reviewing
literature pertinent to variety-seeking tendency is stated next.
44
Proposition IV. Variety-seeking tendency towards food is positively related to
food tourism.
2.4.b.3 Hedonic Consumption
Hedonic consumption is a concept borrowed from the consumer behavior
literature, and is defined as, “those facets of consumer behavior that relate to the multi-
sensory, fantasy and emotive aspects of one’s experiences with the products” (Hirschman
& Holbrook, 1982, p.92). The hallmark of hedonically valuable experience lies in the
aesthetic or the physical enjoyment it provides, resulting in increased arousal, heightened
involvement, perceived freedom, fantasy fulfillment, and escapism (Bloch & Richins,
1983; Hopkinson & Pujari, 1999).
With respect to food, hedonic attitudes of consumption involve an emphasis on
taste of food, a preference for cultural eating practices, a desire for complex, cultural
dishes or a desire for elaborate and extravagant foods, and a focus on the cultural practice
of eating food as well as the end benefits (LeBel, 2000; Wansink, Sonka, & Cheney,
2002, p.356). Further, it is not just purely a physiological sensation, such as the pleasure
felt on having a rich dessert or drinking alcohol. It is also a social pleasure, which for
example, occurs while having food and drinks with friends and family, emotional
pleasure ( e.g. food that evoke pleasant memories), and intellectual pleasure, such as
cooking a fine meal, appreciating finer foods, and consuming beverages (LeBel, 2000).
This is in contrast to the utilitarian attitudes of consumption, which are more goal
oriented, task related and rational. These involve a focus on functional aspects of food, a
preference towards simple cultural foods and dishes, a desire for practicality in food
45
consumption, and a focus on the end benefits of eating such as energy, calories or
nutrition (Wansink, Sonka & Cheney, 2002, p.356). With respect to dining out, satisfying
hunger, convenience, price, and efficiency of the service are indicators of utilitarian
attitudes (Park, 2004).
According to Spangenberg, Voss, and Crowley (1997) both the utilitarian and the
hedonic attitudes might operate on cognitive as well as affective levels. However, the
cognitive element dominates the utilitarian consumption attitude whereas the hedonic
attitude is dominated by affective element. Although, in general, the utilitarian attitudes
and the hedonic attitudes towards food have well-defined set of universal attributes, one’s
cultural background may sometimes define them. For example, diners at fast food
restaurants in Korea considered the standardized and efficient appearance of franchised
fast food exotic, and the fast food restaurants a fun place with novel ambience (Park,
2004) thereby showing a hedonic value to eating at fast food restaurants, and implying a
cultural relativity to these attitudes.
Hedonic Consumption Attitude and Food Tourism
In the literature where one sees an interface of food and tourism, food is viewed
as an element satisfying the sensation seeking need of the tourists, or something that
provides peak experiences to the tourists. Thus, food forms a hedonic component in the
overall tourism experience.
Analyzing the role of food in tourism, Boniface (2003) posits that the modern
tourist is in a constant need for a ‘high’ and for immediate gratification. Food and drink
provide sensory and tactile pleasure and satisfy that need more easily than any other
tourist attraction. A special taste and sensation of unusual food and drink, the pleasure of
46
discovering a new food or dish all contribute to hedonic experiences in travel. Quan and
Wang (2004) extend this proposition by stating that experiencing food can be a peak
experience provided the tourist considers the food of the destination an attraction and
activities related to food form a major part of the tourist’s itinerary. More importantly, for
food to provide peak tourist experiences, it should be in contrast to the tourist’s daily
experiences, in terms of either the dishes or presentation of the meal or the ambience.
With respect to food tourism per se, Mitchell and Hall (2003) state that food
tourism is hedonic in nature since food becomes an experiential rather than a functional
aspect of travel experience. According to them, tourists are motivated to participate in
food tourism because of their hedonic attitude towards food consumption and that the
essence of food tourism lies in its ability to satisfy the sensation seeking attitude of the
tourist. Further, they propose that the popularity of wine tourism is a classic example of
the significance of the hedonic attitudes as a part of travel experience. In a similar vein,
Long (2004) states that the culinary tourist experiences the culinary ‘Other’ for the sake
of experiencing it, and not out of the necessity of satisfying hunger. The pleasure derived
is aesthetic in nature and stems from the consumption of food and not what food
represents.
From the destination’s perspective, it is the tourist’s hedonic attitudes towards
food that makes local food a tourist attraction in its own right and as important as any
other attraction of a destination. Moeran (1983) and Boniface(2001) contribute to this
proposition by studying tourist brochures and destination advertisements respectively.
Moeran’s (1983) analysis of Japanese tourist brochures revealed that the emphasis of
tourism experiences was gradually shifting from that concentrating on the “sights” to that
47
of tourist experiences that involved “participation with their own skins” (p.96). The
brochures portrayed tourism as sensually more diverse. Tasting foreign food was depicted
as one of the hedonic experiences tourists could participate in and the key words in the
brochures centered on experiences and discovery as opposed to the passive and sedate
sightseeing. Similarly, Boniface’s (2001) analysis of contemporary advertisements of
tourist destinations revealed that there was a stress on the food and wine of the region as
a part of the destinations’ positioning strategy. She postulates that our fascination at home
with foreign food and wine, combined with the modern society’s emphasis on the
aesthetic enjoyment of food forms a dynamic, which stimulates people to try out newer
and more sensations when they travel. The advertisements promoting destinations’ food
and wine are a part of travel experience reflects this trend.
To sum up, as tourism is developing into becoming more experience oriented, and
as something that is more than just ‘gaze’ oriented (Urry, 2002), food has become a
medium of such an experience-based tourism. When the tourist’s attitude towards food is
hedonic rather than utilitarian, and the tourist views food as a part of the destinations
attractions or ‘pull factors,’ food provides a pleasurable and memorable experience. Thus,
experiencing the food of the destination becomes one of the motivations to travel, or at
least a significant part of the tourist’s overall activities, and ultimately provides peak
tourist experiences. This makes food tourism a natural consequence of hedonism (Telfer
& Hashimoto, 2003). The proposition arrived at from this review is presented below.
Proposition V. Hedonic consumption attitude towards food is positively related to
food tourism.
48
2.4.b.4 Enduring Involvement with Food Related Activities
The concept of enduring involvement, used in the social psychology and
marketing literatures for more than 45 years, is considered as an influential determinant
of consumer behavior and as a mediator of purchases and participation (Havitz &
Dimanche, 1999). In the last decade, leisure, recreation and tourism researchers have
identified this construct as an important variable that helps understand participation in
leisure activities and tourists’ vacation behavior (Dimanche, Havitz & Howard 1991;
Havitz & Dimanche 1999; Kyle, et al, 2004; McIntyre & Pigram, 1992).
Owing to the large number of studies examining this concept, there are several
definitions of involvement, both in consumer behavior and leisure and tourism studies. In
general, leisure involvement is defined as “an unobservable state of motivation, arousal
or interest towards a recreational activity or associated product, evoked by a particular
stimulus or situation and has drive properties” (Havitz & Dimanche, 1999, p.123).
Despite the debates about the dimensionality of the concept, with very few
exceptions (McQuarrie & Munson, 1987; Zaichkowsky, 1985), empirical evidence in
leisure research strongly supports the conceptualization of involvement as a multi
dimensional construct (Dimanche, Havitz, & Howard, 1991; Gahwiler & Havitz, 1998;
Havitz & Dimanche, 1997, 1999; Havitz, Dimanche, & Howard, 1993; Kerstetter &
Kovich, 1997; Kyle, Graefe, Manning, & Bacon, 2003; Kyle et al, 2004; Laurent &
Kapferer, 1985; McIntyre, 1989; McIntyre & Pigram, 1992; Wiley, Shaw, & Havitz,
2000). This construct has been attributed to personal values, ego-involvement,
importance and risk perceptions, interest, excitement, and enthusiasm for product class,
49
activities, or information, in that these constitute facets of involvement influencing
participation in a leisure activity and travel behavior patterns.
The most common dimensions of enduring involvement are importance pleasure,
sign, risk importance, and risk probability (Laurent & Kapferer, 1985), and in the context
of leisure include attraction, sign, centrality and risk (Havitz & Dimanche, 1999). Recent
studies on leisure involvement have reported dimensions such as social bonding, identity
affirmation, and identity expression, in addition to attraction and centrality (Kyle et al,
2004). These dimensions are of particular relevance to the current investigation because
as discussed earlier in the review of sociology of food literature, food consumption deals
with issues of identity expression, identity affirmation and social bonding.
Enduring Involvement and Food Tourism
In the food and tourism literature, involvement with food and food-related
activities in daily life is seen as a predictor of participation in food tourism (Long, 2004;
Mitchell & Hall, 2003; Sharples, 2003). Thus, there is a connection between involvement
and any special interest tourism, such as culinary tourism, in that the leisure activities
enjoyed at home are pursued even while vacationing in the form of niche tourism
activities (Brotherton & Himmetoglu, 1997). In the food tourism literature, the different
dimensions of enduring involvement (attraction and centrality) are stated as predictors of
participation in food tourism rather than enduring involvement per se.
Long (2004) states that culinary tourism highlights the complexity of tourist
involvement in food consumption in the sense that even though it is a physiological
50
necessity, the culinary tourist perceives food as a social and cultural resource, and his
involvement with food is related with those aspects rather than the physiological aspects.
Thus, attraction as a facet of enduring involvement drives participation in food tourism.
Centrality as a component of enduring involvement with food related activities is
indicated by making these activities an essential part of overall lifestyle activities.
Examples of such activities are eating at ethnic restaurants, viewing televised cooking
shows, cooking a range of styles of food at home, learning new techniques of food
preparation, experimenting with a wide range of cuisines, or having a hobby related to
food, such as collecting recipes and cookbooks (Long, 2004; Mitchell & Hall, 2003).
These again, are predictors of participation in food tourism.
By participating in food tourism, the tourists explore and reinforce their own
identity and explore the identity of the ‘Other’. According to Wilson (2004), “…food’s
declarative function and its ability to say something about the eater makes it a pre-
eminent means of self expression” (p.250). Food is thus a doubly expressive medium of
identity expression and identity affirmation. At the same time, sharing with a group of
people, a food system that is not one’s own binds people by distinguishing the in-group
from the out-group. In her ethnography of Americans eating at Thai restaurants, Molz
(2004) concludes that by participating in the culinary system of the ‘Other,’ Americans
were validating their own individual identity and affiliating themselves with a particular
American identity, thus displaying social bonding- another dimension of enduring
involvement .
51
Finally, according to Wilson (2004), culinary tourists attribute sign value to eating
food in a multicultural setting and unconsciously or consciously use it as a means of
status differentiation. They perceive experiencing local food and cuisines as important
enough to make that a key part of their activities at the destination. The perceived sign
value attributed by the consumer to the product (food) is one of the dimensions of
involvement and is a significant stimulus in participation in food tourism.
To summarize, as tourism is becoming increasingly niche-oriented and activity-
oriented, tourists carry their interests over to their vacations and sometimes even select
destinations that offer them opportunities to take part in their favorite activities.
Analogous to that, people who show an enduring involvement with food use it as a
cultural and social resource around which they revolve their leisure activities. They are
involved with food related activities at home so much that it assumes centrality or
salience in their lives, stimulating them to participate in food related activities during the
vacation. Furthermore, people who show enduring involvement with food and food
related activities perceive food as a form of identity expression, identity affirmation and
social bonding. As per the review of the concept, identity expression, identity affirmation,
social bonding, sign value, and centrality are all facets of enduring involvement. The
proposition arrived on reviewing the literature is presented next.
Proposition VI Enduring involvement with food related activities is positively
related to food tourism.
Based on the propositions derived from the literature review, a conceptual
framework for explaining participation in food tourism is illustrated in Figure 2.1
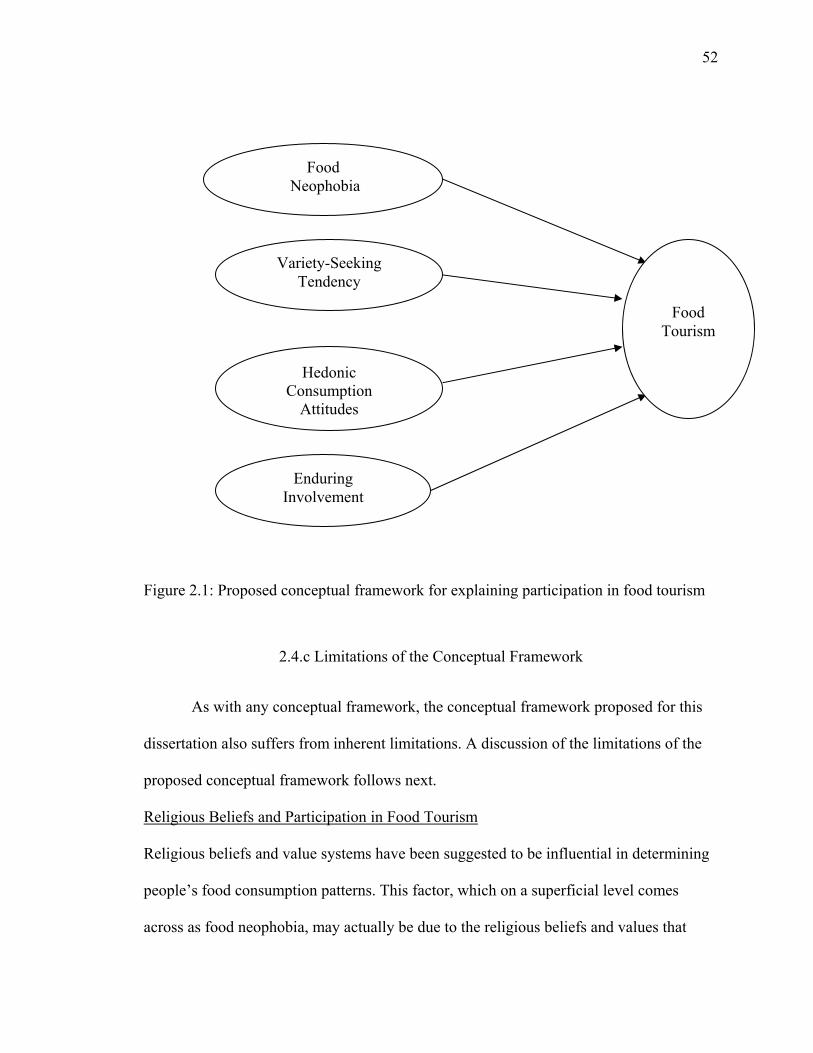
52
Figure 2.1: Proposed conceptual framework for explaining participation in food tourism
2.4.c Limitations of the Conceptual Framework
As with any conceptual framework, the conceptual framework proposed for this
dissertation also suffers from inherent limitations. A discussion of the limitations of the
proposed conceptual framework follows next.
Religious Beliefs and Participation in Food Tourism
Religious beliefs and value systems have been suggested to be influential in determining
people’s food consumption patterns. This factor, which on a superficial level comes
across as food neophobia, may actually be due to the religious beliefs and values that
Food Neophobia
Variety-Seeking Tendency
Hedonic Consumption
Attitudes
Enduring Involvement
Food Tourism
53
often prevent tourists from trying new food. Hassan and Hall's study (2003) of Muslim
tourists in New Zealand examines the role of religious beliefs in food consumption
patterns. The researchers found that lack of Hallal food prevents most Muslim tourists
from eating at restaurants while traveling and almost 55% of them prepare their own
food. The demand for Hallal food by Muslim travelers is often overlooked by
destinations. As a result, according to them, many destinations lose tourist revenues/
receipts to countries such as Malaysia and Indonesia, which offer the tourists
opportunities to consume food confirming to their religious belief system.
A few other studies, however, have shown that religious beliefs and other value
systems are not very influential in preventing tourists from participating in the foodways
of the other. Cohen and Avieli (2004) state that Israeli tourists are willing to be relaxed
about the ‘Kashrut laws’ when they are traveling and are open to experiencing most local
food, although unwilling to try culturally unacceptable foods like dog, cat, and reptile
meat. Similarly, Rotkovitz's study (2004) on Jewish tourists suggests that even though
they are likely to experience some kind of barrier when experimenting with unfamiliar
foodways, there is a more psychological openness to experimentation because travel is
transient in nature. The exotic in this case feels like a safe adventure, and religious beliefs
and value systems may not be much of a hindrance to trying the local fare. Thus, the
relevance of religious beliefs in explaining participation in food tourism has empirically
shown mixed support and therefore is excluded from the conceptual framework.
54
Authenticity and Participation in Food Tourism
The second limitation of the conceptual framework is with respect to the concept of
authenticity. The concept of authenticity has been a topic of extensive discourse in
tourism studies as a tourist motivation and as an integral part of tourist experience
( Cohen, 1979,1988; Hughes, 1995; MacCanell, 1973; MacCannell, 1973,1976;
Moscardo & Pearce, 1986; Pearce & Moscardo, 1986; Turner & Manning, 1988; Wang,
1999). Similarly, in the study of foodways, authenticity has been used, widely and often
contentiously, to understand social dynamics and identity construction through food
consumption (Appadurai, 1986; Lu & Fine, 1995; Molz, 2004). According to Sharpley,
(1994), authenticity connotes “traditional culture and origin, sense of the genuine, and the
real or the unique” (p.130). It is a concept that is especially relevant to heritage and
cultural tourism as it pertains to the depiction of the ‘Other’ and the past.
In the literature where food is studied as a component of tourism, the concept of
authenticity has been widely used (Alcock, 1995; Hughes, 1995; Jacobsen, 2000;
Kirshenblatt -Gimblett, 2004; Lu & Fine, 1995; Molz, 2004). However, this dissertation
does not consider authenticity as a part of the conceptual framework for several reasons.
To begin with, authenticity is perceived as an objective reality (MacCanell, 1973,
1976) and is culturally and historically specific. With respect to food, the quest for
authentic experiences cannot be seen as object related reality. Unlike a historical
monument or a famous work of art in a museum, which has remained the same for
centuries, cuisines are never static. They are constantly evolving and are a product of the
current ecological, political, and economic conditions, thus being reshaped much like the
culture itself (Bentley, 2004). Therefore, examining the quest for an objective
55
authenticity within the context of food tourism does not seem a logical and
opertionalizable exercise.
Another way of looking at authenticity has been to view it as a socially
constructed process (Cohen, 1988; Pearce & Moscardo, 1986). This perspective of
authenticity perceives authenticity as an interactive process, where both the tourists and
the tourism producers simultaneously negotiate in constructing authenticity. The tourists
project authenticity onto the tourist objects, which is based on their expectations, images
formed through media, their preferences, and what they believe is the authentic. At the
same time, the tourism producers work to provide the tourists what they assume the
tourists expect as the authentic. It is beyond the scope and the context of the dissertation
to measure a socially constructed process such as authenticity, in which the tourist and
the tourism producer have equivalent roles to play, by studying the tourist alone.
Particularly because this dissertation limits itself to social psychological concepts to
explain food tourism and analyzes the food tourism purely from a demand side of the
tourism system.
Lastly, ethnographic studies that have looked into authenticity as a motivation to
take part in the foodways of the ‘Other,’ have shown that authenticity is not of paramount
importance in the food experience (Lu & Fine, 1995; Molz, 2004). Tourists do not
consider authenticity a crucial factor when choosing to dine at ethnic restaurants. Even
though tourists are looking for the exotic and seeking authentic experience, it is not at the
expense of palatability and acceptability.
Given these arguments, the concept of authenticity seems complex and
contentious as a variable explaining participation in food tourism. Moreover, given the
56
complicated and multifaceted nature of this concept, empirically examining the role of
authenticity in food tourism may be a topic in its own right for an academic thesis.
Hence, authenticity is not considered as a part of the proposed conceptual framework of
this dissertation in examining food tourism.
2.5 Sociodemographic Status and Food Consumption
Socioeconomic and demographic statuses are one of the most commonly used variables
to predict food consumption patterns. The term socioeconomic status refers to the level of
the social and economic position of people within society as revealed by various
indicators. The main social indicators used for most of the empirical studies are
education, employment, type of job, and the commonly used economic indicator is
annual household income. With respect to demographic status, the frequently used
indicators are age, gender, and marital status.
Social theorists and empiricists studying food consumption have generally looked
at the influence of socioeconomic and demographic variables on dining out, frequency of
eating out, money spent on food at home and outside the home (Bourdieu, 1984; Germov
& Williams,1999; McCracken & Brandt, 1987; McIntosh, 1996; Erickson, 1996; Warde,
1992; Warde & Martens, 2000; Warde, Martens & Olsen, 1999).
According to Douglas (1984), a strong relationship exists between socio-
economic status and food consumption such that when people change social class they
subsequently change their foods. Analyzing education’s influential role in food
consumption patterns, Goody (1982) and Symons (1991) theorize that societies whose
57
populations have higher education have more differentiated cuisines. Education and
cuisine reflexivity are mutually reinforcing, with reflexivity defined as thinking,
discussing, and experimenting about food.
With respect to social indicators empirical studies have shown positive
significant association between education and eating out, eating at ethnic restaurants and
the number of places chosen for dining out (McCracken & Brandt, 1987; Warde
&Martens, 2000; Warde, Martens & Olsen 1999). Employment status as a social variable
showed strong association with the white collar occupational group having exposure to a
wider number of restaurants (Warde, Martens & Olsen, 2000) and eating at better or elite
restaurants (Erickson, 1996). Interestingly enough, Erickson (1996) found that there were
no significant difference between different occupational groups and eating at fast food
chains.
Household income is positively associated with the frequency of dining out,
consumption at ethnic restaurants, and breadth of exposure to ethnic restaurants
(McCracken & Brandt, 1987, Warde & Martens, 2000; Warde, Martens & Olsen 1999).
With respect to the influence of demographic variables on dining out, marital status
showed a significant association, with married people eating out more often (Smallwood,
Blisard, & Blaylock, 1991). Age showed a significant positive association with respect to
dining out, consumption at ethnic restaurants, and exposure to a wider variety of ethnic
restaurants (McCracken & Brandt, 1987, Warde & Martens, 2000; Warde, Martens &
Olsen 1999).
58
Socioeconomic, Demographic Status and the Tourist’s Food Consumption
With respect to tourist food consumption, studies that have looked into the food
consumption of tourists have showed a strong association between socioeconomic status
and demographics with the tourist’s food consumption patterns.
According to Cohen and Avieli (2004), even though tourism has expanded into
the lower and lower middle classes in the Western society, when it comes to food
consumption they possess conservative tastes. Their exposure to foreign foods at home is
not substantial unless a food has reached the status of a world cuisine. This suggests that
there is a possibility of an association between socio-economic background and tourist
consumption of local food.
Smith (1983) and Zelinsky (1985) show empirical evidence of this association in
their respective studies that analyze the geographical distribution of restaurants. The
general socio-economic status, the level of affluence, education of the community, and a
high turnover of tourists are the factors affecting the distributions of ethnic restaurants.
Thus, an educated, urban community with a considerable discretionary income causes a
growth of diverse restaurants.
The importance of socio-economic variables has been studied extensively in wine
tourism (Carmichael, 2001; Charters & Ali-Knight, 2002; Dodd & Bigotte, 1997;
Williams & Dossa, 2001). These studies have provided empirical evidence of the wine
tourist as a relatively well-educated person belonging to the professional or managerial
class. Similarly, Cai, Hong, & Morrison's study (1995) on tourist’s food consumption (in
59
terms of expenditures), showed that occupation was a significant factor, and education
was the most important predictor for a tourist’s expenditure on food at the destination.
Though income had a positive association with the tourist’s expenditure on food,
Cai, Hong and Morrison (1995) found that expenditure was income inelastic. Studies in
wine tourism also show a similar association, with income being one of the best
predictors of participation in wine tourism (Carmichael, 2001; Dodd and Bigotte, 1997;
Williams & Dossa, 2001).
With respect to demographic variables, Cai, Hong and Morrison’s study (1995)
found that the age group 25-34 spent less on food compared to tourists over 65 years, and
married tourists spent more on food than single tourists. In the studies concerning wine
tourism, Carmichael (2001) found the majority of the Niagara wine tourists to be
between the ages of 31-70 years, while Williams and Dossa (2001) found wine tourists of
British Columbia to be relative younger than the non-wine tourist.
To conclude, all these empirical studies reveal the significance of socio-economic
and some demographic variables in food consumption away from home. The importance
of these variables is also seen in tourism studies and the special interest market of wine
tourism. Tourism is a leisure activity and is more or less dependent on discretionary
income. Education plays a significant role in increasing one’s breadth of knowledge and
skills, including leisure skills. Further, tourists who travel for food or wine view it as an
investment in gaining more knowledge. Thus, overall, income and education are the most
significant predictors of the tourist’s food consumption, along with age, marital status,
60
and occupation group showing sporadic instances of being significant predictors. All
these findings lead to the final set of propositions for the dissertation.
Proposition VII: Sociodemographic variables influence participation in food
tourism.
2.6 Synopsis of the Chapter
This chapter has reviewed the literature on globalization theory and the cultural
capital theory as theoretical foundations for explaining food tourism. This was followed
by a review of tourism literature that has focused on food with the objective of answering
the research questions posed in Chapter One. The review also resulted in the formulation
of propositions as the foundation for the hypotheses and the conceptual framework of the
current dissertation. Finally, previous empirical research on the relevance of socio-
economic and demographic variables in explaining food consumption was explored. The
next chapter presents the null and the alternative hypotheses for each of the research
questions of the dissertation and the research methods applied to test these hypotheses.
CHAPTER THREE
3. RESEARCH METHODS
This chapter explains the methods used to address this dissertation’s research
questions. First, the null and the alternative hypotheses are stated for each of the research
questions of the dissertation. The construction of the survey instrument is described next,
followed by the operationalization of variables, and a discussion on pre-testing the
survey. The next section examines the unit of analysis, describes the population under
study and the sampling design. Finally, the data collection process and the data analysis is
discussed.
3.1 Presentation of the Hypotheses
The hypotheses are stated sequentially as they relate to the research questions of
this dissertation presented in Chapter One. Both the null and the alternate hypotheses are
stated for each of the research questions.
Research Question 1: What are the underlying dimensions of food tourism?
H1: 1a Food tourism is not composed of multiple dimensions.
H1: 1b Food tourism is composed of multiple dimensions.
62
Research Question 2: What variables explain participation in food tourism?
H2:1a Food neophobia is not related to any of the dimensions of food tourism.
H2:1b Food neophobia is negatively related to at least one dimension of food
tourism.
H2:2a Variety-seeking tendency is not related to any of the dimensions of food
tourism.
H2:2b Variety-seeking tendency is positively related to at least one dimension of
food tourism.
H2:3a Hedonic consumption attitude towards food is not related to any of the
dimensions of food tourism.
H2:3b Hedonic consumption attitude towards food is positively related to at least
one dimension of food tourism.
H2:4a Enduring involvement with food related activities is not related to any of
the dimensions of food tourism.
H2:4b Enduring involvement with food related activities is positively related to at
least one dimension of food tourism.
Research Question 3: Are there any differences in participation in food tourism with
respect to age, gender, marital status, occupation, education, annual income?
H 3: 1a: There is no significant difference in tourists’ participation in any of the
dimensions of food tourism and their age.
H 3: 1b: There is a significant difference in tourists’ participation in at least one
dimension of food tourism and their age.

63
H 3: 2a: There is no significant difference in tourists’ participation in any of the
dimensions of food tourism and their gender.
H 3: 2b: There is a significant difference in tourists’ participation in at least one
dimension of food tourism and their gender.
H 3: 3a: There is no significant difference in tourists’ participation in any of the
dimensions of food tourism and their education.
H 3: 3b: There is a significant difference in tourists’ participation in at least one
dimension of food tourism and their education.
H 3: 4a: There is no significant difference in tourists’ participation in any of the
dimensions of food tourism and their marital status.
H 3: 4b: There is a significant difference in tourists’ participation in at least one
dimension of food tourism and their marital status.
H 3: 5a: There is no significant difference in tourists’ participation in any of the
dimensions of food tourism and their employment status.
H 3: 5b: There is a significant difference in tourists’ participation in at least one
dimension of food tourism and their employment status.
H 3: 6a: There is no significant difference in tourists’ participation in any of the
dimensions of food tourism and their annual household income.
H 3: 6b: There is a significant difference in tourists’ participation in at least one
dimension of food tourism and their annual household income.
64
Research Question 4: Can tourists be segmented into homogenous groups based on their
participation in food tourism?
H 4:1a Tourists cannot be segmented into homogenous clusters based on their
participation in food tourism.
H 4:1b Tourists can be segmented into homogenous clusters based on their
participation in food tourism.
Research Question 5: What variables predict membership in each of the food tourist
clusters (formed as a result of the classification of tourists based on their participation in
food tourism)?
H5:1a Food neophobia does not predict membership in any of the food tourist
segments.
H5:1b Food neophobia predicts membership in one or more food tourist
clusters.
H5: 2a Variety-seeking tendency does not predict membership in any of the food
tourist clusters.
H4:2b Variety-seeking tendency predicts membership in one or more food tourist
clusters.
H4: 3a Hedonic attitude towards food does not predict membership in any food
tourist clusters.
H4: 3b Hedonic attitude towards food predicts membership in one or more food
tourist clusters.
65
H4: 4a Enduring involvement with food related activities does not predict
membership in any of the food tourist clusters.
H4: 4b Enduring involvement with food related activities predicts membership in
one or more food tourist clusters.
Research Question 6: Is there an association between the food tourist clusters and age,
gender, marital status, occupation, education, and annual income of the tourists?
H 6: 1a: There is no significant association between the food tourist clusters and
the age of the tourists.
H 6: 1b: There is a significant association between the food tourist clusters and
the age of the tourists.
H 6: 2a: There is no significant association between the food tourist clusters and
the gender of the tourists.
H 6: 2b: There is significant association between the food tourist clusters and the
gender of the tourists.
H 6: 3a: There is no significant association between the food tourism clusters and
education of the tourists.
H 6: 3b: There is a significant association between the food tourism clusters and
the education of the tourists.
H 6: 4a: There is no significant association between the food tourist clusters and
the marital status of the tourists.
H 6: 4b: There is a significant association between the food tourist clusters and
the marital status of the tourists.
66
H 6: 5a: There is no significant association between the food tourist clusters and
the occupation of the tourists.
H 6: 5b: There is a significant association between the food tourist clusters and
the occupation of the tourists.
H 6: 6a: There is no significant association between the food tourist clusters and
the annual household income of the tourists.
H 6: 6b: There is a significant association between the food tourist clusters and
the annual household income of the tourists.
3.2 Questionnaire Construction
This dissertation employed a mail survey to collect data. The questionnaire consisted of
six sections. The first section measured the frequency of the tourist’s participation in food
related activities at a destination. The second section measured respondents’ variety-
seeking tendency towards food, followed by food neophobia in section three. The fourth
section measured respondents’ enduring involvement with food related activities, while
section five measured hedonic attitude towards food. The final section of the
questionnaire measured the respondents’ demographic and socioeconomic status. The
survey combined unipolar scale, Likert type scales and semantic differential scales.
The Human Subjects Committee of Clemson University reviewed and approved
the survey instrument. As with most academic research, the participants’ individual
responses were confidential and anonymous. Next, the process of constructing the
questionnaire is discussed.
67
3.2.a Pilot Test of the Survey
Three pilot studies were conducted in March 2004 to test the survey and methods
of analysis. The main purpose of the pilot studies was to validate the items generated as
indicators of food tourism.
For the first pilot study, an online survey with the previously mentioned six
sections was posted on travel websites (Lonely Planet and Rough Guides Community).
The section of the questionnaire that measured frequency of participation in food tourism
had fifteen items indicative of food tourism. This questionnaire also had an open-ended
section asking respondents whether they faced any problems while completing the
questionnaire and whether there were any ambiguities with respect to any items on the
questionnaire. The first pilot study resulted in a sample of fifty–seven (N=57). The
analysis resulted in re-wording of the instructions and changes in the structure of the
questions on items that were either incorrectly understood, or showed some systematic
error.
The second pilot study was an on-site survey administered on tourists visiting
New Orleans. Sites which had a very high tourist visibility were selected, and tourists
were intercepted systematically (N= 63). The tourists were timed on the survey and were
asked for their feedback. The third pilot study was conducted on visitors to the annual
PGA golf tournament at Hilton Head, South Carolina. Hundred surveys along with a
business reply envelope were randomly placed on visitors’ cars. The response rate for this
survey was 35 %. The survey was edited once more based on the suggestions of the
respondents and after some more literature review, the final pilot study was conducted.
68
The final pilot study was administered on students (N=42), who had been on a class trip
to New Orleans. Once again, the respondents were timed, as one of the concerns voiced
by the respondents of the second pilot study was the length of the survey.
3.2.b Operationalization of the Dependent
Variable: Participation in Food Tourism
The first and critical step in measuring ‘participation in food tourism’ was to
conceive a precise and detailed operationalization of food tourism within its theoretical
context. Food tourism was operationalized based on existing research, researcher
judgment, tourism educators, the respondents of the pilot studies, and the definition of
food tourism proposed in Chapter One. The approach used was a deductive one and
exploratory in nature.
After an extensive examination of the pertinent literature and three pilot studies,
twenty-nine items were generated that were indicative of food tourism. As mentioned
earlier, the creation of item pool went through an iterative process of exploratory factor
analysis after every pilot study. The item pool representing drinks and beverages was
added after the second pilot study. This was based on suggestions from the tourists that
consuming local beverages was an important component of food related activities at the
destination. Thus, the twenty-nine items that were generated to operationalize food
tourism represented each content area or the component of the proposed definition of
food tourism and were proportional to their importance in the literature. The major
categories of food tourism were:
a) eating at places serving local, regional or distinctive cuisines;
69
b) visiting the primary or secondary producers;
c) visiting food festivals and specific locations for tasting and/or experiencing the
attributes of specialist food production region;
d) experiencing a particular type of food, or the desire to taste the dishes of a
particular chef;
e) purchasing of food and food related products to make it a part of daily life, or as
memorabilia;
f) consuming local drinks.
Participation in food tourism was operationalized as a continuous variable. In
leisure and recreation studies, the leisure activity scales constructed to measure
participation in leisure activities typically use unipolar scales. (Agnew & Peterson, 1989;
Bixler, 1994; Kelly, 1996; Yin, Katims, & Zapata, 1999; Yu, 1980). In addition, for the
unipolar scales, normally the respondents answer the frequency of their participation
from choices such as never, seldom and frequently (Spector, 1992). Following that
tradition, the respondents of the current investigation were asked how often they took part
in the list of food related activities while they were traveling for pleasure. The twenty-
nine items were placed on a five point unipolar frequency scale with choices of 1= never,
2=rarely, 3= sometimes, 4=frequently, and 5= always. Table 3.1 displays the list of 29
items generated to measure food tourism.
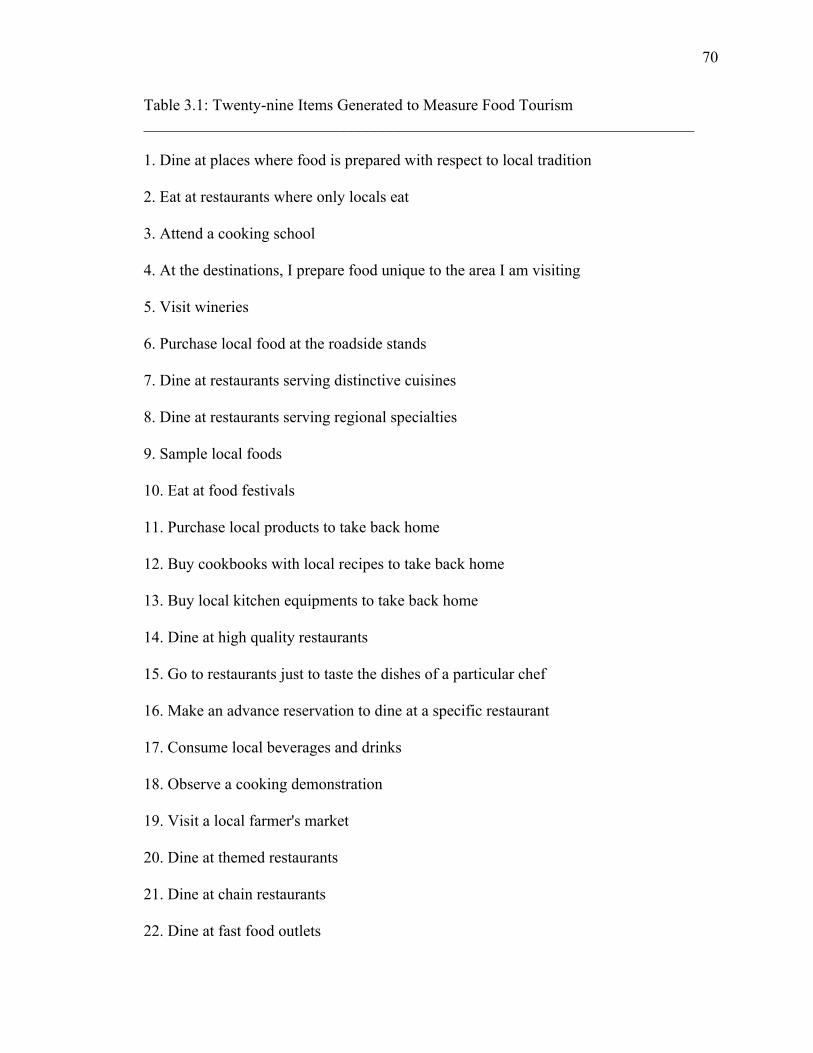
70
Table 3.1: Twenty-nine Items Generated to Measure Food Tourism _____________________________________________________________________ 1. Dine at places where food is prepared with respect to local tradition
2. Eat at restaurants where only locals eat
3. Attend a cooking school
4. At the destinations, I prepare food unique to the area I am visiting
5. Visit wineries
6. Purchase local food at the roadside stands
7. Dine at restaurants serving distinctive cuisines
8. Dine at restaurants serving regional specialties
9. Sample local foods
10. Eat at food festivals
11. Purchase local products to take back home
12. Buy cookbooks with local recipes to take back home
13. Buy local kitchen equipments to take back home
14. Dine at high quality restaurants
15. Go to restaurants just to taste the dishes of a particular chef
16. Make an advance reservation to dine at a specific restaurant
17. Consume local beverages and drinks
18. Observe a cooking demonstration
19. Visit a local farmer's market
20. Dine at themed restaurants
21. Dine at chain restaurants
22. Dine at fast food outlets
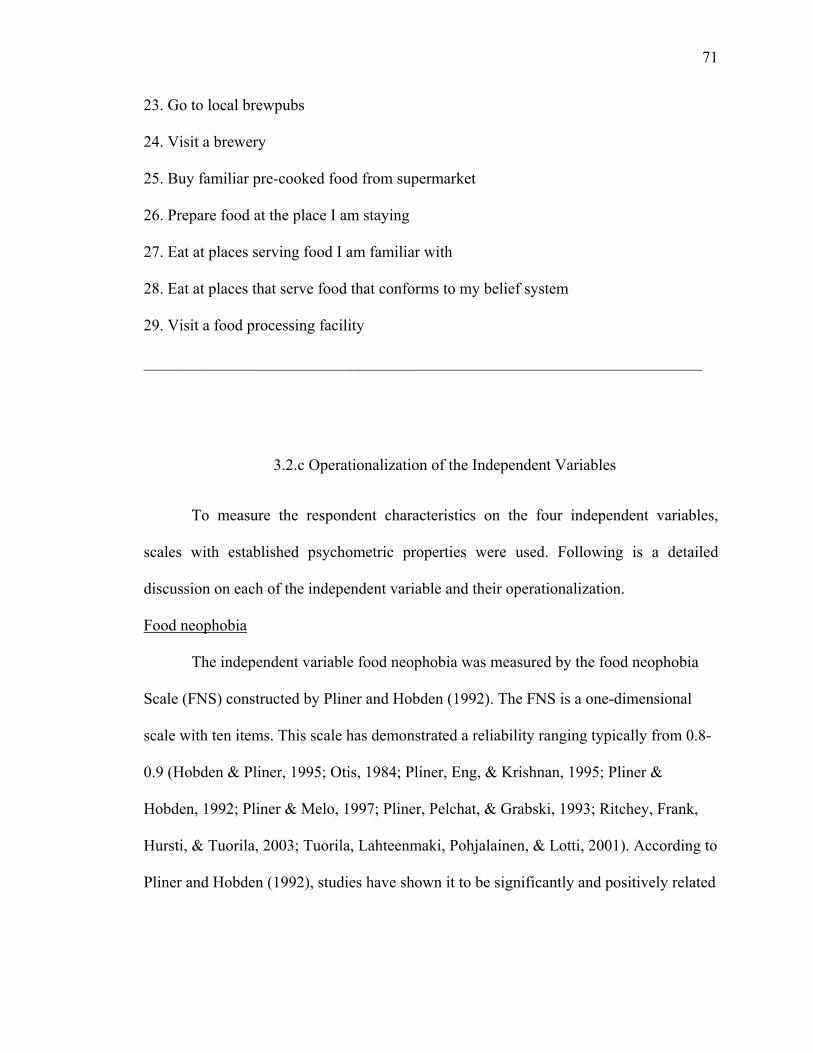
71
23. Go to local brewpubs
24. Visit a brewery
25. Buy familiar pre-cooked food from supermarket
26. Prepare food at the place I am staying
27. Eat at places serving food I am familiar with
28. Eat at places that serve food that conforms to my belief system
29. Visit a food processing facility ______________________________________________________________________
3.2.c Operationalization of the Independent Variables
To measure the respondent characteristics on the four independent variables,
scales with established psychometric properties were used. Following is a detailed
discussion on each of the independent variable and their operationalization.
Food neophobia
The independent variable food neophobia was measured by the food neophobia
Scale (FNS) constructed by Pliner and Hobden (1992). The FNS is a one-dimensional
scale with ten items. This scale has demonstrated a reliability ranging typically from 0.8-
0.9 (Hobden & Pliner, 1995; Otis, 1984; Pliner, Eng, & Krishnan, 1995; Pliner &
Hobden, 1992; Pliner & Melo, 1997; Pliner, Pelchat, & Grabski, 1993; Ritchey, Frank,
Hursti, & Tuorila, 2003; Tuorila, Lahteenmaki, Pohjalainen, & Lotti, 2001). According to
Pliner and Hobden (1992), studies have shown it to be significantly and positively related
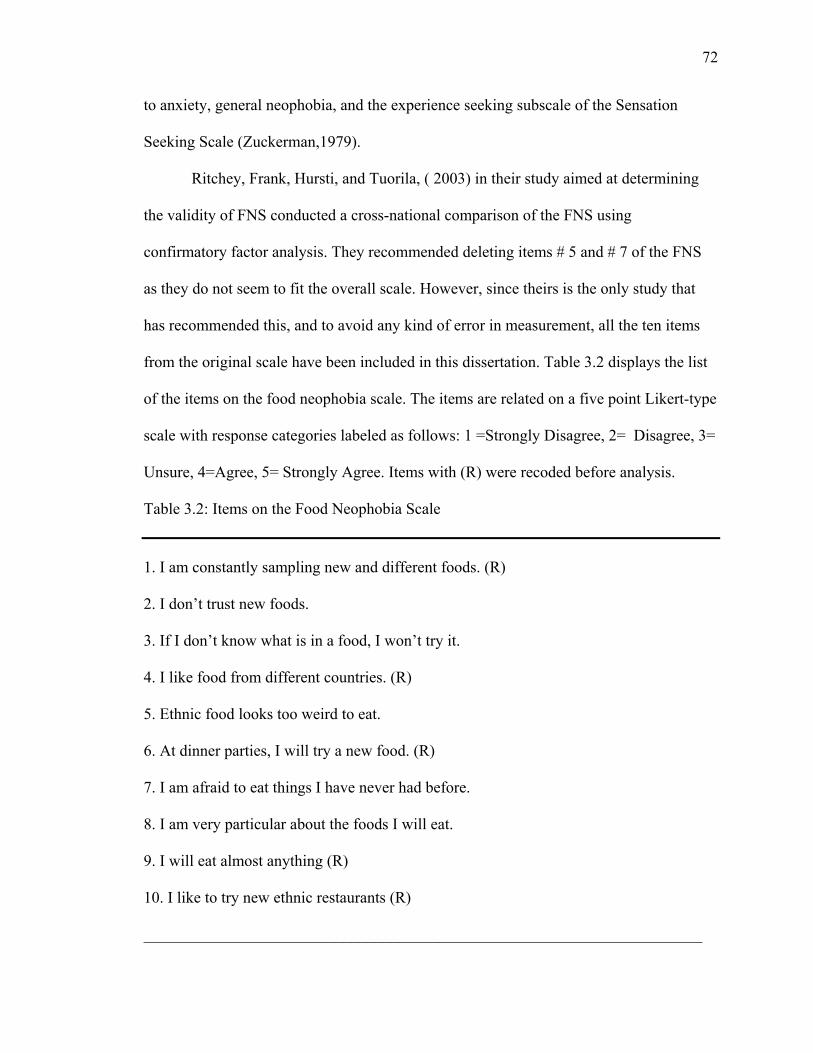
72
to anxiety, general neophobia, and the experience seeking subscale of the Sensation
Seeking Scale (Zuckerman,1979).
Ritchey, Frank, Hursti, and Tuorila, ( 2003) in their study aimed at determining
the validity of FNS conducted a cross-national comparison of the FNS using
confirmatory factor analysis. They recommended deleting items # 5 and # 7 of the FNS
as they do not seem to fit the overall scale. However, since theirs is the only study that
has recommended this, and to avoid any kind of error in measurement, all the ten items
from the original scale have been included in this dissertation. Table 3.2 displays the list
of the items on the food neophobia scale. The items are related on a five point Likert-type
scale with response categories labeled as follows: 1 =Strongly Disagree, 2= Disagree, 3=
Unsure, 4=Agree, 5= Strongly Agree. Items with (R) were recoded before analysis.
Table 3.2: Items on the Food Neophobia Scale
1. I am constantly sampling new and different foods. (R)
2. I don’t trust new foods.
3. If I don’t know what is in a food, I won’t try it.
4. I like food from different countries. (R)
5. Ethnic food looks too weird to eat.
6. At dinner parties, I will try a new food. (R)
7. I am afraid to eat things I have never had before.
8. I am very particular about the foods I will eat.
9. I will eat almost anything (R)
10. I like to try new ethnic restaurants (R)
______________________________________________________________________
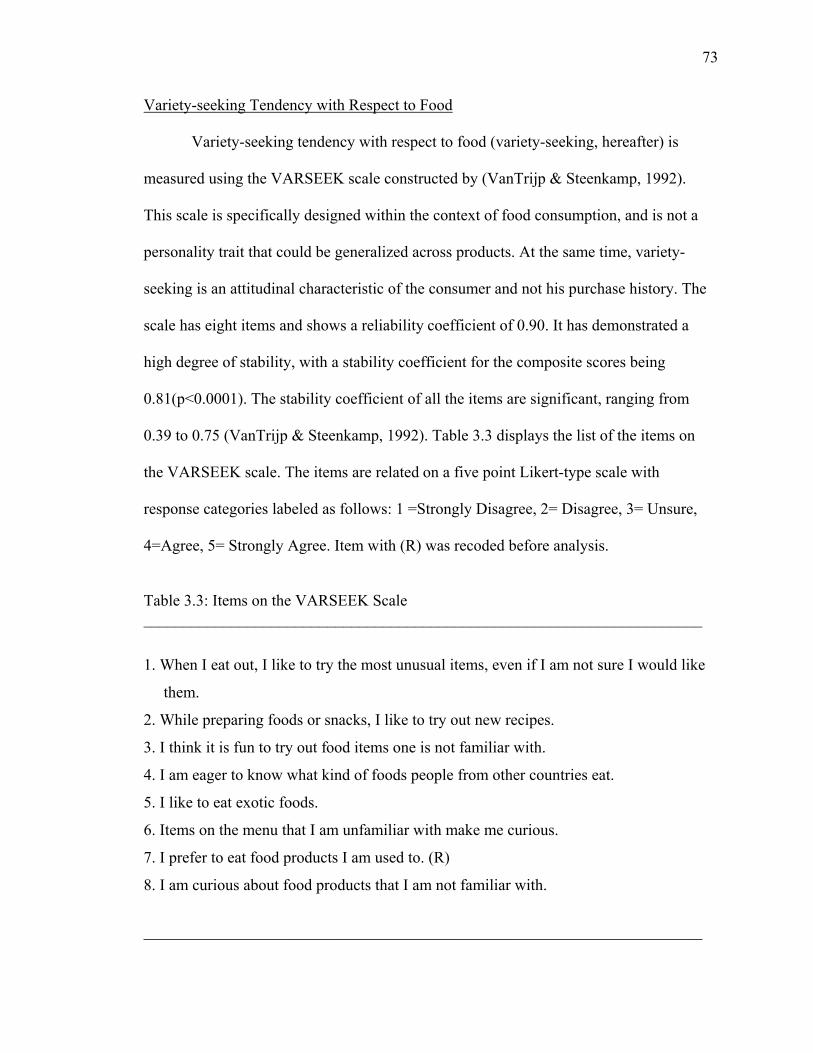
73
Variety-seeking Tendency with Respect to Food
Variety-seeking tendency with respect to food (variety-seeking, hereafter) is
measured using the VARSEEK scale constructed by (VanTrijp & Steenkamp, 1992).
This scale is specifically designed within the context of food consumption, and is not a
personality trait that could be generalized across products. At the same time, variety-
seeking is an attitudinal characteristic of the consumer and not his purchase history. The
scale has eight items and shows a reliability coefficient of 0.90. It has demonstrated a
high degree of stability, with a stability coefficient for the composite scores being
0.81(p<0.0001). The stability coefficient of all the items are significant, ranging from
0.39 to 0.75 (VanTrijp & Steenkamp, 1992). Table 3.3 displays the list of the items on
the VARSEEK scale. The items are related on a five point Likert-type scale with
response categories labeled as follows: 1 =Strongly Disagree, 2= Disagree, 3= Unsure,
4=Agree, 5= Strongly Agree. Item with (R) was recoded before analysis.
Table 3.3: Items on the VARSEEK Scale ______________________________________________________________________
1. When I eat out, I like to try the most unusual items, even if I am not sure I would like
them.
2. While preparing foods or snacks, I like to try out new recipes.
3. I think it is fun to try out food items one is not familiar with.
4. I am eager to know what kind of foods people from other countries eat.
5. I like to eat exotic foods.
6. Items on the menu that I am unfamiliar with make me curious.
7. I prefer to eat food products I am used to. (R)
8. I am curious about food products that I am not familiar with.
______________________________________________________________________
74
Hedonic Consumption Attitude Towards Food
The respondents’ hedonic consumption attitude towards food (hedonic
consumption, hereafter) was measured using the Hedonic Consumption Attitude Scale
(Batra & Ahtola, 1991). This scale is made up of two dimensions: hedonism and
utilitarian, with four items each. The eight items were measured on a seven point
semantic differential scale. Most of the existing measures of the hedonic and utilitarian
construct use semantic differential scale (Babin, Darden, & Griffin, 1994; Spangenberg,
Voss, & Crowley, 1997).The utilization of semantic differential scales has been
suggested as an appropriate measurement of attitudes (Osgood, Suci, & Tannenbaum,
1967).
With respect to its psychometric properties, the Cronbach’s reliability coefficient
for the hedonism dimension is 0.75, and for the utilitarian dimension != 0.80 (Batra &
Ahtola, 1991). According to Spangenberg et al. (1997), one of the weaknesses of this
scale is that it cannot be generalized across all product categories and does not
incorporate the theoretical concept of involvement. Hence, their suggestion was that
involvement should be measured concurrently with Batra and Ahtola’s Hedonic
Consumption Attitude Scale. Table 3.4 displays the eight items of the hedonic
consumption attitude scale.

75
Table 3.4: Items and Dimensions on the Hedonic Consumption Attitude Scale ______________________________________________________________________ Hedonism Dimension (! =0.75)
Pleasant ___: ___: ___:___:___:___:___ Unpleasant
Nice ___:___:___:___:___:___:___ Awful
Agreeable ___:___:___:___:___:___:___ Disagreeable
Happy___:___:___:___:___:___: ___ Sad
Utilitarian Dimension (! =0.80)
Useful ___:___:___:___:___:___:___Useless
Valuable___:___:___:___: ___:___:___ Worthless
Beneficial ___:___:___:___:___:___:___ Harmful
Wise ___:___:___:___:___: ___:___ Foolish ______________________________________________________________________
Enduring Involvement with Food-related Activities
To measure the respondents’ enduring involvement with food and food-related
activities, the Modified Involvement Scale by Kyle at al. (2004) was used. This scale is
composed of five dimensions: 1) attraction, 2) centrality, 3) social bonding, 4) identity
affirmation, and 5) identity expression. Though a number of scales measuring consumers’
involvement exist in the consumer behavior and leisure studies literature (Dimanche,
Havitz & Howard, 1991; Laurent & Kapferer, 1985; McIntyre 1989; Zaichkowsky,
1985), the Modified Involvement Scale was chosen because it is composed of dimensions
such as social bonding, identity expression and identity affirmation. As seen from the
literature review of enduring involvement with food-related activities, the aforementioned
dimensions are considered influential in the study of food consumption.
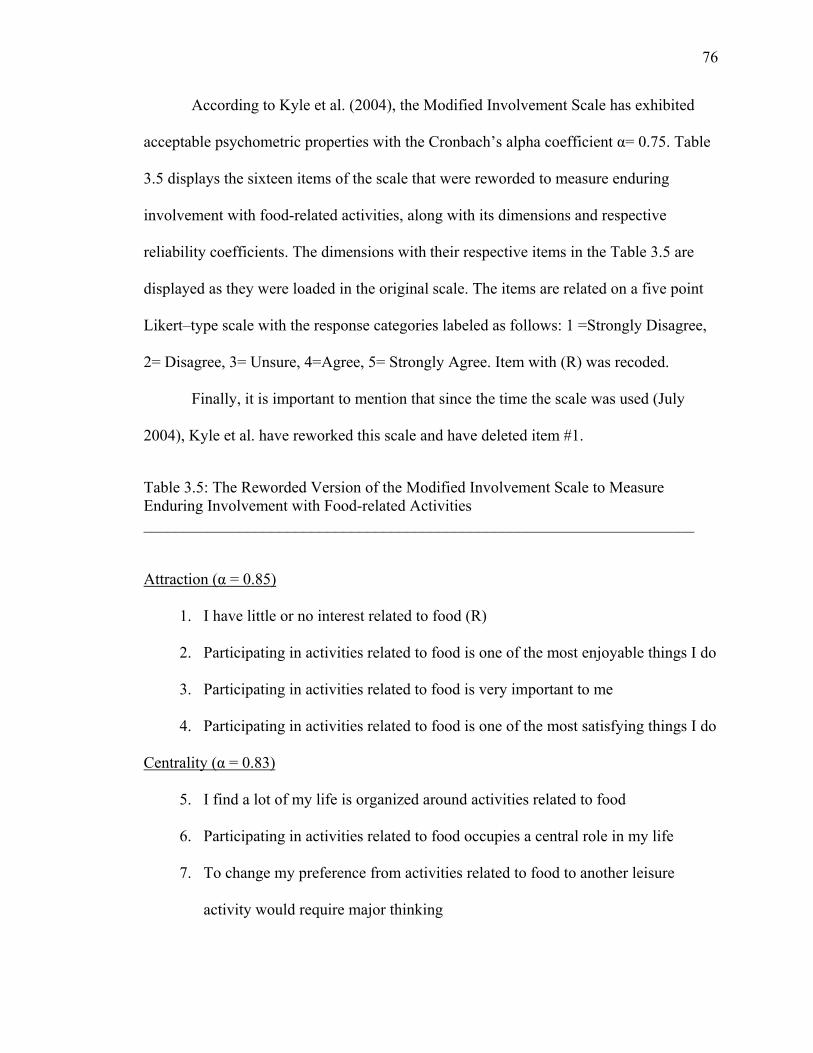
76
According to Kyle et al. (2004), the Modified Involvement Scale has exhibited
acceptable psychometric properties with the Cronbach’s alpha coefficient != 0.75. Table
3.5 displays the sixteen items of the scale that were reworded to measure enduring
involvement with food-related activities, along with its dimensions and respective
reliability coefficients. The dimensions with their respective items in the Table 3.5 are
displayed as they were loaded in the original scale. The items are related on a five point
Likert–type scale with the response categories labeled as follows: 1 =Strongly Disagree,
2= Disagree, 3= Unsure, 4=Agree, 5= Strongly Agree. Item with (R) was recoded.
Finally, it is important to mention that since the time the scale was used (July
2004), Kyle et al. have reworked this scale and have deleted item #1.
Table 3.5: The Reworded Version of the Modified Involvement Scale to Measure Enduring Involvement with Food-related Activities _____________________________________________________________________
Attraction (! = 0.85)
1. I have little or no interest related to food (R)
2. Participating in activities related to food is one of the most enjoyable things I do
3. Participating in activities related to food is very important to me
4. Participating in activities related to food is one of the most satisfying things I do
Centrality (! = 0.83)
5. I find a lot of my life is organized around activities related to food
6. Participating in activities related to food occupies a central role in my life
7. To change my preference from activities related to food to another leisure
activity would require major thinking

77
Social Bonding (! = 0.67)
8. I enjoy discussing activities related to food with my friends
9. Most of my friends have an interest in activities related to food
10. Participating in activities related to food provide me with an opportunity to be
with friends
Identity Affirmation (! = 0.64)
11. When I am participating in activities related to food, I can really be myself
12. I identify with the people and images associated with activities related to food
13. When I am participating in activities related to food, I don’t have to be
concerned with the way I look
Identity Expression (! = 0.74)
14. You can tell a lot about person by seeing him/her participating in activities
related to food
15. Participating in activities related to food says a lot about who I am
16. When I am participating in activities related to food, others see me the way I
want them to see
______________________________________________________________________
Sociodemographic Variables
The respondents were asked questions with respect to their socio-economic and
demographic status. Sociodemographic variables that were utilized for this dissertation
were: gender, age, employment status, education, marital status, annual household
income and zip code. Age was operationalized by asking the respondents’ current age.
78
Gender (male or female), marital status (married; widowed; divorced or separated; never
married), education (high school; college; professional; post-graduate), employment
(employed full-time; employed part-time; student; homemaker; unemployed; retired;
other), and annual household income (under $ 10,000; $10,000-$19,999; $20,000-
$39,999; $40,000-$59,999; $60,000-$79,999; $80,000-$99,999; $100,000 or more) were
operationalized as categorical variables.
3.3 Research Design
Population
The target population of this investigation was individuals who visited one of the
four counties of coastal South Carolina on randomly selected days from July 2004
through October 2004. The four coastal counties that were selected for this study were
Horry, Charleston, Beaufort, and Georgetown. These counties together account for the
highest number of visitors to the state as the coastal region (Source: SCPRT, 2003) with a
total annual visitation of 13, 990,972. During the months of July, August, September,
and October 4,896,840 visited these four counties, which make up 35% of the annual
visitors. Thus, based on this data, the population of this study was determined to be
4,896,840.
Sampling Frame
To give a sense of structure to the sampling frame and make the study more
manageable, the study areas were grouped into three regions. These were Region 1:
Horry and Georgetown counties, Region 2: Charleston county, and Region 3: Beaufort
county.
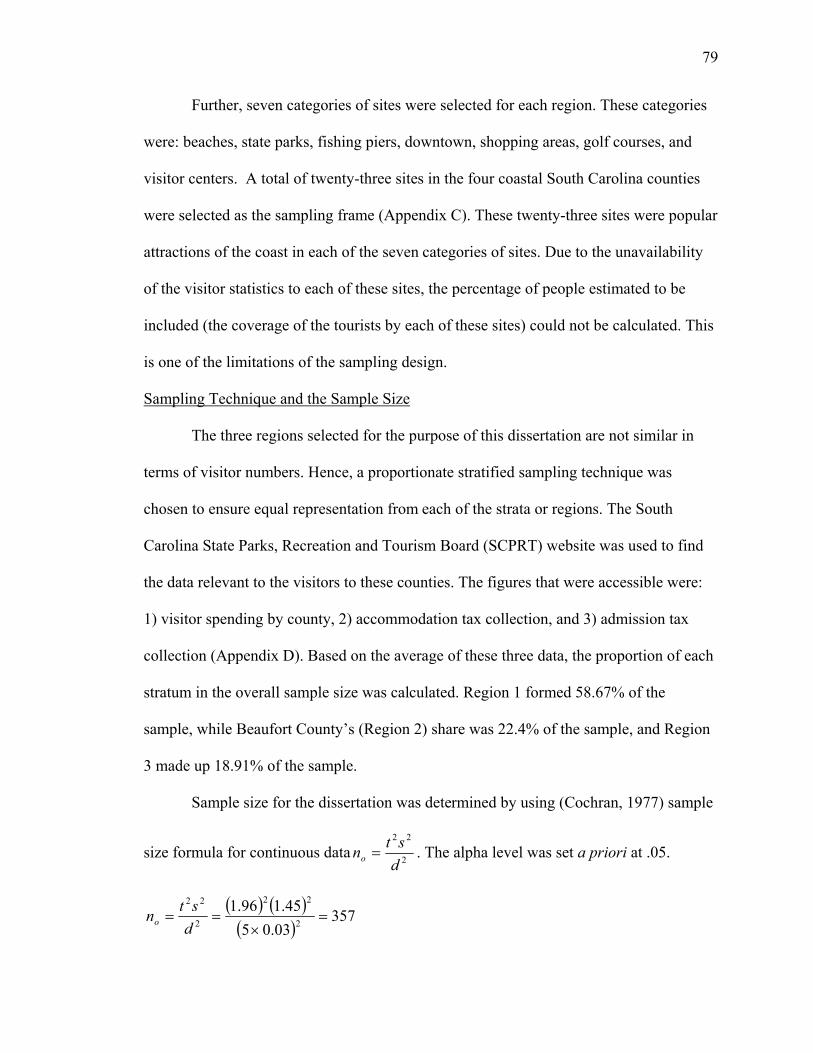
79
Further, seven categories of sites were selected for each region. These categories
were: beaches, state parks, fishing piers, downtown, shopping areas, golf courses, and
visitor centers. A total of twenty-three sites in the four coastal South Carolina counties
were selected as the sampling frame (Appendix C). These twenty-three sites were popular
attractions of the coast in each of the seven categories of sites. Due to the unavailability
of the visitor statistics to each of these sites, the percentage of people estimated to be
included (the coverage of the tourists by each of these sites) could not be calculated. This
is one of the limitations of the sampling design.
Sampling Technique and the Sample Size
The three regions selected for the purpose of this dissertation are not similar in
terms of visitor numbers. Hence, a proportionate stratified sampling technique was
chosen to ensure equal representation from each of the strata or regions. The South
Carolina State Parks, Recreation and Tourism Board (SCPRT) website was used to find
the data relevant to the visitors to these counties. The figures that were accessible were:
1) visitor spending by county, 2) accommodation tax collection, and 3) admission tax
collection (Appendix D). Based on the average of these three data, the proportion of each
stratum in the overall sample size was calculated. Region 1 formed 58.67% of the
sample, while Beaufort County’s (Region 2) share was 22.4% of the sample, and Region
3 made up 18.91% of the sample.
Sample size for the dissertation was determined by using (Cochran, 1977) sample
size formula for continuous data 2
22
dstno ! . The alpha level was set a priori at .05.
" # " #" #
35703.05
45.196.12
22
2
22
!$
!!dstno
80
where, t = value for selected alpha of .025 in each tail =1.96 for N above 120 ;
s = estimate of the standard deviation in the population = 1.45 (based on the pilot
study results of the scores on the dependent variable food tourism)
d = acceptable margin of error of mean being estimated. For continuous data, 3%
margin of error is acceptable (Krejcie & Morgan, 1970). A 3% margin of error would
result in the researcher being confident that the true mean of a five-point scale is within
+ 0.15 (.03 times five points on the scale) of the mean calculated from the research
sample. Therefore, for a population of 4,896,840, the minimum required sample is 357.
However, for data collection methods such as surveys and other voluntary
participation methods, the response rates are typically less than 100%.Therefore over
sampling by increasing the sample size by 40% - 50% to account for lost mail or
uncooperative subjects is recommended (Salkind, 1997). The sample size was set at 830
in order to ensure a large enough sample even with a poor response rate.
3.4 Data Collection Process
The data collection procedure was obtained within the context of non–resident
traveler to the coastal South Carolina, and was divided into two phases. The first phase
consisted of collecting addresses from the tourists who visited the South Carolina coast,
and the second phase was that of mailing surveys. The survey dates were chosen
randomly for each of the sites with a total of forty–three days over a period of four
months. The research assistants stationed at each of these sites intercepted every nth
individual who crossed an imaginary line set by the research assistants. However, this
interval (n) was dependent on the surveyor’s discretion, the time and the location.
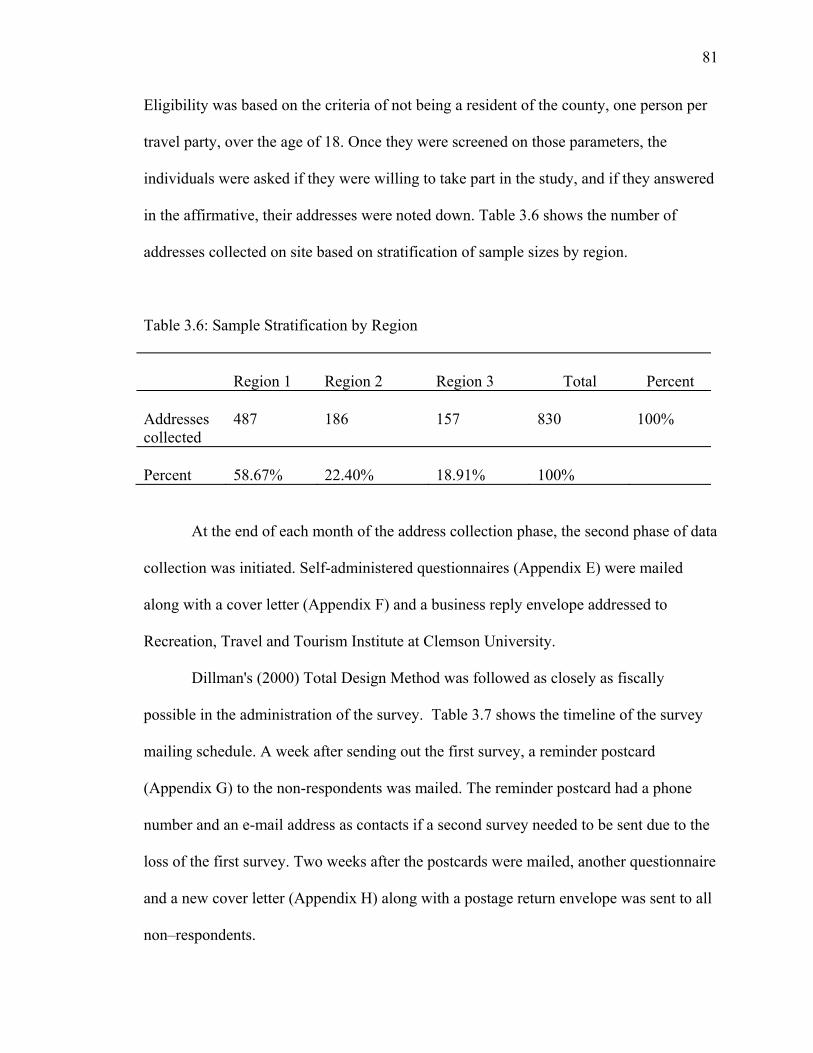
81
Eligibility was based on the criteria of not being a resident of the county, one person per
travel party, over the age of 18. Once they were screened on those parameters, the
individuals were asked if they were willing to take part in the study, and if they answered
in the affirmative, their addresses were noted down. Table 3.6 shows the number of
addresses collected on site based on stratification of sample sizes by region.
Table 3.6: Sample Stratification by Region
Region 1
Region 2
Region 3
Total
Percent
Addresses collected
487
186
157
830
100%
Percent
58.67%
22.40%
18.91%
100%
At the end of each month of the address collection phase, the second phase of data
collection was initiated. Self-administered questionnaires (Appendix E) were mailed
along with a cover letter (Appendix F) and a business reply envelope addressed to
Recreation, Travel and Tourism Institute at Clemson University.
Dillman's (2000) Total Design Method was followed as closely as fiscally
possible in the administration of the survey. Table 3.7 shows the timeline of the survey
mailing schedule. A week after sending out the first survey, a reminder postcard
(Appendix G) to the non-respondents was mailed. The reminder postcard had a phone
number and an e-mail address as contacts if a second survey needed to be sent due to the
loss of the first survey. Two weeks after the postcards were mailed, another questionnaire
and a new cover letter (Appendix H) along with a postage return envelope was sent to all
non–respondents.

82
Table 3.7: Survey Administration Schedule
Date Survey Mailing
25 August 2004 First set of surveys to sample intercepted in July 2004
2 September 2004 Reminder postcards to sample intercepted in July 2004
17 September 2004 Follow-up surveys to sample intercepted in July 2004
17 September 2004 First set of surveys to sample intercepted in August 2004
25 September 2004 Reminder postcards to sample intercepted in August 2004
9 October 2004 Follow-up surveys to sample intercepted in August 2004
9 October 2004 First set of surveys to sample intercepted in September 2004
17 October 2004 Reminder postcards to sample intercepted in September 2004
1 November 2004 Follow-up surveys to sample intercepted in September 2004
1 November 2004 First set of surveys to sample intercepted in October 2004
11 November 2004 Reminder postcards to sample intercepted in October 2004
24 November 2004 Follow-up surveys to sample intercepted in October 2004
3.5 Statistical Approach to Hypotheses
In order to test the proposed hypotheses and to describe the sample of the study,
the Statistical Package for the Social Sciences: SPSS 13.0 was utilized. The analyses
consist of the following steps:
1. Screening the Data
Descriptive analyses of all the variables under study were performed for screening
the dataset. The data was checked for accuracy of data entry, missing values, and detect
univariate and multivariate outliers. In addition, the data was checked for fit between the
83
distributions of all the variables and to verify if the data meets the assumptions of
multivariate analysis.
2. Confirming the Factor Structure and Reliabilities of the Study’s Scales
The scales utilized in the current study to operationalize the independent variables
were tested for their factor structure and reliabilities. Factor analysis is a statistical
technique that can be applied to a group of variables in which there are no independent or
dependent variables. It differs from other multivariate techniques in that it summarizes
large number of correlated variables to a smaller number of factors, and provides an
operational definition for an underlying process by using observed variables (Tabachnick
& Fidell, 2001). Therefore, factor analysis was conducted to verify whether the
measurement scales used to operationalize the independent variables in the current study
show similar underlying dimensions as the original scales.
Further, these scales are tested for their reliabilities by examining their
Cronbach’s alpha. Cronbach’s alpha is the most commonly used measure of reliability for
a set of two or more construct indicators. It indicates how well a set of items measure a
construct. It is a function of the number of items and the average inter- item correlation
among the items, in that, as the number of items increase, the Cronbach’s alpha increases,
and as the average inter-item correlation increases, the Cronbach’s alpha increases. Their
values range between zero and one, with higher values indicating a better reliability of
the construct (Hair, Anderson, Tatham, & Black, 1995).
3. Testing Hypothesis 1
To test the null hypothesis that food tourism is not composed of multiple factors
or components, the data reduction techniques of exploratory factor analysis (EFA) was
84
conducted on the items generated to operationalize food tourism. The method of
extraction chosen was principal axis factoring since the research question demanded
identifying the underlying structure of food tourism activities. Principal factor analysis
allows only the shared variance to be analyzed with unique and error variance removed
(Tabachnick & Fidell, 2001). Factors are supposed to cause variables and the underlying
factor structure is what produces scores on the variables. The adequacy of the number of
factors was based on the size of eigenvalue reported greater than one, and was confirmed
by looking at the discontinuity in eigenvalue as revealed by the scree plots. Two major
questions were addressed during the analysis: (a) the number of factors that represent the
items and (b) the interpretation of the factors. The main objective of this analysis was to
find out what were the different classes of activities that made food tourism.
4. Testing Hypotheses 2
In order to examine the relationship between the independent variables and
participation at least one of the dimensions of food tourism, standard multiple regression
was employed. Standard multiple regression assesses the relationship between one
dependent variable and multiple independent variables by entering all the independent
variables into the model at the same time.
The analysis of variance (ANOVA) F-statistic reveals the overall significance of
the model, and the adjusted R2 reflects the variance accounted for by the model in
explaining participation in food tourism. In addition, the variance uniquely explained by
each independent variable was attributed to its explanation of the dependent variable by
the semi-partial correlations. The significance of the independent variables in the model
was assessed by the p-values set at ! =0.05.
85
The standardized regression coefficients (") give a measure of the contribution of
each variable to the model. They signify the expected change in the dependent variable
for each unit increase in the independent variable, after the independent variables are
standardized (Tabachnick and Fidell, 2001).The significance levels of the unstandardized
regression coefficients( B) are assessed through their confidence intervals such that the
95% confidence intervals should not include zero.
Based on the number of factors that would be extracted from factor analysis of the
items operationalized as food tourism, corresponding number of regression models were
tested with each of these factors as the dependent variable.
5. Testing Hypotheses 3
The differences in the tourist’s participation in each of the dimensions of food
tourism with respect to their age, gender, education, employment status, marital status,
and annual household income were analyzed using the multivariate analysis of variance
(MANOVA). This statistical test finds the significant differences in the set of dependent
measures (the dimensions of food tourism, in the current investigation) across a series of
group formed by one or more categorical independent measures. Therefore, six
MANOVA tests were conducted to assess for the significance of each of the six
sociodemographic variables on the dependent variable(s).
MANOVA evaluates differences among centroids for a set of dependent
variables. If there are significant differences for the main effect, then a post hoc test was
done to assess what dimensions of food tourism were being affected by what category of
a particular sociodemographic variable. The significance of the multivariate F was
assessed by the Wilks’ lambda reported by SPSS MANOVA. According to Tabachnick
86
and Fidell (2001), Wilks’ lambda is a likelihood ratio statistic that is most commonly
used criteria for significance inference. “It tests the likelihood of the data under the
assumption of equal population mean vectors for all groups against the likelihood under
the assumption that population mean vectors are identical to those of the sample mean
vectors for different groups. Wilks’ lambda is the pooled ratio of effect variance to error
variance” (Tabachnick & Fidell, 2001, p.348).
6. Testing Hypothesis 4
To test the null hypothesis that tourists cannot be segmented into homogenous
clusters based on their participation in food tourism, cluster analysis was performed on
the tourists. Clusters of respondents were created using Ward’s method. Ward’s method
is a hierarchical method, using squared Euclidean distance that maximizes between group
variance and minimizes within group variance. The objects being clustered, in this case
the respondents of the current study, were all assigned a separate cluster, and those
clusters were combined until a stopping point was determined. The mean scores of each
of the factors obtained by the factor analysis of the items measuring food tourism were
used as the clustering variables.
The agglomeration schedule similar to scree-plots in factor analysis was examined
for large changes in agglomeration coefficients. These were noted as potential stopping
points. The cluster solution that was selected was cross–validated with a k-means cluster
analysis. Stability of the solution was also examined for the k-means clustering by
considering a random initial seed (centroids), which was iterated until the Euclidean
distance between centroids change to less than 2%. Use of this iterative approach reduces
the chances of biases entering the designation of initial cluster seeds, and assures stable
87
clusters once the procedure meets the 2% convergent criterion (Hair et al., 1995). The
final cluster-centroids should be nearly identical, thus validating the cluster solution
selected.
One-way analysis of variance was used to test whether the clusters show
significantly different means across the factors of food tourism. ANOVA is a statistical
tool for comparing two or more means with an objective to test if there are any significant
differences between them. Final determination of clusters was based on researcher
judgment of interpretability of cluster means (Milligan & Cooper, 1985).
Finally, the cluster solution was cross-validated using the cross validation
technique provided by SPSS multiple discriminant analysis. Multiple discriminant
analysis uses this pre-existing classification and the factors linearly to predict the group
to which each respondent belongs. The cross-validation technique helps confirm the
results of the cluster analysis by showing the adequacy of classifications.
Clusters were then labeled based on their scores on each of the factors, relative to
the scores of other clusters, and the grand mean for each factor. The factor scores for each
cluster were summated to obtain an overall score for the clusters. Based on these scores,
the tourist clusters’ frequency of participation in food tourism was predicted
7. Testing for Hypotheses 5
Multinomial logistic regression was conducted to identify variables that predict
membership in each of the posteriori food tourist clusters. Multinomial logistic regression
is similar to multiple discriminant analysis in that it allows prediction of group
membership when predictors are continuous. However, it requires far few assumptions
than multiple discriminant analysis and is relatively free of restrictions, with a capacity to
88
analyze a mix of predictors with any level of measurement (Tabachnick & Fidell,
2001).Unlike multiple discriminant analysis, assumptions of homogeneity of variance –
covariance in the outcome groups are not required for the prediction of group
membership to be optimal. Though it is unlikely that two methods will yield markedly
different results or substantially dissimilar linear functions (Press & Wilson, 1978)
The significance of the overall model was tested by %2 test of model coefficients,
which assumes the null hypothesis that no variable can predict group membership. The
goodness of fit statistics compares the observed frequencies with the expected
frequencies for each cluster. Here, a non-significant difference was desired, as it indicates
that the full or incomplete model adequately duplicated the observed frequencies at the
various levels of outcome. This test also provided the R2 for the variance explained by the
model.
The parameter estimates are the tests of individual variables. These tests evaluated
the contribution of each predictor to the model. Further, the clusters were compared
against each other to identify the variables that separated one cluster from the other.
According to Tabachnick and Fidell (2001), the Wald’s statistic and the odds ratio
evaluate the significance of each of the variables in predicting membership to the
clusters. The Wald statistic is the function of logistic regression coefficient divided by the
standard error, and is similar to the t-statistic. The importance of predictors was evaluated
by the odds ratio. Those predictors that changed the odds of the outcome the most were
interpreted as the most important. That is, the farther the odds ratio was from one, the
more influential the variable was, in predicting membership in different clusters.
89
The likelihood ratio test compares the models with and without each predictor,
and is generally considered superior to the Wald statistic. SPSS NOMREG ran the model
with and without each predictor to produce the likelihood ratio test to assess the
reliability of improvement in fit when a predictor is included in the model. The
significance value shows if the model is significantly degraded by removal of each
predictor (Tabachnick & Fidell, 2001) Finally, the classification analysis was conducted
to assess the success of the model in its ability to predict the outcome category for cases,
for which outcome is known.
8. Testing Hypotheses 6
To test the association between the sociodemographic variables and the food
tourist clusters, chi-square tests of associations were conducted for each of the
sociodemographic variable. This test determines whether two variables measured on
nominal or categorical variables are associated with each other by comparing the
difference between the observed frequency distribution and the expected distribution
(Kerr, Hall and Kozub, 2002). The contingency tables provide the observed and the
expected frequencies, and the Pearson’s chi-square is the test of significance which
assesses the association between the two variables.
3.6 Synopsis of the Chapter
This chapter discussed the methodology that was used to guide the dissertation.
First, the hypotheses for each of the research questions of the dissertation were presented.
Next, the construction of the questionnaire was discussed with an examination of each
section of the questionnaire. Further, the dependent variable and the independent

90
variables were presented and operationalized. In addition, the chapter discussed the
research design, population, and the method of analysis. The findings are presented in
Chapter Four
CHAPTER FOUR
4. DESCRIPTIVE FINDINGS
This chapter is divided into two sections. First section is a brief description of the
procedures used to examine and prepare the data for hypothesis testing. Second section
details the profiles of the respondents and a profile of the responses to the variables under
study.
4.1 Screening of the Data
For an accurate analysis of the dataset and avoid statistical problems later, certain
data checks were completed on the data prior to the analysis. The data was checked for
accuracy of data entry, missing values, and fit between their distributions and the
assumptions of multivariate analysis (Tabachnick & Fidell, 2001). Examination of the
missing data showed that none of the variable items had missing values exceeding 5%,
but 5.8% of the cases (n=19) had missing values. The pattern of missing values was
found to be completely random. Since the missing data for cases exceeded the
recommended 5% limit and the pattern was found to be completely random, the
imputation technique of expectation-maximization (EM) was employed to replace the
missing values. EM procedure offers the most logical approach to imputation of missing
data, as “it has the advantages of avoiding impossible matrices, avoiding over fitting and
producing realistic estimates of variance” (Tabachnick & Fidell, 2001, p.63)
92
Univariate normality of the items as well as multivariate normality and linearity
between items were investigated. Three items had extreme skew and kurtosis. Data
transformations, including the logarithmic transformation, were attempted with no
significant improvement in the distribution. The reason behind this seeming anomaly was
investigated further, and it was found that the respondents overwhelmingly (more than
70%) checked the lowest on those scales leading a highly skewed distribution with very
low variability. Hence, these three items were deleted from the data set. These were: 1)
Visit a food processing facility, 2) Attend a cooking school, and 3) Eat at places that
serve food that conforms to my belief system
Eight multivariate outliers were detected through the Mahalanobis distance metric
with p<0.001 (which corresponds to Mahalanobis distance < 149.4). Stepwise regression
was used to identify the combination of variables on which each of these cases deviated
form the remaining cases. Each outlying case was evaluated separately by using the
regression procedure where a dummy variable was created to separate the outlying case
from the remaining cases. Examination of their scores on the variables that caused them
to be outliers showed a consistent pattern of extreme values on the scale items and
differed significantly from the scores of the remaining sample for those variables. Hence,
these eight cases were deleted, leaving 341 cases for analysis. Test for multicollinearity
was not performed on the items representing the dependent variable because one of the
objectives of this research was to find out the underlying dimensions of that variable.
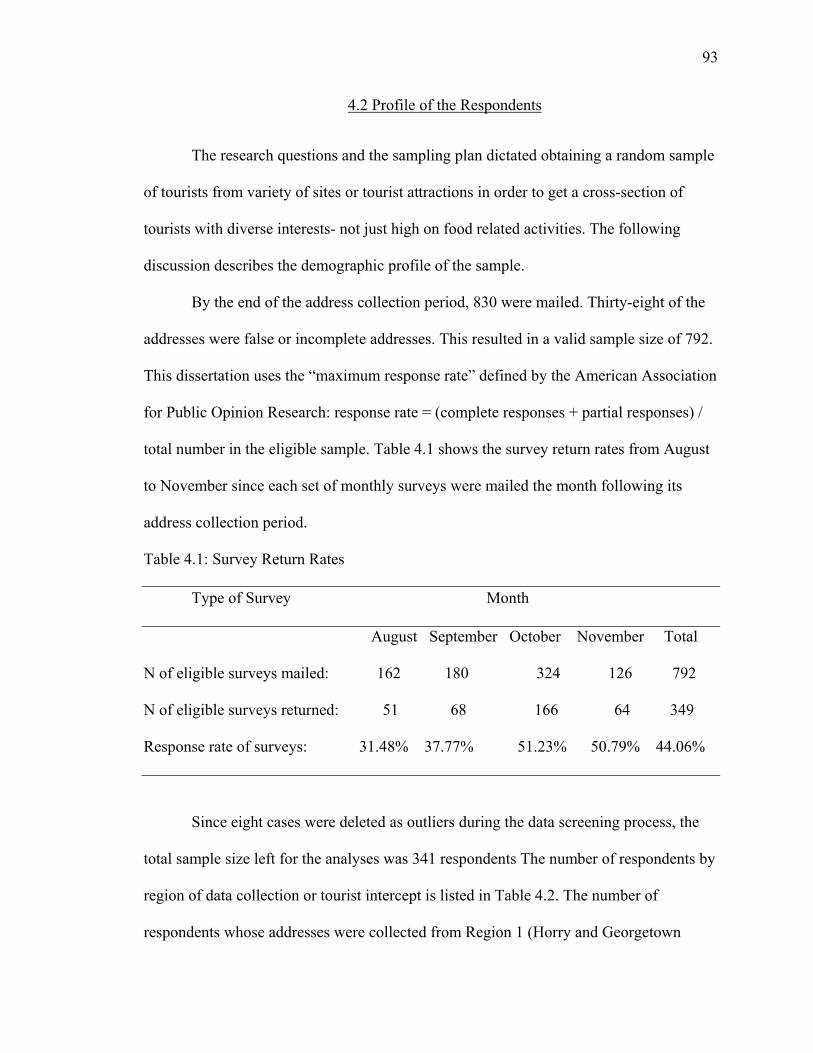
93
4.2 Profile of the Respondents
The research questions and the sampling plan dictated obtaining a random sample
of tourists from variety of sites or tourist attractions in order to get a cross-section of
tourists with diverse interests- not just high on food related activities. The following
discussion describes the demographic profile of the sample.
By the end of the address collection period, 830 were mailed. Thirty-eight of the
addresses were false or incomplete addresses. This resulted in a valid sample size of 792.
This dissertation uses the “maximum response rate” defined by the American Association
for Public Opinion Research: response rate = (complete responses + partial responses) /
total number in the eligible sample. Table 4.1 shows the survey return rates from August
to November since each set of monthly surveys were mailed the month following its
address collection period.
Table 4.1: Survey Return Rates
Type of Survey Month
August September October November Total
N of eligible surveys mailed: 162 180 324 126 792 N of eligible surveys returned: 51 68 166 64 349 Response rate of surveys: 31.48% 37.77% 51.23% 50.79% 44.06%
Since eight cases were deleted as outliers during the data screening process, the
total sample size left for the analyses was 341 respondents The number of respondents by
region of data collection or tourist intercept is listed in Table 4.2. The number of
respondents whose addresses were collected from Region 1 (Horry and Georgetown
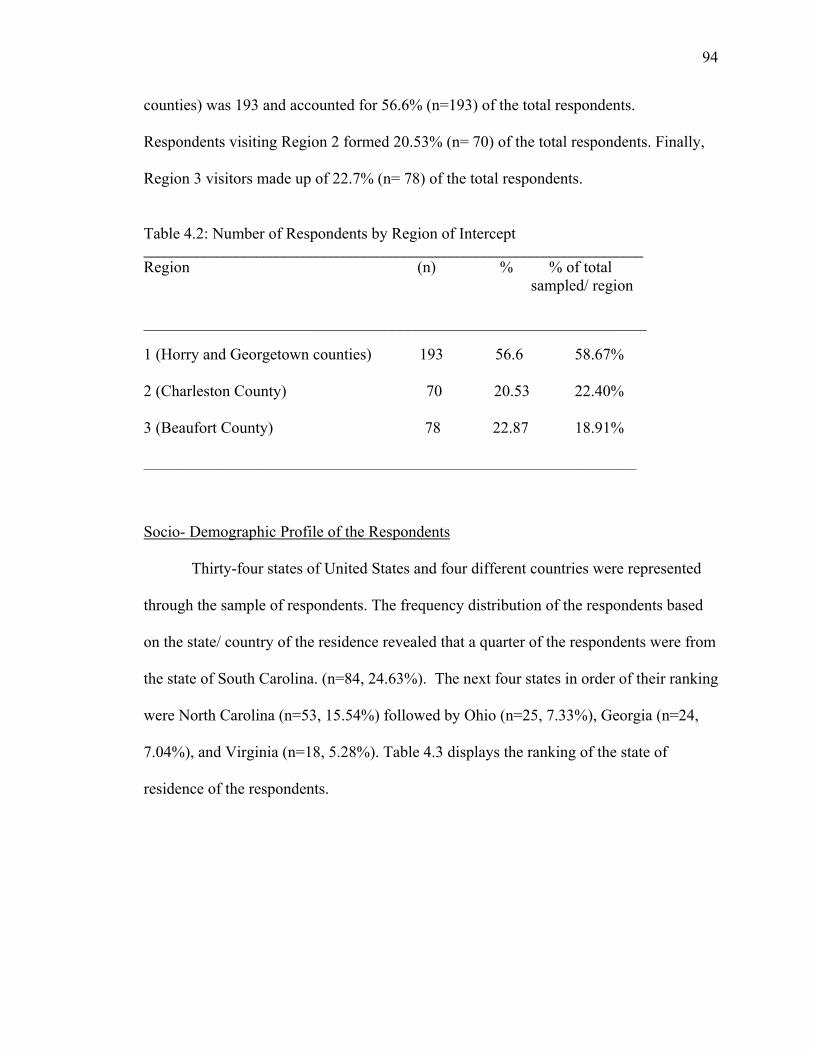
94
counties) was 193 and accounted for 56.6% (n=193) of the total respondents.
Respondents visiting Region 2 formed 20.53% (n= 70) of the total respondents. Finally,
Region 3 visitors made up of 22.7% (n= 78) of the total respondents.
Table 4.2: Number of Respondents by Region of Intercept ___________________________________________________________________________ Region (n) % % of total sampled/ region _______________________________________________________________ 1 (Horry and Georgetown counties) 193 56.6 58.67%
2 (Charleston County) 70 20.53 22.40%
3 (Beaufort County) 78 22.87 18.91%
__________________________________________________________________________
Socio- Demographic Profile of the Respondents
Thirty-four states of United States and four different countries were represented
through the sample of respondents. The frequency distribution of the respondents based
on the state/ country of the residence revealed that a quarter of the respondents were from
the state of South Carolina. (n=84, 24.63%). The next four states in order of their ranking
were North Carolina (n=53, 15.54%) followed by Ohio (n=25, 7.33%), Georgia (n=24,
7.04%), and Virginia (n=18, 5.28%). Table 4.3 displays the ranking of the state of
residence of the respondents.

95
Table 4.3: Ranking of the State/ Country (non-U.S.) of Residence of the Respondents
State (n) % 1.South Carolina 84 24.63 2.North Carolina 53 15.54 3.Ohio 25 7.33 4.Georgia 24 7.04 5.Virginia 18 5.28 6.New York 16 4.69 7.Pennsylvania 14 4.11 8.Tennessee 14 4.11 9.Florida 11 3.23 10.Kentucky 8 2.35 11.California 7 2.05 12.Canada 6 1.76 13.New Jersey 6 1.76 14.Illinois 5 1.47 15.Texas 5 1.47 16.West Virginia 5 1.47 17.Massachusetts 4 1.17 18.Maryland 4 1.17 19.Connecticutt 3 0.88 20.Indiana 3 0.88 21.Minnessotta 3 0.88 22.Wisconsin 3 0.88 23.Arkansas 2 0.59 24.Alabama 2 0.59 25.Missouri 2 0.59 26.United Kingdom 2 0.59 27.Arizona 1 0.29 28.Colorado 1 0.29 29.District of Columbia 1 0.29 30.Iowa 1 0.29 31.Maine 1 0.29 32.Michigan 1 0.29 33.Montana 1 0.29 34.Oklohoma 1 0.29 35.Oregon 1 0.29 36.South Africa 1 0.29 37.Germany 1 0.29 38.Vermont 1 0.29 Total 341 100%
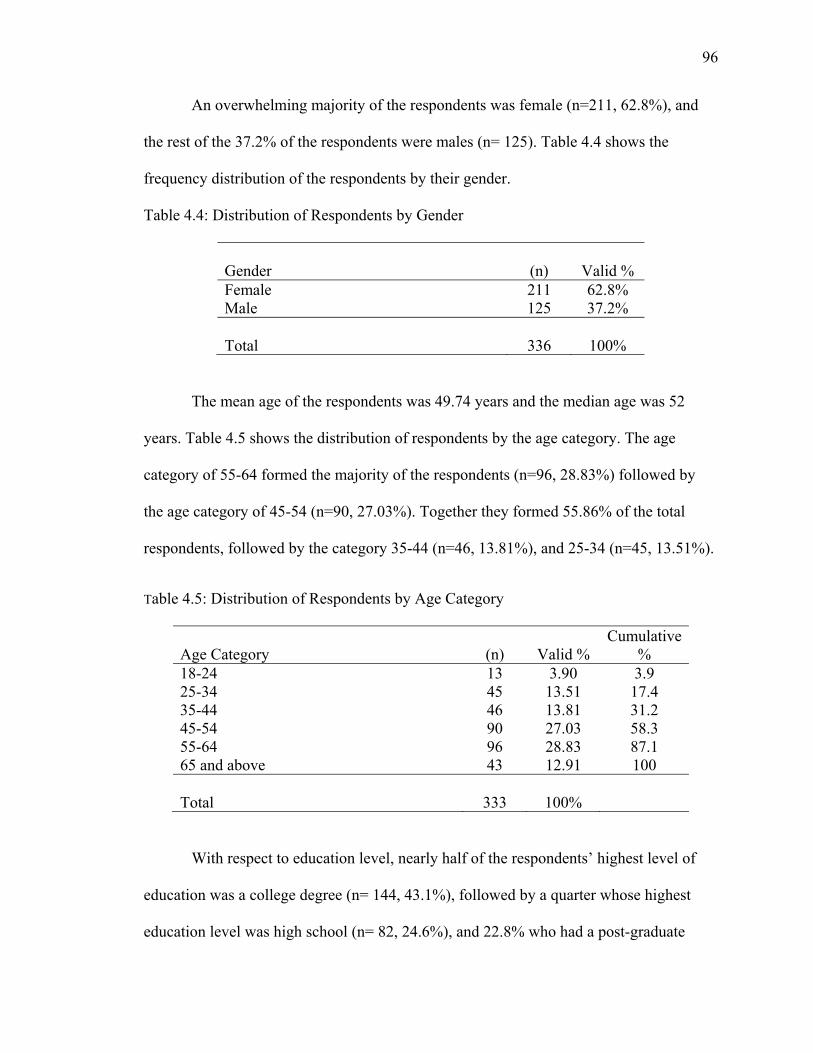
96
An overwhelming majority of the respondents was female (n=211, 62.8%), and
the rest of the 37.2% of the respondents were males (n= 125). Table 4.4 shows the
frequency distribution of the respondents by their gender.
Table 4.4: Distribution of Respondents by Gender
Gender (n) Valid % Female 211 62.8% Male 125 37.2% Total 336
100%
The mean age of the respondents was 49.74 years and the median age was 52
years. Table 4.5 shows the distribution of respondents by the age category. The age
category of 55-64 formed the majority of the respondents (n=96, 28.83%) followed by
the age category of 45-54 (n=90, 27.03%). Together they formed 55.86% of the total
respondents, followed by the category 35-44 (n=46, 13.81%), and 25-34 (n=45, 13.51%).
Table 4.5: Distribution of Respondents by Age Category
Age Category (n) Valid %
Cumulative %
18-24 13 3.90 3.9 25-34 45 13.51 17.4 35-44 46 13.81 31.2 45-54 90 27.03 58.3 55-64 96 28.83 87.1 65 and above 43 12.91 100 Total 333
100%
With respect to education level, nearly half of the respondents’ highest level of
education was a college degree (n= 144, 43.1%), followed by a quarter whose highest
education level was high school (n= 82, 24.6%), and 22.8% who had a post-graduate
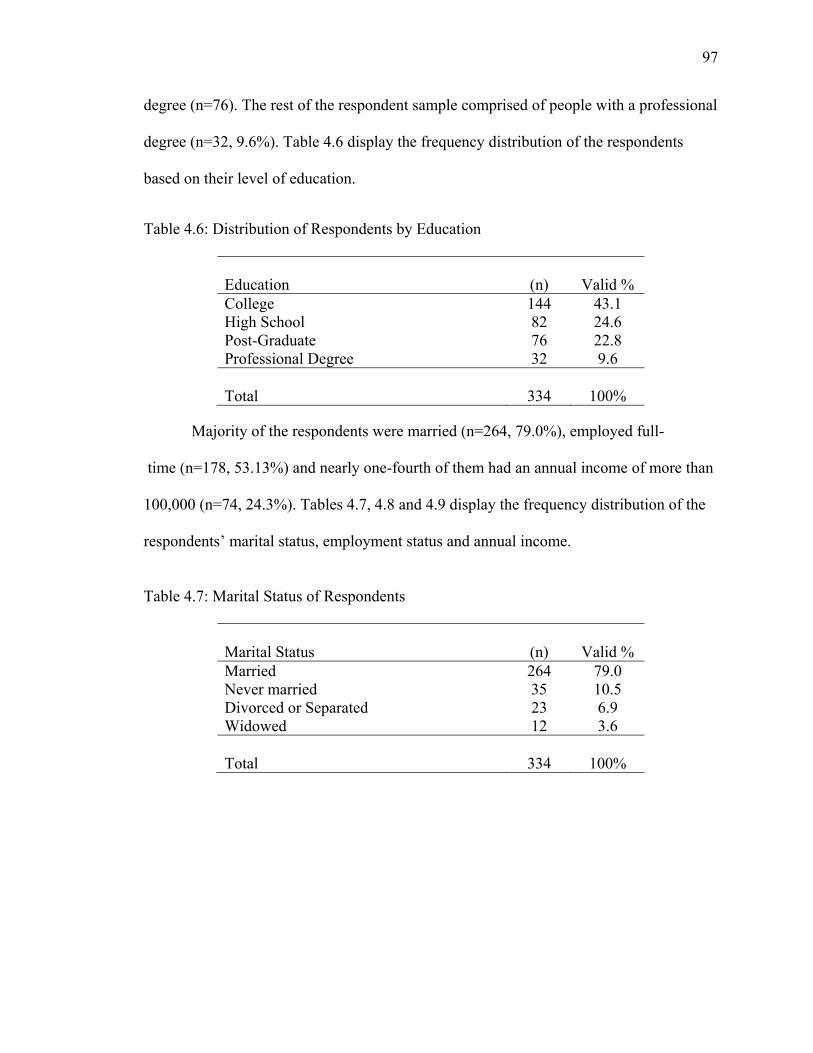
97
degree (n=76). The rest of the respondent sample comprised of people with a professional
degree (n=32, 9.6%). Table 4.6 display the frequency distribution of the respondents
based on their level of education.
Table 4.6: Distribution of Respondents by Education
Education (n) Valid % College 144 43.1 High School 82 24.6 Post-Graduate 76 22.8 Professional Degree 32 9.6 Total 334
100%
Majority of the respondents were married (n=264, 79.0%), employed full-
time (n=178, 53.13%) and nearly one-fourth of them had an annual income of more than
100,000 (n=74, 24.3%). Tables 4.7, 4.8 and 4.9 display the frequency distribution of the
respondents’ marital status, employment status and annual income.
Table 4.7: Marital Status of Respondents
Marital Status (n) Valid % Married 264 79.0 Never married 35 10.5 Divorced or Separated 23 6.9 Widowed 12 3.6 Total 334
100%
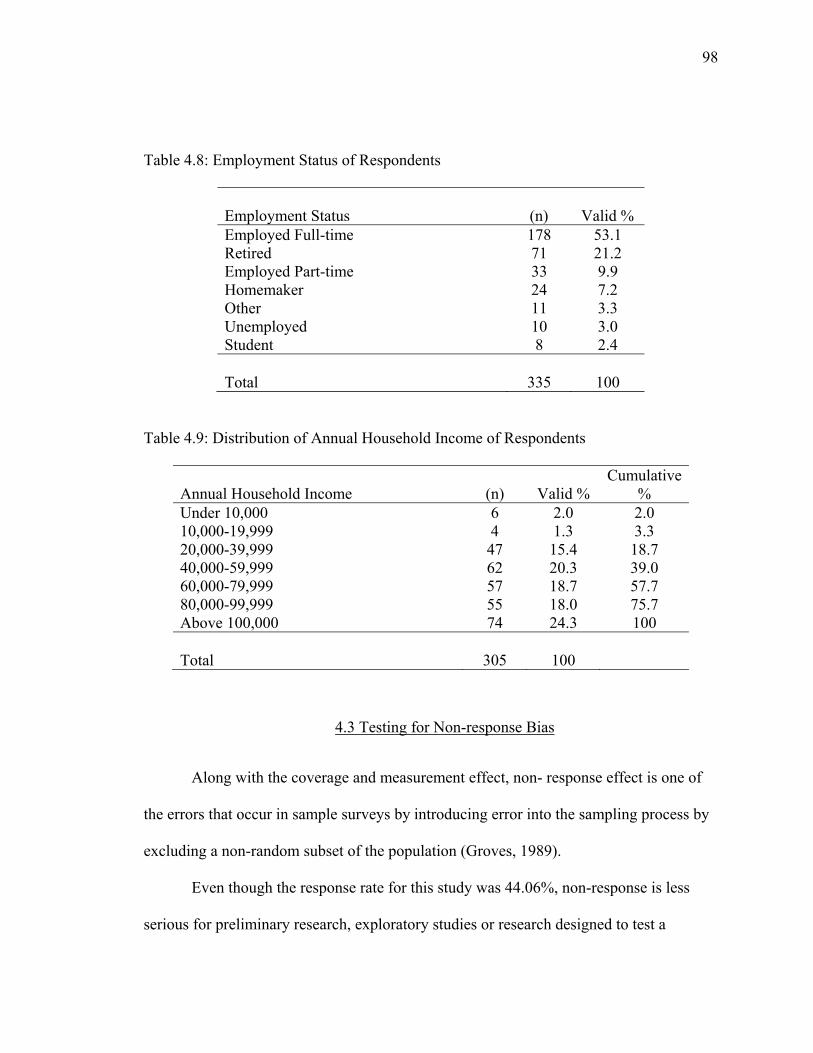
98
Table 4.8: Employment Status of Respondents
Employment Status (n) Valid % Employed Full-time 178 53.1 Retired 71 21.2 Employed Part-time 33 9.9 Homemaker 24 7.2 Other 11 3.3 Unemployed 10 3.0 Student 8 2.4 Total 335
100
Table 4.9: Distribution of Annual Household Income of Respondents
Annual Household Income (n) Valid %
Cumulative %
Under 10,000 6 2.0 2.0 10,000-19,999 4 1.3 3.3 20,000-39,999 47 15.4 18.7 40,000-59,999 62 20.3 39.0 60,000-79,999 57 18.7 57.7 80,000-99,999 55 18.0 75.7 Above 100,000 74 24.3 100 Total 305
100
4.3 Testing for Non-response Bias
Along with the coverage and measurement effect, non- response effect is one of
the errors that occur in sample surveys by introducing error into the sampling process by
excluding a non-random subset of the population (Groves, 1989).
Even though the response rate for this study was 44.06%, non-response is less
serious for preliminary research, exploratory studies or research designed to test a
99
conceptual model/ framework. This is because such types of studies focus on
relationships between multiple variables, which are less influenced by the non-response.
(Groves, Dillman, Eltinge, & Little, 2001). Nevertheless, an attempt is made for
estimating non-response bias if any. Two methods were used to check for the non-
response bias in this study: 1) wave analysis and 2) non-response bias check survey. A
detailed discussion of the two follows next.
1. Wave analysis
First, a wave analysis method was used. This is based on the assumption that non-
respondents are more like early responders in both expressed attitudes and demographics
(Dalecki, Whitehead, & Blomquist, 1993; Green, 1991; Pearl & Fairley, 1985). The
respondents were divided into two subgroups: early respondents (n=75, 32.5%) and late
respondents (n=156, 67.5%). This division was based on the number of reminders
required before response. Researchers argue that if they cannot identify any systematic
differences between respondent and late-respondents, there is no bias caused by non-
response.
Chi-square tests were performed on all the six sociodemographic variables to
examine if there were any significant differences between the early respondents (wave
one) and the late respondents (wave three). Even though, chi-square tests are normally
employed as tests of association, according to Ott (1993), the chi-square test may be used
to determine the significance of differences between two independent groups on
categorical variables.
Table 4.10 presents the chi-square analyses comparing the first-wave respondents
to the third-wave respondents on sociodemographic variables such as gender, age,
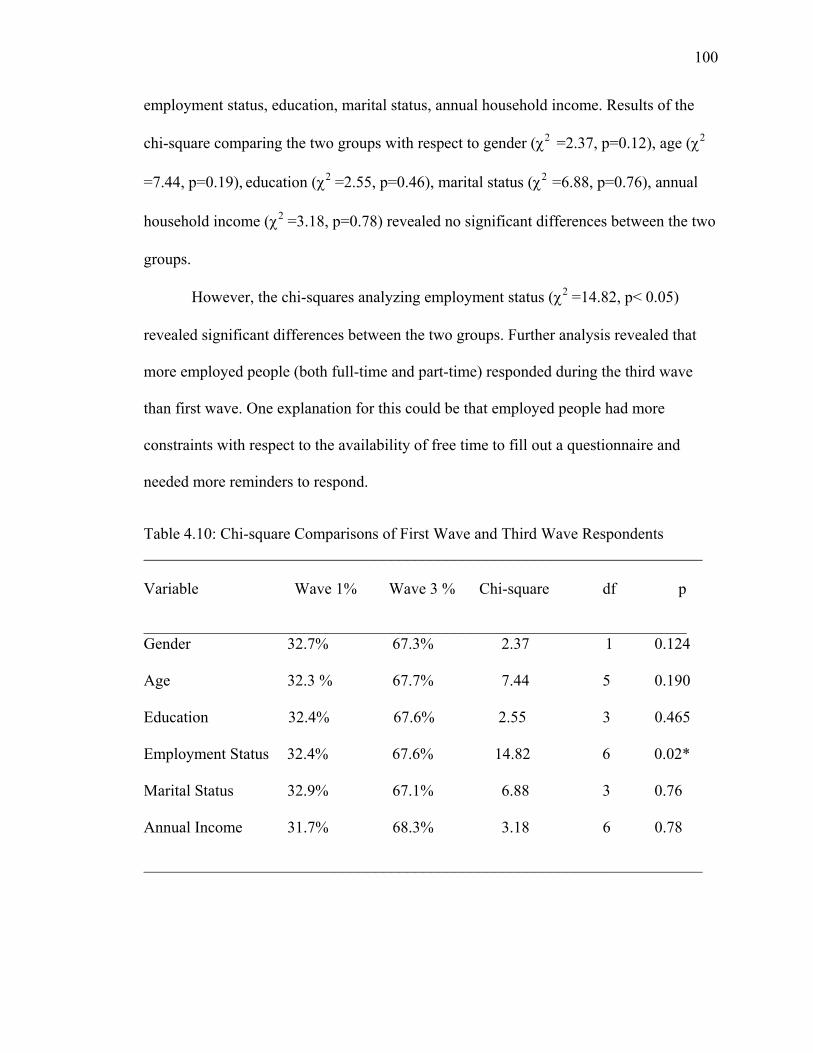
100
employment status, education, marital status, annual household income. Results of the
chi-square comparing the two groups with respect to gender (%2 =2.37, p=0.12), age (%2
=7.44, p=0.19), education (%2 =2.55, p=0.46), marital status (%2 =6.88, p=0.76), annual
household income (%2 =3.18, p=0.78) revealed no significant differences between the two
groups.
However, the chi-squares analyzing employment status (%2 =14.82, p< 0.05)
revealed significant differences between the two groups. Further analysis revealed that
more employed people (both full-time and part-time) responded during the third wave
than first wave. One explanation for this could be that employed people had more
constraints with respect to the availability of free time to fill out a questionnaire and
needed more reminders to respond.
Table 4.10: Chi-square Comparisons of First Wave and Third Wave Respondents ______________________________________________________________________ Variable Wave 1% Wave 3 % Chi-square df p ____________________________________________________________________ Gender 32.7% 67.3% 2.37 1 0.124
Age 32.3 % 67.7% 7.44 5 0.190
Education 32.4% 67.6% 2.55 3 0.465
Employment Status 32.4% 67.6% 14.82 6 0.02*
Marital Status 32.9% 67.1% 6.88 3 0.76
Annual Income 31.7% 68.3% 3.18 6 0.78
______________________________________________________________________
101
2. Non-response Bias Check Survey
The second method to test for non-response bias was the conventional method of
sending a smaller version of the survey to a selected number of non-respondents
(Deming, 1960). A one-page online survey was developed and posted on the researcher’s
Clemson University webpage. Forty non-respondents were randomly selected and were
informed through a telephone reminder and e-mailed a request (Appendix H) to fill out
the one page survey along with the link to the webpage of the online survey (Appendix I).
Twenty-nine of these non-respondents responded to the online survey. The data collected
from these converted non-respondents was compared with the study respondents’ data to
identify the existence of any bias because of non-response (Deming, 1960).
This survey had seven items. These were three demographic variables and five
items from the dependent variable (participation in food tourism). The demographic
variables included: education, employment status, and annual household income. The
five items chosen from the dependent variable included: a) Sample local foods, b)
Purchase local products to take back home, c) Visit a brewery, d) Dine at restaurants
serving regional specialties, and e) Make an advance reservation to dine at a specific
restaurant. These were measured on a unipolar five point Likert-type scale with the
following response categories 1= “never,” 2= “rarely,” 3= “sometimes,”
4= “frequently,” and 5= “always.”
In order to assess differences in education, employment status, and annual
household income the chi-square test for two samples was utilized. The five items that
were generated to operationalize food tourism were measured as continuous variables and
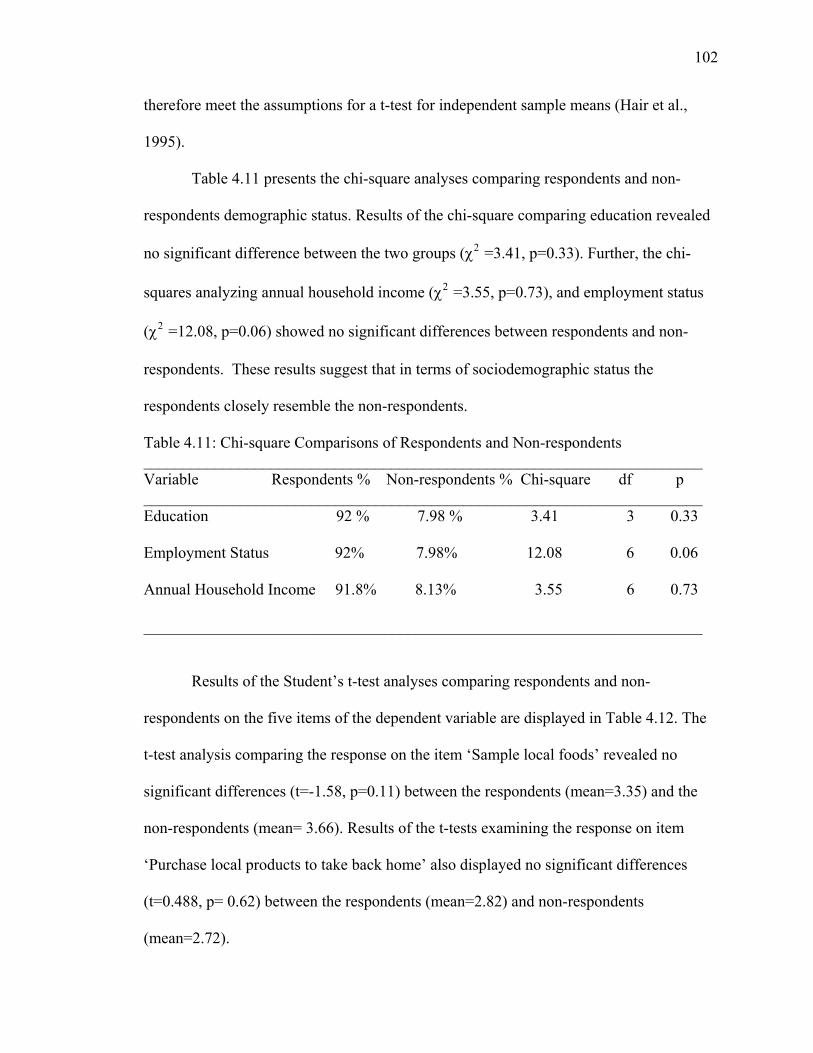
102
therefore meet the assumptions for a t-test for independent sample means (Hair et al.,
1995).
Table 4.11 presents the chi-square analyses comparing respondents and non-
respondents demographic status. Results of the chi-square comparing education revealed
no significant difference between the two groups (%2 =3.41, p=0.33). Further, the chi-
squares analyzing annual household income (%2 =3.55, p=0.73), and employment status
(%2 =12.08, p=0.06) showed no significant differences between respondents and non-
respondents. These results suggest that in terms of sociodemographic status the
respondents closely resemble the non-respondents.
Table 4.11: Chi-square Comparisons of Respondents and Non-respondents ______________________________________________________________________ Variable Respondents % Non-respondents % Chi-square df p ______________________________________________________________________ Education 92 % 7.98 % 3.41 3 0.33
Employment Status 92% 7.98% 12.08 6 0.06
Annual Household Income 91.8% 8.13% 3.55 6 0.73
______________________________________________________________________
Results of the Student’s t-test analyses comparing respondents and non-
respondents on the five items of the dependent variable are displayed in Table 4.12. The
t-test analysis comparing the response on the item ‘Sample local foods’ revealed no
significant differences (t=-1.58, p=0.11) between the respondents (mean=3.35) and the
non-respondents (mean= 3.66). Results of the t-tests examining the response on item
‘Purchase local products to take back home’ also displayed no significant differences
(t=0.488, p= 0.62) between the respondents (mean=2.82) and non-respondents
(mean=2.72).
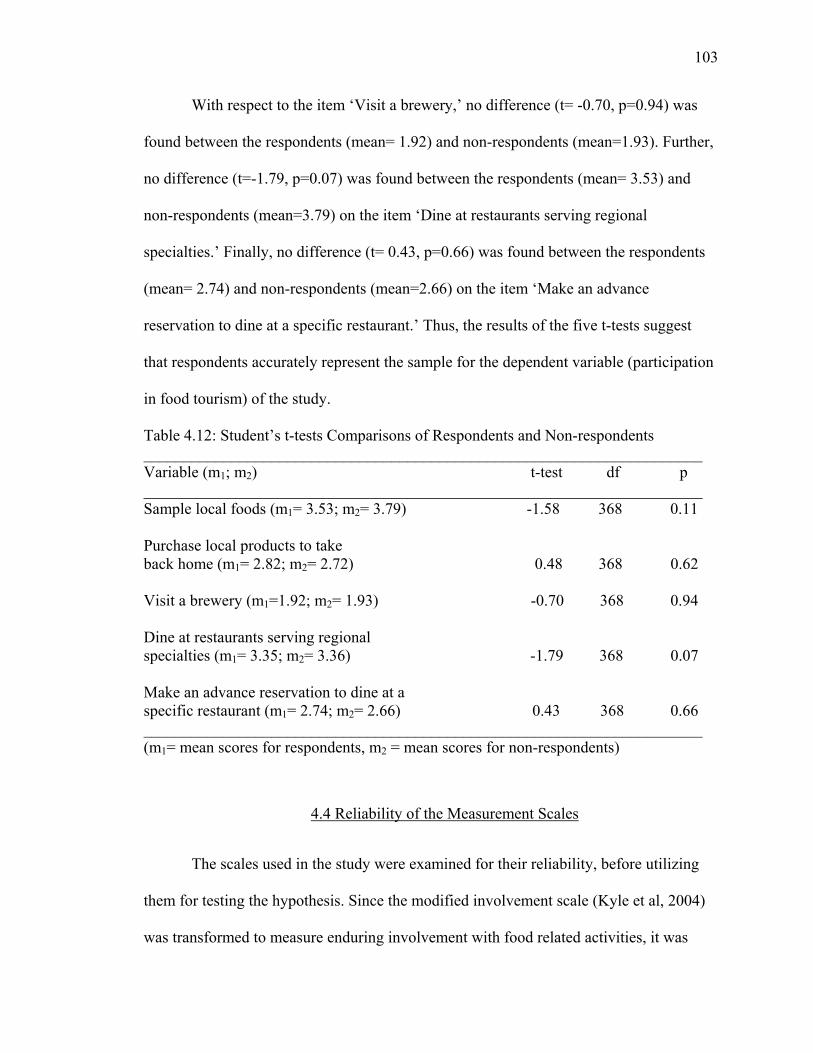
103
With respect to the item ‘Visit a brewery,’ no difference (t= -0.70, p=0.94) was
found between the respondents (mean= 1.92) and non-respondents (mean=1.93). Further,
no difference (t=-1.79, p=0.07) was found between the respondents (mean= 3.53) and
non-respondents (mean=3.79) on the item ‘Dine at restaurants serving regional
specialties.’ Finally, no difference (t= 0.43, p=0.66) was found between the respondents
(mean= 2.74) and non-respondents (mean=2.66) on the item ‘Make an advance
reservation to dine at a specific restaurant.’ Thus, the results of the five t-tests suggest
that respondents accurately represent the sample for the dependent variable (participation
in food tourism) of the study.
Table 4.12: Student’s t-tests Comparisons of Respondents and Non-respondents ______________________________________________________________________ Variable (m1; m2) t-test df p ______________________________________________________________________ Sample local foods (m1= 3.53; m2= 3.79) -1.58 368 0.11
Purchase local products to take back home (m1= 2.82; m2= 2.72) 0.48 368 0.62
Visit a brewery (m1=1.92; m2= 1.93) -0.70 368 0.94
Dine at restaurants serving regional specialties (m1= 3.35; m2= 3.36) -1.79 368 0.07 Make an advance reservation to dine at a specific restaurant (m1= 2.74; m2= 2.66) 0.43 368 0.66 ______________________________________________________________________ (m1= mean scores for respondents, m2 = mean scores for non-respondents)
4.4 Reliability of the Measurement Scales
The scales used in the study were examined for their reliability, before utilizing
them for testing the hypothesis. Since the modified involvement scale (Kyle et al, 2004)
was transformed to measure enduring involvement with food related activities, it was
104
essential to examine the dimensionality of the scale too. Factor analysis was employed to
examine the dimensionality followed by a calculation of the Cronbach’s alpha
coefficient. Cronbach’s alpha is the most commonly used measure of reliability for a set
of two or more construct indicators. Their values range between 0 and 0.1, with higher
values indicating a better reliability (Hair et al., 1995)..
The reliability coefficients along with the dimensions of the independent variables
used for this dissertation are reported in the Table 4.13. Since one of the objectives of the
current investigation was to examine the dimensionality of food tourism and construct a
food tourism activities scale, the measurement issues with respect to food tourism would
be discussed in detail later.
As indicated by the Table 4.13 the scales used in the dissertation showed
acceptable levels of reliability. Food neophobia was operationalized similar to Pliner and
Hobden (1992).The 10-item food neophobia scale (FNS) showed a reliability coefficient
of 0.87. As stated in Chapter Three, studies using the scales have reported the coefficient
alpha to fall anywhere from 0.8 to 0.9.
Likewise, variety-seeking tendency towards food was operationalized similar to
vanTrijp and Steenkamp (1992).The eight items measuring the variety-seeking tendency
towards food (VARSEEK) showed a reliability coefficient of 0.91. Both the FNS and the
VARSEEK are unidimensional scales and showed unidimensionality when factor
analysis was conducted on them.
Batra and Ahtola’s (1990) semantic differential scale measuring hedonic
consumption attitude showed acceptable psychometric properties with respect to food
consumption. The hedonism dimension, which was made up of four items, showed a
105
reliability coefficient of 0.91 and the four–item utilitarian dimension showed a coefficient
alpha of 0.86. The items measuring hedonism and those measuring utilitarian attitudes
both loaded on to the same dimension as the original scale.
Enduring involvement with respect to food related activities was operationalized
using Kyle et al’s (2004) Modified Involvement Scale. The items were reworded to
measure involvement with respect to food related activities. The sixteen items scale that
had five dimensions on the original scale, on preliminary factor analysis revealed three
dimensions. The items indicative of the dimension social bonding and those indicating
attraction in the original scale loaded on to the same factor. Of the three items that made
up the dimension identity affirmation, one item, ‘When I am participating in activities
related to food, I can really be myself’ loaded on to the dimension identity expression.
Another item of that dimension, ‘I identify with people and images associated with
activities related to food,’ loaded on to the collective dimensions of social bonding and
attraction, and one item ‘When I am participating in activities related to food, I don’t
have to be concerned the way I look,’ did not load on to any factor and was discarded.
Finally, all the three items that made up the centrality dimension in the original scale,
loaded together on a single dimension.
Thus, the scale used for the current study revealed three dimensions. The three
items that made up the dimension centrality showed a reliability coefficient of 0.86. The
dimension identity expression showed a reliability coefficient of 0.83 and was made up of
four items. Finally, of the eight items that formed the dimension social bonding, one item
‘I have little or no interest in activities related to food,’ was shown to reduce the
reliability of the scale, and was therefore removed. The resultant seven-item dimension
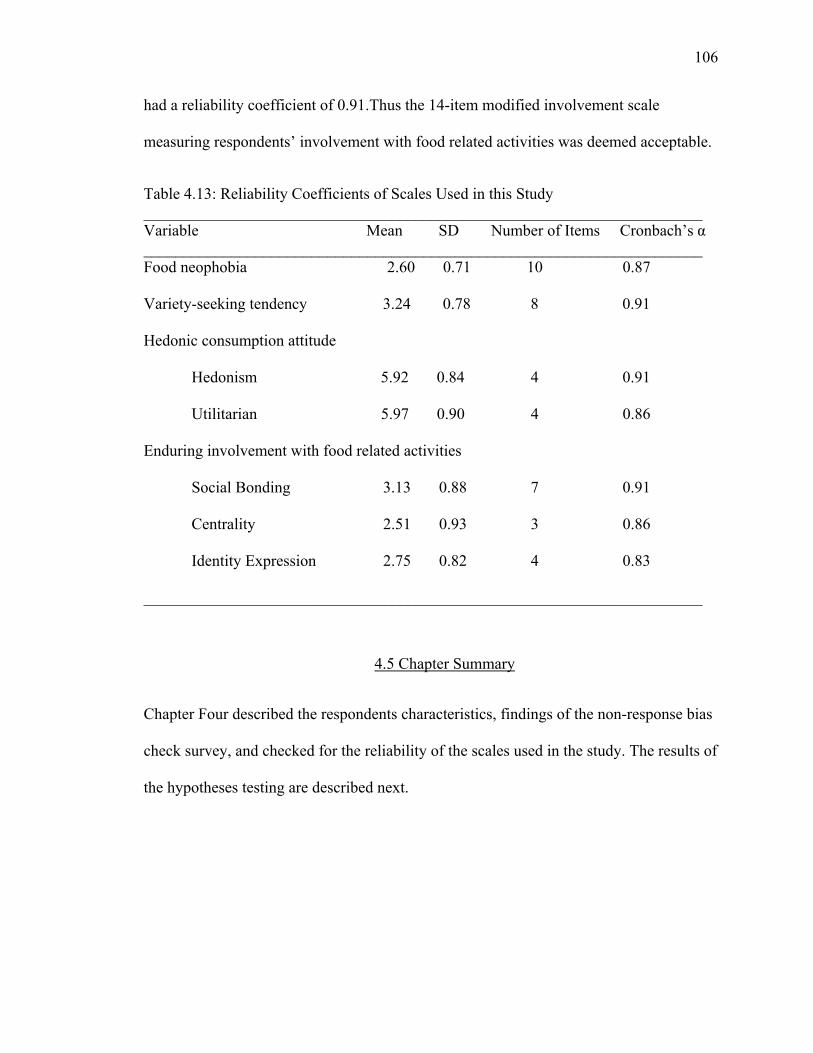
106
had a reliability coefficient of 0.91.Thus the 14-item modified involvement scale
measuring respondents’ involvement with food related activities was deemed acceptable.
Table 4.13: Reliability Coefficients of Scales Used in this Study ______________________________________________________________________ Variable Mean SD Number of Items Cronbach’s ! ______________________________________________________________________ Food neophobia 2.60 0.71 10 0.87
Variety-seeking tendency 3.24 0.78 8 0.91
Hedonic consumption attitude
Hedonism 5.92 0.84 4 0.91
Utilitarian 5.97 0.90 4 0.86
Enduring involvement with food related activities
Social Bonding 3.13 0.88 7 0.91
Centrality 2.51 0.93 3 0.86
Identity Expression 2.75 0.82 4 0.83 ______________________________________________________________________
4.5 Chapter Summary
Chapter Four described the respondents characteristics, findings of the non-response bias
check survey, and checked for the reliability of the scales used in the study. The results of
the hypotheses testing are described next.
CHAPTER FIVE
5. HYPOTHESES TESTING
This chapter is comprised of six sections. The first section deals with
accomplishing the first objective of the dissertation. That is, the underlying dimensions of
food tourism are identified and labeled. In the second section the results of the
hypotheses related to testing the conceptual framework to explain participation in food
tourism are reported. In the third section, the results of the hypotheses examining the
effects of the tourists’ sociodemographic variables on participation in food tourism are
reported.
The fourth section reports the findings of the hypothesis related to segmentation
of the tourists based on their participation in food tourism. Next, the findings from the
hypotheses tested to identify the variables that predict group membership in one or more
of the food tourist clusters are stated. In the final section, the results of the hypotheses
examining the association between the sociodemographic variables and the food tourist
clusters are reported.
5.1 Identifying the Underlying Dimensions of Food Tourism
This section accomplishes the objectives of identifying the dimensions of food
tourism. The first hypothesis of the dissertation is tested to meet that objective, next.
108
1. Screening the Data:
During the initial screening of the data (discussed in Chapter Four) the twenty-nine items
that were generated to measure food tourism were screened for skewness and kurtosis.
Three items showed extreme skew and kurtosis. Logarithmic transformations did not
show any improvements in the distribution. Hence, the three items were eliminated.
These were: a) Visit a food processing facility, b) Attend a cooking school, and c) Eat at
places that serve food that conforms to my belief system. Thus, 26 items remained for
factor analysis.
Preliminary Analysis Using Principal Components Method
Preliminary analysis was conducted on the 26 items using a principal components
analysis without any rotation. Tests of Factorability of R or the correlation matrix
revealed numerous correlations in excess of 0.30-values that indicate the possibility that
item groupings could exist. For a broad higher order construct, Briggs and Cheek (1986)
recommend that the inter-item correlation should be in the range of 0.15 to 0.50.
The Kaiser–Meyer-Olkin (KMO) Measure of Sampling Adequacy showed a value
of 0.867, which is good for factor analysis. This test is based on a comparison between
the sum of squared correlation coefficients and is expressed as a value ranging from 0 to
1. The higher the score the better, and if the scores are less than 0.7, then factor analysis
should not be undertaken. Furthermore, it is possible to examine the data additionally by
using a matrix of partial correlation coefficients (Norussis, 1993). Partial correlation
coefficients should be close to zero because they measure correlations between items
when linear effects are removed. This test was undertaken by examining the “anti –
image” correlation matrix. All the off-diagonal correlations were below 0.1, another good

109
requirement for good factor analysis (Tabachnick & Fidell, 2001). Thus, the data
appeared to possess statistical validity to conduct factor analysis.
The unrotated component matrix showed a six-component solution with
eigenvalue greater than 1, explaining 61.2 % of the variance. In this preliminary analysis,
the loadings of items on the first unrotated component were examined since they can be
viewed as a direct measure of the common construct defined by the item pool. The cut-
off for the loading was set at 0.40. All but two of the twenty-six items showed loadings
above 0.45 on the first unrotated component. “Dine at theme restaurants” and “Prepare
food at the place I am staying” showed loadings of 0.21 and 0.10 and were considered as
the leading candidates for removal from the scale. Factor analysis using the principal axis
factoring method of extraction was run twice, once with the aforementioned two problem
items and once again without the two items. Comparison of the resulting correlation
matrix, the factor matrix and reliability analysis, suggested that the two items be deleted
from the scale. With the deletion of the two items, 24 items were left for the final analysis
using the principal axis factoring method.
The Final Analysis Using Principal Axis Factoring Method
The final solution was derived with 24 items using principal axis factoring
method of extraction and a varimax rotation with the assumption that the factors were
unrelated. The scree-plot and the rotated factor matrix both revealed five factors with
eigenvalue more than one explaining 58.87 % of the variance. The mean of 24 items was
2.51, with an average inter–item correlation of 0.23.
Items with factor loadings of 0.40 (15% of variance overlap between variable and
factor) are considered ‘fair’ and was used as the cut-off for selecting the items, and an
110
item was considered weak if it loaded on two or more factors with same value (less than
0.02 difference) (Tabachnick & Fidell, 2001). Based on the criteria, two items “Buy
familiar pre-cooked food from supermarket,” and “Eat at restaurants where only locals
eat” were eliminated, as their highest factor loading was 0.36 and 0.39 respectively. This
resulted in the final factor structure consisting of 22 items.
For these 22 items, five interpretable factors were extracted with eigenvalue
above 1, explaining 58.87% of the total variance. The factor score covariance matrix,
which displays the internal consistency of the factor solution (the certainty with which
the factor axes is fixed in space) was examined for SMCs (squared multiple correlations)
of the factor scores. In a good solution, the SMCs range between 0 and 1. The larger the
SMC, the more stable the factor. A high SMC (0.70 or better) means that the observed
variables account for substantial variance in the factor scores (Tabachnick & Fidell,
2001) . The factor score variance matrix revealed that the lowest of the SMCs for factors
from variables was 0.742, indicating that the five factors were internally consistent, and
well defined by the observed 22 variables.
The Final Factor Structure and Reliability Coefficients
Table 5.1 exhibits the final structure of 22 items operationalized as Food Tourism.
According to Nunnally and Bernstein (1994), a Cronbach’s alpha greater than 0.70 is
considered moderately reliable. For scales with less than six items, however, an alpha
coefficient of 0.6 or higher is acceptable (Cortina, 1993). Therefore, for this dissertation,
a Cronbach’s alpha of 0.6 or higher is deemed as acceptable. Cronbach’s reliability
coefficient alpha for the five factors ranged from 0.87 to 0.65.
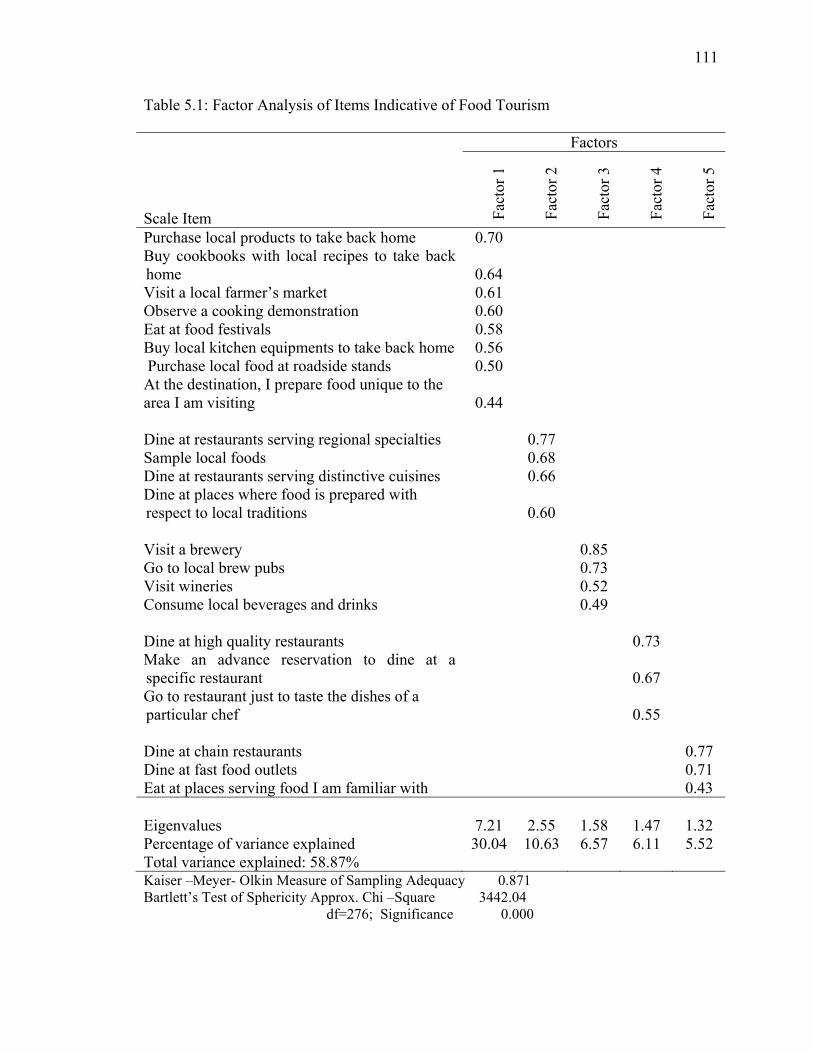
111
Table 5.1: Factor Analysis of Items Indicative of Food Tourism Factors
Scale Item Fa
ctor
1
Fact
or 2
Fact
or 3
Fact
or 4
Fact
or 5
Purchase local products to take back home 0.70 Buy cookbooks with local recipes to take back home 0.64
Visit a local farmer’s market 0.61 Observe a cooking demonstration 0.60 Eat at food festivals 0.58 Buy local kitchen equipments to take back home 0.56 Purchase local food at roadside stands 0.50 At the destination, I prepare food unique to the area I am visiting 0.44
Dine at restaurants serving regional specialties 0.77 Sample local foods 0.68 Dine at restaurants serving distinctive cuisines 0.66 Dine at places where food is prepared with respect to local traditions
0.60
Visit a brewery 0.85 Go to local brew pubs 0.73 Visit wineries 0.52 Consume local beverages and drinks 0.49 Dine at high quality restaurants 0.73 Make an advance reservation to dine at a specific restaurant
0.67
Go to restaurant just to taste the dishes of a particular chef
0.55
Dine at chain restaurants 0.77 Dine at fast food outlets 0.71 Eat at places serving food I am familiar with 0.43 Eigenvalues
7.21
2.55
1.58
1.47
1.32
Percentage of variance explained 30.04 10.63 6.57 6.11 5.52 Total variance explained: 58.87% Kaiser –Meyer- Olkin Measure of Sampling Adequacy 0.871 Bartlett’s Test of Sphericity Approx. Chi –Square 3442.04 df=276; Significance 0.000

112
The first factor had eight items with a mean score of 2.30 and explained 30.04%
of the variance. It showed an eigenvalue of 7.21 and coefficient alpha of 0.82. The factor
was labeled Purchase Local as it displayed a preponderance of items which were
connected to purchasing products, kitchen equipments, cookbooks etc., to take back
home and experience the culinary specialties of the region.
The second factor Dine Local factor consisted of four items indicative of a desire
to experience local flavor, had a mean score of 3.34 and explained 10.63% of the
variance. The eigenvalue for this factor was 2.55 with a coefficient alpha of 0.87. It is
worth mentioning here, that even though the definition of the term ‘local’ is more driven
by place and geography rather than the uniqueness of the product, the factor Dine Local
had items that represented both local and distinctive cuisines.
The third factor Drink Local had four items and dealt with consuming local
beverages. The mean score for the factor was 2.37, showed an eigenvalue of 1.58 and
explained 6.57% of the variance. The coefficient alpha for the factor was 0.82.
Dine Elite was the fourth factor with three items indicating a desire for eating at
premium and renowned places signifying dining as a status symbol. This factor had a
mean score of 2.61and an eigenvalue of 1.47. It explained 6.11% of the variance and
demonstrated a reliability coefficient alpha of 0.77.
The fifth factor Familiarity consisted of three items that demonstrated a need to
consume the familiar, or dine at familiar places, rather than the need to experience the
attributes of the region’s food, drinks and cuisine. This factor showed a mean score of
2.30, an eigenvalue of 1.32, explained 5.52% of the variance and showed a coefficient
alpha of 0.65.
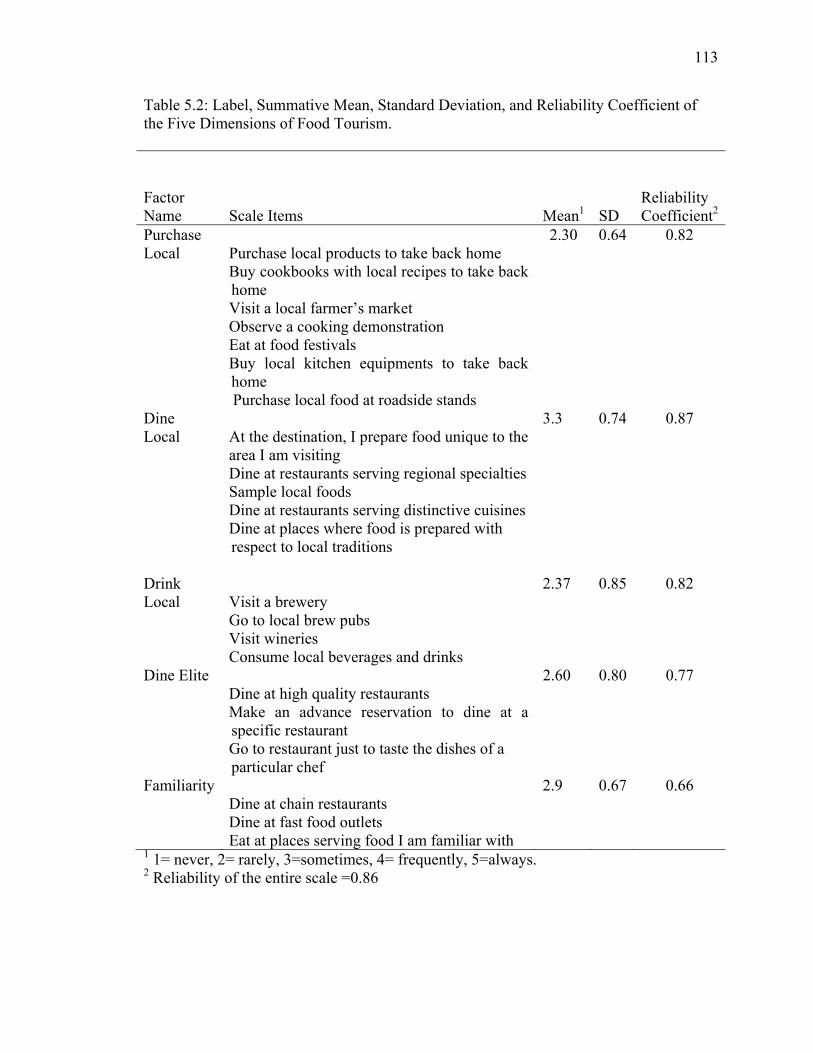
113
Table 5.2: Label, Summative Mean, Standard Deviation, and Reliability Coefficient of the Five Dimensions of Food Tourism.
Factor Name
Scale Items
Mean1
SD
Reliability Coefficient2
Purchase 2.30 0.64 0.82 Local Purchase local products to take back home Buy cookbooks with local recipes to take back
home
Visit a local farmer’s market Observe a cooking demonstration Eat at food festivals Buy local kitchen equipments to take back
home
Purchase local food at roadside stands Dine 3.3 0.74 0.87 Local At the destination, I prepare food unique to the
area I am visiting
Dine at restaurants serving regional specialties Sample local foods Dine at restaurants serving distinctive cuisines Dine at places where food is prepared with
respect to local traditions
Drink
2.37 0.85 0.82
Local Visit a brewery Go to local brew pubs Visit wineries Consume local beverages and drinks Dine Elite 2.60 0.80 0.77 Dine at high quality restaurants Make an advance reservation to dine at a
specific restaurant
Go to restaurant just to taste the dishes of a
particular chef
Familiarity 2.9 0.67 0.66 Dine at chain restaurants Dine at fast food outlets Eat at places serving food I am familiar with 1 1= never, 2= rarely, 3=sometimes, 4= frequently, 5=always. 2 Reliability of the entire scale =0.86
114
Finally, when all the twenty-two items were included in a single scale, the
reliability coefficient was even higher (! =0.855). Table 5.2 displays the label,
summative mean, standard deviation, and reliability coefficient of the five dimensions of
food tourism. Thus, the operationalization of food tourism is deemed acceptable for use
as a dependent variable for the current study. The multidimensionality of the food
tourism scale was verified and was found to be significant, which lead to the rejection of
the null hypothesis H1:1a (Food tourism is not composed of multiple significant
dimensions).
Addendum:
It is important to mention that the psychometric properties of the dimensions of
the items that constitute food tourism were established by conducting a Confirmatory
Factor Analysis (CFA) using LISREL 8.71 ( Joreskog & Sorbom, 2004). Since the first
objective of the dissertation was limited to identifying the dimensions of food tourism
and not to develop a scale of food tourism activities and establishing its psychometric
properties, detailed explanation of the analysis is not presented in this dissertation. The
CFA was conducted on a hold-out sample which formed a part of a larger study on South
Carolina coastal tourists. The CFA statistics revealed acceptable fit for each of the five
dimensions indicating unidimensionality. For Purchase Local Goodness of Fit Index
(GFI) = 0.99, Adjusted Goodness of Fit Index (AGFI) = 0.97, and Root Mean Square
Residual (RMSR) = 0.038. The chi-square statistics and the associated values for Dine
Local indicated an acceptable fit for the model with %2 (2) = 4.19, p= 0.12, the Goodness
of Fit Index (GFI) = 0.99, Adjusted Goodness of Fit Index (AGFI) = 0.97, and Root
Mean Square Residual (RMR) = 0.018. For the measurement model Drink Local, all the
115
fit indices indicated an acceptable measurement, with %2 (2) = 5.91, p= 0.052, the
Goodness of Fit Index (GFI) = 0.99, Adjusted Goodness of Fit Index (AGFI) = 0.96, and
Root Mean Square Residual (RMR) = 0.026. The unidimensionality for the factors Dine
Elite and Familiarity were tested by pairing the two factors with each other because both
the factors had less than four items each. The overall fit indicated an acceptable
measurement, with %2 (8) = 17.90, p= 0.022, the Goodness of Fit Index (GFI) = 0.98,
Adjusted Goodness of Fit Index (AGFI) = 0.96, and Root Mean Square Residual (RMR)
= 0.031. The unidimensionality was indicated by the parameter estimates results where
the items of each factor loaded on to two separate factors. The items indicative of
Familiarity showed negative loadings. The overall fit of this final Food Tourism
Activities measurement model was the chi-square value with 142 degrees of freedom %2
(142) = 448.57 (p=0.0); GFI=0.89; AGFI =0.85; NNFI =0.89; CFI=0.91, and IFI =0.91.
All of the fit indices except for the chi-square value indicate that the proposed model was
acceptable. The critical sample size (CN) was 165.83 and the root mean square residual
(RMR) for the model was 0.073.
As for the reliability, the five factors showed the following composite reliabilities:
1) Purchase Local 0.635; 2) Dine Local: 0.76, 3) Drink Local: 0.746; 4) Dine Elite: 0.674
and, 5) Familiarity: 0.651. Further, the discriminant and convergent validity of each of
the factors were established by conducting a chi-square difference test on a constrained
and unconstrained model.
116
5.2 Identifying the Variables that Explain Participation in Food Tourism
In order to identify the variables that explain participation in food tourism,
standard multiple regression was performed between the dimensions of food tourism as
the dependent variable and food neophobia, variety-seeking tendency, hedonic
consumption (hedonism and utilitarian), and enduring involvement (social bonding,
centrality, and identity expression) as the independent variables. Since the exploratory
factor analysis of dependent variable revealed five factors, five regression models were
run. Table 5.3 shows the correlation matrix of all the variables (both IVs and DV) used in
the multiple regression models.
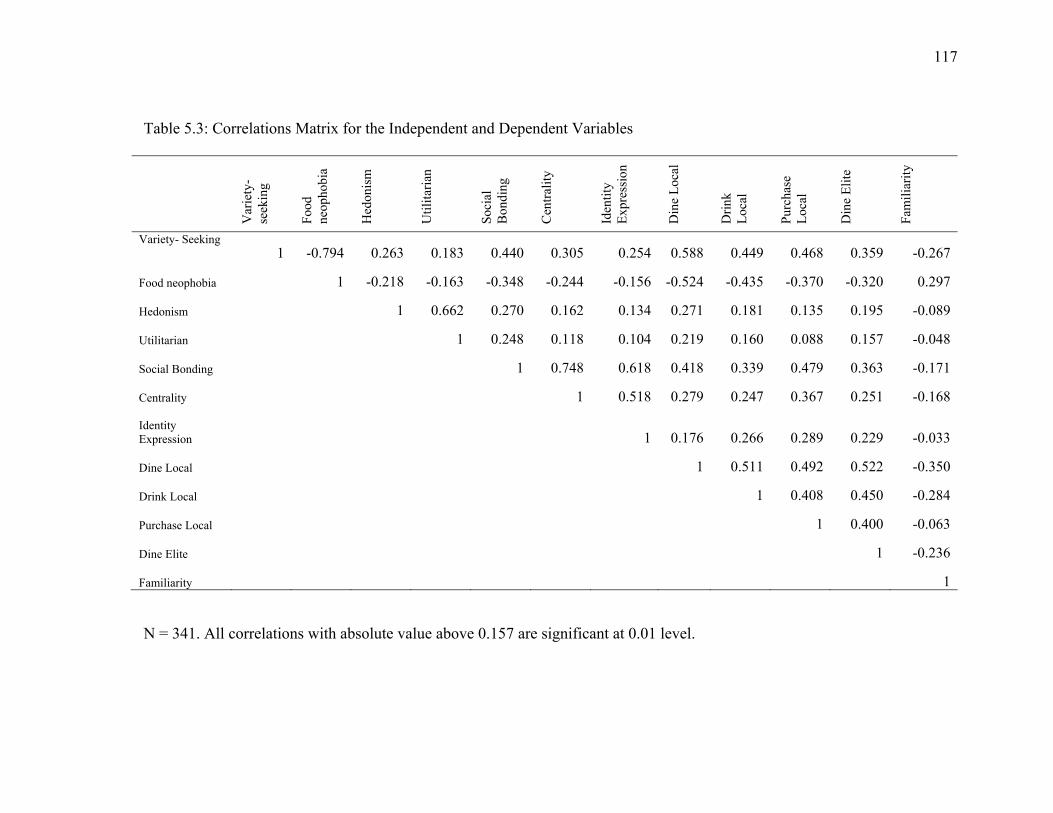
117
Table 5.3: Correlations Matrix for the Independent and Dependent Variables
Var
iety
- se
ekin
g
Food
ne
opho
bia
Hed
onis
m
Util
itaria
n
Soci
al
Bon
ding
Cen
tralit
y
Iden
tity
Expr
essi
on
Din
e Lo
cal
Drin
k Lo
cal
Purc
hase
Lo
cal
Din
e El
ite
Fam
iliar
ity
Variety- Seeking 1 -0.794 0.263 0.183 0.440 0.305 0.254 0.588 0.449 0.468 0.359 -0.267
Food neophobia 1 -0.218 -0.163 -0.348 -0.244 -0.156 -0.524 -0.435 -0.370 -0.320 0.297
Hedonism 1 0.662 0.270 0.162 0.134 0.271 0.181 0.135 0.195 -0.089
Utilitarian 1 0.248 0.118 0.104 0.219 0.160 0.088 0.157 -0.048
Social Bonding 1 0.748 0.618 0.418 0.339 0.479 0.363 -0.171
Centrality 1 0.518 0.279 0.247 0.367 0.251 -0.168 Identity Expression 1 0.176 0.266 0.289 0.229 -0.033
Dine Local 1 0.511 0.492 0.522 -0.350
Drink Local 1 0.408 0.450 -0.284
Purchase Local 1 0.400 -0.063
Dine Elite 1 -0.236
Familiarity 1
N = 341. All correlations with absolute value above 0.157 are significant at 0.01 level.
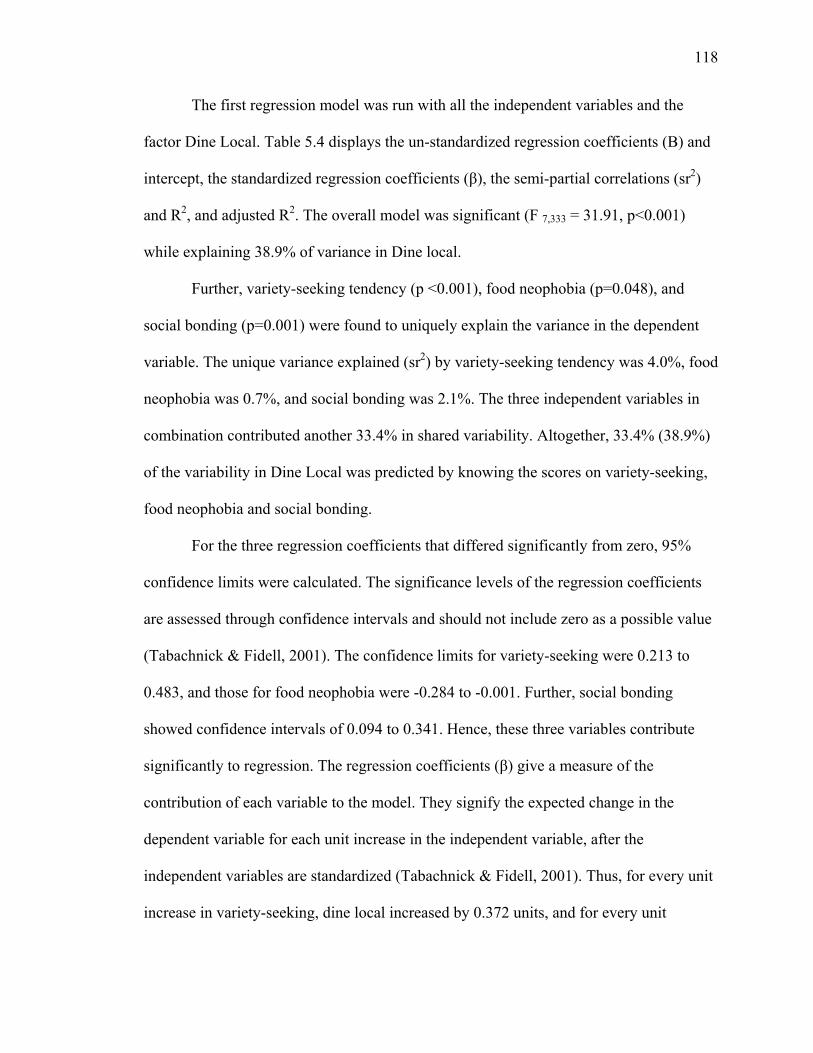
118
The first regression model was run with all the independent variables and the
factor Dine Local. Table 5.4 displays the un-standardized regression coefficients (B) and
intercept, the standardized regression coefficients ("), the semi-partial correlations (sr2)
and R2, and adjusted R2. The overall model was significant (F 7,333 = 31.91, p<0.001)
while explaining 38.9% of variance in Dine local.
Further, variety-seeking tendency (p <0.001), food neophobia (p=0.048), and
social bonding (p=0.001) were found to uniquely explain the variance in the dependent
variable. The unique variance explained (sr2) by variety-seeking tendency was 4.0%, food
neophobia was 0.7%, and social bonding was 2.1%. The three independent variables in
combination contributed another 33.4% in shared variability. Altogether, 33.4% (38.9%)
of the variability in Dine Local was predicted by knowing the scores on variety-seeking,
food neophobia and social bonding.
For the three regression coefficients that differed significantly from zero, 95%
confidence limits were calculated. The significance levels of the regression coefficients
are assessed through confidence intervals and should not include zero as a possible value
(Tabachnick & Fidell, 2001). The confidence limits for variety-seeking were 0.213 to
0.483, and those for food neophobia were -0.284 to -0.001. Further, social bonding
showed confidence intervals of 0.094 to 0.341. Hence, these three variables contribute
significantly to regression. The regression coefficients (") give a measure of the
contribution of each variable to the model. They signify the expected change in the
dependent variable for each unit increase in the independent variable, after the
independent variables are standardized (Tabachnick & Fidell, 2001). Thus, for every unit
increase in variety-seeking, dine local increased by 0.372 units, and for every unit
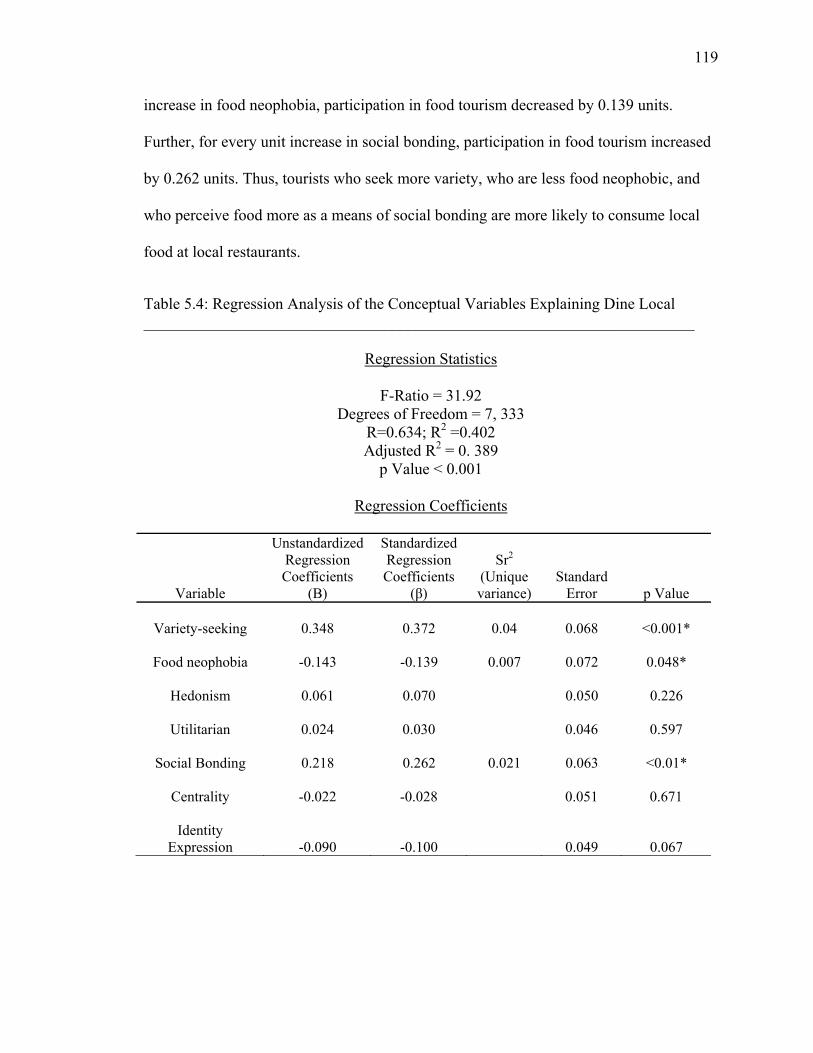
119
increase in food neophobia, participation in food tourism decreased by 0.139 units.
Further, for every unit increase in social bonding, participation in food tourism increased
by 0.262 units. Thus, tourists who seek more variety, who are less food neophobic, and
who perceive food more as a means of social bonding are more likely to consume local
food at local restaurants.
Table 5.4: Regression Analysis of the Conceptual Variables Explaining Dine Local _____________________________________________________________________
Regression Statistics
F-Ratio = 31.92 Degrees of Freedom = 7, 333
R=0.634; R2 =0.402 Adjusted R2 = 0. 389
p Value < 0.001
Regression Coefficients
Variable
Unstandardized Regression Coefficients
(B)
Standardized Regression Coefficients
(")
Sr2
(Unique variance)
Standard Error p Value
Variety-seeking 0.348 0.372 0.04 0.068 <0.001*
Food neophobia -0.143 -0.139 0.007 0.072 0.048*
Hedonism 0.061 0.070 0.050 0.226
Utilitarian 0.024 0.030 0.046 0.597
Social Bonding 0.218 0.262 0.021 0.063 <0.01*
Centrality -0.022 -0.028 0.051 0.671
Identity
Expression -0.090 -0.100 0.049 0.067
120
The second regression model was run with all the independent variables and the
factor Drink Local. Table 5.5 displays the unstandardized regression coefficients (B) and
intercept, the standardized regression coefficients ("), the semi-partial correlations (sr2)
and R2, and adjusted R2. The overall model was significant (F 7,333 = 16.27, p<0.001)
while explaining 23.9% of variance in Drink local.
Further, variety-seeking tendency (p =0.21), food neophobia (p=0.004), and
Identity Expression (p=0.04) were found to uniquely explain the variance in the
dependent variable. The unique variance explained (sr2) by variety-seeking tendency was
1.0%, food neophobia was 2.0%, and Identity Expression was 0.09%. The three
independent variables in combination contributed to another 21.6% in shared variability.
Altogether, 25.5% (23.9%) of the variability in Drink Local was predicted by knowing
the scores on variety-seeking, food neophobia and Identity Expression.
For the three regression coefficients that differed significantly from zero, 95%
confidence limits were calculated. The confidence limits for variety-seeking were 0.31 to
0.378, and those for food neophobia were -0.449 to -0.085. Further, Identity Expression
showed confidence intervals of 0.251 to 0.266. Hence, these three variables contribute
significantly to regression.
Based on the regression coefficients (") for every unit increase in variety-
seeking, drink local increased by 0.190 units, and for every unit increase in food
neophobia, drink local decreased by -0.225 units. Further, for every unit increase in
identity expression, drink local increased by 0.123 units. Thus, tourists who seek more
variety, who are less neophobic, and who perceive food as a means of identity expression
are more likely to consume local drinks and beverages.

121
Table 5.5: Regression Analysis of the Conceptual Variables Explaining Drink Local _____________________________________________________________________
Regression Statistics
F-Ratio = 16.28 Degrees of Freedom = 7, 333
R=0.505; R2 =0.255 Adjusted R2 = 0. 239
p Value < 0.001
Regression Coefficients
Variable
Unstandardized Regression Coefficients
(B)
Standardized Regression Coefficients
(")
Sr2
(Unique variance)
Standard Error p Value
Variety-seeking 0.204 0.190 0.01 0.088 0.021*
Food neophobia -0.267 -0.225 0.02 0.092 0.004*
Hedonism 0.011 0.010 0.065 0.871
Utilitarian 0.44 0.047 0.060 0.458
Social Bonding 0.087 0.090 0.081 0.284
Centrality -0.004 -0.005 0.066 0.946
Identity
Expression 0.128 -0.123 0.009 0.063 0.044*
The third regression model was run with all the independent variables and the
factor Purchase Local. Table 5.6 displays the unstandardized regression coefficients (B)
and intercept, the standardized regression coefficients ("), the semi-partial correlations
(sr2) and R2, and adjusted R2. The overall model was significant (F 7,333 = 21.91, p<0.001)
while explaining 30.1% of variance in Purchase local.
Further, variety-seeking tendency (p <0.001), and social bonding (p<0.001) were
found to uniquely explain the variance in the dependent variable. The unique variance
122
explained (sr2) by variety-seeking tendency was 3.6%, and social bonding was 3.6%. The
two independent variables in combination contributed to another 24.3% in shared
variability. Together, 31.5% (30.1%) of the variability in Purchase Local was predicted
by knowing the scores on variety-seeking and social bonding.
For the two regression coefficients that differed significantly from zero, 95%
confidence limits were calculated. The confidence limits for variety-seeking were 0.41 to
0.392, and those for social bonding were 0.128 to 0.359. Hence, these two variables
contribute significantly to regression.
For the significant regression coefficients ("), for every unit increase in variety-
seeking, purchase local increased by 0.326 units, and for every unit increase in social
bonding, participation in food tourism increased by 0.336 units. Thus, tourists who seek
more variety, and who perceive food as a means of social bonding are more likely to
purchase local food and food related products to take back home.
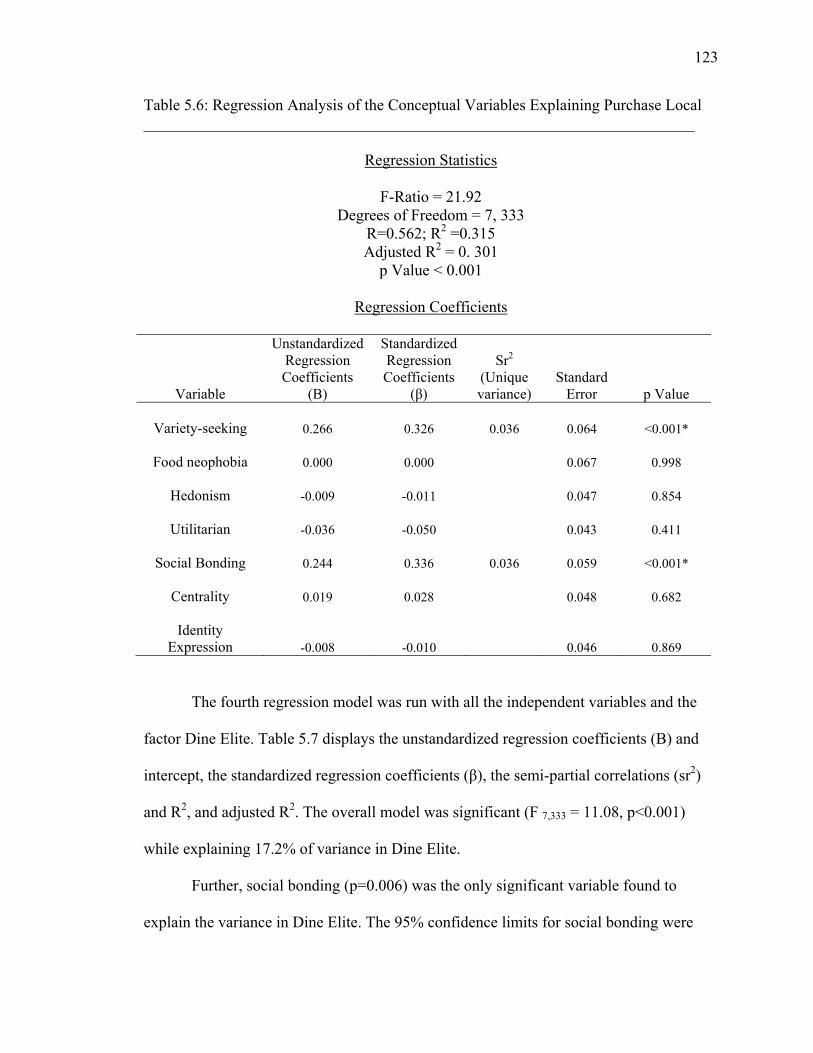
123
Table 5.6: Regression Analysis of the Conceptual Variables Explaining Purchase Local _____________________________________________________________________
Regression Statistics
F-Ratio = 21.92 Degrees of Freedom = 7, 333
R=0.562; R2 =0.315 Adjusted R2 = 0. 301
p Value < 0.001
Regression Coefficients
Variable
Unstandardized Regression Coefficients
(B)
Standardized Regression Coefficients
(")
Sr2
(Unique variance)
Standard Error p Value
Variety-seeking 0.266 0.326 0.036 0.064 <0.001*
Food neophobia 0.000 0.000 0.067 0.998
Hedonism -0.009 -0.011 0.047 0.854
Utilitarian -0.036 -0.050 0.043 0.411
Social Bonding 0.244 0.336 0.036 0.059 <0.001*
Centrality 0.019 0.028 0.048 0.682
Identity
Expression -0.008 -0.010 0.046 0.869
The fourth regression model was run with all the independent variables and the
factor Dine Elite. Table 5.7 displays the unstandardized regression coefficients (B) and
intercept, the standardized regression coefficients ("), the semi-partial correlations (sr2)
and R2, and adjusted R2. The overall model was significant (F 7,333 = 11.08, p<0.001)
while explaining 17.2% of variance in Dine Elite.
Further, social bonding (p=0.006) was the only significant variable found to
explain the variance in Dine Elite. The 95% confidence limits for social bonding were
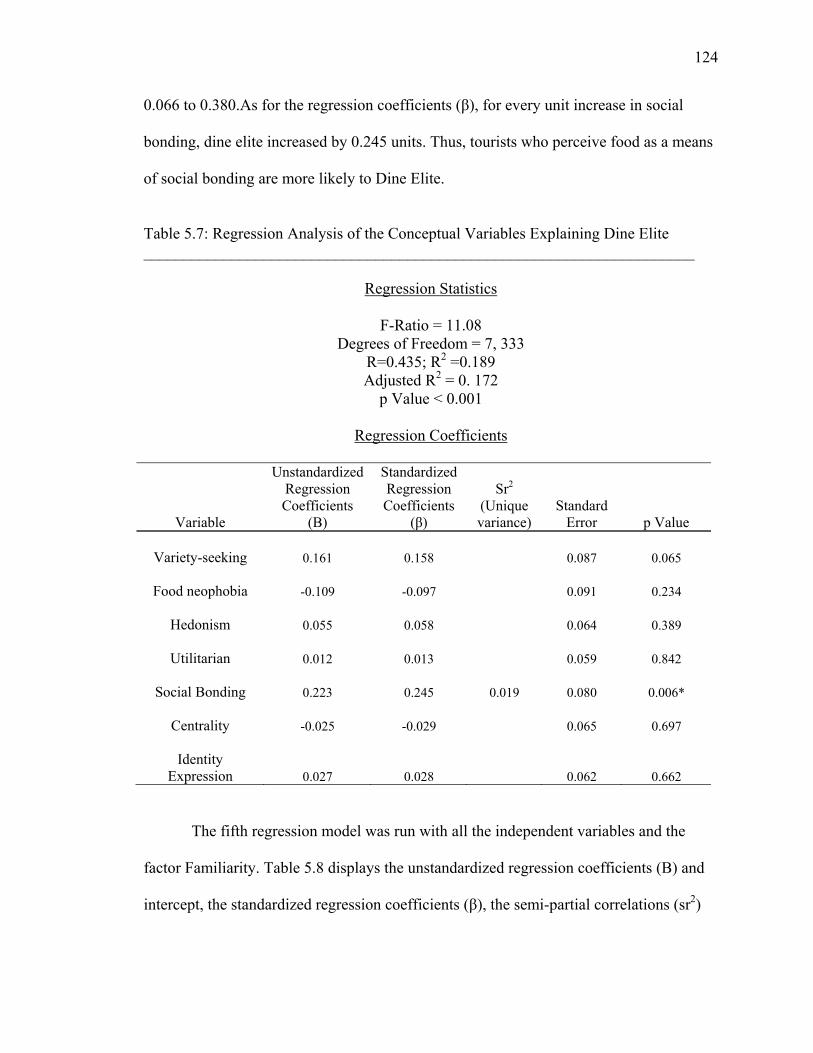
124
0.066 to 0.380.As for the regression coefficients ("), for every unit increase in social
bonding, dine elite increased by 0.245 units. Thus, tourists who perceive food as a means
of social bonding are more likely to Dine Elite.
Table 5.7: Regression Analysis of the Conceptual Variables Explaining Dine Elite _____________________________________________________________________
Regression Statistics
F-Ratio = 11.08 Degrees of Freedom = 7, 333
R=0.435; R2 =0.189 Adjusted R2 = 0. 172
p Value < 0.001
Regression Coefficients
Variable
Unstandardized Regression Coefficients
(B)
Standardized Regression Coefficients
(")
Sr2
(Unique variance)
Standard Error p Value
Variety-seeking 0.161 0.158 0.087 0.065
Food neophobia -0.109 -0.097 0.091 0.234
Hedonism 0.055 0.058 0.064 0.389
Utilitarian 0.012 0.013 0.059 0.842
Social Bonding 0.223 0.245 0.019 0.080 0.006*
Centrality -0.025 -0.029 0.065 0.697
Identity
Expression 0.027 0.028 0.062 0.662
The fifth regression model was run with all the independent variables and the
factor Familiarity. Table 5.8 displays the unstandardized regression coefficients (B) and
intercept, the standardized regression coefficients ("), the semi-partial correlations (sr2)
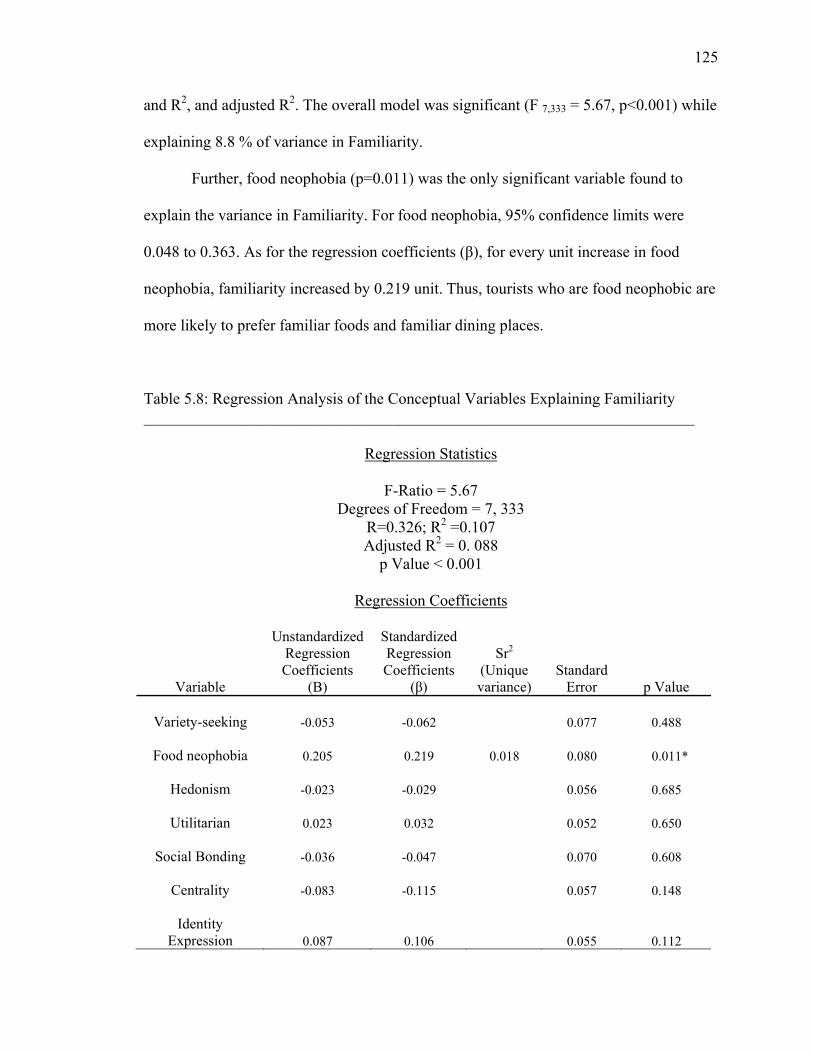
125
and R2, and adjusted R2. The overall model was significant (F 7,333 = 5.67, p<0.001) while
explaining 8.8 % of variance in Familiarity.
Further, food neophobia (p=0.011) was the only significant variable found to
explain the variance in Familiarity. For food neophobia, 95% confidence limits were
0.048 to 0.363. As for the regression coefficients ("), for every unit increase in food
neophobia, familiarity increased by 0.219 unit. Thus, tourists who are food neophobic are
more likely to prefer familiar foods and familiar dining places.
Table 5.8: Regression Analysis of the Conceptual Variables Explaining Familiarity _____________________________________________________________________
Regression Statistics
F-Ratio = 5.67 Degrees of Freedom = 7, 333
R=0.326; R2 =0.107 Adjusted R2 = 0. 088
p Value < 0.001
Regression Coefficients
Variable
Unstandardized Regression Coefficients
(B)
Standardized Regression Coefficients
(")
Sr2
(Unique variance)
Standard Error p Value
Variety-seeking -0.053 -0.062 0.077 0.488
Food neophobia 0.205 0.219 0.018 0.080 0.011*
Hedonism -0.023 -0.029 0.056 0.685
Utilitarian 0.023 0.032 0.052 0.650
Social Bonding -0.036 -0.047 0.070 0.608
Centrality -0.083 -0.115 0.057 0.148
Identity
Expression 0.087 0.106 0.055 0.112
126
The results of the five regression models revealed that food neophobia was a
significant variable explaining variance for the following factors of food tourism: Dine
Local, Drink Local and Familiarity. Hence, the null hypothesis H 2:1a was rejected. Next,
variety-seeking significantly explained variance for: dine local, drink local, and purchase
local, leading to the rejection of the null hypothesis H 2: 2a. Further, hedonic
consumption (both the dimensions) did not significantly explain variance for any of the
five factors of food tourism. This lead to the failure to reject the null hypothesis H 2: 3a.
As for enduring involvement with food related activities, two of its dimensions were
significant in explaining variance in food tourism. Social bonding explained variance in
dine local, purchase local, and dine elite. In addition, identity expression explained
variance for Drink Local. Thus, the null hypothesis H3:4a was rejected.
5.3 The Effect of Sociodemographic Variables on Participation in Food Tourism
To determine the effect of sociodemographic variables with respect to
participation in food tourism, six sets of one-factor-between-subjects multivariate
analysis of variance (MANOVA) were conducted. The five dimensions of food tourism
served as the dependent variables and the sociodemographic variables of age, gender,
education, marital status, employment status, and annual household income each served
as the independent variable for each of the six analyses. Evaluation of the homogeneity of
the variance and covariance matrices and the normality assumptions underlying
MANOVA did not reveal any anomalies. In case of significant effect, the univariate F-
ratio for each dependent variable were examined to indicate which individual dependent
variable contributed to the significant multivariate effect. A Bonferroni-type adjustment
127
was done to account for the inflation of Type I error. Hence, for the post-hoc analyses,
the adjusted alpha was set at (0.05/5= 0.01).
The first test was run with age as the independent variable and the five
dimensions of food tourism as the dependent variables. Results of the MANOVA were
statistically significant according to Wilks’ lambda (0.834), F (25, 1201) = 2.41, p<0.001.
This resulted in the rejection of the null hypothesis H5: 1a. Since a significant effect was
found, the univariate F-ratio for the dependent variables was examined. As seen in Table
5.9, a significant main effect was found for the dimension Drink Local (p<0.01).
Furthermore, post-hoc tests were conducted using Tukey HSD to determine what age
categories differed from each other with respect to the dimension Drink Local. It was
found that differences lay between the age category 25-35 and the age category of 65 and
above (mean difference= 0.75, p=0.001), and between the age categories of 55-64 and 65
and above (mean difference = 0.53, p=0.008).
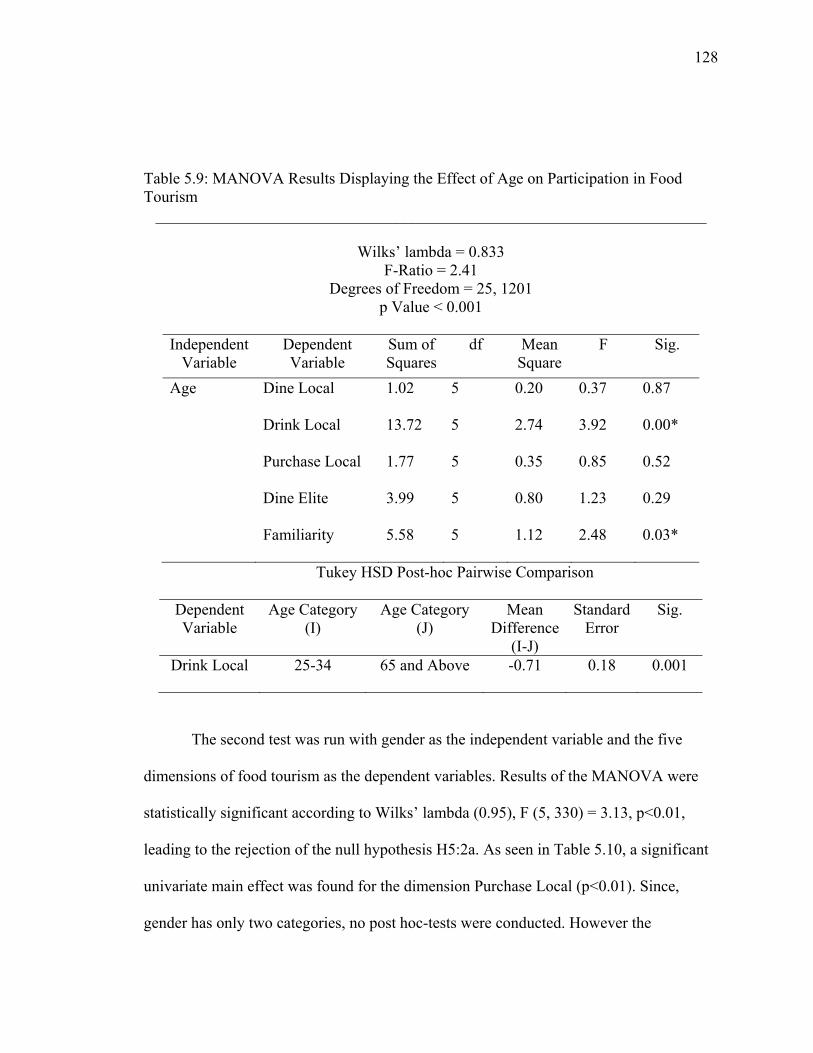
128
Table 5.9: MANOVA Results Displaying the Effect of Age on Participation in Food Tourism
_____________________________________________________________________
Wilks’ lambda = 0.833 F-Ratio = 2.41
Degrees of Freedom = 25, 1201 p Value < 0.001
Independent
Variable Dependent Variable
Sum of Squares
df Mean Square
F Sig.
Age Dine Local 1.02 5 0.20 0.37 0.87
Drink Local 13.72 5 2.74 3.92 0.00*
Purchase Local 1.77 5 0.35 0.85 0.52
Dine Elite 3.99 5 0.80 1.23 0.29
Familiarity 5.58 5 1.12 2.48 0.03*
Tukey HSD Post-hoc Pairwise Comparison
Dependent Variable
Age Category (I)
Age Category (J)
Mean Difference
(I-J)
Standard Error
Sig.
Drink Local 25-34 65 and Above -0.71 0.18 0.001
The second test was run with gender as the independent variable and the five
dimensions of food tourism as the dependent variables. Results of the MANOVA were
statistically significant according to Wilks’ lambda (0.95), F (5, 330) = 3.13, p<0.01,
leading to the rejection of the null hypothesis H5:2a. As seen in Table 5.10, a significant
univariate main effect was found for the dimension Purchase Local (p<0.01). Since,
gender has only two categories, no post hoc-tests were conducted. However the
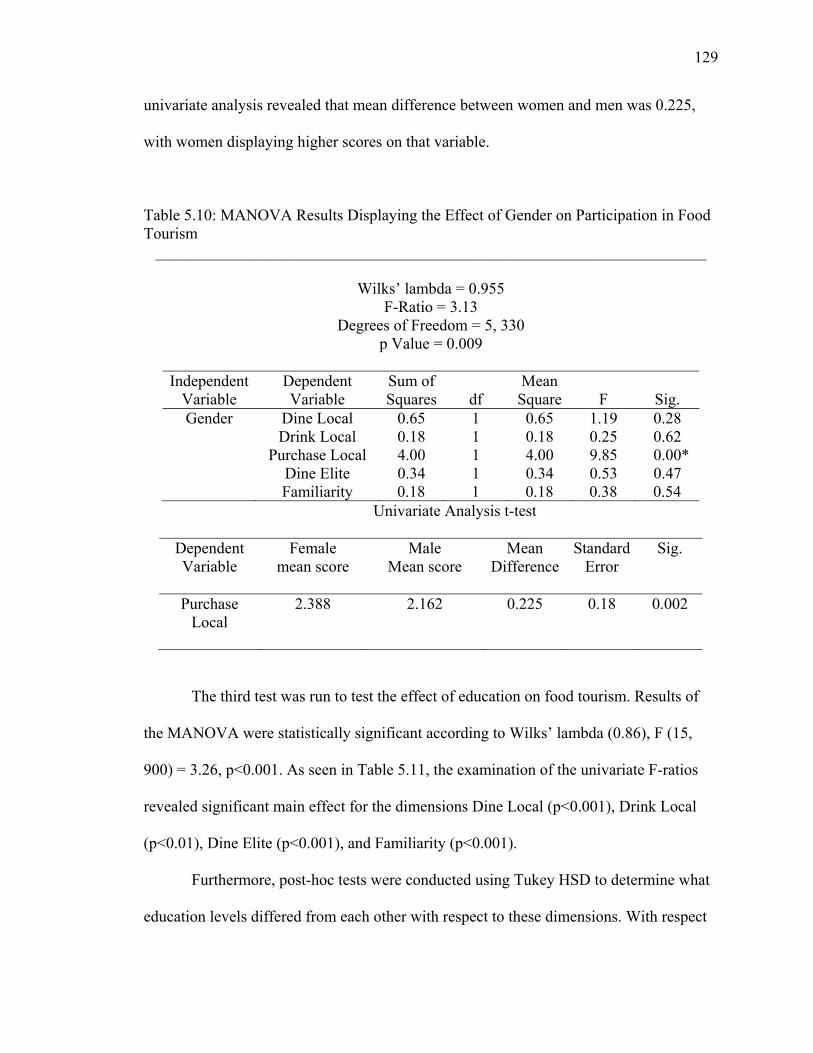
129
univariate analysis revealed that mean difference between women and men was 0.225,
with women displaying higher scores on that variable.
Table 5.10: MANOVA Results Displaying the Effect of Gender on Participation in Food Tourism
_____________________________________________________________________
Wilks’ lambda = 0.955 F-Ratio = 3.13
Degrees of Freedom = 5, 330 p Value = 0.009
Independent
Variable Dependent Variable
Sum of Squares df
Mean Square F Sig.
Gender Dine Local 0.65 1 0.65 1.19 0.28 Drink Local 0.18 1 0.18 0.25 0.62 Purchase Local 4.00 1 4.00 9.85 0.00* Dine Elite 0.34 1 0.34 0.53 0.47 Familiarity 0.18 1 0.18 0.38 0.54
Univariate Analysis t-test
Dependent Variable
Female mean score
Male Mean score
Mean Difference
Standard Error
Sig.
Purchase Local
2.388 2.162 0.225 0.18 0.002
The third test was run to test the effect of education on food tourism. Results of
the MANOVA were statistically significant according to Wilks’ lambda (0.86), F (15,
900) = 3.26, p<0.001. As seen in Table 5.11, the examination of the univariate F-ratios
revealed significant main effect for the dimensions Dine Local (p<0.001), Drink Local
(p<0.01), Dine Elite (p<0.001), and Familiarity (p<0.001).
Furthermore, post-hoc tests were conducted using Tukey HSD to determine what
education levels differed from each other with respect to these dimensions. With respect
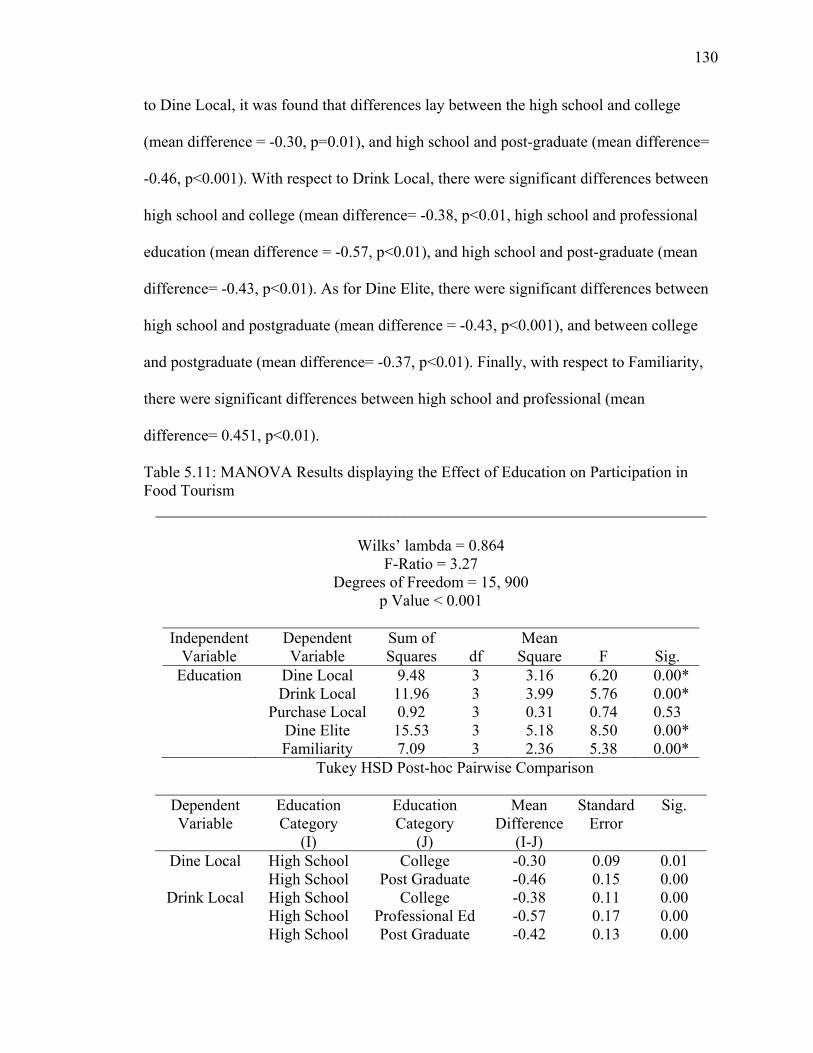
130
to Dine Local, it was found that differences lay between the high school and college
(mean difference = -0.30, p=0.01), and high school and post-graduate (mean difference=
-0.46, p<0.001). With respect to Drink Local, there were significant differences between
high school and college (mean difference= -0.38, p<0.01, high school and professional
education (mean difference = -0.57, p<0.01), and high school and post-graduate (mean
difference= -0.43, p<0.01). As for Dine Elite, there were significant differences between
high school and postgraduate (mean difference = -0.43, p<0.001), and between college
and postgraduate (mean difference= -0.37, p<0.01). Finally, with respect to Familiarity,
there were significant differences between high school and professional (mean
difference= 0.451, p<0.01).
Table 5.11: MANOVA Results displaying the Effect of Education on Participation in Food Tourism
_____________________________________________________________________
Wilks’ lambda = 0.864 F-Ratio = 3.27
Degrees of Freedom = 15, 900 p Value < 0.001
Independent
Variable Dependent Variable
Sum of Squares df
Mean Square F Sig.
Education Dine Local 9.48 3 3.16 6.20 0.00* Drink Local 11.96 3 3.99 5.76 0.00* Purchase Local 0.92 3 0.31 0.74 0.53 Dine Elite 15.53 3 5.18 8.50 0.00* Familiarity 7.09 3 2.36 5.38 0.00*
Tukey HSD Post-hoc Pairwise Comparison
Dependent Variable
Education Category
(I)
Education Category
(J)
Mean Difference
(I-J)
Standard Error
Sig.
Dine Local High School College -0.30 0.09 0.01 High School Post Graduate -0.46 0.15 0.00
Drink Local High School College -0.38 0.11 0.00 High School Professional Ed -0.57 0.17 0.00 High School Post Graduate -0.42 0.13 0.00
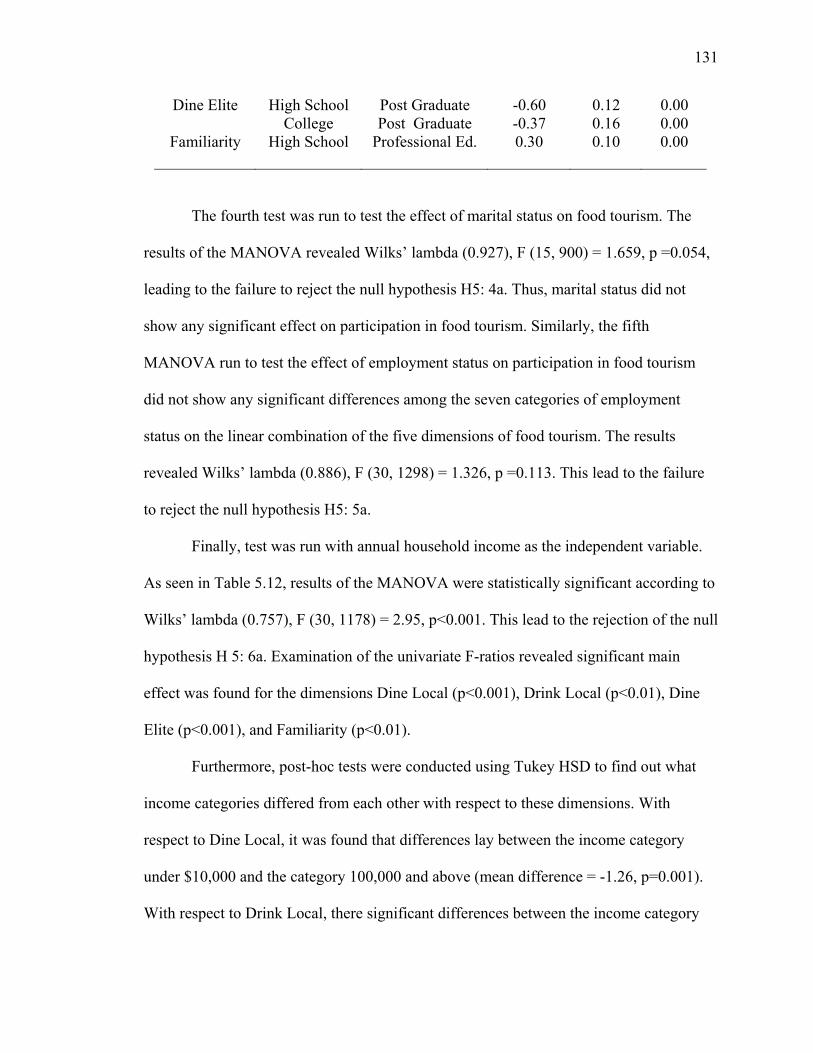
131
Dine Elite High School Post Graduate -0.60 0.12 0.00 College Post Graduate -0.37 0.16 0.00
Familiarity High School Professional Ed. 0.30 0.10 0.00
The fourth test was run to test the effect of marital status on food tourism. The
results of the MANOVA revealed Wilks’ lambda (0.927), F (15, 900) = 1.659, p =0.054,
leading to the failure to reject the null hypothesis H5: 4a. Thus, marital status did not
show any significant effect on participation in food tourism. Similarly, the fifth
MANOVA run to test the effect of employment status on participation in food tourism
did not show any significant differences among the seven categories of employment
status on the linear combination of the five dimensions of food tourism. The results
revealed Wilks’ lambda (0.886), F (30, 1298) = 1.326, p =0.113. This lead to the failure
to reject the null hypothesis H5: 5a.
Finally, test was run with annual household income as the independent variable.
As seen in Table 5.12, results of the MANOVA were statistically significant according to
Wilks’ lambda (0.757), F (30, 1178) = 2.95, p<0.001. This lead to the rejection of the null
hypothesis H 5: 6a. Examination of the univariate F-ratios revealed significant main
effect was found for the dimensions Dine Local (p<0.001), Drink Local (p<0.01), Dine
Elite (p<0.001), and Familiarity (p<0.01).
Furthermore, post-hoc tests were conducted using Tukey HSD to find out what
income categories differed from each other with respect to these dimensions. With
respect to Dine Local, it was found that differences lay between the income category
under $10,000 and the category 100,000 and above (mean difference = -1.26, p=0.001).
With respect to Drink Local, there significant differences between the income category
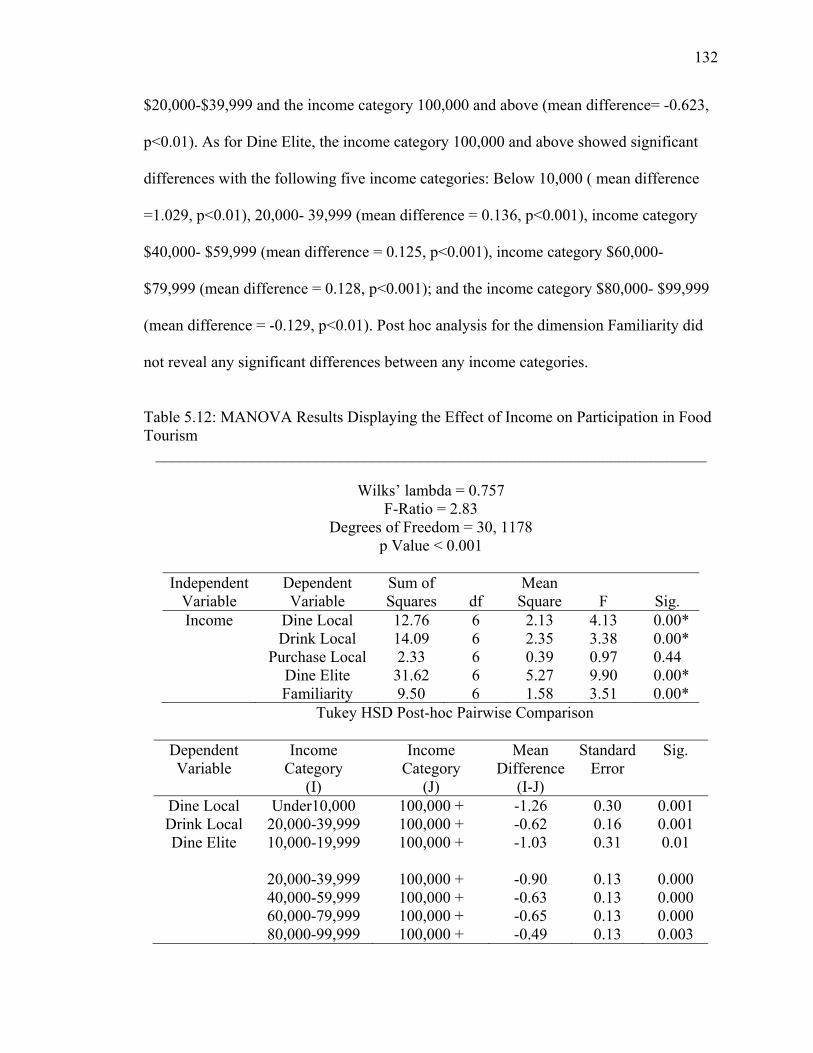
132
$20,000-$39,999 and the income category 100,000 and above (mean difference= -0.623,
p<0.01). As for Dine Elite, the income category 100,000 and above showed significant
differences with the following five income categories: Below 10,000 ( mean difference
=1.029, p<0.01), 20,000- 39,999 (mean difference = 0.136, p<0.001), income category
$40,000- $59,999 (mean difference = 0.125, p<0.001), income category $60,000-
$79,999 (mean difference = 0.128, p<0.001); and the income category $80,000- $99,999
(mean difference = -0.129, p<0.01). Post hoc analysis for the dimension Familiarity did
not reveal any significant differences between any income categories.
Table 5.12: MANOVA Results Displaying the Effect of Income on Participation in Food Tourism
_____________________________________________________________________
Wilks’ lambda = 0.757 F-Ratio = 2.83
Degrees of Freedom = 30, 1178 p Value < 0.001
Independent
Variable Dependent Variable
Sum of Squares df
Mean Square F Sig.
Income Dine Local 12.76 6 2.13 4.13 0.00* Drink Local 14.09 6 2.35 3.38 0.00* Purchase Local 2.33 6 0.39 0.97 0.44 Dine Elite 31.62 6 5.27 9.90 0.00* Familiarity 9.50 6 1.58 3.51 0.00*
Tukey HSD Post-hoc Pairwise Comparison
Dependent Variable
Income Category
(I)
Income Category
(J)
Mean Difference
(I-J)
Standard Error
Sig.
Dine Local Under10,000 100,000 + -1.26 0.30 0.001 Drink Local 20,000-39,999 100,000 + -0.62 0.16 0.001 Dine Elite 10,000-19,999
100,000 + -1.03 0.31 0.01
20,000-39,999 100,000 + -0.90 0.13 0.000 40,000-59,999 100,000 + -0.63 0.13 0.000 60,000-79,999 100,000 + -0.65 0.13 0.000 80,000-99,999 100,000 + -0.49 0.13 0.003
133
5.4 Developing Taxonomy of Food Tourists
To test whether the tourists could be segmented into homogenous groups based on
their participation in food tourism, cluster analysis was performed. Clusters of
respondents were created using Ward’s method in SPSS 13.0. The objects being
clustered, in this case the respondents of the current study, were all assigned a separate
cluster, and those clusters were combined until a stopping point was determined. The
mean scores of each of the factors obtained by the factor analysis of the twenty-two food
tourism activities were used as the clustering variables.
The agglomeration schedule similar to scree-plots in factor analysis was examined
for large changes in agglomeration coefficients. These were noted as potential stopping
points. A three-cluster solution was selected, and this was cross–validated with a K-
means cluster analysis. Stability of the solution was also examined for the K-means
clustering by considering a random initial seed (centroids), which was iterated until the
Euclidean distance between centroids change to less than 2%. Use of this iterative
approach reduces the chances of biases entering the designation of initial cluster seeds,
and assures stable clusters once the procedure meets the 2% convergent criterion (Hair et
al., 1995). The final cluster-centroids were nearly identical, thus validating the selection
of a three-cluster solution.
Final determination of clusters was based on researcher judgment of
interpretability of cluster means (Milligan & Cooper, 1985). The mean scores of each
cluster on each of the five dimensions were compared with the grand mean by examining
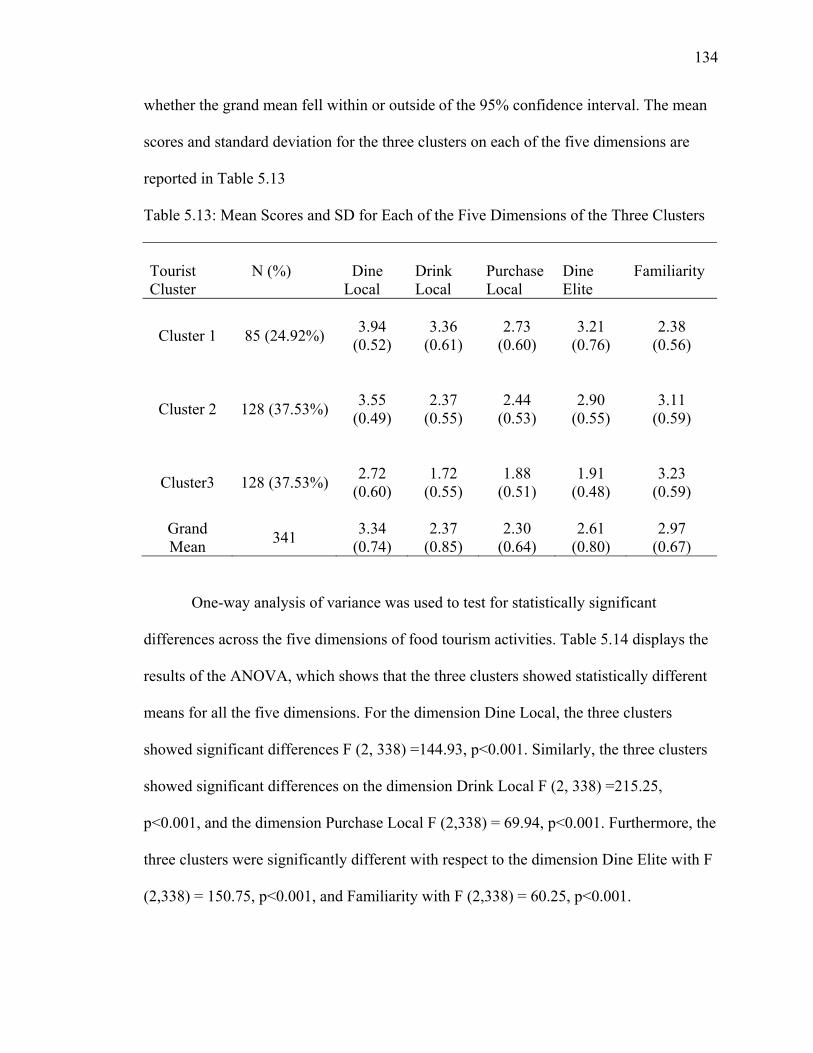
134
whether the grand mean fell within or outside of the 95% confidence interval. The mean
scores and standard deviation for the three clusters on each of the five dimensions are
reported in Table 5.13
Table 5.13: Mean Scores and SD for Each of the Five Dimensions of the Three Clusters
Tourist Cluster
N (%) Dine Local
Drink Local
Purchase Local
Dine Elite
Familiarity
Cluster 1 85 (24.92%) 3.94 (0.52)
3.36 (0.61)
2.73 (0.60)
3.21 (0.76)
2.38
(0.56)
Cluster 2 128 (37.53%) 3.55 (0.49)
2.37 (0.55)
2.44 (0.53)
2.90 (0.55)
3.11
(0.59)
Cluster3 128 (37.53%) 2.72 (0.60)
1.72 (0.55)
1.88 (0.51)
1.91 (0.48)
3.23
(0.59)
Grand Mean 341 3.34
(0.74) 2.37
(0.85) 2.30
(0.64) 2.61
(0.80) 2.97
(0.67)
One-way analysis of variance was used to test for statistically significant
differences across the five dimensions of food tourism activities. Table 5.14 displays the
results of the ANOVA, which shows that the three clusters showed statistically different
means for all the five dimensions. For the dimension Dine Local, the three clusters
showed significant differences F (2, 338) =144.93, p<0.001. Similarly, the three clusters
showed significant differences on the dimension Drink Local F (2, 338) =215.25,
p<0.001, and the dimension Purchase Local F (2,338) = 69.94, p<0.001. Furthermore, the
three clusters were significantly different with respect to the dimension Dine Elite with F
(2,338) = 150.75, p<0.001, and Familiarity with F (2,338) = 60.25, p<0.001.
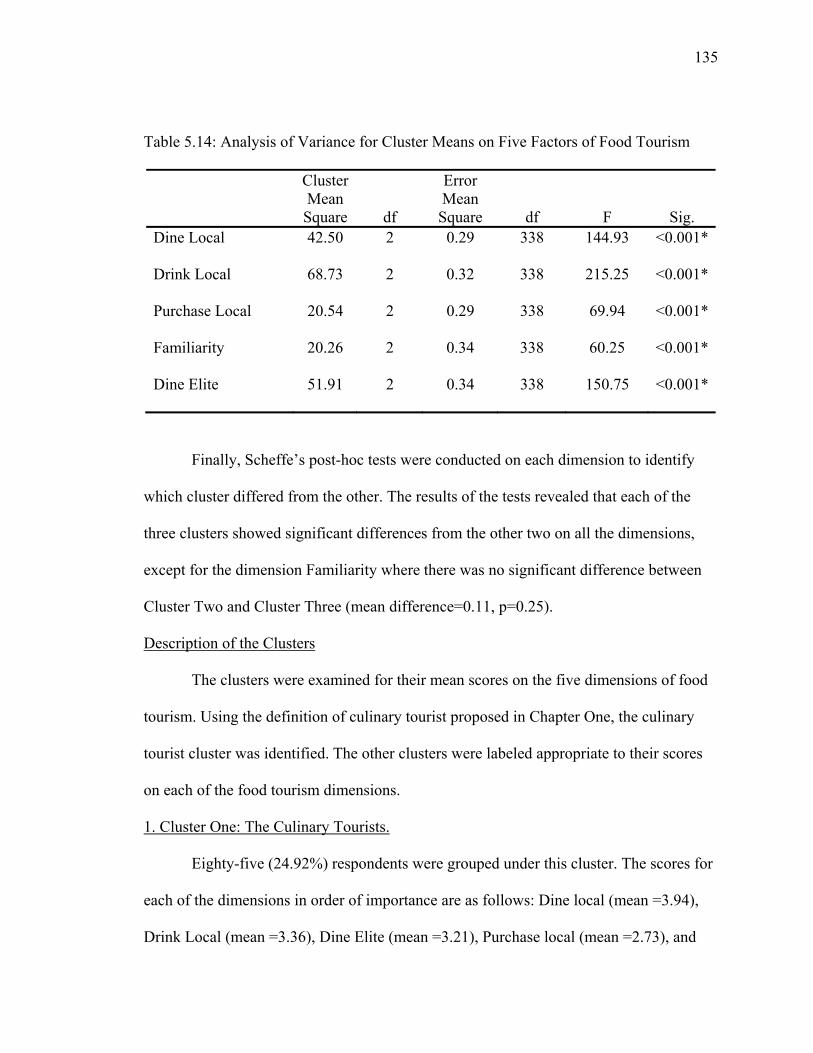
135
Table 5.14: Analysis of Variance for Cluster Means on Five Factors of Food Tourism
Cluster Mean Square df
Error Mean Square df F Sig.
Dine Local 42.50 2 0.29 338 144.93 <0.001*
Drink Local 68.73 2 0.32 338 215.25 <0.001*
Purchase Local 20.54 2 0.29 338 69.94 <0.001*
Familiarity 20.26 2 0.34 338 60.25 <0.001*
Dine Elite 51.91 2 0.34 338 150.75 <0.001*
Finally, Scheffe’s post-hoc tests were conducted on each dimension to identify
which cluster differed from the other. The results of the tests revealed that each of the
three clusters showed significant differences from the other two on all the dimensions,
except for the dimension Familiarity where there was no significant difference between
Cluster Two and Cluster Three (mean difference=0.11, p=0.25).
Description of the Clusters
The clusters were examined for their mean scores on the five dimensions of food
tourism. Using the definition of culinary tourist proposed in Chapter One, the culinary
tourist cluster was identified. The other clusters were labeled appropriate to their scores
on each of the food tourism dimensions.
1. Cluster One: The Culinary Tourists.
Eighty-five (24.92%) respondents were grouped under this cluster. The scores for
each of the dimensions in order of importance are as follows: Dine local (mean =3.94),
Drink Local (mean =3.36), Dine Elite (mean =3.21), Purchase local (mean =2.73), and
136
Familiarity (mean=2.38). All the scores were higher than the grand mean for the first four
dimensions and lower than the grand mean for the dimension Familiarity.
Additionally, when compared to the other two clusters, the scores on all the
dimensions were the highest, except for the Familiarity dimension where it had the lowest
scores among the three clusters. This is explained by the fact that the dimension
Familiarity is composed of items like ‘Eating at fast food outlets’ and the like, which
indicates low interest in local food. Logically, a person high on the Dine Local, Purchase
Local, and Drink Local dimensions would be expected to be low on familiarity and vice-
versa.
In Chapter One, the definition proposed for culinary tourists was “they are a
special interest tourist whose major activities at the destination are food-related, and for
whom food tourism is an important, if not primary reason influencing his travel
behavior.” Using this definition and examining the scores of this cluster, it seemed apt to
label this cluster Culinary Tourist.
2. Cluster Two: The Experiential Tourist.
One hundred and twenty eight (37.53%) respondents represented the second
cluster. Their scores on each of the dimensions in order of importance are as follows:
Dine local (mean =3.55), Familiarity (mean =3.11), Dine Elite (mean =2.90), Purchase
local (mean =2.44), and Drink Local (mean =2.37). All the scores were higher than the
overall or grand mean, except for the dimension Drink Local which was the same as the
overall mean.
Furthermore, when compared to the other two clusters, the group displayed scores
that fell right in between the three clusters. The tourists belonging to this cluster had a
137
medium score on all the dimensions. This cluster was labeled as Experiential Tourist.
This cluster was called experiential tourist because it had equal or greater score compared
to the overall mean score for all the dimensions. The tourists representing this group
seemed to be open to local food experiences, but not as highly engaged as the culinary
tourist.
At the same time, they did not show any significant difference from cluster three,
which had highest score on familiarity. This indicates that the experiential tourist prefers
the comfort of familiar food served at franchisees and chain restaurants while
experimenting with the local fare.
3. Cluster Three: The General Tourist.
Overall, 128 (37.53%) respondents made up the third cluster. Their scores on each
of the dimension in order of importance were as follows: Familiarity (mean =3.23), Dine
Local (mean =2.72), Dine Elite (mean =1.99), Purchase Local (mean=1.88), Drink Local
(mean=1.72). Compared to the other two groups, this group had lowest scores on all the
dimensions except for the dimension Familiarity, where it had the highest scores among
all the clusters. Similarly, when compared to the overall mean, the group displayed lower
scores on all the factors except for Familiarity. This cluster was labeled General Tourist.
On a continuum that represents food tourists, this cluster is likely to be polar opposite to
the special interest segment of culinary tourist. Figure 5.1 displays a line graph of the
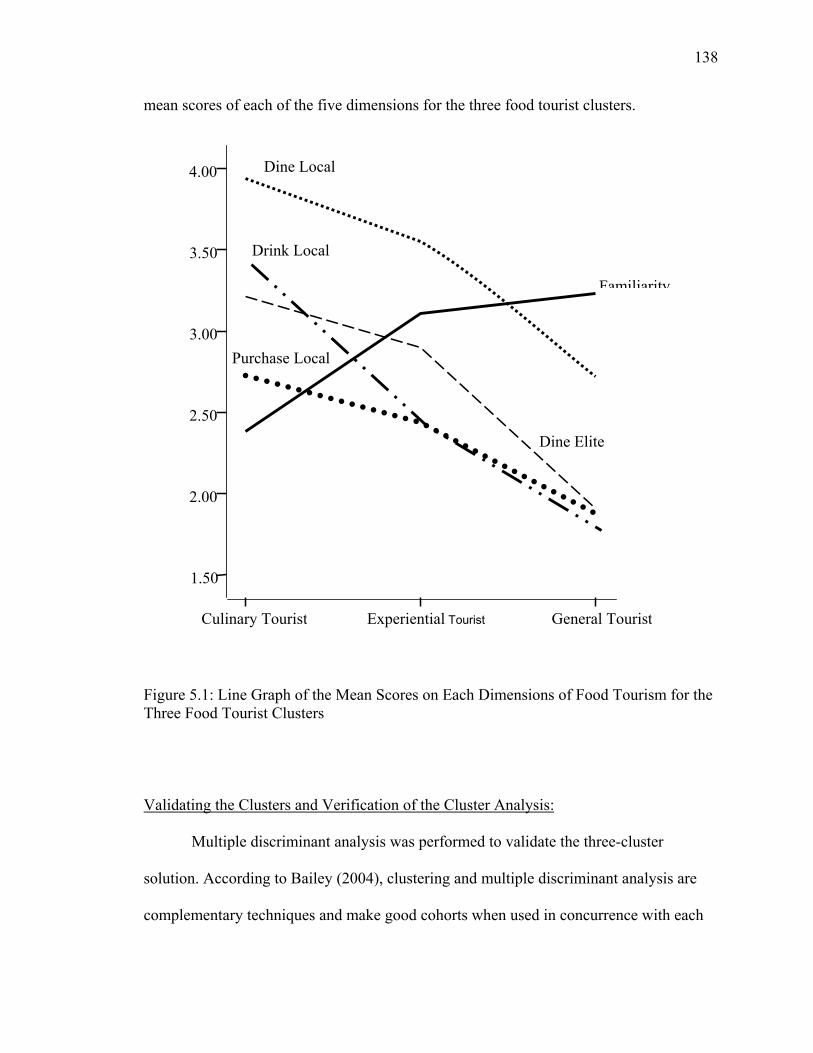
138
mean scores of each of the five dimensions for the three food tourist clusters.
Figure 5.1: Line Graph of the Mean Scores on Each Dimensions of Food Tourism for the Three Food Tourist Clusters
Validating the Clusters and Verification of the Cluster Analysis:
Multiple discriminant analysis was performed to validate the three-cluster
solution. According to Bailey (2004), clustering and multiple discriminant analysis are
complementary techniques and make good cohorts when used in concurrence with each
General TouristExperiential TouristCulinary Tourist
4.00
3.50
3.00
2.50
2.00
1.50
Purchase Local
Dine Local
Drink Local
Dine Elite
Familiarity
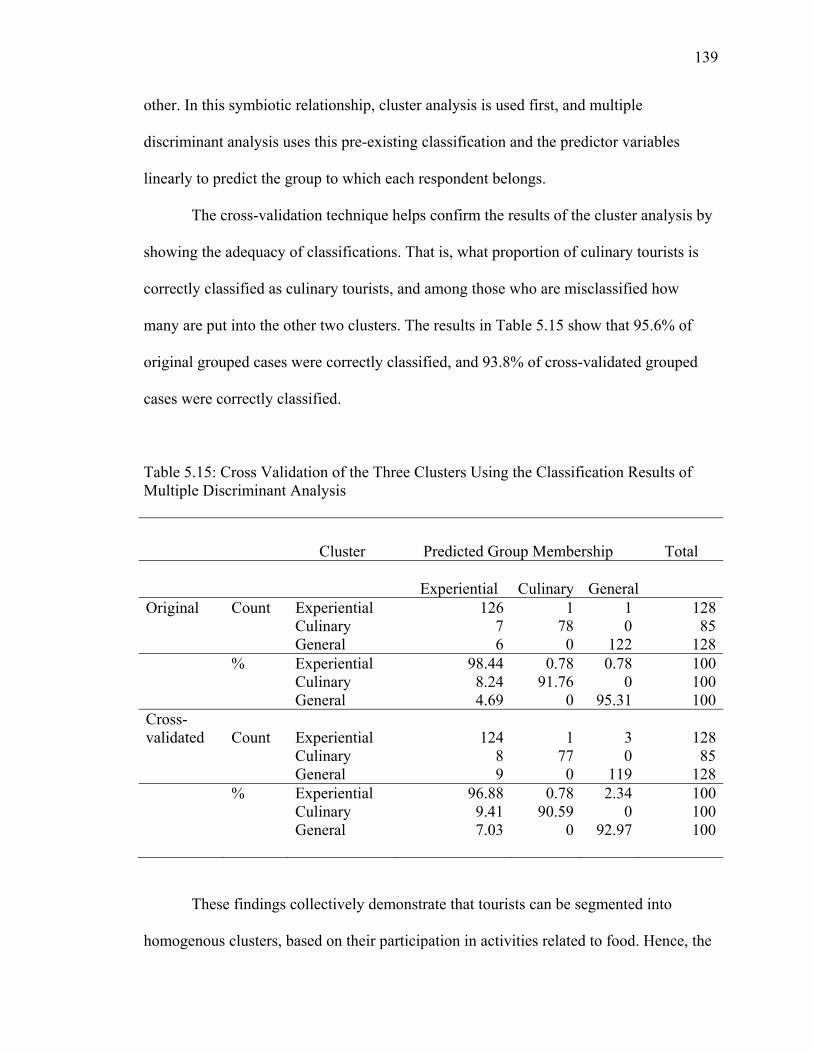
139
other. In this symbiotic relationship, cluster analysis is used first, and multiple
discriminant analysis uses this pre-existing classification and the predictor variables
linearly to predict the group to which each respondent belongs.
The cross-validation technique helps confirm the results of the cluster analysis by
showing the adequacy of classifications. That is, what proportion of culinary tourists is
correctly classified as culinary tourists, and among those who are misclassified how
many are put into the other two clusters. The results in Table 5.15 show that 95.6% of
original grouped cases were correctly classified, and 93.8% of cross-validated grouped
cases were correctly classified.
Table 5.15: Cross Validation of the Three Clusters Using the Classification Results of Multiple Discriminant Analysis Cluster Predicted Group Membership Total
Experiential Culinary General
Original Count Experiential 126 1 1 128 Culinary 7 78 0 85 General 6 0 122 128 % Experiential 98.44 0.78 0.78 100 Culinary 8.24 91.76 0 100 General 4.69 0 95.31 100Cross-validated Count Experiential 124 1 3 128 Culinary 8 77 0 85 General 9 0 119 128 % Experiential 96.88 0.78 2.34 100 Culinary 9.41 90.59 0 100 General 7.03 0 92.97 100
These findings collectively demonstrate that tourists can be segmented into
homogenous clusters, based on their participation in activities related to food. Hence, the
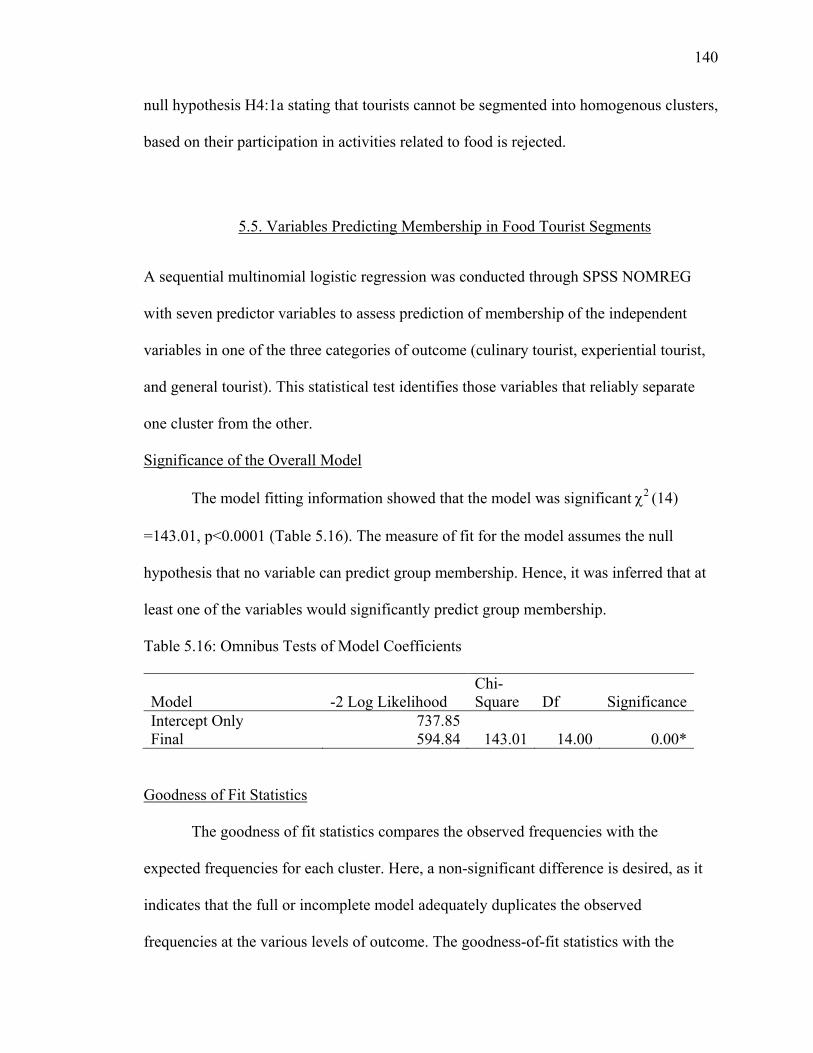
140
null hypothesis H4:1a stating that tourists cannot be segmented into homogenous clusters,
based on their participation in activities related to food is rejected.
5.5. Variables Predicting Membership in Food Tourist Segments
A sequential multinomial logistic regression was conducted through SPSS NOMREG
with seven predictor variables to assess prediction of membership of the independent
variables in one of the three categories of outcome (culinary tourist, experiential tourist,
and general tourist). This statistical test identifies those variables that reliably separate
one cluster from the other.
Significance of the Overall Model
The model fitting information showed that the model was significant %2 (14)
=143.01, p<0.0001 (Table 5.16). The measure of fit for the model assumes the null
hypothesis that no variable can predict group membership. Hence, it was inferred that at
least one of the variables would significantly predict group membership.
Table 5.16: Omnibus Tests of Model Coefficients
Model -2 Log Likelihood Chi-Square Df Significance
Intercept Only 737.85 Final 594.84 143.01 14.00 0.00*
Goodness of Fit Statistics
The goodness of fit statistics compares the observed frequencies with the
expected frequencies for each cluster. Here, a non-significant difference is desired, as it
indicates that the full or incomplete model adequately duplicates the observed
frequencies at the various levels of outcome. The goodness-of-fit statistics with the
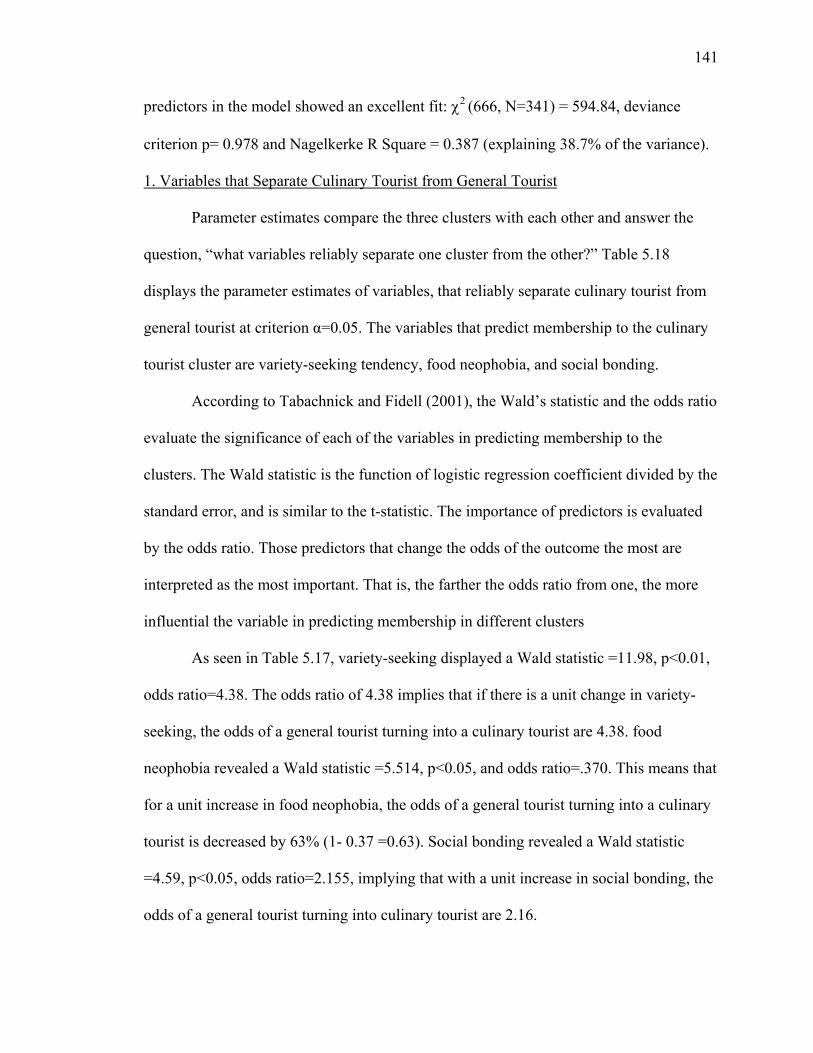
141
predictors in the model showed an excellent fit: %2 (666, N=341) = 594.84, deviance
criterion p= 0.978 and Nagelkerke R Square = 0.387 (explaining 38.7% of the variance).
1. Variables that Separate Culinary Tourist from General Tourist
Parameter estimates compare the three clusters with each other and answer the
question, “what variables reliably separate one cluster from the other?” Table 5.18
displays the parameter estimates of variables, that reliably separate culinary tourist from
general tourist at criterion !=0.05. The variables that predict membership to the culinary
tourist cluster are variety-seeking tendency, food neophobia, and social bonding.
According to Tabachnick and Fidell (2001), the Wald’s statistic and the odds ratio
evaluate the significance of each of the variables in predicting membership to the
clusters. The Wald statistic is the function of logistic regression coefficient divided by the
standard error, and is similar to the t-statistic. The importance of predictors is evaluated
by the odds ratio. Those predictors that change the odds of the outcome the most are
interpreted as the most important. That is, the farther the odds ratio from one, the more
influential the variable in predicting membership in different clusters
As seen in Table 5.17, variety-seeking displayed a Wald statistic =11.98, p<0.01,
odds ratio=4.38. The odds ratio of 4.38 implies that if there is a unit change in variety-
seeking, the odds of a general tourist turning into a culinary tourist are 4.38. food
neophobia revealed a Wald statistic =5.514, p<0.05, and odds ratio=.370. This means that
for a unit increase in food neophobia, the odds of a general tourist turning into a culinary
tourist is decreased by 63% (1- 0.37 =0.63). Social bonding revealed a Wald statistic
=4.59, p<0.05, odds ratio=2.155, implying that with a unit increase in social bonding, the
odds of a general tourist turning into culinary tourist are 2.16.
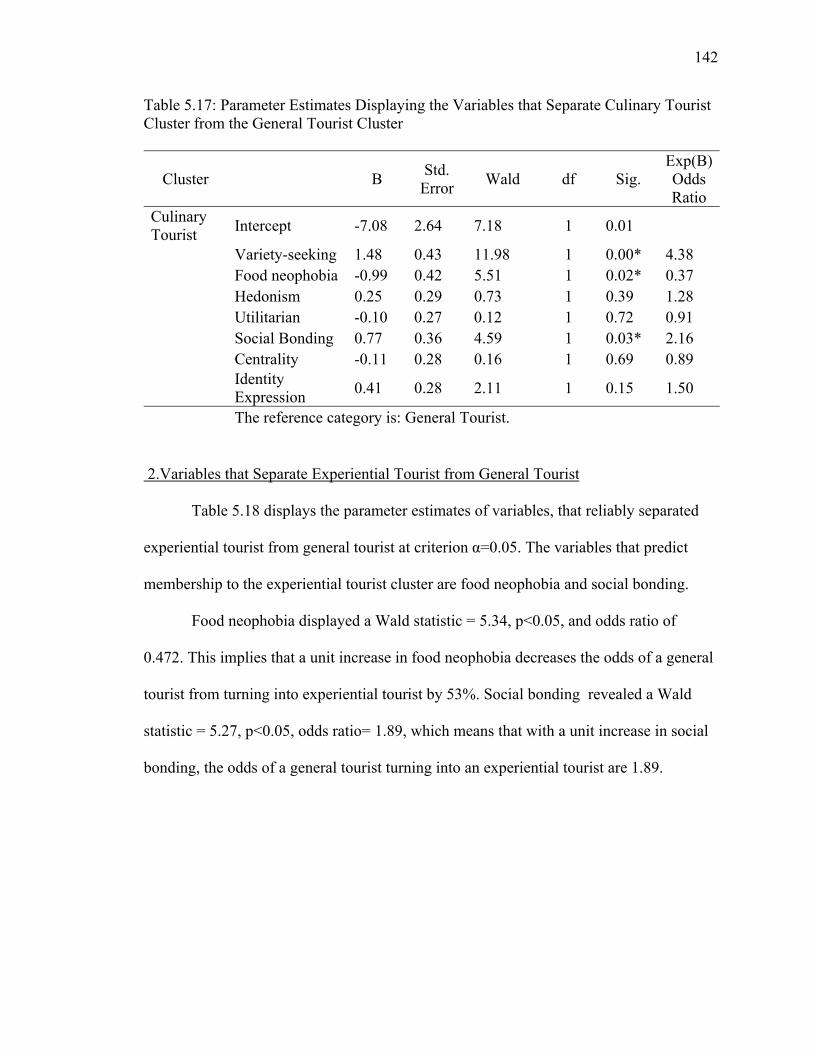
142
Table 5.17: Parameter Estimates Displaying the Variables that Separate Culinary Tourist Cluster from the General Tourist Cluster
Cluster B Std. Error Wald df Sig.
Exp(B)Odds Ratio
Culinary Tourist Intercept -7.08 2.64 7.18 1 0.01
Variety-seeking 1.48 0.43 11.98 1 0.00* 4.38 Food neophobia -0.99 0.42 5.51 1 0.02* 0.37 Hedonism 0.25 0.29 0.73 1 0.39 1.28 Utilitarian -0.10 0.27 0.12 1 0.72 0.91 Social Bonding 0.77 0.36 4.59 1 0.03* 2.16 Centrality -0.11 0.28 0.16 1 0.69 0.89
Identity Expression 0.41 0.28 2.11 1 0.15 1.50
The reference category is: General Tourist.
2.Variables that Separate Experiential Tourist from General Tourist
Table 5.18 displays the parameter estimates of variables, that reliably separated
experiential tourist from general tourist at criterion !=0.05. The variables that predict
membership to the experiential tourist cluster are food neophobia and social bonding.
Food neophobia displayed a Wald statistic = 5.34, p<0.05, and odds ratio of
0.472. This implies that a unit increase in food neophobia decreases the odds of a general
tourist from turning into experiential tourist by 53%. Social bonding revealed a Wald
statistic = 5.27, p<0.05, odds ratio= 1.89, which means that with a unit increase in social
bonding, the odds of a general tourist turning into an experiential tourist are 1.89.
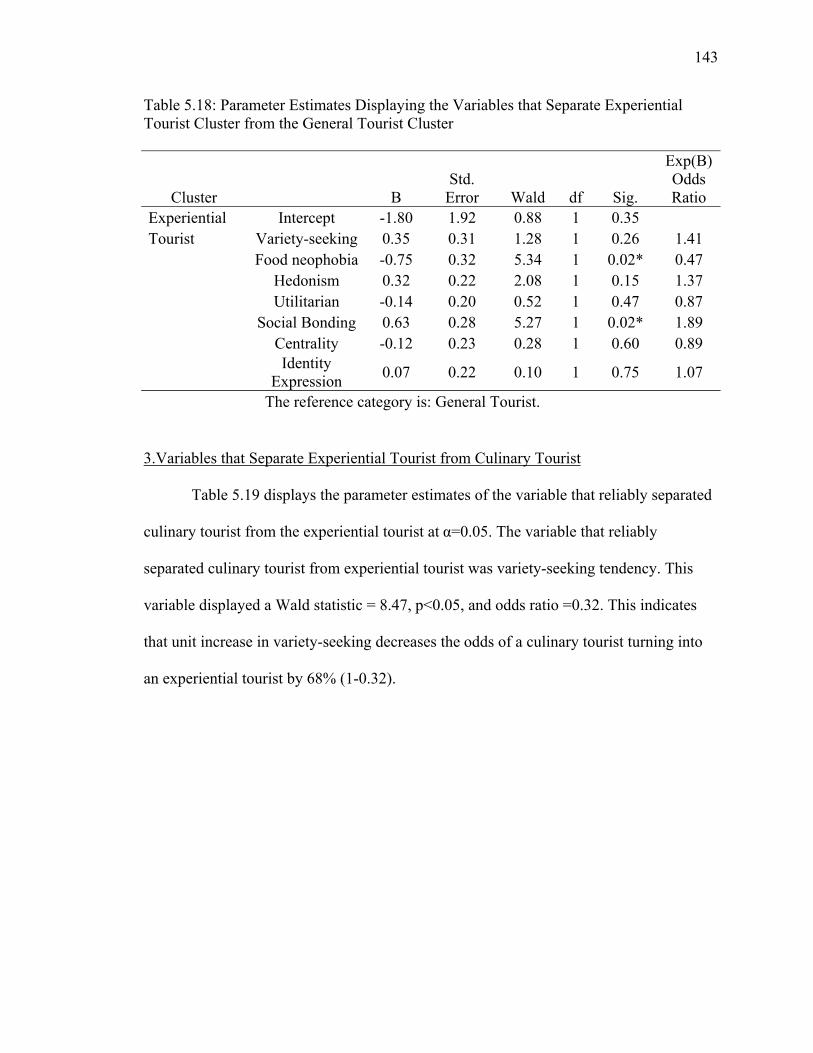
143
Table 5.18: Parameter Estimates Displaying the Variables that Separate Experiential Tourist Cluster from the General Tourist Cluster
Cluster B Std.
Error Wald df Sig.
Exp(B) Odds Ratio
Experiential Intercept -1.80 1.92 0.88 1 0.35 Tourist Variety-seeking 0.35 0.31 1.28 1 0.26 1.41 Food neophobia -0.75 0.32 5.34 1 0.02* 0.47 Hedonism 0.32 0.22 2.08 1 0.15 1.37 Utilitarian -0.14 0.20 0.52 1 0.47 0.87 Social Bonding 0.63 0.28 5.27 1 0.02* 1.89 Centrality -0.12 0.23 0.28 1 0.60 0.89
Identity Expression 0.07 0.22 0.10 1 0.75 1.07
The reference category is: General Tourist.
3.Variables that Separate Experiential Tourist from Culinary Tourist
Table 5.19 displays the parameter estimates of the variable that reliably separated
culinary tourist from the experiential tourist at !=0.05. The variable that reliably
separated culinary tourist from experiential tourist was variety-seeking tendency. This
variable displayed a Wald statistic = 8.47, p<0.05, and odds ratio =0.32. This indicates
that unit increase in variety-seeking decreases the odds of a culinary tourist turning into
an experiential tourist by 68% (1-0.32).
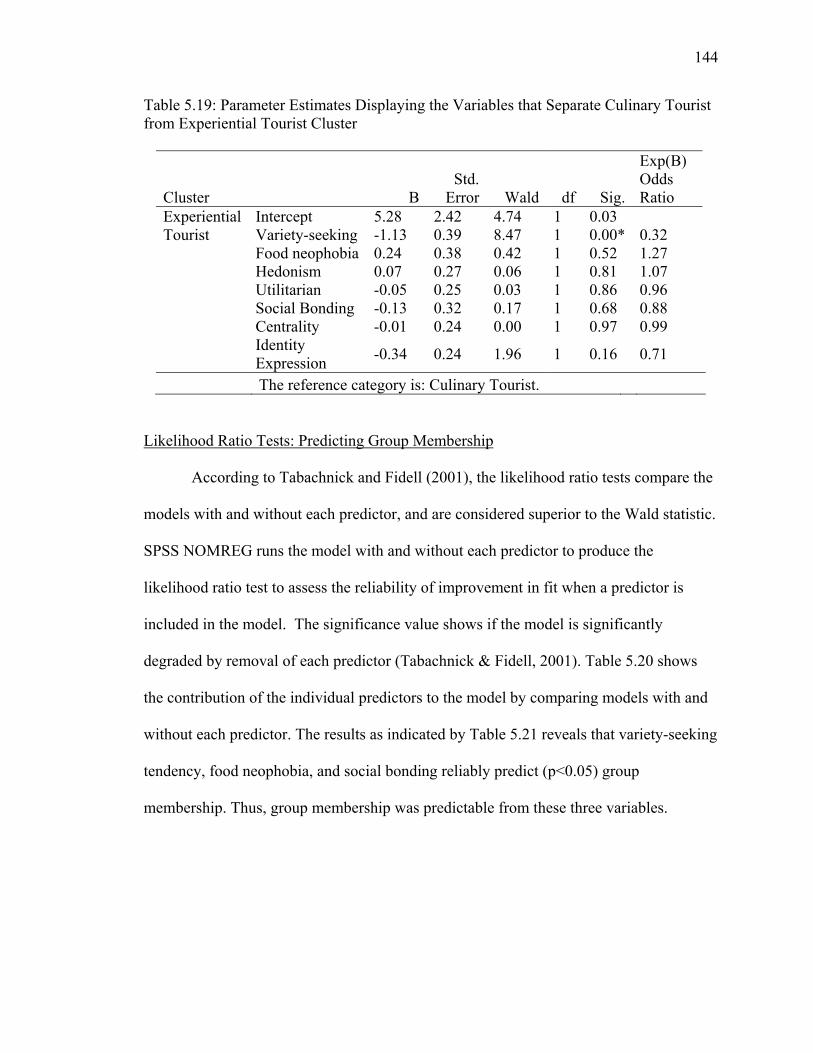
144
Table 5.19: Parameter Estimates Displaying the Variables that Separate Culinary Tourist from Experiential Tourist Cluster
Cluster BStd.
Error Wald df Sig.
Exp(B) Odds Ratio
Experiential Intercept 5.28 2.42 4.74 1 0.03 Tourist Variety-seeking -1.13 0.39 8.47 1 0.00* 0.32 Food neophobia 0.24 0.38 0.42 1 0.52 1.27 Hedonism 0.07 0.27 0.06 1 0.81 1.07 Utilitarian -0.05 0.25 0.03 1 0.86 0.96 Social Bonding -0.13 0.32 0.17 1 0.68 0.88 Centrality -0.01 0.24 0.00 1 0.97 0.99
Identity Expression -0.34 0.24 1.96 1 0.16 0.71
The reference category is: Culinary Tourist.
Likelihood Ratio Tests: Predicting Group Membership
According to Tabachnick and Fidell (2001), the likelihood ratio tests compare the
models with and without each predictor, and are considered superior to the Wald statistic.
SPSS NOMREG runs the model with and without each predictor to produce the
likelihood ratio test to assess the reliability of improvement in fit when a predictor is
included in the model. The significance value shows if the model is significantly
degraded by removal of each predictor (Tabachnick & Fidell, 2001). Table 5.20 shows
the contribution of the individual predictors to the model by comparing models with and
without each predictor. The results as indicated by Table 5.21 reveals that variety-seeking
tendency, food neophobia, and social bonding reliably predict (p<0.05) group
membership. Thus, group membership was predictable from these three variables.
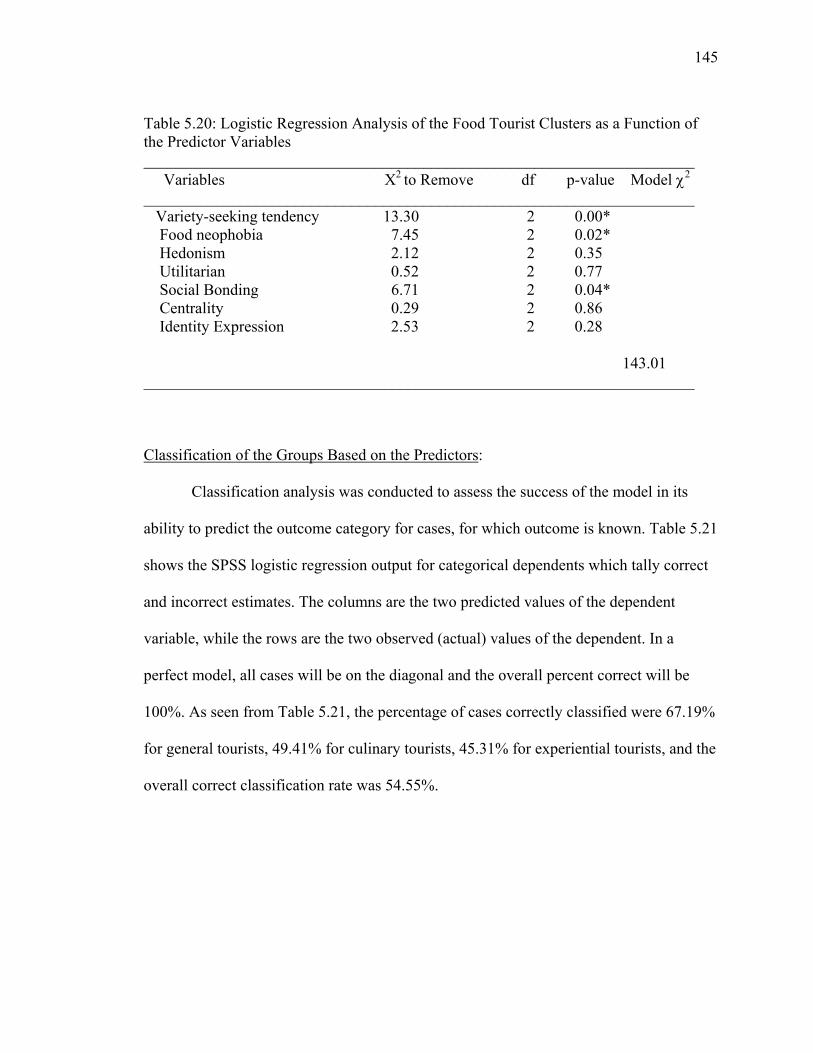
145
Table 5.20: Logistic Regression Analysis of the Food Tourist Clusters as a Function of the Predictor Variables _____________________________________________________________________ Variables X2
to Remove df p-value Model %2
_____________________________________________________________________ Variety-seeking tendency 13.30 2 0.00* Food neophobia 7.45 2 0.02* Hedonism 2.12 2 0.35 Utilitarian 0.52 2 0.77 Social Bonding 6.71 2 0.04* Centrality 0.29 2 0.86 Identity Expression 2.53 2 0.28
143.01
_____________________________________________________________________
Classification of the Groups Based on the Predictors:
Classification analysis was conducted to assess the success of the model in its
ability to predict the outcome category for cases, for which outcome is known. Table 5.21
shows the SPSS logistic regression output for categorical dependents which tally correct
and incorrect estimates. The columns are the two predicted values of the dependent
variable, while the rows are the two observed (actual) values of the dependent. In a
perfect model, all cases will be on the diagonal and the overall percent correct will be
100%. As seen from Table 5.21, the percentage of cases correctly classified were 67.19%
for general tourists, 49.41% for culinary tourists, 45.31% for experiential tourists, and the
overall correct classification rate was 54.55%.
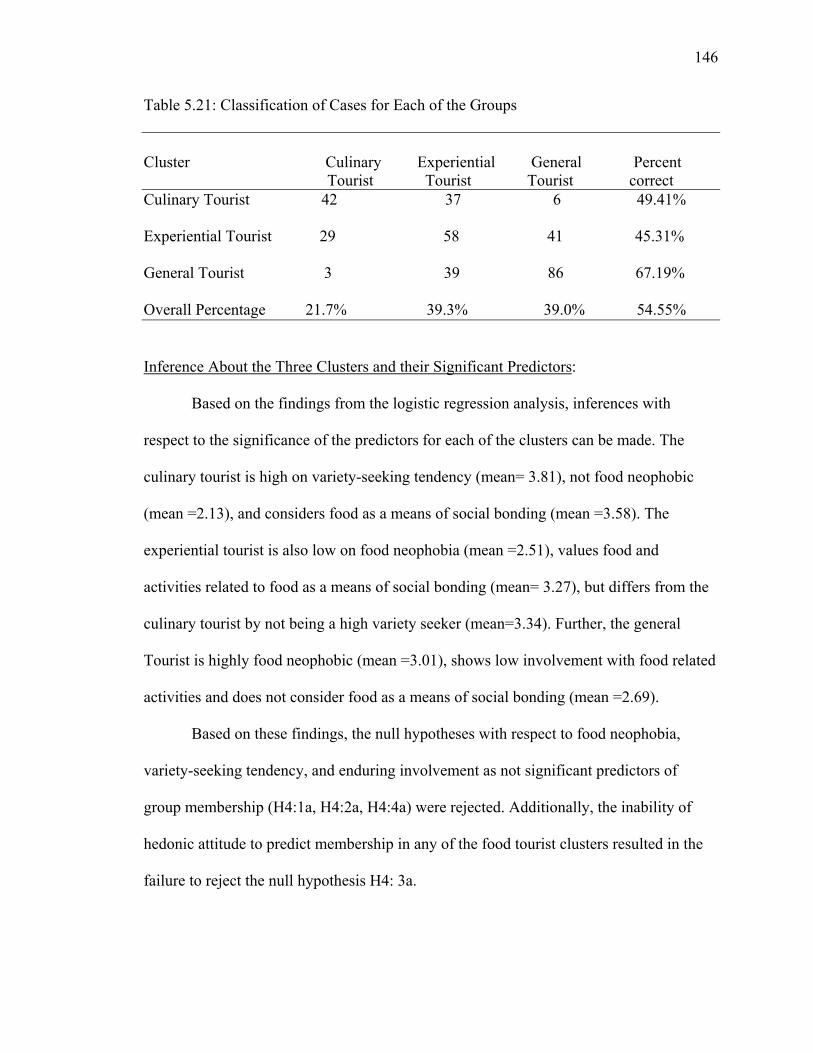
146
Table 5.21: Classification of Cases for Each of the Groups Cluster Culinary Experiential General Percent Tourist Tourist Tourist correct Culinary Tourist 42 37 6 49.41% Experiential Tourist 29 58 41 45.31% General Tourist 3 39 86 67.19% Overall Percentage 21.7% 39.3% 39.0% 54.55%
Inference About the Three Clusters and their Significant Predictors:
Based on the findings from the logistic regression analysis, inferences with
respect to the significance of the predictors for each of the clusters can be made. The
culinary tourist is high on variety-seeking tendency (mean= 3.81), not food neophobic
(mean =2.13), and considers food as a means of social bonding (mean =3.58). The
experiential tourist is also low on food neophobia (mean =2.51), values food and
activities related to food as a means of social bonding (mean= 3.27), but differs from the
culinary tourist by not being a high variety seeker (mean=3.34). Further, the general
Tourist is highly food neophobic (mean =3.01), shows low involvement with food related
activities and does not consider food as a means of social bonding (mean =2.69).
Based on these findings, the null hypotheses with respect to food neophobia,
variety-seeking tendency, and enduring involvement as not significant predictors of
group membership (H4:1a, H4:2a, H4:4a) were rejected. Additionally, the inability of
hedonic attitude to predict membership in any of the food tourist clusters resulted in the
failure to reject the null hypothesis H4: 3a.
147
5.6 Sociodemographic Status and the Food Tourist Clusters
Cross tabulation with a chi-square test was run to examine if there were any
significant association between the sociodemographic variables and the three food tourist
clusters. The six sociodemographic variables were: gender, age, education, marital status,
employment status, and annual household income.
One of the requirements for the results of the chi-square tests of association to be
interpretable is that the each of the categories has a minimum of five frequencies (SPSS
13.0 User’s Manual). In order to ensure relatively large sample sizes for each category of
the independent variables, the number of categories in age, employment status, marital
status, education and income were reduced. Age was transformed into five categories: 18-
34 (17.0%), 35-44 (13.5%), 45-54 (26.4%), 55-64 (28.2%), 65 and above (12.6%).
Marital status was reduced to two categories: married (77.4 %), and unmarried (20.5%).
Education was condensed to three categories: high school (24.0 %), college (42.2%), and
postgraduate (31.7%). Employment status was reduced to three categories: Employed
full-time (52.2%), unemployed and part-time (25.2%), and retired (20.8%). Finally,
annual household income was compressed into three categories: 39,999 and under
(34.9%), 40,000 to 99,999 (32.8%), and above 100,000 (21.7%).
The results displayed from Tables 5.22 to 5.27 indicate that education (%2 4 =24.6,
p<0.001), and annual household income (%2 4 =28.44, p<0.001) show a significant
association with the clusters. The three food tourist clusters did not show any significant
association with respect to gender, age, employment status and marital status.
Based on the chi-square results, the null hypotheses stating that there is no
significant association between education (H6:4a), annual household income (H 6:6a) of
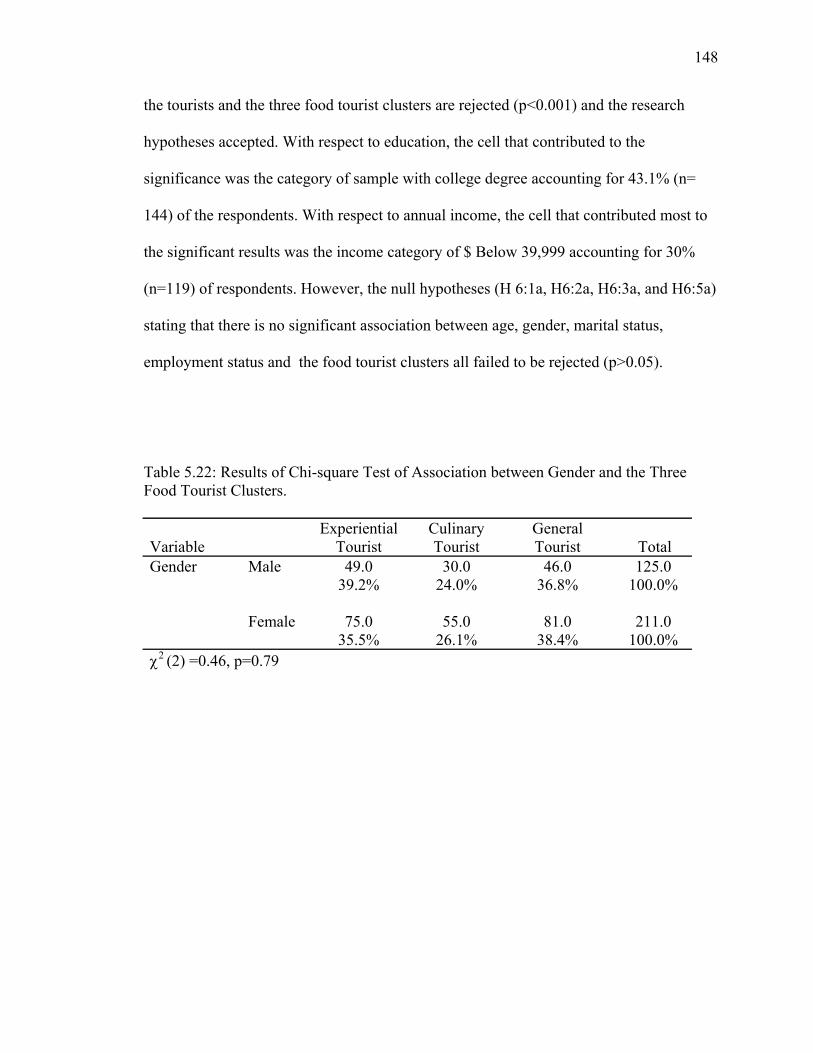
148
the tourists and the three food tourist clusters are rejected (p<0.001) and the research
hypotheses accepted. With respect to education, the cell that contributed to the
significance was the category of sample with college degree accounting for 43.1% (n=
144) of the respondents. With respect to annual income, the cell that contributed most to
the significant results was the income category of $ Below 39,999 accounting for 30%
(n=119) of respondents. However, the null hypotheses (H 6:1a, H6:2a, H6:3a, and H6:5a)
stating that there is no significant association between age, gender, marital status,
employment status and the food tourist clusters all failed to be rejected (p>0.05).
Table 5.22: Results of Chi-square Test of Association between Gender and the Three Food Tourist Clusters.
Variable Experiential
Tourist Culinary Tourist
General Tourist Total
Gender Male 49.0 30.0 46.0 125.0 39.2% 24.0% 36.8% 100.0% Female 75.0 55.0 81.0 211.0 35.5% 26.1% 38.4% 100.0% %2
(2) =0.46, p=0.79
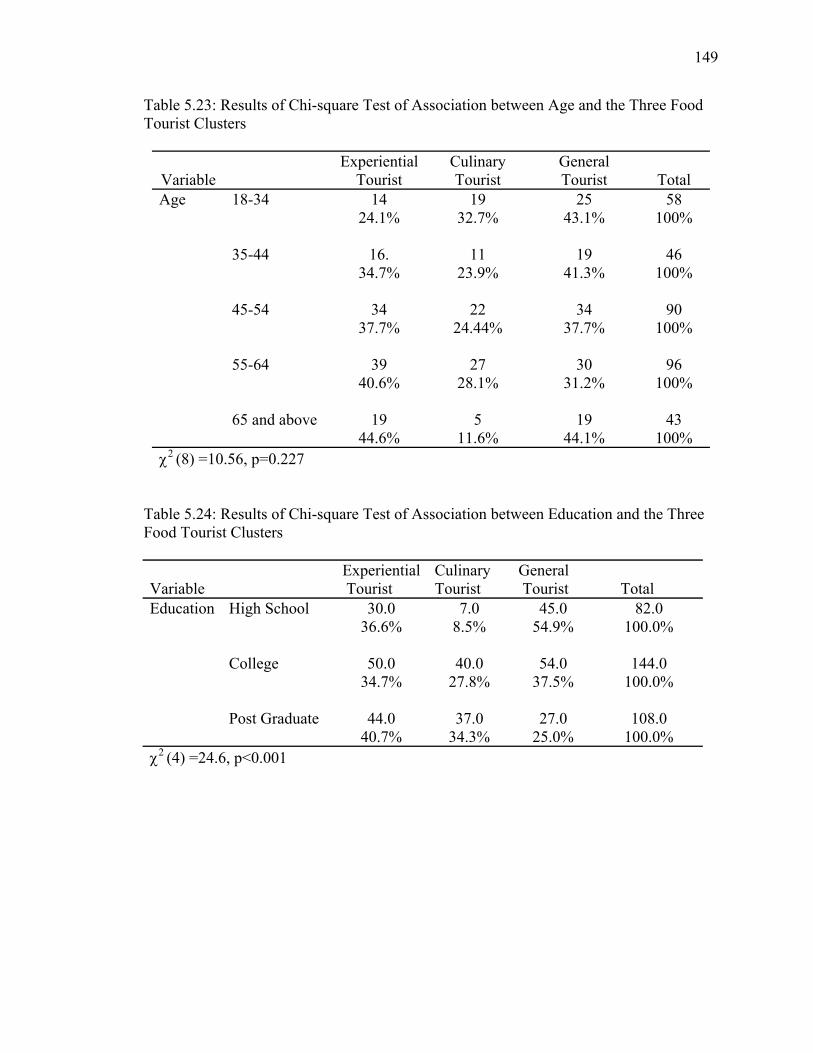
149
Table 5.23: Results of Chi-square Test of Association between Age and the Three Food Tourist Clusters
Variable Experiential
Tourist Culinary Tourist
General Tourist Total
Age 18-34 14 19 25 58 24.1% 32.7% 43.1% 100%
35-44 16. 11 19 46
34.7% 23.9% 41.3% 100%
45-54 34 22 34 90
37.7% 24.44% 37.7% 100%
55-64 39 27 30 96
40.6% 28.1% 31.2% 100%
65 and above 19 5 19 43
44.6% 11.6% 44.1% 100% %2
(8) =10.56, p=0.227 Table 5.24: Results of Chi-square Test of Association between Education and the Three Food Tourist Clusters
Variable Experiential Tourist
Culinary Tourist
General Tourist Total
Education High School 30.0 7.0 45.0 82.0 36.6% 8.5% 54.9% 100.0%
College 50.0 40.0 54.0 144.0
34.7% 27.8% 37.5% 100.0%
Post Graduate 44.0 37.0 27.0 108.0
40.7% 34.3% 25.0% 100.0% %2
(4) =24.6, p<0.001
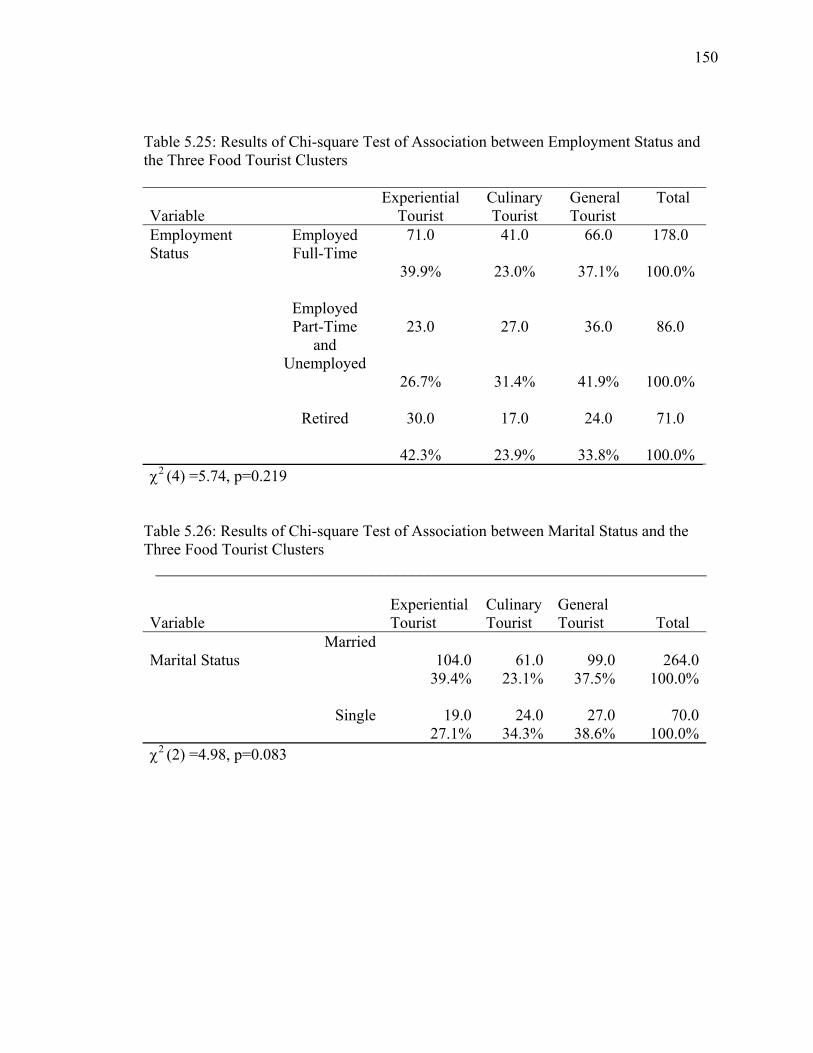
150
Table 5.25: Results of Chi-square Test of Association between Employment Status and the Three Food Tourist Clusters
Variable Experiential
Tourist Culinary Tourist
General Total Tourist
Employment Status
Employed Full-Time
71.0 41.0 66.0 178.0
39.9% 23.0% 37.1% 100.0%
Employed Part-Time
and Unemployed
23.0 27.0 36.0 86.0
26.7% 31.4% 41.9% 100.0%
Retired
30.0 17.0 24.0 71.0
42.3% 23.9% 33.8% 100.0% %2
(4) =5.74, p=0.219
Table 5.26: Results of Chi-square Test of Association between Marital Status and the Three Food Tourist Clusters
_____________________________________________________________________
Variable Experiential
Tourist Culinary Tourist
General Tourist Total
Marital Status
Married104.0 61.0 99.0 264.0
39.4% 23.1% 37.5% 100.0%
Single 19.0 24.0 27.0 70.0 27.1% 34.3% 38.6% 100.0%%2
(2) =4.98, p=0.083
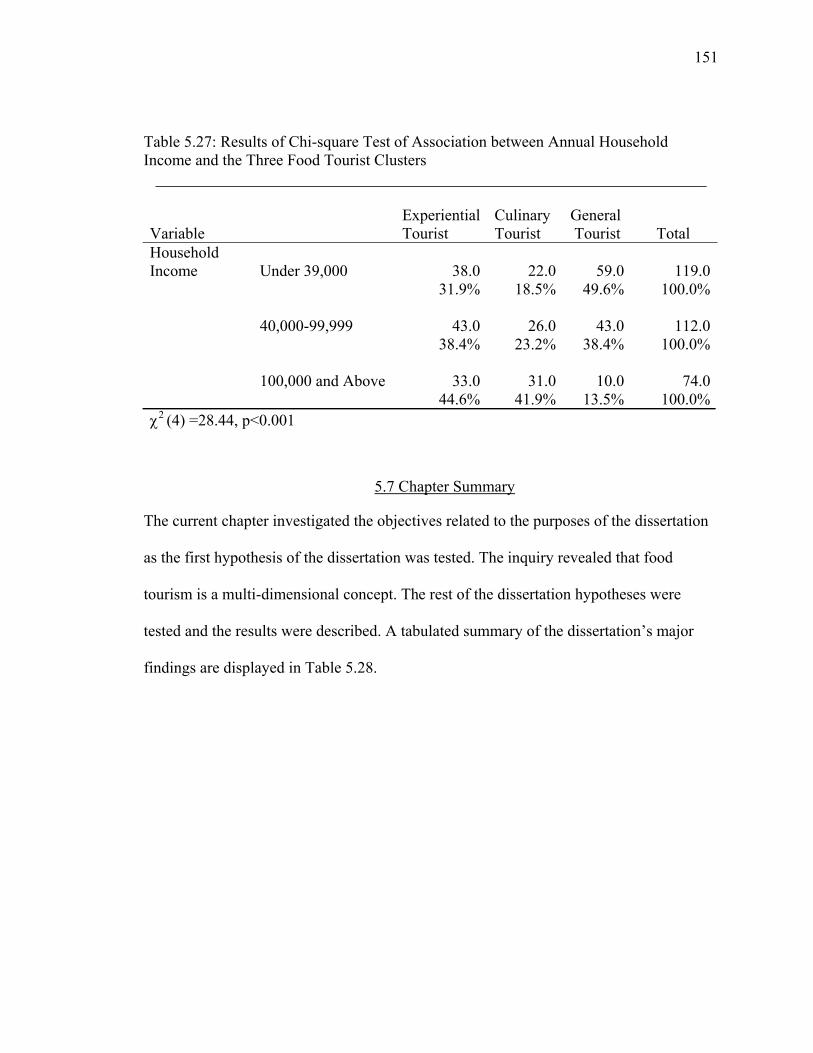
151
Table 5.27: Results of Chi-square Test of Association between Annual Household Income and the Three Food Tourist Clusters
_____________________________________________________________________
Variable Experiential Tourist
Culinary Tourist
General Tourist Total
Household Income Under 39,000 38.0 22.0 59.0 119.0 31.9% 18.5% 49.6% 100.0%
40,000-99,999 43.0 26.0 43.0 112.0
38.4% 23.2% 38.4% 100.0%
100,000 and Above 33.0 31.0 10.0 74.0
44.6% 41.9% 13.5% 100.0%%2
(4) =28.44, p<0.001
5.7 Chapter Summary
The current chapter investigated the objectives related to the purposes of the dissertation
as the first hypothesis of the dissertation was tested. The inquiry revealed that food
tourism is a multi-dimensional concept. The rest of the dissertation hypotheses were
tested and the results were described. A tabulated summary of the dissertation’s major
findings are displayed in Table 5.28.
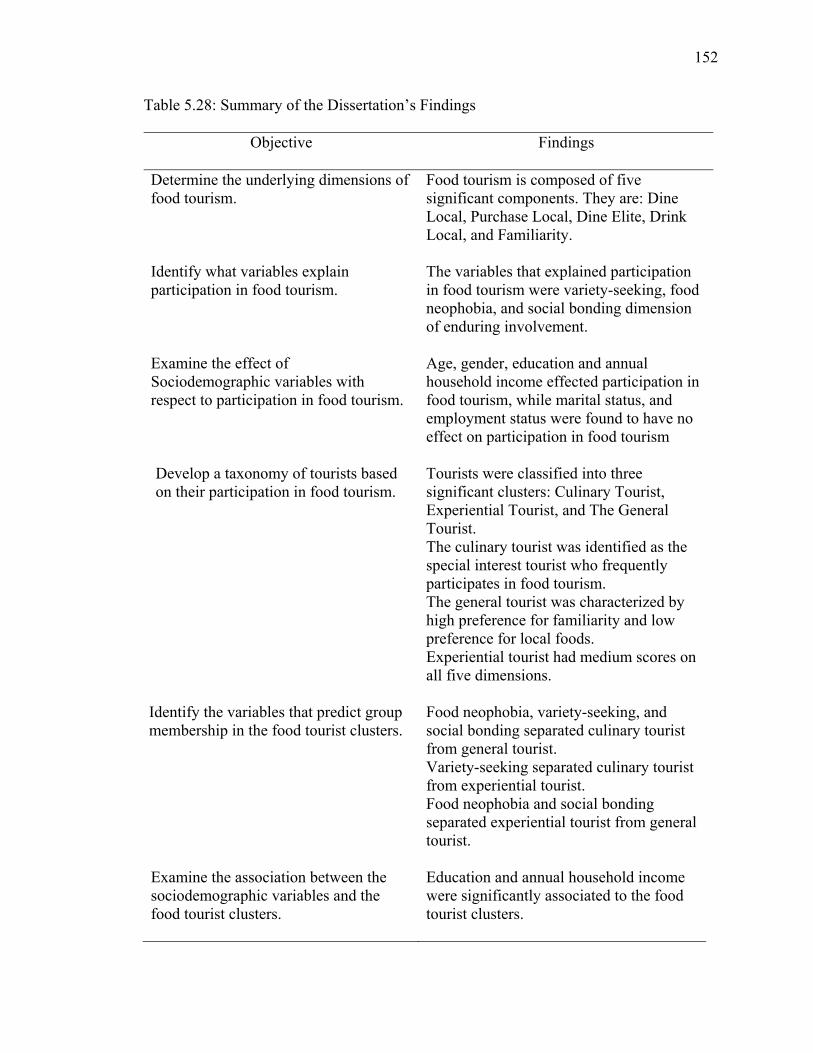
152
Table 5.28: Summary of the Dissertation’s Findings
Objective Findings
Determine the underlying dimensions of food tourism.
Food tourism is composed of five significant components. They are: Dine Local, Purchase Local, Dine Elite, Drink Local, and Familiarity.
Identify what variables explain participation in food tourism.
The variables that explained participation in food tourism were variety-seeking, food neophobia, and social bonding dimension of enduring involvement.
Examine the effect of Sociodemographic variables with respect to participation in food tourism.
Age, gender, education and annual household income effected participation in food tourism, while marital status, and employment status were found to have no effect on participation in food tourism
Develop a taxonomy of tourists based on their participation in food tourism.
Tourists were classified into three significant clusters: Culinary Tourist, Experiential Tourist, and The General Tourist. The culinary tourist was identified as the special interest tourist who frequently participates in food tourism. The general tourist was characterized by high preference for familiarity and low preference for local foods. Experiential tourist had medium scores on all five dimensions.
Identify the variables that predict group membership in the food tourist clusters.
Food neophobia, variety-seeking, and social bonding separated culinary tourist from general tourist. Variety-seeking separated culinary tourist from experiential tourist. Food neophobia and social bonding separated experiential tourist from general tourist.
Examine the association between the sociodemographic variables and the food tourist clusters.
Education and annual household income were significantly associated to the food tourist clusters.
CHAPTER SIX
6. CONCLUSIONS AND IMPLICATIONS
This chapter is divided into three sections. In the first section, the hypotheses
presented in Chapter Three are reviewed in relation to dissertation results. The second
section discusses the theoretical and practical implications of the findings. Finally, based
on the findings of the dissertation, recommendations are made for future research in food
tourism.
6.1 Review of the Findings
The purpose of the dissertation was to gain an understanding of food tourism and
empirically identify the special interest tourist for whom food is an important part of the
travel experience. Due to lack of previous empirical evidence on what activities
constitute food tourism, one of the objectives of this dissertation was to identify those
activities. This dissertation identified the activities that comprise food tourism and its
underlying dimensions. Further, the tourists were segmented based on their participation
in food tourism and the characteristics of the culinary tourist were identified.
Based on the literature review, the concepts that are associated with food tourism
were delineated and a conceptual model was constructed for identifying the variables that
explain participation in food tourism. The significance of variety- seeking, food
neophobia, hedonism, and enduring involvement in explaining food tourism were tested.
The significance of these variables in predicting membership in the food tourist clusters
154
was assessed. Finally, the role of sociodemographic status in food tourism was
investigated. The effect of these variables on participation in food tourism was examined
and the association between sociodemographic variables and the food tourist clusters was
also tested. Research results generally supported the proposed relationships.
Food Tourism and its Underlying Dimensions
The first research question of the study (RQ 1) was: what are the underlying
dimensions of food tourism? Review of the prior literature (Hall & Mitchell, 2001; Hall
& Sharples, 2004; Long, 1998; Shortridge, 2004) resulted in the proposition that food
tourism is composed of different classes of activities. This proposition was restated as a
testable null hypothesis (H1:1a) that food tourism is not composed of multiple
dimensions. Results of the factor analysis revealed that food tourism consists of five
significant dimensions. These dimensions were labeled as follows: 1) Dine Local, 2)
Purchase Local, 3) Dine Elite, 4) Drink Local, and 5) Familiarity.
The emergence of eating local cuisines at local restaurants (Dine Local) as the
most important part of food tourism dimension confirms the proposition put forth by
Zelinsky (1985), Long (1998), Hall and Mitchell (2001), and Hall and Sharples (2003)
that eating at local and ethnic restaurants is what epitomizes food tourism and is
representative of the cultural and regional ‘Other’ (Long, 2004).
In addition, Long’s (1998, 2004) premise that consumption of the socio-economic
‘Other’ is a part of food tourism experience finds empirical support in the current
investigation with the appearance of Dine Elite as a factor of food tourism. Purchasing
local food and food related products (Purchase Local) as a category of activities that
comprise food tourism validates Shortridge’s (2004) analysis of tourism in ethnic towns,
155
where buying the ethnic food products, spices, and utensils are an important part of the
food tourism experience.
Though not supported by food tourism literature per se, and seen as an altogether
different niche-market of wine tourism in the literature (Charters & Ali-Knight, 2002;
Mitchell, Hall, & McIntosh, 2000), drinking local beverages emerged as a food tourism
dimension. The emergence of the dimension Drink Local is a reflection of what the
tourists stated as a part of their food tourism experience during the course of pilot studies.
The results suggest that for most tourists, experiencing food and drinks make ideal
cohorts, and these two are not seen as separate entities. Thus, local beverages are as much
a part of food tourism experience as the local food.
Finally, eating familiar food and dining at familiar places emerged as a category
of food tourism. The factor Familiarity correlated negatively with all other factors,
implying that it is not a category representative of food tourism as defined by this
dissertation. This dimension denotes a class of food related activities that fall at the polar
end of the ‘exotic’ of the food consumption continuum that ranges from the exotic to the
familiar as suggested by Long (2004). Thus, the emergence of five dimensions of food
tourism resulted in the rejection of null hypothesis (H1:1a) that food tourism is not
composed of multiple significant factors or components.
The Conceptual Framework: Variables Explaining Participation in Food Tourism
The second research question (RQ 2) was: what variables explain participation in
food tourism? Review of the literature revealed the five relevant concepts. These were
food neophobia, variety-seeking tendency, hedonic consumption attitude (hedonism and
utilitarian), and enduring involvement (social bonding, centrality, and identity
156
expression). Subsequently, five propositions were developed and restated as a set of five
testable hypotheses. This set of hypotheses was concerned with examining the
relationship between five conceptual variables and participation in food tourism. Since
food tourism emerged as multi-dimensional, the relationships were tested for each of the
dimensions and the predictor variables.
Food neophobia’s relevance in explaining participation in food tourism, as
revealed by the literature (Cohen & Avieli, 2004; Mitchell & Hall, 2003; Pilcher, 2004;
Mc Andrews, 2004) resulted in the proposition that food neophobia is negatively related
to food tourism. This proposition was restated as a testable null hypothesis (H 2:1a) that
food neophobia is not related to any of the dimensions of food tourism. Results of the
multiple regression analysis revealed that food neophobia was found to be negatively
related to the factors Dine Local, Drink Local, and positively related to the dimension
Familiarity. This implies that the fear of novel foods makes the tourist less likely to dine
at restaurants serving local cuisines and consume local beverages. In addition, this
confirms the crucial role of food neophobia as an impediment for local food to gain the
status of tourist attraction (Cohen & Avieli, 2004). In addition, food neophobia’s positive
relationship with consuming the tried and the tested at familiar eating outlets such as
chain restaurants validates the common tourism proposition that there is a wariness of the
unknown among those averse to novelty (Crompton, 1979; Lee and Crompton, 1992).
Thus, food neophobia was identified as statistically significant in explaining food
tourism, resulting in the rejection of the null hypothesis (H 2:1a) that food neophobia is
not related to any of the dimensions of food tourism.
157
Variety-seeking tendency was the second concept that the literature review
revealed as relevant in explaining participation in food tourism (Molz, 2004; Nield,
Kozak & LeGrys, 2000; Reynolds, 1993; Shortridge, 2004). This resulted in the
proposition that variety-seeking tendency is positively related to food tourism, which was
restated as a testable null hypothesis (H2:2a) that variety-seeking tendency is not related
to any of the dimensions of food tourism. Results of the multiple regression revealed that
variety-seeking tendency was positively related to the factors Dine Local, Purchase
Local, and Drink Local. This implies that tourists with a higher variety-seeking tendency
towards food are more likely to consume local cuisines and local beverages and purchase
local food products and food related paraphernalia. Variety-seeking tendency as a form of
cultural experimentation was thus significant in explaining participation in food tourism,
corroborating the findings of Molz (2004), Nield et al. (2000), and Reynolds (1993).
Thus, the null hypothesis (H2:2a) that variety-seeking tendency is not related to any of
the dimensions of food tourism, was rejected.
Based on propositions set forth by Boniface (2003), Long (2004), Mitchell and
Hall (2003), Quan and Wang (2003), and Telfer and Hashimoto (2003) that tourists who
have hedonic attitudes towards food would be more interested in the local cuisines of a
destination and would consider these a tourist attraction resulted in the proposition that
hedonic consumption attitudes towards food is positively related to food tourism. This
proposition was restated as the null hypothesis (H 2:3a) that hedonic consumption
attitude towards food is not related to any dimensions of food tourism. The results of the
multiple regression analysis, however, failed to provide any empirical support to the
literature by the absence of significant relationship between hedonic consumption attitude
158
(both the dimensions- hedonism and utilitarian) and any of the dimensions of food
tourism. This resulted in failing to reject the null hypothesis (H 2: 3a) that hedonic
consumption attitude towards food is not related to any dimensions of food tourism.
The fourth relevant concept explaining participation in food tourism as revealed
by the literature review was enduring involvement with food-related activities studies
(Mitchell & Hall, 2003; Long, 2004; Molz, 2004; Sharples, 2003; Wilson, 2004). This
resulted in the proposition that enduring involvement with food related activities is
positively related to food tourism, which was restated as a testable null hypothesis ( H2:
4a) that enduring involvement with food related activities is not related to any of the
dimensions of food tourism. Three dimensions represented enduring involvement: social
bonding, centrality, and identity expression.
The results of the multiple regression analysis revealed that enduring involvement
showed a significant relationship with food tourism. Social bonding showed a significant
positive relationship with the dimensions Dine Local, Purchase Local, and Dine Elite.
Identity expression revealed a significant positive relationship with the dimension Drink
Local. These two relationships support Long (2004), Molz (2004) and Wilson’s (2004)
proposition that tourists who are attracted to food as a social resource, and use food as a
means to express to the world who they are, are more likely to be interested in food
related activities at the destination. Dining at restaurants that serve distinctive cuisines,
purchasing local food products to take back home are all activities that form topic for
conversations among culinary tourists and consequently a means to bond with people
who share similar interest in food. Likewise, dining at high-class restaurants is a means of
binding the in-group from the out-group.
159
Further, the dimension centrality did not show any significance in explaining food
tourism. The central role of food and the activities related to food such as watching
cooking shows, collecting recipes and the like, was posited as an important predictor in
many studies (Mitchell & Hall, 2003; Long, 2004; Sharples, 2003), but was not
corroborated empirically by the dissertation. However, since the other two dimensions of
enduring involvement showed significant relationship with food tourism, enduring
involvement was considered significant in explaining participation in food tourism. Thus,
the null hypothesis (H 2: 4a) stating that enduring involvement with food related
activities is not related to any of the dimensions of food tourism, was rejected.
Sociodemographic Variables and Participation in Food Tourism
The third research question was concerned with the influence of
sociodemographic variables with respect to participation in food tourism. The
sociodemographic variables were age, gender, education, marital status, employment
status, and annual household income. The research question (RQ 3) was: are there any
differences in participation in food tourism with respect to age, gender, marital status,
occupation, education, and annual income? The review of pertinent literature resulted in
the proposition that sociodemographic variables influence participation in food tourism.
This proposition was restated as testable hypotheses for each of the sociodemographic
variables, thus resulting in set of six null and alternate hypotheses. The results of the
MANOVA revealed that age, gender, education, and income demonstrate significant
differences in participation in food tourism.
With respect to the variable age, significant differences were found for the
dimensions Drink Local and Familiarity, and no significant differences for Dine Elite,
160
Purchase Local and Dine Local. The significant differences for the dimension Drink
Local supports the findings from wine tourism studies (Williams & Dossa, 2001;
Carmichael, 2001), which have found evidence of predominantly young wine tourists.
The likelihood of older tourists participating in activities that involve eating the familiar
food at familiar places (Familiarity dimension) implies that in general younger people are
more adventurous and more exposed to foods and cuisines from around the world. These
findings are compatible to Warde and Martens’ (2000) findings that younger people dine
at ethnic restaurants more often than older people do and comparable to Pliner and
Hobden’s (1992) findings that older people are more food neophobic. However, the
absence of significant differences in the dimensions Dine Local, Dine Elite, and Purchase
Local with respect to age fails to support McCracken and Brandt’s (1987) findings of
strong association between age and dining out. Despite the mixed results, these findings
resulted in the rejection of the null hypothesis (H 3:1a) that there is no significant
difference in tourists’ participation in any of the dimensions of food tourism with respect
to age.
The testing of the null hypothesis H3:2a (there are no significant differences in
tourists’ participation in any of the dimensions of food tourism with respect to gender)
revealed differences on the dimension Purchase Local. The results showed that female
tourists are more likely than male tourists to purchase food products and food related
paraphernalia such as kitchen equipments. Previous studies have demonstrated empirical
evidence of gender differences in wine tourism studies (William & Dossa, 2001) where a
typical wine tourist is male, but the results of this dissertation do not show gender
differences with respect to a comparable variable: the Drink Local dimension of food
161
tourism. Further, there were no significant differences for the other dimensions of food
tourism. Since gender revealed a significant effect on participation in one of the
dimensions of food tourism, the null hypothesis H 3: 2a was rejected.
With respect to education, the findings illustrate significant differences in the
means for all the dimensions, with the exception of Purchase Local. The results revealed
that tourists with higher education level were more likely to participate in three
dimensions of food tourism– Dine Local, Drink Local, and Dine Elite – and less likely to
eat familiar food or frequent familiar dining places (Familiarity dimension). Collectively
these results confirm the previous findings of the significance of education and dining out
(McCracken & Brandt, 1987; Warde & Martens, 2000; Williams & Dossa, 2001;
Carmichael, 2001; Charters & Knight, 2002). This resulted in the rejection of the null
hypothesis (H 3:3a) that there are no significant differences in tourists’ participation in
any of the dimensions of food tourism with respect to education.
Marital status did not show any significant effect on participation in food tourism.
Though the tourism literature does not show any evidence of differences with respect to
marital status and food consumption, there have been rare evidences of differences in
studies pertinent to dining out, which show that married people dine out more often than
single people do (Smallwood et al., 1991). However, the results of this dissertation do not
support these claims. This resulted in the failure to reject the null hypothesis H 3:4a
(there are no significant differences in tourists’ participation in any of the dimensions of
food tourism with respect to marital status).
Similarly, the variable employment status was found to have no significance with
respect to participation in food tourism. This result does not support the hypothesized
162
significance of employment status that was extrapolated from wine tourism studies,
which showed that tourists belonging to the professional or managerial class are more
likely to be wine tourists (Carmichael, 2001; Charters & Knight, 2002; Dodd and Bigotte,
1997; William & Dossa, 2001). This resulted in the failure to reject the null hypothesis H
3:5a, which states that there are no significant differences in tourists’ participation in any
of the dimensions of food tourism with respect to employment status.
Lastly, with respect to the annual household income, the findings demonstrate
significant differences in the means of all the dimensions, with the exception of the
dimension Purchase Local. The results also revealed that tourists with a higher annual
income are more likely to dine at high-class restaurants (Dine Elite) and consume local
drinks and beverages (Drink Local), while tourists with lower income are less likely to
experience the local food (Dine Local), and inclined to eat at familiar food at familiar
restaurants (Familiarity). These results are similar to the findings of McCracken and
Brandt (1987), Erickson (1999) Warde, Martens and Olsen (1999), Warde and Martens
(2000), Carmichael (2001), and Charters and Knight (2002). Since annual income
showed a significant effect on food tourism, the null hypothesis (H 3:6a) that there are no
significant differences in tourists’ participation in any of the dimensions of food tourism
with respect to annual income, was rejected.
Taxonomy of Tourists Based on their Participation in Food Tourism
The fourth objective of the dissertation was concerned with developing taxonomy
of food tourists. The research question (RQ 4) formulated to meet that objective was: can
tourists be segmented into homogenous groups based on their participation in food
tourism? Review of the literature (Hall & Sharples, 2003) resulted in the proposition that
163
tourists can be classified into homogenous group based on their participation in food
tourism. This proposition was restated into a testable null hypothesis (H4:1a) that tourists
cannot be segmented into homogenous clusters based on their participation in food
tourism.
As to the findings, the results of the cluster analysis revealed that tourists could be
segmented into three homogenous groups. These clusters were labeled as: 1) Culinary
tourist, 2) Experiential tourist, and 3) General tourist, based on their intensity of
participation in each of the categories of food tourism. The culinary tourist’s low
frequency of participation in activities that symbolize ‘familiarity’ and high frequency of
participation that involve consuming the local, makes him special interest tourist on the
‘tourism interest continuum’ (Brotherton & Himmetoglu, 1997). In addition, the cluster
labeled experiential tourist was inclined to participate in food tourism sometimes,
showing a medium score on all the dimensions of food tourism. The cluster labeled
general tourist rarely participated in food tourism, showing a high preference for the
familiar.
The presence of a special interest group, extrapolated by the intensity of
participation in food tourism was identified, and provided empirical support to not only
the dissertation’s hypothesis, but also to the idea set forth by Hall and Sharples (2003)
about the presence of such type of special interest tourists. Thus, the presence of three
significant clusters of food tourists resulted in the rejection of null hypothesis (H4:1a)
that tourists cannot be segmented into homogenous clusters based on their participation in
food tourism.
164
Predicting Membership in the Food Tourist Clusters
The fifth research question (RQ 5) was: what variables predict membership in
each of the food tourist clusters (arrived as a result of the classification of tourists based
on their participation in food tourism)? As stated earlier, the review of literature revealed
the significance of five concepts. Subsequently, five propositions were developed and
restated as a set of five testable hypotheses. This set of hypotheses was concerned with
identifying the variables that predict membership in the food tourist clusters. The
independent variables were food neophobia, variety-seeking tendency, hedonic
consumption attitude, and enduring involvement with activities related to food. The
dependent variables were three food tourist clusters: Culinary tourist, Experiential tourist,
and General tourist.
Food neophobia, variety-seeking tendency and the social bonding dimension of
enduring involvement were significant predictors for the three clusters.
Food neophobia was identified as a significant variable that reliably separates the
Culinary Tourist from the General Tourist, and also the Experiential Tourist from the.
General Tourist. The results demonstrate that higher the food neophobia, more likely that
the tourist would belong to the general tourist cluster. This is not surprising as the general
tourist is characterized by high preference for the familiar, and a low preference for the
local food. These results corroborate Cohen and Avieli (2004), and Hall and Mitchell’s
(2004) proposition that culinary tourists are characterized by absence of food neophobia.
The significance of food neophobia in predicting cluster membership resulted in the
rejection of the null hypothesis (H 5:1a), which states that food neophobia does not
predict membership in any of the food tourist segments.
165
Variety-seeking tendency was identified as a significant variable in reliably
separating culinary tourist from the general tourist, and the experiential tourist from the
culinary tourist. The results suggest that the higher the variety-seeking tendency, more
likely that the tourist belongs to the culinary tourist cluster, and provide empirical support
to Molz’s (2004) and Kirshenblatt-Gimblett’s (2004) suggestion that culinary tourist is
characterized by variety-seeking. Since variety-seeking was significant in predicting
cluster membership, the null hypothesis H 5:2a which states that variety-seeking
tendency does not predict membership in any of the food tourist segments, was rejected.
Hedonic consumption attitude toward food did not predict membership to any of
the food tourist clusters. Even though literature suggested the relevance of hedonic
attitudes towards food as a precursor to the growing importance of food in travel and its
role as a tourist attraction among culinary tourists (Boniface, 2003; Long 2004; Mitchell
and Hall, 2003; Quan and Wang, 2003), it did not find any empirical support in this
dissertation. The absence of significance of hedonic consumption attitude may be
attributed to a possibility of measurement error since it did not predict group membership
in any of the tourist food clusters. This leads to the failure to reject the null hypothesis H
5:3a, which states that hedonic consumption attitude with food-related activities does not
predict membership in any of the food tourist clusters.
Enduring involvement with food-related activities was identified as a significant
predictor of cluster membership. Of the three dimensions of enduring involvement
(centrality, social bonding, and identity expression), social bonding was the only
significant factor predicting cluster membership. Social bonding reliably separated
culinary tourist from the general tourist, and the experiential tourist from the general
166
tourist. This implies that people who take part in activities related to food as a means of
social bonding are more likely to be culinary tourist than the experiential and the general
tourist. Further, neither centrality nor identity expression, the other two dimensions of
involvement, were significant predictors for any of the food tourist clusters. These
findings refute the influence of these two dimensions in explaining food tourism as
suggested by Mitchell and Hall (2003), Long (2004), Sharples (2003), and Wilson
(2004). Overall, enduring involvement was a significant variable in predicting
membership to food tourist clusters. This resulted in the rejection of the null hypothesis
(H 5: 4a), which states that enduring involvement with food-related activities does not
predict membership in any of the food tourist clusters.
Sociodemographic Variables and Food Tourist Clusters
The sixth research question was concerned with the association of
sociodemographic variables and the food tourist clusters. The research question (RQ 6)
was: is there any association between the food tourist clusters and age, gender, marital
status, occupation, education, and annual income? As stated earlier, the review of
pertinent literature resulted in the proposition that sociodemographic variables influence
participation in food tourism. This proposition was restated as six testable hypotheses for
each of the sociodemographic variables, thus resulting in set of six null and alternate
hypotheses. The chi-square tests of association revealed significant association between
the three food tourist clusters and education, and between the three food tourist clusters
and annual household income.
In short, the culinary tourist was more educated and had a higher income. The
findings are compatible with the findings of Carmichael (2001), Charters and Knight
167
(2002), Erickson (1999), McCracken and Brandt (1987), Warde, Martens and Olsen
(1999), Warde and Martens (2000), and Williams and Dossa (2001), confirming the
importance of education and income as the two significant variables with respect to
characterizing special interest tourists. These results led to the rejection of the null
hypothesis H6: 3a (There is no significant association between the food tourist clusters
and education level of the tourists), and the null hypothesis H6: 6a (There is no
significant association between the food tourist clusters and annual household income of
the tourists).
The rest of the sociodemographic variables, namely, age, gender, marital status,
and employment status did not show any significant association with the three clusters.
The lack of association between age and the clusters does not support the findings from
wine tourism studies (Williams & Dossa, 2001; Carmichael, 2001), which demonstrated
that wine tourists being characterized by relatively younger people. This lead to the
failure to reject the null hypothesis H6:1a, which states there is no significant association
between the food tourist clusters and the age of the tourists. Similarly, employment status
as a sociodemographic variable did not show any significant association with the three
food tourist clusters. This result is inconsistent with the findings from wine tourism
studies (Carmichael, 2001; Charters & Knight, 2002; Dodd and Bigotte, 1997; William &
Dossa, 2001), which showed that wine tourists are more likely to belong to the
professional and managerial class. Thus, the lack of association between the clusters and
employment status lead to the failure to reject hypothesis H6:5a (there is no significant
association between the food tourist clusters and the employment status of the tourists).
168
Finally, gender and marital status did not show any significant association with
the food tourist clusters. Gender’s significance was hypothesized based on William &
Dossa’s (2001) wine tourism study, which demonstrated that a wine tourist is more likely
to be male. However, the lack of association between the clusters and gender lead to the
failure to reject hypothesis H6:2a (there is no significant association between the food
tourist clusters and the gender of the tourists). Similarly, the significance of marital status
was hypothesized based on Smallwood et al.’s (1991) study on dining out, which
demonstrated that married people dine out more often than single people do. The
extrapolation of this finding to food tourism and the food tourist clusters however did not
hold true for this dissertation. Food tourism literature per se, however, does not show any
evidence of marital status as a variable important enough to be tested, and the findings of
this dissertation attest those assumptions. This lead to the failure to reject the null
hypothesis H6:4a (there is no significant association between the food tourist clusters and
the marital status of the tourists).
6.2 Theoretical Implications
The purpose of this dissertation was to explore food tourism and accumulate
empirical evidence to explain this form of tourism. To this purpose, the dissertation first
identified the dimensions or classes of activities that make food tourism. This dissertation
offers operationalization of food tourism based on literature and the pilot studies. The
resulting dimensions of food tourism, which make up the classes of activities that
comprise food tourism, present a concrete empirical context within which past
conceptualization of food tourism may be interpreted. For instance, when Long (1998)
169
states that culinary tourism is “an intentional, exploratory participation in the food ways
of an Other… ”(p.181), it could be interpreted as an intentional exploratory participation
in activities like dining and purchasing local food, consuming local beverages, and dining
at high quality restaurants.
Empirically Grounded Definition of Food Tourism for Future Research
The multi-dimensional structure of food tourism found in the dissertation also
offers guidance for an empirically grounded opertionalizable definition of food tourism:
participation in activities related to food at the destination, which involves dining and
purchasing local food, dining at high quality restaurants, consuming local beverages,
appended by a contrasting low preference for food served at franchisee and chain
establishments.
Thus, the essence of food tourism lies in experiencing the destination’s distinct
culinary culture, food products, and its dining establishments, with specific focus on the
local aspect. At the same time, the presence of Familiarity as a dimension of food tourism
lends credence to the dialectics between the local and the global, as per the globalization
theory (Robertson, 1992, 1995, 1997).
A Revised Conceptual Framework
The conceptual framework that explained food tourism revealed the importance of
food neophobia, variety-seeking, social bonding, and identity expression. Food
neophobia’s crucial role in being a major impediment in experiencing the local food, as
stated by Cohen and Avieli (2004), is verified empirically in this dissertation. The fear of
strange and foreign food explains a tourist’s low participation in classes of activities such
as dining at restaurants serving local food (Dine Local), and experiencing the local
170
beverages (Drink Local). At the same time, food neophobia also explains the preference
for eating at fast-food restaurants, and chain restaurants (Familiarity), where one is
assured of the predictable, making these establishments function as “culinary
environmental bubble” (Cohen & Avieli, 2004, p.775). Furthermore, food neophobia’s
inability to explain participation in activities such as dining at high quality restaurants
(Dine Elite), and purchasing local food products (Purchase Local) reveal that such classes
of activities are not concerned with experiencing the strange and the unknown.
Another concept of importance in food tourism, as revealed by the results, is
variety- seeking tendency towards food. This dissertation empirically demonstrated its
significance, specifically for the classes of activities such as dining at restaurant serving
local food (Dine Local), purchasing local food and food-related products (Purchase
Local), and consuming local beverages (Drink Local). The consumption of local, be it
dining or drinking, is driven by the tendency to experience a diverse range of culinary
cultures, which may not necessarily be novel or strange to the tourists. Ratner, Kahn, and
Kahneman (1999) propose that consumers seek variety among hedonic products and
variety-seeking tendency is driven by the need for optimal stimulation. Extending their
proposition to this dissertation, the significance of variety-seeking tendency in explaining
purchasing local food related products and other culinary paraphernalia at the destination
can be attributed to the optimal stimulation level achieved by tourists as a result of
purchasing new products (Hirschman, 1980; McAlister & Pessemier, 1982). Finally,
variety-seeking tendency’s significance can be attributed to reasons such as the non-
availability of the food the tourist is used to in his daily life, access to more restaurants,
and being exposed to advertisements for new cuisines and restaurants of the destination.
171
Alternatively, it may be sought out as a goal in itself (McAlister & Pessemier, 1982;
VanTrijp & Steenkamp, 1992).
The apparent lack of significance of hedonic attitudes towards food in explaining
food tourism was not expected as per the literature review. Similar to the literature in
consumer behavior which has considered food as a hedonic product (LeBel, 2000; Park,
2004), food researchers have ascribed food with an ability to provide tourist with hedonic
experiences (Boniface, 2000, 2003; Mitchell and Hall, 2003; Quan and Wang, 2004). The
results failed to verify that either the hedonic attitude towards food, or its opposite, the
utilitarian attitude towards food has any significant relationship with food tourism. This
lack of significance could be attributed to a possibility of measurement error.
The concept of enduring involvement showed its significance through the
dimension social bonding and identity expression. The sharing of an interest with like-
minded people in a social world, that extends from home to destination creates an
intimacy (Trauer & Ryan, 2005) while participating in activities such as dining at
restaurants to experience their local food (Dine Local), purchasing local food products to
take back home (Purchase Local), and dining at high-class restaurants (Dine Elite). It also
helps them to express and affirm their identity as people belonging to certain class of
eaters, be it an economic class or a culturally knowledgeable class.
The dimension centrality did not display any significance. The special interest
tourism literature is replete with instances of how the leisure activities that are pursued at
home are also followed while vacationing in the form of niche tourism activities
(Brotherton & Himmetoglu, 1997). Extending that to food tourism, the food and tourism
literature emphasized on the central role of food related activities in the tourist’s life (in
172
the form of food related hobbies such as collecting recipes, watching cooking shows etc.)
as a precursor to food tourism (Long, 2004; Mitchell & Hall, 2003; Sharples, 2003).
However, the dissertation failed to verify the relevance of centrality. Possible reasons for
this could be that food is seen as a cultural resource and activities such as dining local
cuisines and local drinks, purchasing food products, dining at high quality restaurant are
perceived as status symbol to be appreciated while holidaying and in the company of
other people. But, not crucial enough to incorporate those in one’s daily life when one is
not watched by others.
Given these findings, it can be stated that the fundamental structure of food
tourism revolves around the local, and thrives on the ability to provide the tourist with
something new and different, and also in its ability reinforce one’s membership in a
social world that is inhabited by those knowledgeable about food and culture. Figure 6.1
provides the revised diagram of the conceptual model that explains food tourism, based
on the findings.
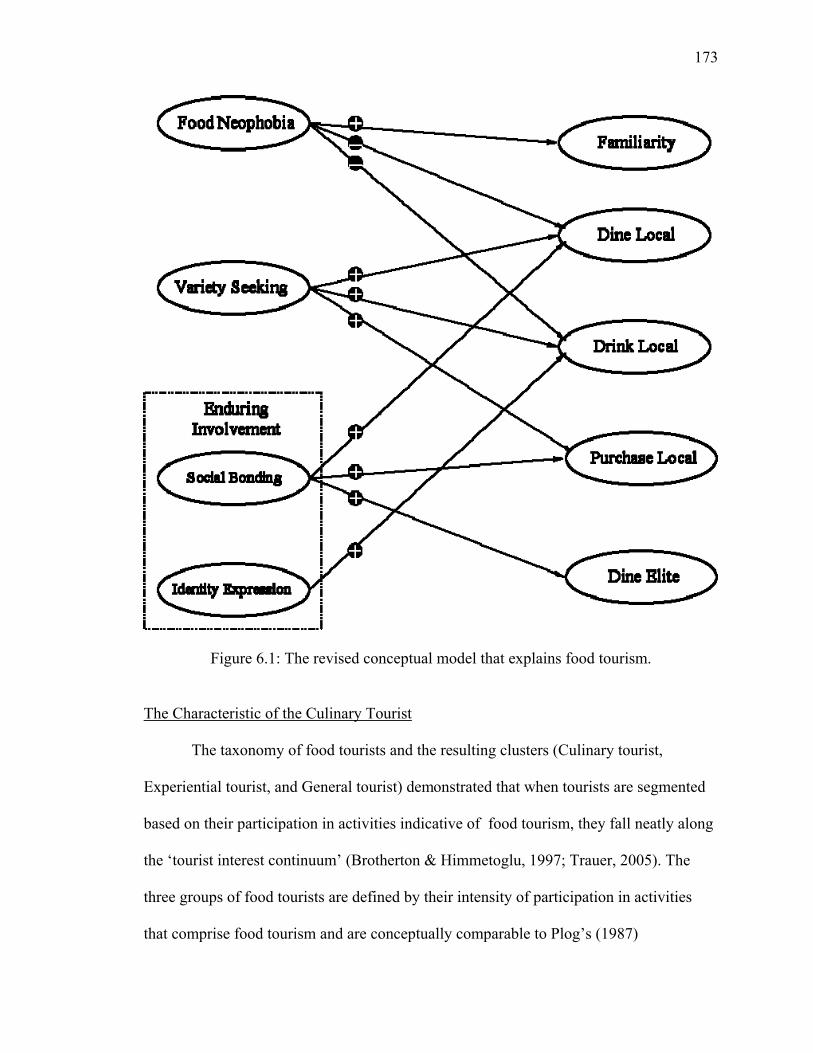
173
Figure 6.1: The revised conceptual model that explains food tourism.
The Characteristic of the Culinary Tourist
The taxonomy of food tourists and the resulting clusters (Culinary tourist,
Experiential tourist, and General tourist) demonstrated that when tourists are segmented
based on their participation in activities indicative of food tourism, they fall neatly along
the ‘tourist interest continuum’ (Brotherton & Himmetoglu, 1997; Trauer, 2005). The
three groups of food tourists are defined by their intensity of participation in activities
that comprise food tourism and are conceptually comparable to Plog’s (1987)
174
psychographic profiling of tourists. While the culinary tourist with his high interest in the
local food has characteristics of the Allocentric tourist, the general tourist with his low
preference for the local and high preference for the familiar has the characteristics of the
Psychocentric tourist.
Further, this result empirically illustrates the presence of a special-interest tourist
segment, namely the culinary tourist, thus offering support to the conceptual claims put
forward by Hall & Sharples (2003) about the existence of a tourist segment with a high
interest in food. Based on the findings of this dissertation, the following empirically
grounded definition of culinary tourist is offered: the tourist who, at the destination
frequently dines and purchases local food, consumes local beverages, dines at high-class
restaurants, and rarely eats at franchisee restaurants. The culinary tourist segment was
identified to be more educated and affluent than the other two segments indicating that
even though this segment is educated /and rich, local dining is preferred over elite dining
while traveling. The membership in this segment was predicted by variety-seeking
tendency, social bonding, and the absence of food neophobia.
Together, these findings lend credence to the dissertation’s employment of
cultural capital theory in explaining the culinary tourist. Culinary tourists seem to possess
the indicators of cultural capital, namely an advanced education, omnivorousness typified
by their variety-seeking tendency, the desire to resist the dominant culture of franchisee
restaurants as seen by their low preference for familiarity, and a high preference for the
local as underscored by the lack of food neophobia (Adema, 2000; Erickson, 1996;
Pietrykowski, 2004; Warde, 2004; Warde, Martens & Olsen, 1999). Furthermore, an
enduring involvement with food related activities characterizes the culinary tourists, and
175
their participation in food tourism is a showcase of their cultural competence and a means
of facilitating social cohesion.
6.3 Practical Implications
The results of this dissertation offer numerous practical suggestions to
destinations and the tourism suppliers looking to develop positioning and marketing
strategies for local foods and cuisines. As stated in Chapter One, in an increasingly
competitive world of tourism marketing, where destinations look for unique selling
propositions in positioning themselves, there is nothing more unique than the foods and
cuisines based on the products of the place.
The dissertation’s results contribute to this end by delineating classes of activities
that comprise food tourism, underscoring the role of diverse culinary establishments that
contribute to the food tourism experience. Local restaurants, high class restaurants, local
pubs, farmer’s markets, shops selling culinary paraphernalia such as utensils, cookbooks,
and even the roadside vendor all form an integral part of the food tourism experience.
This finding highlights the importance of destination marketing organizations and tourist
suppliers working in tandem to prevent any gap between the food tourism images that are
created for the destination, and the tangible food tourism experiences provided by the
small and medium enterprises which form a substantial part of the food tourism
experience providers (Wanhill & Rassing, 2000). The popularity of food trails as a tourist
experience and the feasibility of operating such a well-coordinated set of activities are
substantially dependent on these small local suppliers and producers. Successful
examples of these are the Niagara region, Wales in UK, and the Oregon Tourism Board
176
which recently introduced a tourist brochure with culinary itineraries showcasing its
regional culinary heritage.
In addition to examining the product (food tourism), this dissertation also
examined the consumer or market segment (food tourist clusters). This dual-focus
enables identification of practicable recommendations for destinations looking to
specifically target the culinary tourist segment and promote its indigenous food products.
The results that emerged from the analysis demonstrate that culinary tourism destinations
should either articulate the availability of indigenous local dishes, or lay emphasis on the
availability of variety of culinary cultures and food tourism experiences. Food’s value as
a socializing agent by providing a tourist with opportunities for getting together with
fellow tourists may also be employed as one of the potential attractions to attract this
niche market.
The implications of this dissertation to the local food producers should not go
unmentioned. The demand for the indigenous food products and cuisine systems is
encouraging to peripheral communities. The benefits to the food producers in terms of the
backward economic linkages provided by the growth of niche market of culinary tourist
are very important to sustain such communities. Especially since many of these are
fighting a losing battle against the onslaught of powerful multinational food corporations.
As previously mentioned in Chapter One, this study was commissioned by
Southern Seafood Alliance to examine ways and means to keep the South Atlantic wild-
caught shrimp industry alive from the imported cheaper shrimp. The study, by
demonstrating the existence of a culinary tourist segment and identifying the key
characteristics of the same, makes an effort to offering a solution. For instance, the
177
variety of experiences that the culinary tourist segment demands makes it imperative that
the Southern Seafood Alliance develop collaborative ties with other providers of food
related services. Furthermore, the finding that the culinary tourist is economically well-
off bodes well for the more expensive indigenous shrimp which is currently under
onslaught from the cheaper imported shrimp.
6.4 Limitations
This dissertation was a preliminary attempt to gain empirically based in-depth
understanding of food tourism, the classes of activities that make up food tourism as
revealed by its underlying dimensions, the variables that explain food tourism, and the
characteristics of the food tourist segments. The investigation has been exploratory in
nature and has the limitations concomitant to any exploratory study. This is true
specifically with respect to testing the relationships between the independent variables
and the dimensions of food tourism. As there was no apriori empirical information about
the classes of activities that make food tourism, there was no way to hypothesize about
the nature of relationships with such specificities. However, this dissertation developed a
parsimonious conceptual framework to capture some of the key drivers of food tourism.
As stated in Chapter One, the dissertation specifically dealt with the typical South
Carolina coastal tourist, and the culinary experiences he seeks. This was particularly
evident in the operationalization of food tourism. The activities that were indicators of
food tourism during the course of the pilot studies, such as attending a cooking school,
had to be discarded for the current investigation because of extremely low responses,
which resulted in skewness of such items. Thus, further research is necessary in order to
178
determine what dimensions of food tourism activities such items capture by testing the
survey on visitors to destinations with a reputation for culinary tourism.
As with any empirical generalization, the translation from theory to practice must
be done cautiously factoring in the limitations that this dissertation assumed. The
conceptual framework could be applied as a decision-support tool, but keeping in mind
the directional impact of the interaction of the relevant measurement variables, which
could be unique to every destination. Charleston cannot compete with New York as each
brings in it its own culinary resources. While the former’s strength lies in seafood and
Southern culinary heritage, the latter’s strength lies in the sheer variety of culinary
cultures it provides.
Finally, the dissertation is limited by its cultural relativity. Activities such as
eating at franchisee restaurants and eating at chain restaurants, which are representative
of food tourism, have been categorized as classes of activities that denote familiarity.
However, these activities might not be considered as activities that denote familiarity for
a non-American population. Profile of food tourists in one region cannot be not
automatically assumed to be the same as another.
6.5 Recommendations for Future Research
To use a metaphor, the results of the current investigation are just the tip of the
iceberg. The field is charged with possibilities. Not only food tourism, but also the niche
market of culinary tourism offer possibilities galore for investigation.
With respect to conceptual development, future research may look into the role of
various tourism and leisure concepts and their influence in explaining food tourism and
179
the culinary tourist. The role of tourist motivational factors such as the ‘push’ and ‘pull’
factors in food tourism is one such area. Knowing the relative importance of one’s
intrinsic motivation to that of the destination’s attribute would contribute to further
understanding of culinary tourists. Another area of research may be the role of leisure
specialization in explaining the special interest market of culinary tourism. This concept
has been used to explain intensity of participation in leisure activities and application of
this concept could explain the different intensity of participation in food tourism.
Further, the role of authenticity in food tourism is another area that offers
possibilities for extensive research. Also, with the variable hedonic attitude towards food
not being significant enough to explain food tourism, it would be interesting to find out if
a parallel variable such as sensation seeking may be an ideal replacement to explain
participation in food tourism.
With respect to testing a theory, the ideal theory would be the cultural capital
theory, as seen from the dissertation results. The results of this dissertation show that the
operationalization of cultural capital in terms of variety-seeking and the social bonding
and identity expression dimensions of involvement does seem a feasible and conceptually
sound empirical exercise (Warde, Martens & Olsen, 1999; Peterson, 1996). Similar to
this dissertation, future research in food tourism may operationalize cultural capital with
respect to food consumption, with variety-seeking, food neophobia, and enduring
involvement as indicator variables.
In conclusion, the current investigation was an attempt to build theoretical and
conceptual foundations for studying food tourism and empirically establish the
characteristics of the culinary tourist. This dissertation has contributed to that end.

180

APPENDICES
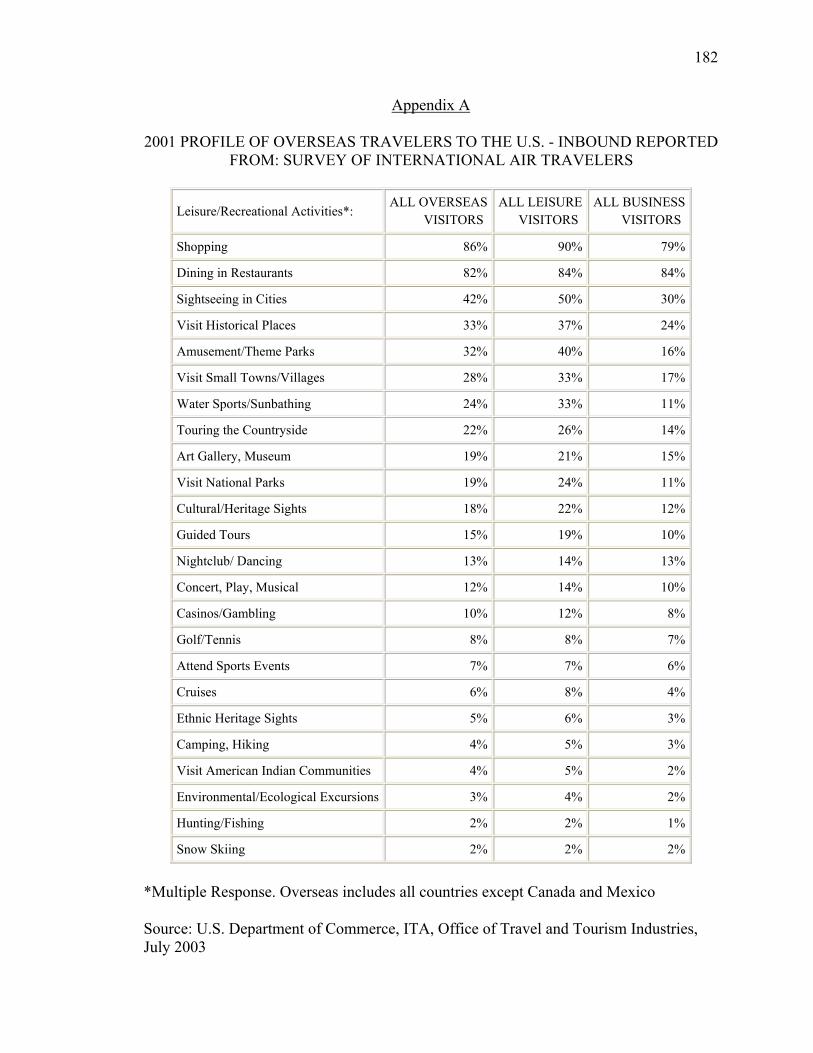
182
Appendix A
2001 PROFILE OF OVERSEAS TRAVELERS TO THE U.S. - INBOUND REPORTED FROM: SURVEY OF INTERNATIONAL AIR TRAVELERS
Leisure/Recreational Activities*: ALL OVERSEASVISITORS
ALL LEISURE VISITORS
ALL BUSINESSVISITORS
Shopping 86% 90% 79%
Dining in Restaurants 82% 84% 84%
Sightseeing in Cities 42% 50% 30%
Visit Historical Places 33% 37% 24%
Amusement/Theme Parks 32% 40% 16%
Visit Small Towns/Villages 28% 33% 17%
Water Sports/Sunbathing 24% 33% 11%
Touring the Countryside 22% 26% 14%
Art Gallery, Museum 19% 21% 15%
Visit National Parks 19% 24% 11%
Cultural/Heritage Sights 18% 22% 12%
Guided Tours 15% 19% 10%
Nightclub/ Dancing 13% 14% 13%
Concert, Play, Musical 12% 14% 10%
Casinos/Gambling 10% 12% 8%
Golf/Tennis 8% 8% 7%
Attend Sports Events 7% 7% 6%
Cruises 6% 8% 4%
Ethnic Heritage Sights 5% 6% 3%
Camping, Hiking 4% 5% 3%
Visit American Indian Communities 4% 5% 2%
Environmental/Ecological Excursions 3% 4% 2%
Hunting/Fishing 2% 2% 1%
Snow Skiing 2% 2% 2%
*Multiple Response. Overseas includes all countries except Canada and Mexico
Source: U.S. Department of Commerce, ITA, Office of Travel and Tourism Industries, July 2003
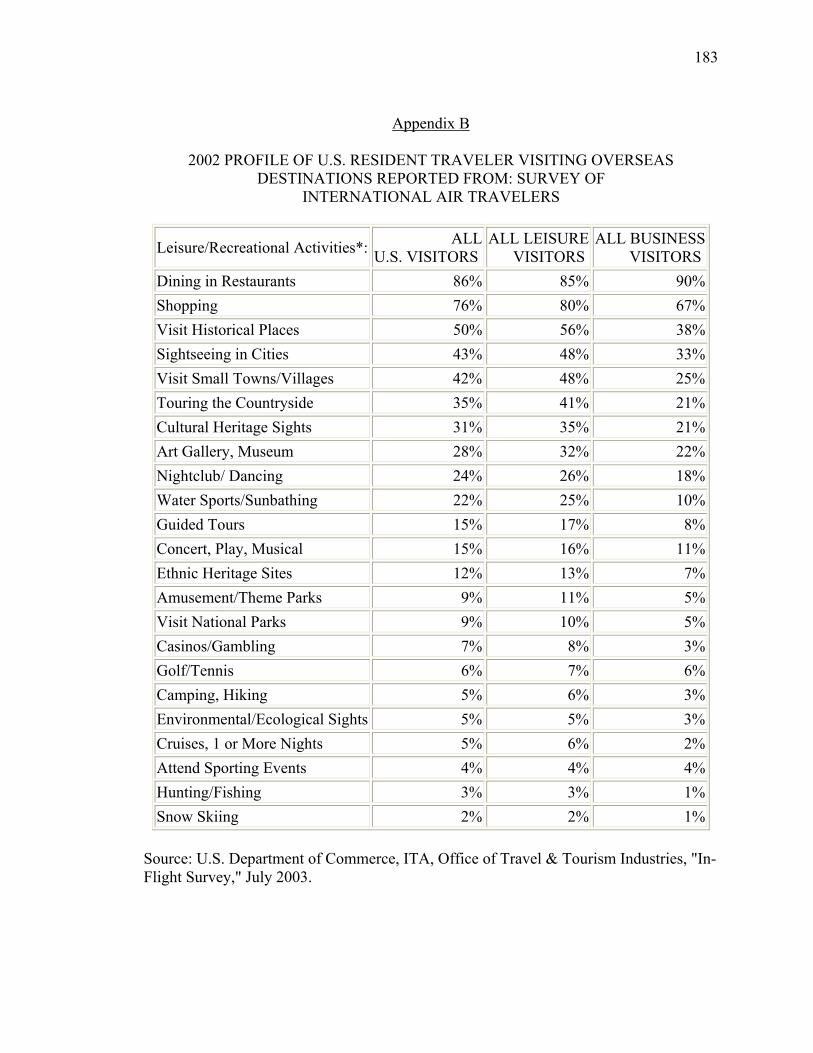
183
Appendix B
2002 PROFILE OF U.S. RESIDENT TRAVELER VISITING OVERSEAS
DESTINATIONS REPORTED FROM: SURVEY OF INTERNATIONAL AIR TRAVELERS
Leisure/Recreational Activities*: ALL U.S. VISITORS
ALL LEISURE VISITORS
ALL BUSINESSVISITORS
Dining in Restaurants 86% 85% 90%Shopping 76% 80% 67%Visit Historical Places 50% 56% 38%Sightseeing in Cities 43% 48% 33%Visit Small Towns/Villages 42% 48% 25%Touring the Countryside 35% 41% 21%Cultural Heritage Sights 31% 35% 21%Art Gallery, Museum 28% 32% 22%Nightclub/ Dancing 24% 26% 18%Water Sports/Sunbathing 22% 25% 10%Guided Tours 15% 17% 8%Concert, Play, Musical 15% 16% 11%Ethnic Heritage Sites 12% 13% 7%Amusement/Theme Parks 9% 11% 5%Visit National Parks 9% 10% 5%Casinos/Gambling 7% 8% 3%Golf/Tennis 6% 7% 6%Camping, Hiking 5% 6% 3%Environmental/Ecological Sights 5% 5% 3%Cruises, 1 or More Nights 5% 6% 2%Attend Sporting Events 4% 4% 4%Hunting/Fishing 3% 3% 1%Snow Skiing 2% 2% 1%
Source: U.S. Department of Commerce, ITA, Office of Travel & Tourism Industries, "In-Flight Survey," July 2003.
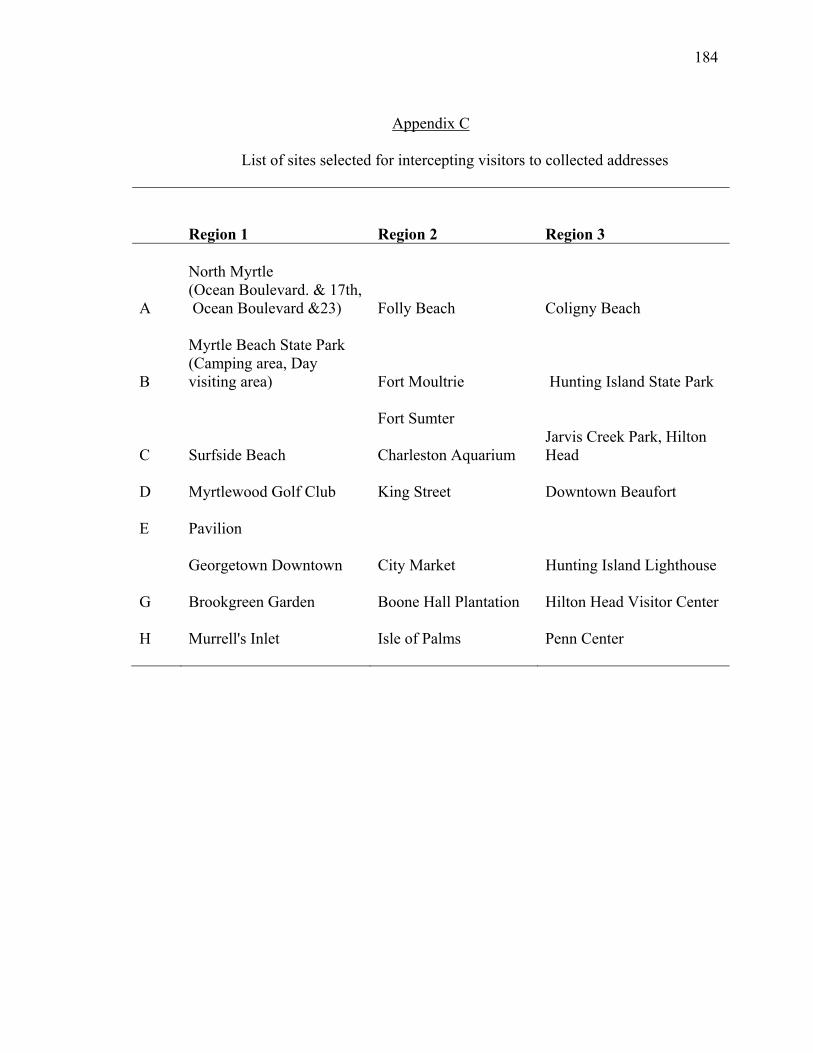
184
Appendix C
List of sites selected for intercepting visitors to collected addresses
Region 1 Region 2
Region 3
A
North Myrtle (Ocean Boulevard. & 17th, Ocean Boulevard &23) Folly Beach Coligny Beach
B
Myrtle Beach State Park (Camping area, Day visiting area) Fort Moultrie Hunting Island State Park
C Surfside Beach
Fort Sumter Charleston Aquarium
Jarvis Creek Park, Hilton Head
D Myrtlewood Golf Club King Street Downtown Beaufort
E
Pavilion Georgetown Downtown City Market Hunting Island Lighthouse
G Brookgreen Garden Boone Hall Plantation Hilton Head Visitor Center
H Murrell's Inlet Isle of Palms Penn Center
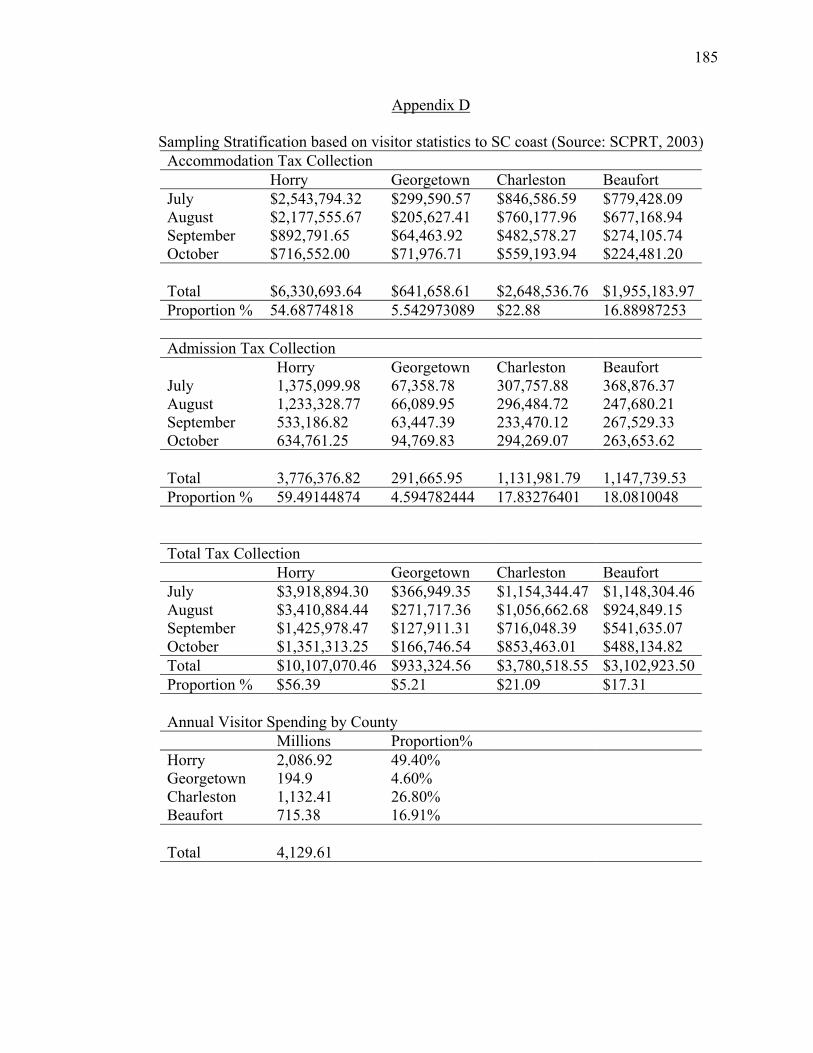
185
Appendix D
Sampling Stratification based on visitor statistics to SC coast (Source: SCPRT, 2003) Accommodation Tax Collection Horry Georgetown Charleston Beaufort July $2,543,794.32 $299,590.57 $846,586.59 $779,428.09 August $2,177,555.67 $205,627.41 $760,177.96 $677,168.94 September $892,791.65 $64,463.92 $482,578.27 $274,105.74 October $716,552.00 $71,976.71 $559,193.94 $224,481.20 Total
$6,330,693.64
$641,658.61
$2,648,536.76
$1,955,183.97
Proportion % 54.68774818 5.542973089 $22.88 16.88987253 Admission Tax Collection Horry Georgetown Charleston Beaufort July 1,375,099.98 67,358.78 307,757.88 368,876.37 August 1,233,328.77 66,089.95 296,484.72 247,680.21 September 533,186.82 63,447.39 233,470.12 267,529.33 October 634,761.25 94,769.83 294,269.07 263,653.62 Total 3,776,376.82 291,665.95 1,131,981.79 1,147,739.53 Proportion % 59.49144874 4.594782444 17.83276401 18.0810048 Total Tax Collection Horry Georgetown Charleston Beaufort July $3,918,894.30 $366,949.35 $1,154,344.47 $1,148,304.46August $3,410,884.44 $271,717.36 $1,056,662.68 $924,849.15 September $1,425,978.47 $127,911.31 $716,048.39 $541,635.07 October $1,351,313.25 $166,746.54 $853,463.01 $488,134.82 Total $10,107,070.46 $933,324.56 $3,780,518.55 $3,102,923.50Proportion % $56.39 $5.21 $21.09 $17.31 Annual Visitor Spending by County Millions Proportion% Horry 2,086.92 49.40% Georgetown 194.9 4.60% Charleston 1,132.41 26.80% Beaufort 715.38 16.91% Total 4,129.61

186
Appendix E
The Main Survey
South Carolina Coastal Tourism Survey 2004
Conducted by
RECREATION, TRAVEL & TOURISM INSTITUTE Department of Parks, Recreation & Tourism Management
Clemson University
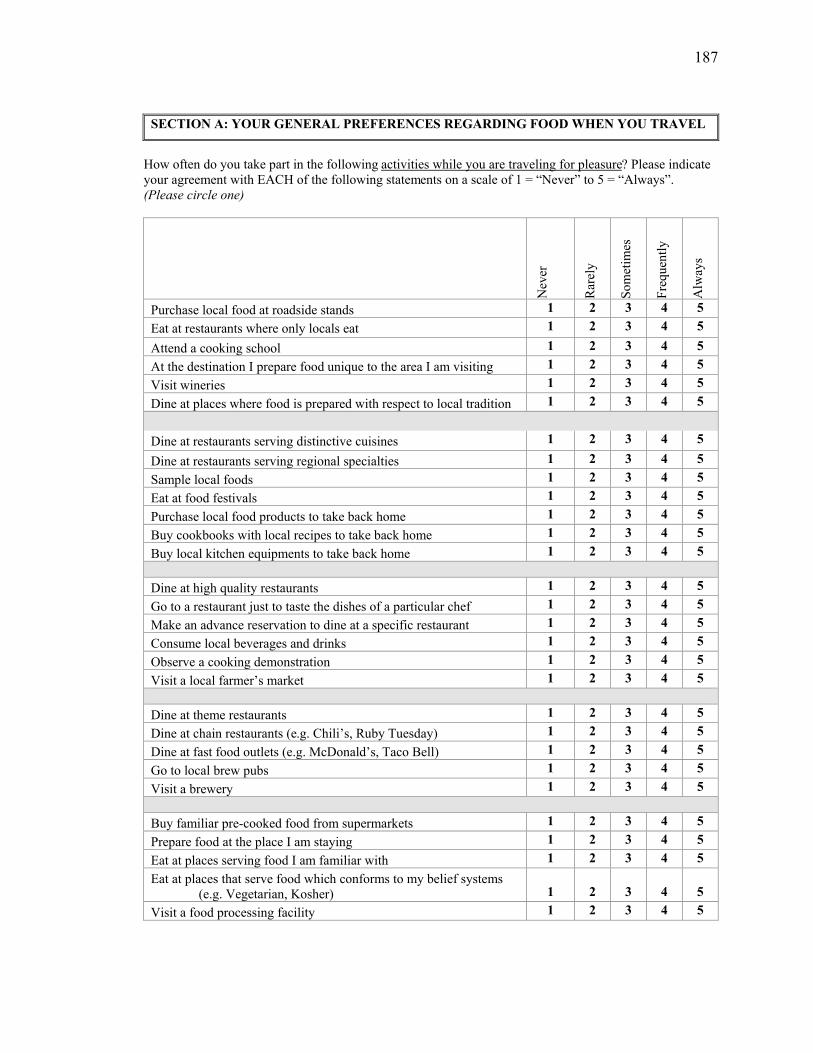
187
SECTION A: YOUR GENERAL PREFERENCES REGARDING FOOD WHEN YOU TRAVEL
How often do you take part in the following activities while you are traveling for pleasure? Please indicate your agreement with EACH of the following statements on a scale of 1 = “Never” to 5 = “Always”. (Please circle one)
Nev
er
Rar
ely
Som
etim
es
Freq
uent
ly
Alw
ays
Purchase local food at roadside stands 1 2 3 4 5 Eat at restaurants where only locals eat 1 2 3 4 5 Attend a cooking school 1 2 3 4 5 At the destination I prepare food unique to the area I am visiting 1 2 3 4 5 Visit wineries 1 2 3 4 5 Dine at places where food is prepared with respect to local tradition 1 2 3 4 5
Dine at restaurants serving distinctive cuisines 1 2 3 4 5
Dine at restaurants serving regional specialties 1 2 3 4 5 Sample local foods 1 2 3 4 5 Eat at food festivals 1 2 3 4 5 Purchase local food products to take back home 1 2 3 4 5 Buy cookbooks with local recipes to take back home 1 2 3 4 5 Buy local kitchen equipments to take back home 1 2 3 4 5
Dine at high quality restaurants 1 2 3 4 5 Go to a restaurant just to taste the dishes of a particular chef 1 2 3 4 5 Make an advance reservation to dine at a specific restaurant 1 2 3 4 5 Consume local beverages and drinks 1 2 3 4 5 Observe a cooking demonstration 1 2 3 4 5 Visit a local farmer’s market 1 2 3 4 5
Dine at theme restaurants 1 2 3 4 5 Dine at chain restaurants (e.g. Chili’s, Ruby Tuesday) 1 2 3 4 5 Dine at fast food outlets (e.g. McDonald’s, Taco Bell) 1 2 3 4 5 Go to local brew pubs 1 2 3 4 5 Visit a brewery 1 2 3 4 5
Buy familiar pre-cooked food from supermarkets 1 2 3 4 5 Prepare food at the place I am staying 1 2 3 4 5 Eat at places serving food I am familiar with 1 2 3 4 5 Eat at places that serve food which conforms to my belief systems
(e.g. Vegetarian, Kosher)
1
2
3
4
5 Visit a food processing facility 1 2 3 4 5

188
SECTION B: YOUR GENERAL INTEREST IN FOOD
The following statements measure your general interest in food. Please indicate your agreement with EACH of the following statements, on a scale of 1 = “Strongly disagree” to 5 = “Strongly agree”. (Please circle one)
Stro
ngly
D
isag
ree
Dis
agre
e
Uns
ure
Agr
ee
Stro
ngly
A
gree
When I eat out, I like to try the most unusual items, even if I am not sure I would like them 1 2 3 4 5
While preparing foods or snacks, I like to try new recipes 1 2 3 4 5 I think it is fun to try out food items I am not familiar with 1 2 3 4 5 I am eager to know what kind of foods do people from other
countries eat 1 2 3 4 5
I like to eat exotic foods 1 2 3 4 5 Items on the menu that I am unfamiliar with, make me curious 1 2 3 4 5 I prefer to eat food products that I am used to 1 2 3 4 5 I am curious about food products that I am not familiar with 1 2 3 4 5 SECTION C: YOUR ATTITUDE TOWARDS FOOD
The following statements measure your attitude towards food. Please indicate your agreement with EACH of the following statements, on a scale of 1 = “Strongly disagree” to 5 = “Strongly agree”. (Please circle one)
Stro
ngly
D
isag
ree
Dis
agre
e
Uns
ure
Agr
ee
Stro
ngly
A
gree
I am constantly sampling new and different foods 1 2 3 4 5 I don’t trust new foods 1 2 3 4 5 If I don’t know what is in a food, I won’t try it 1 2 3 4 5 I look for food from different countries 1 2 3 4 5 Ethnic food looks too weird to eat 1 2 3 4 5
At dinner parties, I will try a new food 1 2 3 4 5 I am afraid to eat things that I have never had before 1 2 3 4 5 I am very particular about the foods I will eat 1 2 3 4 5 I will eat almost anything 1 2 3 4 5 I like to try new ethnic restaurants 1 2 3 4 5
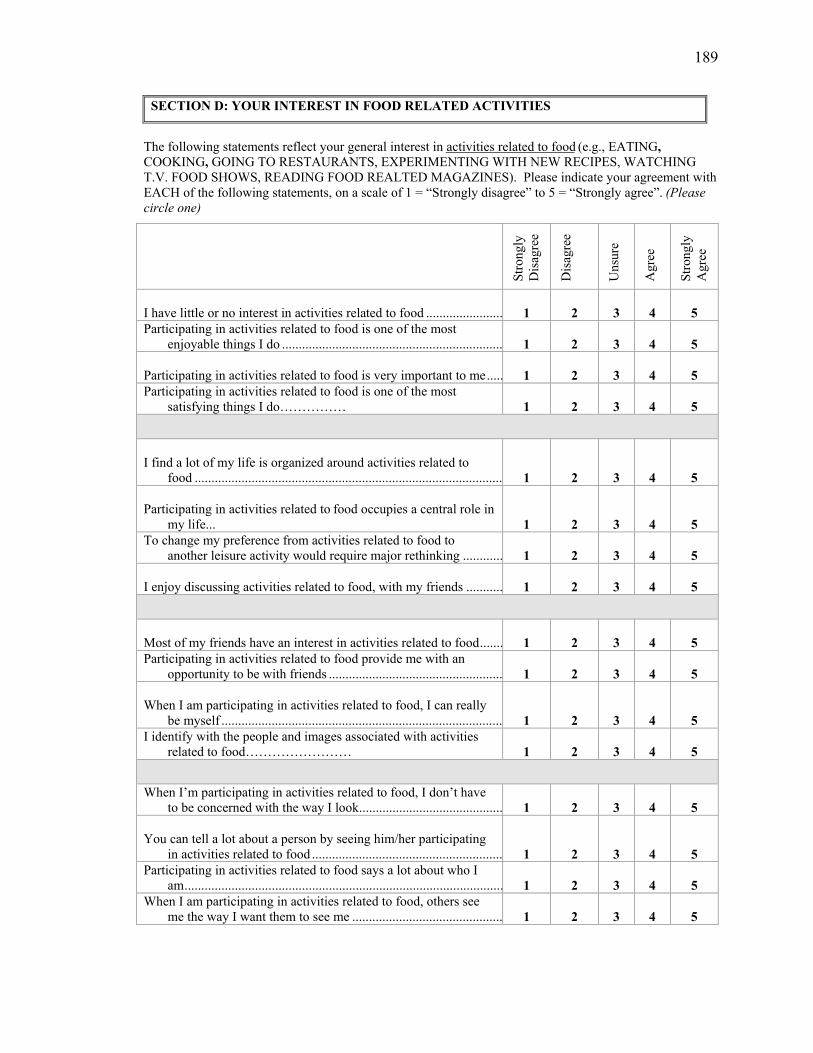
189
SECTION D: YOUR INTEREST IN FOOD RELATED ACTIVITIES
The following statements reflect your general interest in activities related to food (e.g., EATING, COOKING, GOING TO RESTAURANTS, EXPERIMENTING WITH NEW RECIPES, WATCHING T.V. FOOD SHOWS, READING FOOD REALTED MAGAZINES). Please indicate your agreement with EACH of the following statements, on a scale of 1 = “Strongly disagree” to 5 = “Strongly agree”. (Please circle one)
Stro
ngly
D
isag
ree
Dis
agre
e
Uns
ure
Agr
ee
Stro
ngly
A
gree
I have little or no interest in activities related to food ....................... 1 2 3 4 5 Participating in activities related to food is one of the most
enjoyable things I do .................................................................. 1 2 3 4 5 Participating in activities related to food is very important to me ..... 1 2 3 4 5 Participating in activities related to food is one of the most
satisfying things I do…………… 1 2 3 4 5
I find a lot of my life is organized around activities related to
food ............................................................................................ 1 2 3 4 5 Participating in activities related to food occupies a central role in
my life... 1 2 3 4 5 To change my preference from activities related to food to
another leisure activity would require major rethinking ............ 1 2 3 4 5 I enjoy discussing activities related to food, with my friends ........... 1 2 3 4 5
Most of my friends have an interest in activities related to food ....... 1 2 3 4 5 Participating in activities related to food provide me with an
opportunity to be with friends .................................................... 1 2 3 4 5 When I am participating in activities related to food, I can really
be myself .................................................................................... 1 2 3 4 5 I identify with the people and images associated with activities
related to food…………………… 1 2 3 4 5
When I’m participating in activities related to food, I don’t have
to be concerned with the way I look ........................................... 1 2 3 4 5 You can tell a lot about a person by seeing him/her participating
in activities related to food ......................................................... 1 2 3 4 5 Participating in activities related to food says a lot about who I
am ............................................................................................... 1 2 3 4 5 When I am participating in activities related to food, others see
me the way I want them to see me .............................................
1
2
3
4
5

190
SECTION E: WHAT DOES FOOD MEAN TO YOU?
We are interested in finding out how important food is to you in general. To do this, we want you to indicate your attitude regarding food on a scale of contrasting words. For example, if you feel that the food is valuable (but not extremely); you should place your check mark as follows:
Valuable
X
Worthless
Important: Be sure that you check every row; please do not omit any. Please do NOT put more than one check mark on a single row.
To me, food is……….
1. Pleasant Unpleasant 2. Nice Awful 3. Agreeable Disagreeable 4. Happy Sad 5. Useful Useless 6. Valuable Worthless 7. Beneficial Harmful 8. Wise Foolish
SECTION F: YOUR BACKGROUND INFORMATION
1. Your gender: Male Female
2. What is your age? ____________________
3. What is the highest level of education you have completed so far? (Please check one.)
High School College### Professional Post Graduate
4. What is your employment status? (Please check one.) Employed Full Time Employed Part Time Student Homemaker Unemployed Retired Other (Please specify) ______________________
5. What is your current marital status? (Please check one.)
Married Widowed Divorced or separated
Never Married

191
6. What is your approximate household income? (Please check one.)
Under $10,000 $10,000 – 19,999 $20,000 – 39,999
$40,000 – 59,999 $60,000 – 79,999 $80,000 – 99,999
$100,000 or more 7. What is your Zip code? ____________
We welcome your comments on the survey:________________________________________________
___________________________________________________________________________________
__________________________________________________________________________________
Thank you for your participation in this survey!
192
Appendix F
Cover letter accompanying the Survey
August 25, 2004 «First_Name» «Last_Name» «Address» «City» «State» «ZipCode» Dear «First_Name», Enclosed in this mail is a questionnaire for an important research project being conducted by the Department of Parks, Recreation and Tourism Management, Clemson University. During your visit to the South Carolina coast, you had volunteered to take part in this study. This survey would help us to provide you, the visitor, with better products and services at the coast, thereby making your visit a memorable one. Your participation in this survey is voluntary, but very important. If for some reason you prefer not to respond, please let us know by returning the blank questionnaire in the enclosed stamped envelope. Your answers are completely confidential and will be released only as summaries in which no individual’s answers can be identified. The code on the survey is used only to delete names from the “reminder” mailing list. Once this study is completed, all names and addresses will be deleted from our list. (We DO NOT sell or distribute your name and address to any other party). If you have any questions or comments about this study, we would be happy to talk with you. Our number is 864.656.2060, or you can write to us at the address on the letterhead. Also, if you have any questions regarding your rights as a research participant, you may contact the Clemson University Office of Research Compliance at 864.656.6460. Thank you in advance for your valuable feedback. Sincerely,
Dr. William C. Norman Associate Professor and Director

193
Appendix G
Reminder Post Card
Dear Sir/ Madam, Recently, you were mailed a questionnaire related to your visit to the South Carolina coast. If you have already completed and returned the survey, we thank you and express our sincere appreciation. If you haven’t already returned this survey, please do so at your earliest convenience. We understand that you are busy and may not have gotten around to completing the questionnaire. We are looking forward to your feedback. Thank You!
William C. Norman, Ph.D. Clemson University

194
Appendix H
Cover letter accompanying the follow-up questionnaire November 24, 2004 «First_Name» «Last_Name» «Address» «City» «State» «ZipCode» Dear «First_Name», Over the past few weeks, you should have received requests to complete a questionnaire regarding your visit to the South Carolina coast. If you have already responded, thank you. However, if you have not had chance to complete the questionnaire, please do as soon as possible. Once again let me emphasize the importance of having you help us by completing this survey. This research project being conducted by the Department of Parks, Recreation and Tourism Management, Clemson University would help us to provide you, the visitor, with better products and services at the coast, thereby making your visit a memorable one. Your participation in this survey is voluntary, but very important. If for some reason you prefer not to respond, please let me know by returning the blank questionnaire in the enclosed stamped self-addressed envelope. Your answers are completely confidential and will be released only as summaries in which no individual’s answers can be identified. The code on the survey is used only to delete names from the “reminder” mailing list. Once this study is completed, all names and addresses will be deleted from our list. (We DO NOT sell or distribute your name and address to any other party). If you have any questions or comments about this study, I would be happy to talk with you. My number is 864.656.2060, or you can write to us at the address on the letterhead. Also, if you have any questions regarding your rights as a research participant, you may contact the Clemson University Office of Research Compliance at 864.656.6460. Again, your cooperation in this study is important and will be greatly appreciated. I look forward to hearing from you within the next few days. Sincerely,
Dr. William C. Norman Associate Professor and Director
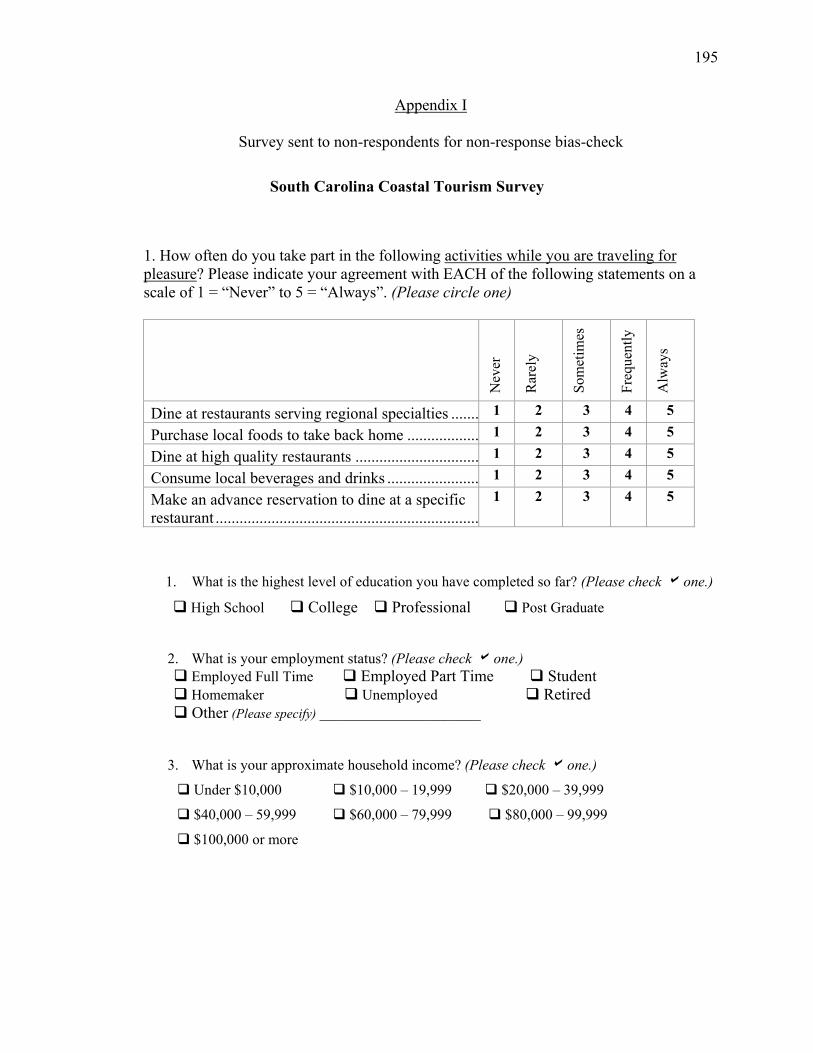
195
Appendix I
Survey sent to non-respondents for non-response bias-check
South Carolina Coastal Tourism Survey
1. How often do you take part in the following activities while you are traveling for pleasure? Please indicate your agreement with EACH of the following statements on a scale of 1 = “Never” to 5 = “Always”. (Please circle one)
Nev
er
Rar
ely
Som
etim
es
Freq
uent
ly
Alw
ays
Dine at restaurants serving regional specialties ....... 1 2 3 4 5
Purchase local foods to take back home .................. 1 2 3 4 5
Dine at high quality restaurants ............................... 1 2 3 4 5
Consume local beverages and drinks ....................... 1 2 3 4 5
Make an advance reservation to dine at a specific restaurant ..................................................................
1 2 3 4 5
1. What is the highest level of education you have completed so far? (Please check ! one.)
! High School ! College"! Professional ! Post Graduate
2. What is your employment status? (Please check ! one.) ! Employed Full Time ! Employed Part Time ! Student ! Homemaker ! Unemployed ! Retired ! Other (Please specify) ______________________
3. What is your approximate household income? (Please check ! one.)
! Under $10,000 ! $10,000 – 19,999 ! $20,000 – 39,999
! $40,000 – 59,999 ! $60,000 – 79,999 ! $80,000 – 99,999
! $100,000 or more
BIBLIOGRAPHY Acott, T. G., Trobe, H. L. L., & Howard, S. H. (1998). An evolution of deep ecotourism
and shallow ecotourism. Journal of Sustainable Tourism, 6(3), 238-252. Adema, P. (2000). Vicarious consumption: Food, television and the ambiguity of
modernity. Journal of American & Comparative Culture, 23(3), 113-123. Agnew, R., & Peterson, D. (1989). Leisure and delinquency. Social Problems, 36(332-
350). Albrow, M. (1997). The Global Age: State and Society Beyond Maturity. Stanford, CA:
Stanford University Press. Alcock, J. (1995). The revival of traditional food in Mallorca. Nutrition & Food Science,
3(May/June 1995), 35-38. Appadurai, A. (1986). On Culinary Authenticity. Anthropology Today, 2, 25. Babin, B. J., Darden, W. R., & Griffin, M. (1994). Work and/or Fun: Measuring Hedonic
and Utilitarian Shopping Value. Journal of Consumer Research, 20, 644-656. Barnet, R., & Cavanagh, J. (1994). Global Dreams: Imperial Corporations and the New
World Order. New York: Simon & Schuster. Barthes, R. (1973). Mythologies. London: Paladin. Batra, R., & Ahtola, O. (1991). Measuring the Hedonic and Utilitarian Sources of
Consumer Attitudes. Marketing Letters, 2(2), 159-170. Belisle, F. J. (1983). Tourism and food production in the Caribbean. Annals of Tourism
Research, 10, 597-513. Belisle, F. J. (1984). Tourism and Food Imports: The Case of Jamaica. Economic
Development and Cultural Change, 32(4), 819-842. Bentley, A. (2004). From Culinary Other to Mainstream America: Meanings and Uses of
Southwestern Cuisine. In L. Long (Ed.), Culinary Tourism (pp. 209-225). Lexington: The University Press of Kentucky
Bixler, R. D. (1994). Topophobia. Clemson University, Clemson.
197
Bloch, P., & Richins, M. (1983). Shopping without Purchase: An investigation of Consumer Browsing Behavior. Advances in Consumer Research, 10, 389-393.
Boniface, P. (2001). Dynamic Tourism: Journeying with Change. Clevedon: Channel View.
Boniface, P. (2003). Tasting Tourism: Travelling for Food and Drink. Aldershot:
Ashgate Publishing Ltd. Bourdieu, P. (1984 (1979)). Distinction : A Social Critique of the Judgment of the Taste.
London: Routledge & Kegan Paul. Brotherton, B., & Himmetoglu, B. (1997). Beyond destinations- special interest tourism.
Anatolia: an International Journal of Tourism and Hospitality Research, 8(3), 11-30.
Cai, L. A., Hong, G.-S., & Morrison, A. M. (1995). Household Expenditure Patterns for
Tourism Products and Services. Journal of Travel & Tourism Marketing, 4(4), 15-40.
Carmichael, B. A. (2001). Competitive and Sustainable Wine Tourism Destinations.
Travel and Tourism Research Association, Niagara Falls,(October 14-16). Charters, S., & Ali-Knight, J. (2002). Who is the Wine Tourist ? Tourism Management,
23(3), 311-319. Cochran, W. G. (1977). Sampling Techniques (3rd Edition ed.): New York: John Wiley
& Sons. Cohen, E. (1979). A Phenomenology of Tourist Experiences. Sociology, 13, 179-201. Cohen, E. (1988). Authenticity and Commoditization in Tourism. Annals of Tourism
Research, 15, 371-386. Cohen, E., & Avieli, N. (2004). Food in Tourism: Attraction and Impediment. Annals of
Tourism Research, 31(4), 755-778. Crompton, J. (1979). Motivations for Pleasure Vacation. Annals of Tourism Research, 6,
408-424. Dalecki, M. C., Whitehead, J. C., & Blomquist, G. (1993). Sample Non-response Bias
and Aggregate Benefits in Contingent Valuation: An Examination of Early, Late, and Non-Respondents. Journal of Environmental Management, 38, 133-143.
Dillman, D. A. (2000). Mail and Internet Surveys: The Tailored Design Method (Second
ed.). New York: John Wiley & Sons, Inc.
198
DiMaggio, P. (1982). Cultural capital and school success: The impact of status culture participation on the grades of U.S. high school students. American Sociological Review, 47(Apr), 189-201.
DiMaggio, P. (1997). Culture and cognition. Annual Review of Sociology, 23, 263-287. DiMaggio, P., & Mohr, J. (1985). Cultural capital, education attainment, and marital
selection. American Journal of Sociology, 90, 1231-1261. DiMaggio, P., & Mukhtar, T. (2002). Arts Participation as cultural capital in the United
States, 1982-2002: signs of decline? Poetics, 32, 169-194. Dimanche, F., Havitz, M. E., & Howard, D. R. (1991). Testing the Involvement Profile
(IP) scale in the context of selected recreational and touristic activities. Journal of Leisure Research, 23, 51-66.
Dimanche, F., Havitz, M. E., & Howard, D. R. (1991). Consumer involvement profiles
as a tourism segmentation tool. Journal of Travel and Tourism Marketing, 1(4), 33-53.
Dodd, T., & Bigotte, V. (1997). Perceptual differences among visitor groups to wineries.
Journal of Travel Research, 35, 46-51. Douglas, M. (1975). Deciphering a meal. Daedalus, 101, 61-81. Douglas, M. (1984). Standard Social Uses of Food: Introduction. In M. Douglas (Ed.),
Food in the Social Order: studies of Food and Festivities in Three American Communities. New York: Russell Sage Foundation.
Douglas, N., Douglas, N., & Derret, R. (2001). Special Interest Tourism. Australia:
Wiley. Erickson, B. H. (1996). Culture, Class, and Connections. American Journal of Sociology,
102(1), 217-251. Fantasia, R. (1995). Fast Food in France. Theory and Society, 24(2), 201-243. Featherstone, M. (1991). Consumer Culture and Postmodernism. London: Sage
Publications Ltd. Gahwiler, P., & Havitz, M. E. (1998). Toward a relational understanding of leisure
social worlds, involvement, psychological commitment, and behavioral loyalty. Leisure Sciences, 20, 1-23.
Gartman, D. (1991). Culture as Class Symbolization or Mass Reification? A Critique of
Bourdieu's Distinction. American Journal of Sociology, 97(2), 421-447.

199
Germov, J., & Williams, L. (1999). Introducing the Social Appetite: Why Do We Need a Sociology of Food and Nutrition? In J. Germov & L. Williams (Eds.), A Sociology of Food and Nutrition: The Social Appetite (First ed., pp. 1-10). Victoria: Oxford University Press.
Glynn, M. A., Bhattacharya, C. B., & Rao, H. (1996). Art museum membership and
cultural distinction: Relating members' perception of prestige to benefit usage. Poetics, 24, 259-274.
Goody, J. (1982). Cooking Cuisine and Class: a study in comparative sociology.
Cambridge: Cambridge University Press. Green, K. E. (1991). Reluctant Respondents: differences between Early, Late, and
Nonresponders to a Mail Survey. Journal of Experimental Education, 59, 268-276.
Groves, R. M. (1989). Survey Errors and Survey Costs. New York: Wiley. Groves, R. M., Dillman, D. A., Eltinge, J. L., & Little, R. J. A. (2001). Survey
Nonresponse. New York: John Wiley & Sons, Inc. Gunn, C. (1988). Vacationscape: Designing Tourist Regions (Second ed.). Austin:
Bureau of Business Research, University of Texas. Hair, J. F., Anderson, R. E., Tatham, R. L., & Black, W. C. (1995). Multivariate Data
Analysis (Fourth ed.): Simon & Schuster Company. Hall, C. M., & Macionis, N. (1998). Wine Tourism in Australia and New Zealand. In R.
W. Butler, M. Hall & J. Jenkins (Eds.), Tourism and Recreation in Rural Areas (pp. 197-224): Wiley.
Hall, C. M., & Mitchell, R. (2001). Wine and Food Tourism. In N. Douglas, N. Douglas
& R. Derrett (Eds.), Special Interest Tourism (pp. 307-329): Wiley. Hall, C. M., Sharples, E., Mitchell, R., Macionis, N., & Cambourne, B. (2003). Food
Tourism around the world: Development, management and markets (Vol. First): Butterworth Heinemann.
Hall, C. M., & Sharples, L. (2003). The consumption of experiences or the experiences of
consumption? An introduction to the tourism of taste. In C. M. Hall, E. Sharples, R. Mitchell, N. Macionis & B. Cambourne (Eds.), Food Tourism Around the World: development, management and markets. Oxford: Butterworth-Heinemann.
200
Hassan, M. W., & Hall, C. M. (2003). The demand for hallal food among Muslim travellers in New Zealand. In C. M. Hall, L. Sharples, R. Mitchell, N. Macionis & B. Cambourne (Eds.), Food Tourism Around the World: Development, management and markets (pp. 81-101). Oxford: Butterworth Heinemann.
Havitz, M. E., & Dimanche, F. (1997). Leisure involvement revisited: Conceptual
conundrums and measurement advances. Journal of Leisure Research, 29, 245-278. Havitz, M. E., & Dimanche, F. (1999). Leisure involvement revisited: Drive properties
and paradoxes. Journal of Literature Research, 31, 122-149. Hays, S. (1994). Structure and Agency and the Sticky Problem of Culture. Sociological
Theory, 12(1), 57-72. Held, D., McGrew, A., Goldblatt, D., & Perraton, J. (1999). Global Transformations.
Stanford,CA: Stanford University Press. Henderson, E. (1998). Rebuilding local food systems from the grassroots up. Monthly
Review, 50(3), 112-124. Hirschman, E., & Holbrook, M. (1982). Hedonic Consumption: Emerging Concepts,
Methods and Propositions. Journal Of Marketing, 9(September 1982), 92-101. Hjalager, A.-M., & Richards, G. (2002). Tourism and Gastronomy (First ed.). London:
Routledge. Hobden, K., & Pliner, P. (1995). Effects of a Model on Food Neophobia in Humans.
Appetite, 25, 101-114. Hobson, J. S. P., & Dietrich, U. C. (1994). Tourism, Health and Quality of Life:
Challenging the Responsibility of Using the Traditional Tenets of Sun, Sea, Sand, and Sex in Tourism Marketing. Journal of Travel & Tourism Marketing, 3(4), 21-38.
Holt, D. B. (2000). Does Cultural Capital Structure American Consumption ? In J. B.
Schor & D. B. Holt (Eds.), The Consumer Society (pp. 212-252). New York: The New Press.
Hopkinson, G. C., & Pujari, D. (1999). A factor analytic study of the sources of meaning
in hedonic consumption. European Journal of Marketing, 33(3/4), 273-290. Hughes, G. (1995). Authenticity in Tourism. Annals of Tourism Research, 22(4), 781-
803. Jacobsen, J. K. S. (2000). Anti-tourist attitudes - Mediterranean charter tourism. Annals
of Tourism Research, 27(2), 284-300.
201
Jochnowitz, E. (1998). Flavors of Memory: Jewish Food as Culinary Tourism in Poland. Southern Folklore, 55(3), 224-237.
Joreskog, K., & Sorbom, D. (2004). LISREL (Version 8.71). Lincolnwood,IL: Scientific
Software International, Inc Katz-Gerro, T., & Shavit, Y. (1998). The Stratification of Leisure and Taste: Classes and
Lifestyles in Israel. European Sociological Review, 14(4), 369-386. Kelly, J. R. (1996). Leisure (3rd ed.). Boston: Allyn Bacon. Kerstetter, D. L., & Kovich, G. M. (1997). The involvement profiles of Division I
women’s basketball spectators. Journal of Sport Management, 11, 234-249. Kingston, P. W. (2001). The Unfulfilled Promise of Cultural Capital Theory. Sociology of
Education (Extra issue), 88-99. Kirshenblatt-Gimblett, B. (2004). Foreword. In L. M. Long (Ed.), Culinary Tourism (pp.
xi-xiv). Lexington: The University Press of Kentucky. Krejcie, R. V., & Morgan, D. W. (1970). Determining sample size for research activities.
Educational and Psychological Measurement, 30, 607-610. Kyle, G. T., Graefe, A. R., Manning, R. E., & Bacon, J. (2003). An examination of the
relationship between leisure activity involvement and place attachment among hikers along the Appalachian Trail. Journal of Leisure Research, 35, 249-273.
Kyle, G. T., Graefe, A. R., Manning, R. E., & Bacon, J. (2004). Predictors or behavioral
loyalty among hikers along the Appalachian Trail. Leisure Sciences, 26, 99-118. Kyle, G. T., Absher, J. D., Norman, W., Hammitt, W. E., Jodice, L., Cavin, J., & Cavin,
D. (Revised and resubmitted). A modified involvement scale. Journal of Leisure Research.
Lamont, M. (1992). Money, Morals, and Manners. London: The University of Chicago
Press. Lang, T. (1997). The complexities of globalization: The UK as a case study of tensions
within the food system and the challenge to food policy. Agriculture and Human Values, 16, 169-185.
Lang, T. (1999). Diet, health, and Globalization: five key questions. Proceedings of the
Nutrition Society, 58, 335-343. Laurent, G., & Kapferer, J. N. (1985). Measuring consumer involvement profiles.
Journal of Marketing Research, 22, 41-53.
202
LeBel, J. L. (2000). Exploring the dimensions of food-borne pleasures in popular culture: A content analysis of mental images captured by print media. Unpublished manuscript.
Lee, T. H., & Crompton, J. L. (1992). Measuring novelty seeking in tourism. Annals of
Tourism Research, 19, 732-751. Lepp, A., & Gibson, H. (2003). Tourist roles, perceived risk and international tourism.
Annals of Tourism Research, 30(3), 606-624. Levi-Strauss, C. (1966). The Culinary Triangle. Partisan Review, 33, 586-595. Lewis, G. H. (1998).The Maine Lobster as Regional Icon: Competing Images Over Time
and Social Class." In The Taste of American Place: A Reader on Regional and Ethnic Foods, eds. Barbara G. Shortridge and James R. Shortridge, (p.21-36). New York: Rowman and Littlefield Publishers.
Long, L. (2004). Culinary Tourism (First ed.). Lexington: University Press of Kentucky. Long, L. M. (1998). Culinary Tourism: A Folkloristic Perspective on Eating and
Otherness. Southern Folklore, 55(3), 181-204. Lu, S., & Fine, G. A. (1995). The Presentation of Ethnic Authenticity: Chinese Food as
Social Accomplishment. The Sociological Quarterly, 36(3), 535-553. MacCanell, D. (1973). Staged Authenticity: Arrangements of Social Space in Tourist
Settings. American Journal of Sociology, 79, 589-603. MacCannell, D. (1973). Staged Authenticity: Arrangements of Social Space in Tourist
Settings. American Journal of Sociology, 79, 589-603. MacCannell, D. (1976). The Tourist. New York: Schoken Books. MacLaurin, T. L. (2001). Food safety in travel and tourism. Journal of Travel Research,
39(3), 332-333. Marshall, D. (1993). Food Choice And The Consumer. Glasgow: Blackie Academic &
Professional. Mattiacci, A., & Vignali, C. (2004). The typical products within food "glocalization".
British Food Journal, 106(10/11), 703-713. Mayer, H., & Knox, P. (2005). Slow Cities: Sustainable Places in a Fast World. Paper
presented at the Annual Meeting of the Urban Affairs Association, Salt Lake City, Utah.
203
McAlister, L., & Pessemier, E. (1982). Variety-Seeking Behavior : An Interdisciplinary Review. The Journal of Consumer Research, 9(3), 311-322.
McAndrews, K. (2004). Incorporating the Local Tourists at the Big Island Poke Festival.
In L. Long (Ed.), Culinary Tourism. Lexington: The University Press Of Kentucky.
McCracken, V. A., & Brandt, J. A. (1987). Household Consumption of Food-Away-From
Home: Total Expenditure and by Type of Food Facility. American Journal of Agricultural Economics, 69(2), 274-284.
McGehee, N. G. (1999). Impacts of Alternative Tourism: A Social Movement Perspective.
Unpublished Ph. D. Dissertation, Virginia Polytechnic and State University, Blacksburg.
McIntosh, W. A. (1996). Sociologies of Food and Nutrition. New York: Plenum Press. McIntyre, N., & Pigram, J. J. (1992). Recreation specialization reexamined: The case of
vehicle-based campers. Leisure Sciences, 14, 3-15. McSpotlight World Wide Web (n.d.). Local Residents Against McDonald's. Retrieved
August 2004 from www.mcspotlight.org/campaigns/ current/residents/index.html. McQuarrie, E. F., & Munson, J. M. (1987). The Zaichkowsky Personal Involvement
Inventory: Modification and extension. Advances in Consumer research, 14, 36-40 Mennell, S. (1985). All Manners of Food (First ed.). Oxford: Basil Blackwell. Mennell, S. (2000). The globalization of eating. Appetite, 35, 191-192. Milligan, G. W., & Cooper, M. C. (1985). An examination of procedures to for
determining the numbers of clusters in a dataset. Psychometrica, 50(2), 159-179. Mitchell, R., Hall, C. M., & McIntosh, A. (2000). Wine tourism and consumer behavior.
In C. M. Hall, E. Sharples, B. Cambourne & N. Macionis (Eds.), Wine Tourism Around the World: Development, Management and Markets (pp. 115-135). Oxford: Butterworth Heinemann.
Mitchell, R., & Hall, M. (2003). Consuming tourists: food tourism consumer behavior. In
M. Hall, L. Sharples, R. Mitchell, N. Macionis & B. Crambourne (Eds.), Food Tourism Around the World. Oxford: Butterworth Heinemann.
Moeran, B. (1983). The Language of Japanese Tourism. Annals of Tourism Research, 10,
93-108.
204
Molz, J. G. (2004). Tasting an Imagined Thailand: Authenticity and Culinary Tourism in Thai Restaurants. In L. M. Long (Ed.), Culinary Tourism (pp. 53-75). Lexington: The University Press of Kentucky.
Moscardo, G. M., & Pearce, P. L. (1986). Historic Theme Parks: An Australian
Experience in Authenticity. Annals of Tourism Research, 13, 467-479. National Restaurant Association. (2002). Travel and Tourism Facts [Electronic Version].
National Restaurant Association. Retrieved 9/27/2002. Nield, K., Kozak, M., & LeGrys, G. (2000). The Role of Food Service in Tourist
Satisfaction. International Journal of Hospitality Management, 19(4), 375-384. Norussis, M. J. (1993). SPSS for Windows Professional Statistics Release 6.0. Chicago:
SPSS Inc. Nunnally, J., & Bernstein, I. (1994). Psychometric Theory (3rd ed.). New York: McGraw
Hill. Nygard, B., & Storstad, O. (1998). De-globalization of Food Markets? Consumer
Perceptions of Safe Food: The Case of Norway. Sociologia Ruralis, 38(1), 35-53. Osgood, C. E., Suci, G. J., & Tannenbaum, P. H. (1967). The Measurement of Meaning.
Urbana: University of Illinois Press. Ostrower, F. (1998). The arts as cultural capital among elites: Bourdieu's theory
reconsidered. Poetics, 26, 43-53. Otis, L. (1984). Factors Influencing The Willingness To Taste Unusual Foods.
Psychological Reports, 54, 739-745. Ott, R. L. (1993), An Introduction to Statistical Methods and Data Analysis (4th ed.),
Belmont, CA: Duxbury Press Park, C. (2004). Efficient or enjoyable? Consumer values of eating-out and fast food
restaurant consumption in Korea. Hospitality Management, 23, 87-94. Pearce, D. (1993). Fundamentals of tourist motivation. In Tourism research, critiques
and challenges (pp. 113-133). Pearce, P. L., & Moscardo, G. (1986). The Concept of Authenticity in Tourist
Experiences. The Australian and New Zealand Journal of Sociology, 37, 157-174. Pearl, D. K., & Fairley, D. (1985). Testing for the potential of non-response bias in
sample surveys. Public Opinion Quarterly, 49, 533-560.
205
Peterson, R. (1992). Understanding Audience Segmentation: From Elite and Mass to Omnivore and Univore. Poetics, 21, 243-258.
Pietrykowski, B. (2004). You Are What You Eat: The Social Economy of the Slow Food
Movement. Review of Social Economy, LXII(3), 307 - 321. Pilcher, J. M. (2004). From "Montezuma's Revenge" to "Mexican Truffles": Culinary
Tourism across the Rio Grande. In L. Long (Ed.), Culinary Tourism (pp. 76-96). Lexington: The University Press of Kentucky.
Pliner, P., Eng, A., & Krishnan, K. (1995). The effects of Fear and Hunger on Food
neophobia in Humans. Appetite, 25, 77-85. Pliner, P., & Hobden, K. (1992). Development of a Scale to Measure the Trait of Food
neophobia in Humans. Appetite, 19(2), 105-129. Pliner, P., & Melo, N. (1997). Food neophobia in Humans: Effects of Manipulated
Arousal and Individual Differences in Sensation Seeking. Physiology & Behavior, 61(2), 331-335.
Pliner, P., Pelchat, M., & Grabski, M. (1993). Reduction of Neophobia in Humans by
Exposure to Novel Foods. Appetite, 20, 111-123. Plog, S. (1987). Understanding in Psychographics in Tourism Research. In J. R. B.
Ritchie & C. R. Goeldner (Eds.), Travel, Tourism and Hospitality Research (pp. 203-213). New York: John Wiley Inc.
Press, S. J., & Wilson, S. (1978). Choosing Between Logistic Regression and
Discriminant Analysis. Journal of American Statistical Association, 73(364), 699-705.
Pyo, S. S., Uysal, M., & McLellan, R. W. (1991). A linear expenditure model for tourism
demand. Annals of Tourism Research, 31, 619-630. Quan, S., & Wang, N. (2004). Towards a structural model of the tourist experience: an
illustration from food experiences in tourism. Tourism Management, 25, 294-305. Ratner, R. K., Kahn, B. E., & Kahneman, D. (1999). Choosing Less-Preferred
Experiemces for the Sake of Variety. Journal of Consumer Research, 26, 1-15. Reynolds, P. C. (1993). Food and tourism: Towards understanding of sustainable culture.
Journal of Sustainable Tourism, 1(1), 48-54. Richards, G. (2002). Gastronomy: an essential ingredient in tourism production and
consumption? In A.-M. Hjalager & G. Richards (Eds.), Tourism and Gastronomy (pp. 3-20). London: Routledge.
206
Ritchey, P. N., Frank, R. A., Hursti, U.-K., & Tuorila, H. (2003). Validation and cross- national comparison of the Food neophobia scale (FNS) using confirmatory factor analysis. Appetite, 40, 163-173.
Ritchie, B., & Zins, M. (1978). Culture as determinant of the attractiveness of a tourism
region. Annals of Tourism Research, 5, 226-237. Ritzer, G. (1996). The McDonaldization of Society (Revised Edition ed.). New York:
Pine Forge Press. Ritzer, G. (1999). Enchanting a Disenchanted World: Revolutionizing the means of
consumption (Second ed.). New York: Pine Forge Press. Ritzer, G., Goodman, D., & Wiedenhoft, W. (2001). Theories of Consumption. In G.
Ritzer & B. Smart (Eds.), Handbook of Social Theory (pp. 410-427). London: SAGE Publications Ltd.
Robertson, R. (1992). Globalization: Social Theory and Global Culture. London: Sage. Robertson, R. (1995). Glocalization: Time -Space and Homogeneity and Heterogeneity.
In M. Featherstone, S. Lash & R. Robertson (Eds.), Global Modernities (pp. 25-44). London: Sage.
Robertson, R. (1997). Values and Globalization: Communitarianism and Globality. In L.
E. Soares (Ed.), Identity, Culture and Globalization (pp. 73-97). Rio de Janerio: UNESCO.
Robertson, R. (2001). Globalization Theory 2000+: Major Problems. In G. Ritzer & B.
Smart (Eds.), Handbook of Social Theory (First ed., pp. 458-471). London: SAGE Publications Ltd.
Rotkovitz, M. (2004). Koshering the Melting Pot: Oreos, Sushi Restaurants, "Kosher
Terif," and the Observant American Jew. In L. Long (Ed.), Culinary Tourism (pp. 157-185). Lexington: The University Press of Kentucky.
Salkind, N. J. (1997). Exploring Research (3rd ed.): Upper Saddle River, NJ : Prentice
Hall. South Carolina Department of Parks Recreation and Tourism. (2003).Expenditures of
Annual Accommodation Tax Revenues Fiscal Year 2001-2002. Retrieved April 5, 2004, from http://www.discoversouthcarolina.com/ agency/research reports.asp
South Carolina Department of Parks Recreation and Tourism. (2003). Domestic Visitor
Expenditures by County, 2000-2003. Retrieved April 5, 2004, from http://www.discoversouthcarolina.com/agency/researchreports.asp
207
Selwood, J. (2003). The lure of food: food as an attraction in destination marketing in Manitoba, Canada. In C. M. Hall (Ed.), Food Tourism Around the World : Development, management and markets (pp. 178-191). Oxford: Butterworth Heinemann.
Sharples, L. (2003). The world of cookery-school holidays. In C. M. Hall, L. Sharples, R.
Mitchell, N. Macionis & B. Cambourne (Eds.), Food Tourism Around the World: Development, management and markets (Vol. One, pp. 102-120). Oxford: Butterworth -Heinemann.
Sharpley, R. (1994). Tourism, Tourists and Society. Cambridgeshire, England: Elm
Publications. Sharpley, R. (1999). Tourism, tourists and society. Cambridge: ELM Publications. Shortridge, B. (2004). Ethnic Heritage Food in Lindsborg, Kansas, and New Glarus,
Wisconsin. In L. Long (Ed.), Culinary Tourism (pp. 268-296). Lexington: The University Press of Kentucky.
Sklair, L. (1991). Sociology of the Global System. Hemel Hempstead, Herts: Harvester
Wheatsheaf. Smallwood, D., Blisard, N., & Blaylock, J. (1991). Food Spending in American
Households 1980-88. Washington D.C: U.S. Department of Agriculture, Economic Research Service.
Smith, S. L. J. (1983). Restaurants and dining out: Geography of a tourism business.
Annals of Tourism Research, 10, 515-549. Spangenberg, E. R., Voss, K. E., & Crowley, A. E. (1997). Measuring the Hedonic and
Utilitarian Dimensions of Attitude: A Generally Applicable Scale. Advances in Consumer Research, 24, 235-241.
Sparks, B., Bowen, J., & Klag, S. (2003). Restaurants and the tourist market.
International Journal of Contemporary Hospitality Management, 15(1), 6-13. Spector, P. E. (1992). Summated Rating Scale Construction: An Introduction. Newbury
Park, CA: Sage. Stille, A. (2001, August 21/27). Slow Food: An Italian Answer to Globalization. The
Nation. Swindler, A. (1986). Culture in Action: symbols and Strategies. American Sociological
Review, 51, 273-286.
208
Symons, M. (1999). Gastronomic authenticity and the sense of place. Paper presented at the 9th Australian Tourism and Hospitality Research Conference for Australian University Tourism and Hospitality Education.
Tabachnick, B. G., & Fidell, L. S. (2001). Using Multivariate Statistics (Fourth ed.):
Allyn and Bacon. Tannahill, R. (1988). Food in History. New York: Three Rivers Press. Tasmania, T. C. o. (2002). Tasmanian Wine and Food Tourism Strategy. Retrieved
November 2002, 2002 Telfer, D. J. (2001). Strategic Alliances along the Niagara Wine Route. Tourism
Management, 22, 21-30. Telfer, D. J., & Hashimoto, A. (2003). Food Tourism in the Niagara Region: the
development of a nouvelle cuisine. In C. M. Hall (Ed.), Food Tourism Around the World : Development, management and markets (pp. 158-177). Oxford: Butterworth Heinemann.
Torres, R. (2002). Toward a better understanding of the tourist and agricultural linkages
in the Yucatan: Tourist food consumption and preferences. Tourism Geographies, 4(3), 282-306.
Trauer, B. (2005). Conceptualizing Special Interest Tourism- framework for analysis.
Tourism Management, In Press, Available online 8 January 2005. Trauer, B. & Ryan, C. (2005). Destination image, romance and place experience—an
application of intimacy theory in tourism. Tourism Management, 26 (4), 481-491. Tuorila, H., Lahteenmaki, L., Pohjalainen, L., & Lotti, L. (2001). Food neophobia among
the Finns and related responses to familiar and unfamiliar foods. Food Qualiy and Preferences, 12, 29-37.
Turner, C., & Manning, P. (1988). Placing Authenticity-On Being a Tourist: A Reply to
Pearce and Moscardo. Australia and New Zealand Journal of Sociology, 24, 136-139.
Urry, J. (2002). The Tourist Gaze (2nd ed.). London: Sage Publications. VanTrijp, H., & Steenkamp, J.-B. (1992). Consumers' variety-seeking tendency with
respect to foods : Measurement and managerial implications. European Review of Agricultural Economics, 19, 181 -195.
Wang, N. (1999). Rethinking authenticity in tourism experience. Annals of Tourism
Research, 26(2), 349-370.
209
Wanhill, S., & Rassing, C. (2000, 2003). Promoting Local Food Works But You Should Tell The Restaurants. WTO-CTO Local Food & Tourism International Conference Proceedings, Larnaka, Cyprus. 9-11 November 2000. p.81-100.
Wansink, B., Sonka, S., & Cheney, M. (2002). A Cultural Hedonic Framework for
Increasing the Consumption of Unfamiliar Foods: Soy acceptance in Russia and Columbia. Review of Agricultural Economics, 24(2), 353-365.
Warde, A. (1997). Consumption, Food and Taste. London: Sage. Warde, A. (2004). Practice and field: revising Bourdieusian concepts: Department of
Sociology, University of Manchester. Warde, A., & Martens, L. (2000). Eating Out: Social Differentiation, Consumption and
Pleasure. Cambridge: Cambridge University Press. Warde, A., Martens, L., & Olsen, W. (1999). Consumption and the problem of variety:
cultural omnivorousness, social distinctions and dining out. Sociology, 33(1), 105-127.
Waters, M. (1995). Globalization. New York: Routledge. Williams, P. W., & Dossa, K. B. (2001). Non-resident Wine Tourist Markets:
Management Implications for British Columbia's Emerging Wine Tourism Industry. Travel and Tourism Research Association, Niagara Falls,(October 14-16).
Wilson, L. (2004). Pass the Tofu, Please: Asian Food for Aging Baby Boomers. In L.
Long (Ed.), Culinary Tourism (pp. 245-267). Lexington: The University Press of Kentucky.
Wilson, T. C. (2002). The paradox of social class and sports involvement. International
Review for Sociology of sport, 37(1), 5-16. Wiley, C. G. E., Shaw, S. M., & Havitz, M. E. (2000). Men’s and women’s involvement
in sports: An examination of the gendered aspects of leisure involvement. Leisure Sciences, 22, 19-31.
Yin, Z., Katims, D., & Zapata, J. (1999). Participation in Leisure Activities and
Involvement in Deliquency by Mexican American Adolescents. Hispanic Journal of Behavioral Sciences, 21(2), 170-185.
Yu, M. (1980). The empirical development of typology for describing leisure behavior on
the basis of participation patterns. Journal of Leisure Research, 4, 309-320.

210
Zelinsky, W. (1985). The Roving Palate: North America's Ethnic Restaurant Cuisines. Geoforum, 16(1), 51-72.
Zaichkowsky, J. L. (1985). Measuring the involvement construct. Journal of Consumer
Research, 12, 341-352. Zuckerman, M. (1979). Sensation Seeking: Beyond the Optimal Level of Arousal.
Hillsdale, NJ: Lawrence Erlbaum Associates.
![Advances in Social Science, Education and Humanities Research, … · the perception that halal food is healthier, cleaner, and tastier [22]. C. Food and Tourism - what is culinary](https://static.fdocuments.us/doc/165x107/6128b3140fc13646b00814f3/advances-in-social-science-education-and-humanities-research-the-perception-that.jpg)