Food Shopping in the Urban Environment: Parking Supply
20
Maley and Weinberger 1 Food Shopping in the Urban Environment: Parking Supply, Destination Choice and Mode Choice Submitted: November 15, 2010 Words: 4,433 words + 7 figures + 5 tables = 7,433 words Authors: Donald W. Maley (Corresponding Author), Parsons Transportation Group Address: 1003 Spruce Street, Apt 3R, Philadelphia, PA 19107 Phone: 847-722-5900 Fax: 215-898-5731 Email: [email protected] Rachel Weinberger, Ph.D., University of Pennsylvania Address: 127 Meyerson Hall, Philadelphia, PA 19104 Phone: 215-898-8329 Fax: 215-898-5731 Email: [email protected]
Transcript of Food Shopping in the Urban Environment: Parking Supply
Maley and Weinberger 1
Food Shopping in the Urban Environment: Parking Supply, Destination Choice and Mode Choice Submitted: November 15, 2010 Words: 4,433 words + 7 figures + 5 tables = 7,433 words Authors: Donald W. Maley (Corresponding Author), Parsons Transportation Group
Address: 1003 Spruce Street, Apt 3R, Philadelphia, PA 19107 Phone: 847-722-5900 Fax: 215-898-5731 Email: [email protected]
Rachel Weinberger, Ph.D., University of Pennsylvania Address: 127 Meyerson Hall, Philadelphia, PA 19104 Phone: 215-898-8329 Fax: 215-898-5731 Email: [email protected]
Maley and Weinberger 2
ABSTRACT This research contributes to literature on the influence of urban form on travel behavior. It examines the specific impact of surface parking lots at supermarkets. Past studies have demonstrated that design elements of a neighborhood (density, mix of uses, street connectivity, sidewalk condition, tree cover, etc.) have correlations with travel behavior (vehicle miles traveled, walking trip rates, transit ridership, etc.). In the present case, those elements are controlled by selecting supermarkets in six Philadelphia neighborhoods all characterized by urban design features associated with high rates of walking. Travel behavior of residents within a one-half mile catchment shed of each supermarket is examined. Using a quasi-experimental methodology, two design typologies for supermarkets are analyzed. Three of the supermarkets are auto-oriented, with large setbacks from the street and large surface parking lots, while the other three are pedestrian-oriented. They are not set-back from the street, their entrances open to a sidewalk rather than a surface lot, and their available parking is structured or priced, even though parking is still free with grocery purchases. Using a discrete choice framework, binary logit models were developed demonstrating that surface parking lots encourage automobile access over pedestrian access. Moreover, while surface parking lots were shown to influence mode choice, they were not shown to increase use of a supermarket among nearby residents.

Maley and Weinberger 3
INTRODUCTION This study investigates the influence of supermarket site design on food shopping access. Prior research demonstrates that decisions about food shopping (trip frequency, choice of destination and mode of transportation) vary based on household characteristics (e.g. size and income) and non-household characteristics (e.g. qualities of supermarkets and qualities of the built environment) (1-11). Scholars have tried to identify ways planners and policy makers can influence shopping travel patterns. Much research in this area aims to increase non-motorized mode share, with ultimate goals varying from reduced greenhouse gas emissions, oil consumption and road congestion to increased exercise and livability. Within this body of literature, the role of urban form in shaping travel habits is a key subject of study (1, 7, 12-22).
The present investigation examines a previously unexplored singular aspect of urban form on shopping travel patterns: the availability of surface parking lots. Past research has demonstrated that design elements of a neighborhood (density, mix of uses, sidewalk condition, tree cover, etc.) have a statistically significant impact on shopping travel behavior (1, 7, 13, 15-22). With a focus limited to food shopping, this study holds neighborhood design constant to evaluate the separate role of destination site design, specifically the presence or absence of a surface parking lot.
Using survey results from households in neighborhoods adjacent to 6 supermarkets in Philadelphia, PA, this paper shows that surface parking lots encourage automobile access over pedestrian access. Moreover, while surface parking lots are shown to influence mode choice, they do not show any advantage in terms of increased use of a supermarket by nearby residents. PREVIOUS RESEARCH Travel models estimate a utility derived from travel decisions. A utility can be calculated for a package of choices including mode, route, time of day, and even the destination itself. For food shopping, a decision about destination or mode on any particular day is likely to take several contextual factors into account. A shopper might walk to a nearby supermarket with higher prices instead of driving to a distant supermarket with lower prices on a day when he or she is short on time. Other dynamic factors can include the weather, types of items needed or the location of other activities the shopper will participate in that day (5, 6).
The relative proximity of a market is key, as food shopping is more likely to be locally-based than any other type of shopping trip (6, 7), but it is not the only factor. Research has identified considerations in choosing a destination that include quality of goods, atmosphere, selection, crowds, prices, proximity to other destinations (e.g., workplace), or loyalty to a particular brand (6-8). Households tend to have a primary grocery store, though many also make trips to non-primary stores, up to 3 or 4 times over the course of a month (5, 7, 11). Some evidence suggests that a significant number of food trips are small, perhaps for only one or two bags of groceries (5, 2, 7, 11). In studies on the topic of mode choice, scholars frequently examine scales of urbanism, comparing areas of high and low “D variables”: density (population, employment, etc.), diversity (of land uses), design (street connectivity, street width, building setback, etc.), destination accessibility (e.g., average distance to destination), and distance to transit (1, 7, 13, 15-22).
Characteristics of shoppers themselves influence behavior. Studies demonstrate that income, ethnicity, number of children and number of available vehicles influence how often

Maley and Weinberger 4
people shop, where they shop, and how they get there (2, 4, 8, 9,11). Bawa and Ghosh (2) suggest middle-income households are most pressed for time, making fewer shopping trips than either high- or low-income households. Rajamani et al. (21) found that higher income households in Portland, OR were more likely to drive to non-work destinations than lower-income households.
Ease of parking is a factor that has been suggested by other studies. Bell, Ho and Tang (3) assume parking as a component of a fixed cost variable in their model on supermarket choice. In an empirical study of consumers’ shopping decision-making processes, Dellaert, et al. (6) encountered parking as a consideration, but not a statistically significant one. Van der Waerden et al. (22) observe that the probability of choosing particular parking lots can decrease as size of lot increases, perhaps because shoppers are averse to long walks through parking lots.
Recent research on mode choice pays particular attention to the question of self-selection, or the possibility that residents who choose to walk in “walkable” neighborhoods have chosen their environments purposefully, rather than fallen under the influence of them. Such a condition would seem to dim the prospects of using changes in urban form to influence behavior. However, studies have begun to demonstrate a statistically significant correlation between the built environment and travel behavior even after controlling for self-selection (12-20). Furthermore, the role of self-selection should not obscure the fact that demand for walkable communities in the US may well exceed current supply (23).
Past studies have reached the foreseeable conclusion that households far from shopping destinations are unlikely to make walking trips (7). Missing from the literature is a robust discussion of how the decision to drive 5 miles to a supermarket in a low-density exurb is different from the decision to drive one-half mile to a supermarket in a dense city. To address this gap, this research focuses only on households in dense urban environments living within a one-half mile walk shed of a supermarket. Understanding the effects of store design—in particular street setbacks and parking configuration—on travel behavior for this subset of shoppers could facilitate the development of policies that encourage (or discourage) walking as a strategy for reducing congestion and improving air quality and livability. METHODOLOGY The present study considers six neighborhoods adjacent to full-service supermarkets. The neighborhoods, all in Philadelphia, PA, can be characterized as dense residential districts, consisting mostly of attached row-homes and apartment buildings. Retail is a common ground floor use. Surrounding street networks are grids with sidewalks on both sides of the street. Few, if any, buildings are set back from the street. The largest variations between neighborhoods are found in tree coverage and vacancy rates. Past research has demonstrated that shoppers will avoid crossing a major arterial on foot (7), so neighborhoods with these circumstances were avoided. Supermarkets adjacent to dense, walkable neighborhoods but along big box retail corridors were also avoided under the assumption that even nearby residents would most likely view them as automobile destinations. One supermarket was located near railroad tracks, but surveying was limited to households on the same side of the tracks as the supermarket.
This research focuses on supermarket design with respect to auto or pedestrian orientation. The supermarkets were chosen in two sets of three. Half the supermarkets were selected because their sites include a large surface parking lot and half were chosen because their sites have little or no surface parking. For the purposes of this paper, the former three are

Maley and Weinberger 5
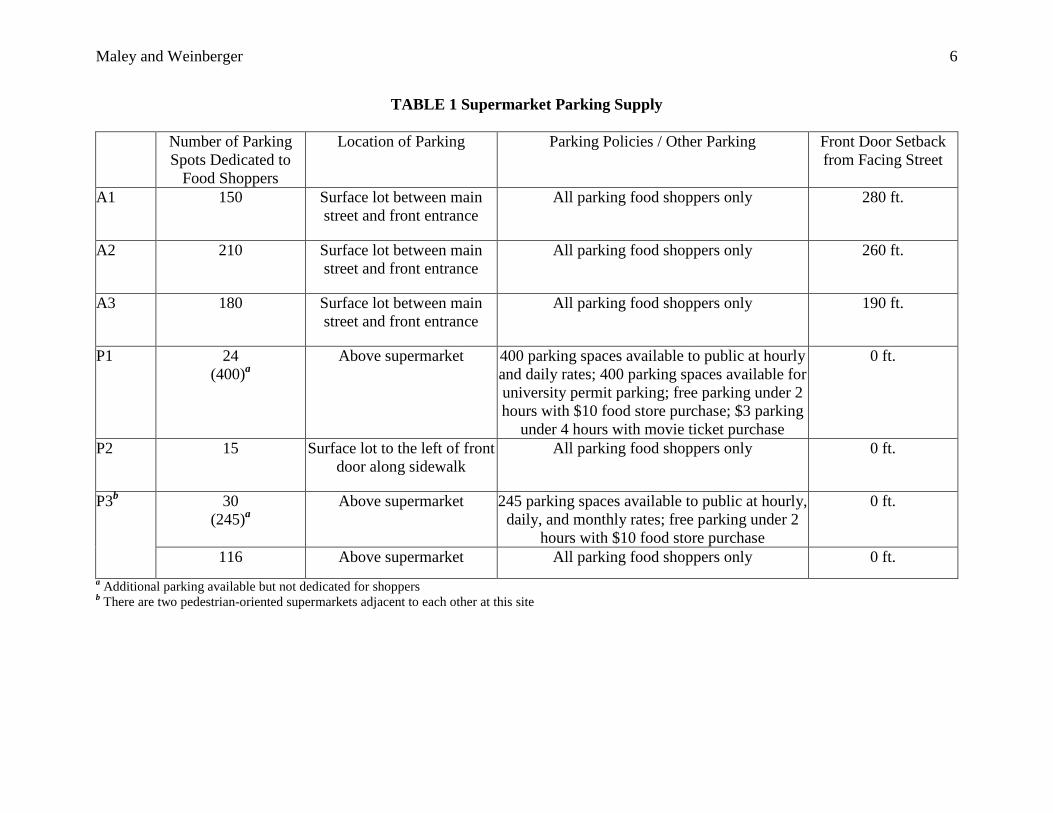
referred to as “auto-oriented markets” (A1, A2 and A3) and the latter three are referred to as “pedestrian-oriented markets” (P1, P2 and P3) (Figures 1 and 2). While two of the pedestrian-oriented markets have above ground parking and one has a small side lot (15 spaces), they all exhibit urban design characteristics such as a zero setback from the street and a front door that opens directly onto a city sidewalk. By contrast, the “auto-oriented markets” have between 150 and 210 parking spaces, and setbacks from the street ranging between 190 and 280 feet (Table 1).
Rather than gathering data at supermarkets (1, 11), or broadly across the city irrespective of where or what kinds of food shopping opportunities exist (7, 12-14, 16-20), this study surveyed only those residents that live within a half-mile walking distance of a full-service chain supermarket. While the surveyed food shoppers represent a broad range of incomes and races, all live in neighborhoods that exhibit urban design characteristics consistently associated with high levels of pedestrian activity, including a high density and mix of land uses, street network connectivity, and the presence of sidewalks (1, 7, 13, 15-22).
Maley and Weinberger 6
TABLE 1 Supermarket Parking Supply
Number of Parking Spots Dedicated to
Food Shoppers
Location of Parking Parking Policies / Other Parking Front Door Setback from Facing Street
A1 150 Surface lot between main street and front entrance
All parking food shoppers only 280 ft.
A2 210 Surface lot between main street and front entrance
All parking food shoppers only 260 ft.
A3 180 Surface lot between main street and front entrance
All parking food shoppers only 190 ft.
P1 24 (400)a
Above supermarket 400 parking spaces available to public at hourly and daily rates; 400 parking spaces available for university permit parking; free parking under 2 hours with $10 food store purchase; $3 parking
under 4 hours with movie ticket purchase
0 ft.
P2 15 Surface lot to the left of front door along sidewalk
All parking food shoppers only 0 ft.
P3b 30 (245)a
Above supermarket 245 parking spaces available to public at hourly, daily, and monthly rates; free parking under 2
hours with $10 food store purchase
0 ft.
116 Above supermarket All parking food shoppers only 0 ft. a Additional parking available but not dedicated for shoppers b There are two pedestrian-oriented supermarkets adjacent to each other at this site

Maley and Weinberger 7
FIGURE 1 Auto-oriented supermarket study areas and site designs.

Maley and Weinberger 8
FIGURE 2 Pedestrian-oriented supermarket study areas and site designs. Note that P3 is comprised of two pedestrian-oriented supermarkets across the street from one another.
Maley and Weinberger 9
Data were collected using a 12-question postcard survey (Figure 3) distributed to 3,600 dwelling units, 600 per catchment area. The postcards were addressed and stamped; the instructions were that the primary food shopper of the household complete the survey and drop it in a mailbox. Because each survey asked about the nearby supermarket by name, each response could be classified according to market-neighborhood.
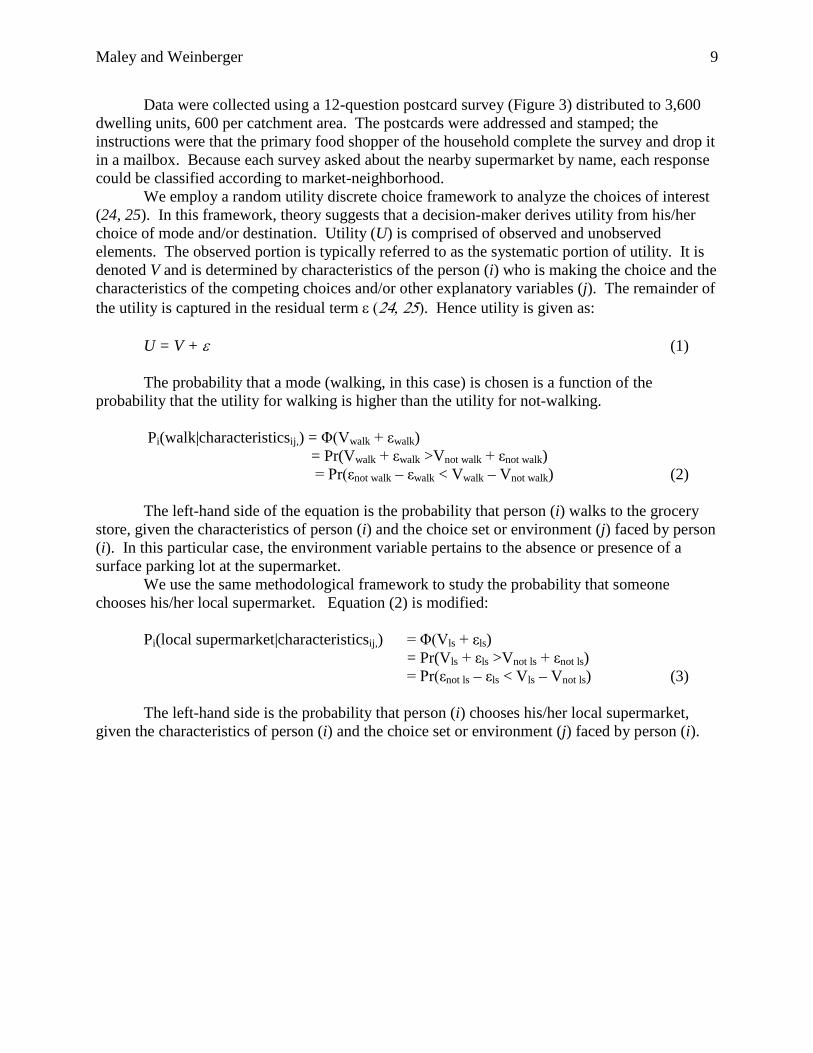
We employ a random utility discrete choice framework to analyze the choices of interest (24, 25). In this framework, theory suggests that a decision-maker derives utility from his/her choice of mode and/or destination. Utility (U) is comprised of observed and unobserved elements. The observed portion is typically referred to as the systematic portion of utility. It is denoted V and is determined by characteristics of the person (i) who is making the choice and the characteristics of the competing choices and/or other explanatory variables (j). The remainder of the utility is captured in the residual term ε (24, 25). Hence utility is given as:
U = V + ε (1) The probability that a mode (walking, in this case) is chosen is a function of the
probability that the utility for walking is higher than the utility for not-walking. Pi(walk|characteristicsij,) = Φ(Vwalk + εwalk) = Pr(Vwalk + εwalk >Vnot walk + εnot walk) = Pr(εnot walk – εwalk < Vwalk – Vnot walk) (2) The left-hand side of the equation is the probability that person (i) walks to the grocery
store, given the characteristics of person (i) and the choice set or environment (j) faced by person (i). In this particular case, the environment variable pertains to the absence or presence of a surface parking lot at the supermarket.
We use the same methodological framework to study the probability that someone chooses his/her local supermarket. Equation (2) is modified:
Pi(local supermarket|characteristicsij,) = Φ(Vls + εls)
= Pr(Vls + εls >Vnot ls + εnot ls) = Pr(εnot ls – εls < Vls – Vnot ls) (3)
The left-hand side is the probability that person (i) chooses his/her local supermarket, given the characteristics of person (i) and the choice set or environment (j) faced by person (i).

Maley and Weinberger 10
FIGURE 3 Survey distributed to households. RESULTS Response rates and demographic data from the survey and from the Census for each market-neighborhood are shown in Table 2. The largest discrepancies between the survey and the Census are for market-neighborhood P1, and are likely due to the fact that this is a university area with a combination of permanent and temporary residents. The following sections highlight differences by neighborhood and by access to automobiles. Results of the models show that, controlling for distance, number of children, store loyalty, auto ownership and other factors, residents of study areas near auto-oriented supermarkets are more likely to drive, even though they are less likely to own automobiles, than their counterparts living near pedestrian-oriented markets. We also show that the presence or absence of surface parking lots does not engender greater store loyalty.

Maley and Weinberger 11
TABLE 2 Response Rates and Neighborhood Characteristics
Response Rate
Household Income Race/Ethnicity of Primary Shopper Household Auto Ownership Survey Censusa Survey Censusa Survey Censusa
A1 7.3% <$20K $20-50K $50-100K >$100K
39% 32% 9% 2%
48% 32% 17% 3%
White/Caucasian Black/Af. Am. Other
2% 89% 9%
1% 97% 2%
No cars One car More than one
27% 50% 16%
51% 34% 15%
A2 15.5% <$20K $20-50K $50-100K >$100K
13% 33% 33% 14%
43% 28% 24% 5%
White/Caucasian Black/Af. Am. Other
86% 1% 13%
86% 1% 13%
No cars One car More than one
15% 56% 25%
44% 39% 17%
A3 8.5% <$20K $20-50K $50-100K >$100K
41% 39% 16% 2%
39% 39% 21% 1%
White/Caucasian Black/Af. Am. Other
4% 90% 6%
2% 97% 1%
No cars One car More than one
45% 41% 10%
49% 40% 11%
P1 12.5% <$20K $20-50K $50-100K >$100K
20% 32% 31% 16%
68% 24% 7% 1%
White/Caucasian Black/Af. Am. Other
69% 11% 20%
58% 13% 28%
No cars One car More than one
25% 44% 20%
67% 21% 12%
P2 29.5% <$20K $20-50K $50-100K >$100K
1% 7% 24% 61%
10% 26% 26% 38%
White/Caucasian Black/Af. Am. Other
92% 2% 6%
91% 4% 5%
No cars One car More than one
6% 63% 25%
26% 58% 16%
P3 26.8% <$20K $20-50K $50-100K >$100K
6% 17% 30% 42%
29% 36% 22% 13%
White/Caucasian Black/Af. Am. Other
84% 5% 11%
80% 10% 10%
No cars One car More than one
17% 50% 14%
57% 40% 4%
a Data is according to the census tract containing the supermarket itself, which is in every case somewhat smaller than the half-mile radius study area

Maley and Weinberger 12
Neighborhood Differences In auto-oriented market-neighborhoods, residents were found on average to be poorer (Figure 4), disproportionately Black or African-American (46% compared to 5% in the other neighborhoods), own fewer cars (Figure 5), and are more likely not to be working—whether retired or unemployed (31% versus 24% not working).
FIGURE 4 Income Distribution.
FIGURE 5 Ownership and Access to Cars.
0%
10%
20%
30%
40%
50%
Less than $20K $20K to $50K $50K to $100K More than $100K
Auto-Oriented Markets Pedestrian-Oriented Markets
0%
10%
20%
30%
40%
50%
60%
One More than one Car Share Don't Drive
Auto-Oriented Markets Pedestrian-Oriented Markets

Maley and Weinberger 13
Access Differences In our sample, 10% of respondents indicated that they always drive to the grocery store, regardless of market-neighborhood. If you include those respondents who drive for “big trips” but walk for “small trips” (size interpreted by respondents), or who drive when they are in a hurry/during bad weather and walk when they are not, about 40% of respondents indicated that they drive sometimes to the store. Overall, 51% indicated that they always walk. The remainder use bicycles, take transit, receive deliveries or use other means. Limiting the sample to households that own cars or use car-sharing, the distribution shifts slightly. Among those households, about 45% drive for at least some trips while 44% of respondents always walk.
Table 3 shows each market-neighborhood’s respective access mode share. A1, A2 and A3 have the highest driving mode shares. Restricting the sample to households with access to automobiles, the drive mode shares increase but only slightly for the pedestrian-oriented market-neighborhoods. Drive always mode share rises from 0.6% to 0.8% in the P3 market-neighborhood. Conversely, the drive always mode share for A1’s market-neighborhood increases from 34% to 49% when controlling for household access to automobiles.
TABLE 3 Grocery Store Access
Always Drive Always Walk Drive for Big
Trips, Walk for Small Trips
Drive in a Rush or Bad Weather, Otherwise Walk
Other
A1 34.1% 38.6% 13.6% 2.3% 11.4% A2 18.3% 35.5% 28.0% 10.8% 7.5% A3 11.8% 41.2% 27.5% 7.8% 11.8% P1 10.7% 52.0% 17.3% 6.7% 13.3% P2 7.3% 51.4% 20.9% 13.6% 6.8% P3 .6% 65.8% 16.8% 6.8% 9.9% Total 10.0% 51.1% 20.5% 9.2% 9.3%
Over 50% of respondents always walk in each pedestrian-oriented market-neighborhood.
At best, 41% of respondents always walk in auto-oriented market-neighborhoods. While 53% of respondents with access to an automobile always walk in pedestrian-oriented market-neighborhoods, only 22% of their counterparts in auto-oriented market-neighborhoods always walk.
Figures 6 and 7 show how income interacts with access mode. “Always walk” responses decrease with income until the highest income group for both pedestrian- and auto-oriented market-neighborhoods. The “always drive” response does not show an equivalent or reciprocal pattern.

Maley and Weinberger 14
FIGURE 6 Access Mode by Income for Auto-Oriented Markets.
FIGURE 7 Access Mode by Income for Pedestrian-Oriented Markets.
Model A mode-choice model was devised using the framework described in the methodology section. The model determined the probability a person would walk as a function of car ownership, household size, income, distance from the supermarket, usual journey-to-work mode and usual shopping pattern (chain or independent trip). Approximately 90% of respondents walk sometimes, while just over 50% walk always. Given the consistent answer sometimes walking, we determined that more insight would be gained by modeling the probability that someone is a committed walker (i.e., that they always walk to the grocery store).
0%10%20%30%40%50%60%70%80%90%
Less than $20K $20K to $50K $50K to $100K More than $100K
Drive Always Walk Always
0%10%20%30%40%50%60%70%80%90%
Less than $20K $20K to $50K $50K to $100K More than $100K
Drive Always Walk Always

Maley and Weinberger 15
The results of a binary logit model are given in Table 4. Once factors exerting influence have been controlled, the variables that have a negative effect on a respondent’s decision to always walk to the grocery store include increasing distance from the store, number of children (though number of adults in the household is not a factor), access to a car (ownership or car-sharing) and whether the store has a surface parking lot. It also seems to be the case that Black/African-American residents are more likely to drive than their white or other race counterparts.
TABLE 4 Probability of Walking to a Nearby Supermarket a
Variable b B S.E. Exp(B) Significance c,d Distance from store (blocks) -.270 .054 .764 *** Number of children -.230 .129 .794 * Always use the neighborhood store for big shopping trips
.544 .252 1.723 **
Shop on the way home from work .785 .457 2.192 * Pedestrian-oriented design (no surface parking lot)
1.041 .281 2.832 ***
Own one car -2.182 .389 .113 *** Own more than one car -2.610 .477 .074 *** Use car share -1.094 .503 .335 ** Black/African-American -1.092 .465 .335 **
a Only significant variables are shown b Reference variables: non-drivers, other race c *** significant at α = 0.99; ** significant at α = 0.95; * significant at α = 0.90 d Cox and Snell R-squared = 0.278; Nagelkerke R-squared = 0.371
It is not entirely surprising that more people drive to shop when parking is readily available, or that fewer people drive when parking is scarce. A question with a less obvious answer is whether or not a supermarket is disadvantaged by having a low parking supply. To address this issue, the probability that a household shops locally as a function of the same variable set was modeled. That analysis found that the presence or absence of a surface parking lot does not have a statistically significant bearing on whether a person shops always or never at their local store. These results are shown in Table 5.

Maley and Weinberger 16
TABLE 5 Probability Respondent Always Uses Neighborhood Store for Big Trips a
Variable b B S.E. Exp(B) Significance c,d Distance from store (blocks) -.109 .050 .897 ** Number of adults .460 .149 1.584 *** Primary shopper does not work -.653 .377 .520 * Pedestrian-oriented design (no surface parking lot)
-.108 .270 .898
Own one car -1.204 .306 .300 *** Own more than one car -1.801 .437 .165 *** Use car share -.986 .411 .373 ** White .680 .378 1.974 *
a Only significant variables, and pedestrian-oriented design, are shown b Reference variables: non-drivers, other race
c *** significant at α = 0.99; ** significant at α = 0.95; * significant at α = 0.90 d Cox and Snell R-squared = 0.278; Nagelkerke R-squared = 0.371
Neither income, nor the presence or number of children, nor shopping pattern is relevant
to neighborhood store loyalty. Car ownership, employment status and increased distance from the store are all associated with decreased likelihood of always shopping at a local store. The presence or absence of parking was found not to be a significant factor with respect to store loyalty. DISCUSSION AND CONCLUSIONS The results of this survey and modeling effort suggest that surface parking lots at urban supermarkets in Philadelphia, PA induce vehicular access without encouraging increased use of the supermarket among nearby residents. This finding adds to the debate about the impact of urban form on travel decisions and mode choice, but in a unique way that may have limited applicability in other environments. While most past research has examined scales of density, diversity, design and destination accessibility, this study purposefully set those scales aside. This approach was based on the assumption that some of degree of each of those variables is a prerequisite for observing meaningful levels of walking activity. To that end, the study examined only households in neighborhoods of attached row-houses and apartment buildings (density), with significant retail opportunities (diversity), with grided street and sidewalk networks and zero setback (design), and within a half-mile of a supermarket (destination accessibility). Given this general environment, the present study demonstrated that the specific presence or absence of a surface parking lot had a separate statistically significant impact on mode choice.
This study represents a potentially valuable finding for influencing policy (zoning, parking requirements, design guidelines, etc.) but only in a limited set of circumstances. Without similarly positive aspects of urban form already in place (density, diversity, etc.), surface parking lots are less likely to impact mode choice significantly; in fact, their absence may simply inhibit use. But where a majority of nearby residents always walk to the store, the value of including the quantity of surface parking observed in this study is called into question. And given that they don’t induce additional store loyalty among nearby residents, the opportunity costs of such

Maley and Weinberger 17
parking lots may be greater than their perceived value. Lots of such size could accommodate additional households or other retail, business or civic uses, all within less than one block of the supermarket. Since according to our survey, 62.4% of households use their local store always or sometimes for big trips and 88.3% of households use their local store always or sometimes for small trips, additional households could represent a significant pool of additional customers. Furthermore, the modeling effort demonstrated that distance (number of blocks) from stores did have an impact on store loyalty, suggesting that it would be in the best interests of supermarket owners to encourage high density adjacent to store entrances.
Still, there are unanswered questions about supermarket shopping in the market-neighborhoods studied in this research. Because the survey targeted nearby residents rather than all users of a particular supermarket, this research cannot help inform how many customers supermarkets are capturing beyond a half-mile radius. This question might interact with the problem of food deserts. As of 2005, Philadelphia suffered from the second lowest number of supermarkets per capita in an urban area, with an acute lack of access in lower income neighborhoods outside of the center of the city (26). The pedestrian-oriented markets in this study are all located within wealthy or gentrifying districts near the center of the city. In these areas, most residents live within a half-mile of a supermarket. Meanwhile, the automobile-oriented markets are located in neighborhoods further from the center of the city. While these neighborhoods are not necessarily less dense (all are comprised predominantly of row houses), their residents do not all enjoy supermarkets within a half-mile. Lower accessibility may increase the catchment area of these auto-oriented supermarkets and raise the value of large parking lots, despite the fact that nearby households have higher proportions of residents who never drive (26.1%) than households near pedestrian-oriented markets (13.8%).
These findings are applicable only in urban environments, which is in a sense a limitation. The study is also limited by the size and nature of the survey sample. Response rates were especially low from auto-oriented market-neighborhoods, which also tended to be lower income and have higher vacancy. Vacancy rates vary widely across the sampled market-neighborhoods, and that likely has an impact on decisions to walk. While the quasi-experimental methodology of this study sought identical environments in which to study the influence of surface parking lots, the reality of such research is a limited pool of potential subjects.
Future research should combine approaches by analyzing samples of nearby households as well as shoppers at a particular supermarket to develop a richer understanding of overall use patterns in urban environments. As the pedestrian-oriented markets in this study were associated with higher income neighborhoods (two of which might be considered gentrifying), future research could examine the role of land value in supermarket design or how supermarkets of different designs contribute to economic development. Data on the financial implications and outcomes for such supermarkets could add an interesting dimension. Future studies could also examine the impact of surface parking lots on other trip types. Food shopping is a useful topic to examine because nearly every household does it. However, in urban environments, the patterns of other trips may be similarly influenced by the presence or absence of surface parking lots.

Maley and Weinberger 18
ACKNOWLEDGEMENTS The authors wish to thank Professor Amy Hillier of the University of Pennsylvania for her assistance in underwriting the survey and for thoughtful comments on an earlier draft. We would also like to thank the participants of the University of Pennsylvania Advanced Transportation Seminar of 2009: Susan Dannenberg, Carolyn Johnson, Alexandra Malikova, Linda Meckel, Devin Plantamura, Matthew Rufo, Matthias Sweet, Nikki Thorpe and Christopher Witt for their insight and encouragement.

Maley and Weinberger 19
REFERENCES
1. Amado, A. Empirical Data Collection, Field Work, and Analysis: Analysis of the Potential Factors Influencing Grocery Shopping Trip Mode Choice. The McNair Scholars Journal of the University of Washington, Vol. 6, 2006, pp. 22-52.
2. Bawa, K. and Ghosh, A. A Model of Household Grocery Shopping Behavior. Marketing Letters, Vol. 10, No. 2, 1999, pp. 149-160.
3. Bell, D., Ho, T., and Tang, C. Determining Where to Shop: Fixed and Variable Costs of Shopping. Journal of Marketing Research, Vol. 35, 1998, pp. 352-369.
4. Clifton K. Mobility Strategies and Food Shopping for Low Income Families: A Case Study. Journal of Planning Education and Research, Vol. 23, 2004, pp. 402-413.
5. Cude, B. and Morganosky, M. Why Do Consumers Cross-Shop Between Different Types of Food Retail Outlets? Journal of Food Distribution Research, Vol. 32, No. 2, 2001, pp. 14-23.
6. Dellaert, B., Arentza, T., and Timmermans, H. Shopping Context and Consumers’ Mental Representation of Complex Shopping Trip Problems. Journal of Retailing, Vol. 84, No. 2, 2008, pp. 219-232.
7. Handy, S. and Clifton, K. Local Shopping as a Strategy for Reducing Automobile Travel. Transportation, Vol. 28, 2001, pp. 317-346.
8. Jetter, K. and Cassady, D. The Availability and Cost of Healthier Food Alternatives. American Journal of Preventive Medicine, Vol. 30, No. 1, 2006, pp. 38-44.
9. Powell, L., Slater, S., Mirtcheva, D., Bao, Y. and Chaloupka, F. 2007. Food Store Availability and Neighborhood Characteristics in the United States. Preventive Medicine, Vol. 44, 2007, pp. 189-195.
10. Reutter, T. and Teller, C. Store Format Choice and Shopping Trips. International Journal of Retail and Distribution Management, Vol. 37, No. 8, 2009, pp. 695-710.
11. Yoo, S., Baranowski, T., Missaghian, M., Baranowski, J., Cullen, K., Fisher, J., Watson, K., Zakeri, I., and Nicklas, T. Food-Purchasing Shopping Patterns for Home: A Grocery Store-Intercept Survey. Public Health Nutrition, Vol. 9, No. 3, 2005, pp. 384-393.
12. Cao, X. Disentangling the Influence of Neighborhood Type and Self-Selection on Driving Behavior: An Application of Sample Selection Model. Transportation, Vol. 36, 2009, pp. 207-222.
13. Cao, X., Handy, S., and Mokhtarian, P. The Influences of the Built Environment and Residential Self-Selection on Pedestrian Behavior: Evidence from Austin, TX. Transportation, Vol. 36, 2006, pp. 1-20.
14. Cao, X., Mokhtarian, P., and Handy, S. Do Changes in Neighborhood Characteristics Lead to Changes in Travel Behavior? A Structural Equations Modeling Approach. Transportation, Vol. 34, 2007, pp. 535-556.
15. Cao, X., Mokhtarian, P., and Handy, S. Examining the Impacts of Residential Self-Selection on Travel Behavior: A Focus on Empirical Findings. Transport Reviews, Vol. 29, No. 3, 2009, pp. 359-395.
16. Cao, X., Mokhtarian, P., and Handy, S. The Relationship between the Built Environment and Nonwork Travel: A Case Study of Northern California. Transportation Research Part A: Policy and Practice, Vol. 43, No. 5, 2009, pp. 548-559.

Maley and Weinberger 20
17. Chatman, D. Residential Choice, the Built Environment, and Nonwork Travel: Evidence Using New Data and Methods. Environment and Planning A, Vol. 41, No. 5, 2009, pp. 1072-1089.
18. Ewing, R. and Cervero, R. Travel and the Built Environment. Journal of the American Planning Association, Vol. 76, No. 3, 2010, pp. 265-294.
19. Frank, T., Bradley, M., Kavage, S., Chapman, J., and Lawton, T. Urban Form, Travel Time, and Cost Relationships with Tour Complexity and Mode Choice. Transportation, Vol. 35, 2008, pp. 37-54.
20. Handy, S. Urban Form and Pedestrian Choices: Study of Austin Neighborhoods. In Transportation Research Record: Journal of the Transportation Research Board, No. 1552, Transportation Research Board of the National Academies, Washington, D.C., 1996, pp. 135-144.
21. Rajamani, J., Bhat, C., Handy, S., Knapp, G., and Song, Y. Assessing Impact of Urban Form Measures on Nonwork Trip Mode Choice after Controlling for Demographic and Level-of-Service Effects. In Transportation Research Record: Journal of the Transportation Research Board, No. 1831, Transportation Research Board of the National Academies, Washington, D.C., 2003, pp. 158-165.
22. Van der Waerden, P., Borgers, A., and Timmermans, H. The Impact of the Parking Situation in Shopping Centers on Store Choice Behavior. GeoJournal, Vol. 45, 1998, pp. 309-315.
23. Frank, L. and Levine, J. Transportation and Land-Use Preferences and Residents’ Neighborhood Choices: The Sufficiency of Compact Development in the Atlanta Region. Transportation. Vol. 34, 2007, pp. 255-274.
24. Domencich, T. and McFadden, D. Urban Travel Demand: A Behavioral Analysis. A Charles River Associates Research Study. North-Holland Publishing Company, Amsterdam, 1975.
25. Ben-Akiva, M. and Lerman, S. Discrete Choice Analysis: Theory and Application to Travel Demand. MIT Press, Cambridge, MA, 1985.
26. The Food Trust and the Philadelphia Health Management Corporation. Food Geography: How Food Access Affects Diet and Health. http://www.thefoodtrust.org/pdf/Food%20Geography%20Final.pdf. Accessed Aug. 1, 2010.