Food Security, Food Assistance Program Participation and Diet
117
University of Connecticut DigitalCommons@UConn Master's eses University of Connecticut Graduate School 5-3-2012 Food Security, Food Assistance Program Participation and Diet Quality Among Food Pantry Participants in the North End of Hartford Julie L. Menounos Julie Menounos, [email protected] is work is brought to you for free and open access by the University of Connecticut Graduate School at DigitalCommons@UConn. It has been accepted for inclusion in Master's eses by an authorized administrator of DigitalCommons@UConn. For more information, please contact [email protected]. Recommended Citation Menounos, Julie L., "Food Security, Food Assistance Program Participation and Diet Quality Among Food Pantry Participants in the North End of Hartford" (2012). Master's eses. 252. hp://digitalcommons.uconn.edu/gs_theses/252
Transcript of Food Security, Food Assistance Program Participation and Diet

University of ConnecticutDigitalCommons@UConn
Master's Theses University of Connecticut Graduate School
5-3-2012
Food Security, Food Assistance ProgramParticipation and Diet Quality Among Food PantryParticipants in the North End of HartfordJulie L. MenounosJulie Menounos, [email protected]
This work is brought to you for free and open access by the University of Connecticut Graduate School at DigitalCommons@UConn. It has beenaccepted for inclusion in Master's Theses by an authorized administrator of DigitalCommons@UConn. For more information, please [email protected].
Recommended CitationMenounos, Julie L., "Food Security, Food Assistance Program Participation and Diet Quality Among Food Pantry Participants in theNorth End of Hartford" (2012). Master's Theses. 252.http://digitalcommons.uconn.edu/gs_theses/252

Food Security, Food Assistance Program Participation and Diet Quality Among Food Pantry Participants in the North End of Hartford
Julie L. Menounos RD
B.S., Syracuse University, 2009
A Thesis
Submitted in Partial Fulfillment of the
Requirements for the Degree of
Master of Science
at the
University of Connecticut
2012

ii
APPROVAL PAGE
Master of Science Thesis
Food Security, Food Assistance Program Participation and Diet Quality Among Food Pantry Participants in the North End of Hartford
Presented by
Julie L. Menounos, RD, BS Major Advisor ____________________________________________________
Valerie Duffy PhD, RD Research Advisor _________________________________________________
Katie S. Martin PhD Associate Advisor ________________________________________________
Tina Fox Dugdale MS, RD, RN, CD-N Associate Advisor__________________________________________________
Heather Peracchio MS, RD, CD-N
University of Connecticut
2012

iii
ACKNOWLEDGMENTS
This thesis represents guidance and collaboration I received from my
advisory committee and research team. Thank you to Dr. Katie Martin, Dr.
Valerie Duffy, Tina Dugdale and Heather Peracchio for all your insight, expertise
and support in this process.
I am especially grateful for Dr. Katie Martin and the food pantry research
team, Jeanette Goyzueta, MJ Counsilman, Erika Illyes, Jonathan Mitchell and
Kate Robaina, for embracing me in their efforts. This research would not be
possible without all of your diligence and hard work. Katie, I truly admire your
research with food pantries and efforts to help better underserved communities. I
also want to thank the food pantry staff for being open and welcoming to our
research, and the food pantry clients for their valuable insight.
I would like to thank all of the Department of Allied Health Sciences at the
University of Connecticut for their kindness and professionalism. Valerie, thank
you for providing me with the opportunity to serve as a graduate assistant and
SNAP-Educator. This program has guided me through to experiences to grow
personally, academically and professionally. Tina, thank you for all your positive
energy, advice and playfulness each day that kept me motivated and eager to
learn. Heather, thank you for being my mentor since my first rotation as an intern.
I am so appreciative for your continuous support, guidance and passion for
nutrition. You and Tina have been role models that drive me to be a better
community dietitian. Kristen and Sarah, thank you for making UConn feel a little
more like home and for your company, conversation and support in Koons Hall!

iv
Lastly I thank all my family for their love and support. Mom and Mike,
thank you for encouraging me to pursue my Masters. Josh, thank you for being
so supportive of my academics and always having my best interest at heart. Your
words and visits to Connecticut helped get me through the year.

v
TABLE OF CONTENTS Acknowledgements............................................................................................... iii Abstract................................................................................................................. vi
Introduction ............................................................................................................1
Study Aim ..............................................................................................................4
Background............................................................................................................5
Food Security..............................................................................................5
Food and Nutrition Assistance Programs .................................................15
Food Pantry Clientele ...............................................................................19
Diet Quality Assessment and U.S. Surveillance .......................................21
Freshplace Food Pantry Intervention…………….………………………….38
Research Question and Hypothesis ....................................................................43
Methods ...............................................................................................................44
Survey Instruments ...................................................................................45
Statistical Analysis ....................................................................................50
Results.................................................................................................................52
Sample Characteristics at Baseline ……………………………………..….52
Three-Month Changes Among Freshplace and Control ...........................60
Discussion ...........................................................................................................67
Implications..........................................................................................................77
Limitations............................................................................................................80
Conclusion ...........................................................................................................82
Appendix..................................................................................................................
1. Questions Used to Assess the Food Security of Households in the CPS
Food Security Survey................................................................................84
2. Evaluating Freshplace Survey Version 5.1 ...........................................85
References ..........................................................................................................98

vi
ABSTRACT
Objective: To examine the association between food security, participation in
food assistance programs and diet quality among food pantry users in Hartford,
Connecticut. Design: Observational analysis of baseline data from a randomized
control trial. Randomized control study design using pre-post test surveys with
repeated measures at baseline and 3 months follow-up. Participants: All study
participants were over 18 years old; a resident of one of three Hartford zip codes
(06105, 06112, 06120); spoke English; and receive food from a Hartford food
pantry. Only one participant in each household was allowed to enroll. Two
hundred and twenty six food pantry users recruited from two food pantries in the
North End of Hartford. Intervention: Data was collected from July 2010 to June
2011 as part of an evaluation of Freshplace. Freshplace is a new client choice
food pantry and community-based project developed by the Chrysalis Center,
Foodshare, the Junior League of Hartford, and researchers at the University of
Connecticut. The Freshplace program allows participants access to fresh food at
the pantry once every two weeks, individualized meetings with a Case Manager
and referral services tailored to help meet their goals of becoming more food
secure and self-sufficient. The control group was instructed to continue their
usual routine in using food pantries around Hartford to obtain food. Main
Outcomes: Food security measured using the 18-item United States Department
of Agriculture (USDA) Food Security Module, participation in food assistance
programs, and diet quality measured by the Block Rapid Food Screener.
Results: At baseline 85% of food pantry participants were food insecure (low or
very low food security) indicating that only 15% were food secure (high or

vii
marginal food security). The three most used food assistance programs were
Supplemental Nutrition Assistance Program (SNAP), food pantries and soup
kitchens. Overall findings showed that food pantry users had diets “very high” in
fat intake and lacking in fruits and vegetables (80% consuming <5 servings/day).
Changes in baseline to three months were assessed between the randomized
food pantry users at Freshplace (n =112) and in the control (n= 114). Over three
months, 22% of Freshplace participants moved from food insecure to food
secure status and 7 new households were enrolled in SNAP. When analyzing
diet quality, Freshplace participants had a greater average intake of fruits and
vegetables, but higher fat and snack intake (higher total fat, saturated fat and
cholesterol) than the control group. Average dietary fiber intake in both groups
was below recommended levels. When assessing daily micronutrient intakes,
Freshplace participants had greater average intakes of vitamin C and
magnesium compared to the control group. Significant differences (p = <.05) for
change in dietary intake were found for fruit and vegetable intake, dietary fiber,
vitamin C, and magnesium in both groups. Conclusion: Food pantry users in
Hartford are at risk for food insecurity, nutritional deficiencies, high fat intake and
overweight/obesity. They also have low participation in eligible food assistance
programs. Participants involved at Freshplace for 3 moths had greater changes
for fruit and vegetable intake and SNAP enrollment, when compared to the
control group. Freshplace may serve as a model for improving the food security
and nutritional status of food pantry users in other communities. Further
examination of food security, diet quality and participation in food assistance

viii
programs is needed in areas where residents rely on food pantries to meet food
needs.

1
INTRODUCTION
Despite the wealth and abundance of food in the U.S., some adults,
families and children struggle to put food on the table each day. According to the
USDA Food Assistance and Nutrition Research Report, while most U.S
households in 2010 reported food security (85.5%), a minority of households
(14.5%) reported experiencing food insecurity some time during the year,
including limited access to adequate food due to lack of money and other
resources (Coleman-Jensen et al, 2011). Food insecurity negatively impacts
nutritional and non-nutritional outcomes throughout one’s life including increased
risk of chronic disease, poor social skills and academic development,
physiological stress and nutrient deficiencies (Cook et al, 2004; Jyoti el al, 2005;
Rose, 1999; Tarasuk et al, 1999).
Federal (public) food assistance programs act as the first line of defense
in preventing health issues from emerging within low-income households by
enhancing their food purchasing power and nutritional status. The largest public
assistance programs include: The Supplemental Nutrition Assistance Program
(SNAP formerly known as food stamps); the Special Supplemental Nutrition
Program for Women, Infants and Children (commonly referred to as WIC); and
many child nutrition programs such as the National School Lunch Program and
School Breakfast Program (USDA, 2011). Despite the high number of individuals,
families and children whom are eligible to receive benefits from federal food
assistance programs such as SNAP or WIC, there is a gap in the number of
those enrolled.

2
Private food assistance programs referred to as Emergency Food
Assistance System (EFAS), compliment food provided by public assistance
programs and include food banks, food pantries, soup kitchens and shelters.
Feeding America is the nation’s leading domestic hunger-relief charity that has a
network of more than 200 food banks in all 50 states. These food banks secure
and distribute more than three billion pounds of food and grocery products to
more than 61,000 local charitable agencies that provide food directly to
individuals and families in need (Feeding America, 2010).
Despite these public and private efforts, individuals who are food insecure
have elevated risk of poor dietary quality. Dietary quality is defined by the Dietary
Guidelines for Americans and USDA’s MyPlate (created as a supplement to
MyPyramid) (USDA, 2010). According to an NHANES analysis, fewer than 1 in
10 Americans meet energy-specific fruit or vegetable recommendations
(Kimmons et al, 2009). The numbers become even smaller for high-risk
populations such as low-income and ethnic individuals. Research has shown that
income and food security level can affect overall health and diet quality (Cook et
al, 2004; Duffy et al 2009, Mello et al, 2010).
Food pantry clients generally have high levels of food insecurity, obesity
and poor diet quality (Duffy et al, 2009). Individuals who rely on food pantries
have limited access and resources to purchase food items, specifically fresh
fruits and vegetables, lean meats, whole grains and low-fat dairy products (Algert
et al 2006). Unfortunately, highly processed items with added sugar, salt and fat
are more available and affordable than the recommended healthy items

3
(Drewnowski et al, 2005). The oversized portions and convenience of low cost
foods, in addition to low satiating factors, may be a culprit for overeating and
weight gain among low-income and food insecure populations (Algert et al, 2006;
Drewnowski et al, 2005). Food pantry use is especially high among low-income
households, particularly Black and Hispanic households, those with children
headed by single women, those living in cities of metropolitan and
nonmetropolitan areas, and households in the Midwest and West (Nord et al,
2010).
In response to chronic rates of food insecurity and poor diet quality, a new
food pantry called Freshplace was established in 2010. Freshplace is an
innovative fresh food pantry and resource collaborative located on Homestead
Avenue in Hartford, Connecticut and was founded by the Chrysalis Center, the
Junior League of Hartford, and Foodshare. This pantry was established to foster
long-term food security and self-sufficiency among residents of the Upper Albany
neighborhood in Hartford through offering fresh produce and individualized case
management. Freshplace is designed to include a supermarket client-choice food
pantry, which allows participants to self-select food items that are suitable to their
taste, family and cultural needs. Freshplace clients also meet monthly with a
Project Manager to receive individualized case management. To evaluate
Freshplace, the three founding community agencies have partnered with
researchers at the University of Connecticut.

4
Study Aim
The aim of this thesis is to identify some of the characteristics and
nutritional concerns related to food insecurity among a sample of food pantry
clients, including Freshplace clients. Specifically identified were the relationships
between food security (measured by the USDA Food Security Module),
participation in food assistance programs, and dietary quality (fruit and vegetable,
meat and snack, and fiber consumption measured by the Block Rapid Food
Screener, Block et al, 2000). In addition, this thesis included a pre- post test
comparison between participants of Freshplace versus control participants from
another traditional food pantry over 3 months for food security and dietary quality.
The data for this research were gathered at baseline and then three
months, as part of a larger longitudinal evaluation of Freshplace that spans 18
months. The data and findings from this research will be shared and utilized by
three community partners and academic audiences concerned about food
insecurity. Considering there is a food pantry in nearly every community
throughout the U.S., the information generated by this thesis and the evaluation
of Freshplace can easily be translated to the larger public. The findings will give
food donors a better understanding of food pantry users and their dietary
challenges.

5
BACKGROUND Food Security
Food security refers to a household’s access and availability to an
adequate food supply. Food security is considered one of several conditions
needed for a population to be healthy and well nourished. By USDA definition,
food security is the access by people, at all times, to enough food for an active,
healthy life and includes at a minimum, availability of nutritionally adequate and
safe foods, and the ability to acquire food without resorting to emergency food
supplies (Anderson, 1990; Bickel et al, 2000). Food insecurity occurs when there
is limited or uncertain availability of nutritionally adequate and safe foods or
results in acquiring food in socially unacceptable ways such as scavenging,
stealing or other coping strategies (Anderson, 1990).
Since 1995, the USDA has annually collected information for the U.S.
population on food spending, food access and adequacy, sources of food
assistance, and measured food security using the 18-item USDA Food Security
Module. The Module is conducted as a supplement to the nationally
representative Current Population Survey (CPS) (Nord et al, 2010). The Module
asks one adult respondent in each household a series of questions about
experiences and behaviors that indicate food insecurity, such as being unable to
afford balanced meals, cutting the size of meals because of too little money for
food, or being hungry because of too little money for food (Appendix 1). The
household food security status of each interviewed household is determined from
the number of reported food-insecure conditions and behaviors that distinguishes

6
households having difficulty meeting basic food needs. Food-insecure conditions
are indicated by affirmative responses to questions.
Food insecurity varies through a continuum of successive experiential and
behavioral stages as food-insecure conditions become more severe. Each stage
consists of characteristic conditions and experiences of food insufficiency to fully
meet the basic needs of household members and of the behavioral responses of
household members (Bickel et al, 2000). The USDA uses the following food
security classifications:
High Food Security: Households with minimal to no evidence of food
insecurity. These households report experiencing no food-insecure conditions.
Marginal Food Security: Households reporting “yes” to one or two food-
insecure conditions with little or no indication of change to members’ food intake.
Household members are concerned about adequacy of the household food
supply and in adjustments to household food management, including reduced
quality of food and increased unusual coping patterns.
Low Food Security: Households reporting multiple food-insecure
conditions. These households report reduced quality, variety or desirability of
their diet. Food intake for adults in the household has been reduced to an extent
that implies repeated physical sensations of hunger. In most (but not all) food
insecure households with children, such reductions are not observed at this
stage for children.
Very Low Food Security: Households without children report six or more
food-insecure conditions, while households with children report eight or more

7
food-insecure conditions, including conditions among both adults and children.
These households have disrupted eating patterns and reduce food intake among
one or more household members because of insufficient money and other
resources for food. At this level, adults in households with and without children
repeatedly experience more extensive reductions in food intake. Children of
these households have reduced food intake to an extent indicating hunger and
for some other households with children, this occurred at the previous stage
(Bickel et al, 2000).
The categories of high and marginal food secure categories are combined
into “food secure,” and low and very low food secure categories may be
combined into one category called “food insecure” (FRAC, 2009).
Prior to 2006, households with “low food security” were described as “food
insecure without hunger” and households with “very low food security” were
described as “food insecure with hunger” (Nord et al, 2010). By recommendation
of the Committee on National Statistics, the USDA changed the terminology used
to describe food security status by eliminating “hunger” from the new
classifications to distinguish the physiological state of hunger from indicators of
food availability (Mabli et al, 2010). As these definitions imply, hunger and
undernutrition may occur as a result of food insecurity, depending on its severity
and duration (Cook et al, 2004). The classification of households into three levels
and the word “hunger” in the food security questionnaire remained the same,
while the word “hunger” was removed from the description of the survey results.

8
Prevalence of Food Insecurity in the United States
In 2010, one in five Americans struggled with “food hardship” (FRAC,
2011). Findings from the 2010 CPS indicated that 48.8 million Americans,
consisting of 32.6 million adults and 16.2 million children, lived in food insecure
households (Coleman-Jensen et al, 2011). The percent of food insecure
households remained essentially unchanged from 2008 (14.6%) to 2009 (14.7%)
to 2010 (14.5%), and was at the highest recorded level in 2009 since the first
CPS Food Security Supplement data was collected in 1995. However, the
prevalence of very low food security showed a statistically significant decline
from 2009 (5.7%) to 2010 (5.4%). Shown in Figure 1 about one-third of all food
insecure households experienced very low food security (6.4 million households),
the most severe level of food insecurity in 2010 (Coleman-Jensen et al, 2011).
Most commonly, very low food secure households experienced the condition in 7
months of the year, for a few days in each month.
Figure 1. U.S. households by food security status, 2010 (Coleman-Jensen et
al, 2011)

9
Rates of food insecurity in 2010 were substantially higher than the national
average among households with incomes near or below the Federal poverty line
(33.8%), among households with children (20.2%), especially households
headed by single women (35.1%), or single men (25.4%), and among Black non-
Hispanic (25.1%) and Hispanic households (26.2%). Among households with
children, those headed by a married couple showed the lowest rate of food
insecurity (13.8%). In 2010, the statistically significant decline in very low food
security was greatest for households with children, women living alone and
households with annual incomes below 185% of the poverty line (Coleman-
Jensen et al, 2011). Food insecurity was more common in large cities and rural
areas than in suburbs and other outlying areas surrounding large cities.
Children were food insecure at anytime during 2010 in 3.9 million
households (9.8% of households with children), a decline from 10.6 percent in
2009 (Coleman-Jensen et al, 2011). These households showed difficultly in
providing nutritionally adequately meals for their children. Although children are
usually shielded from disrupted eating patterns and reduced food intake, children
along with adults experienced instances of very low food security in 1.0 percent
of households with children (386,000 households) in 2010, essentially
unchanged from 1.2 percent in 2009 and 1.3 percent in 2008 (Coleman-Jensen
et al, 2011; Nord, et al, 2010). The characteristics of households with food-
insecure and very low food secure children was most prevalent among female-
headed households, Black, non-Hispanic and Hispanic households, households

10
with incomes below 185% of the poverty line and those within principal cities of
metropolitan areas.
Prevalence of Food Insecurity in the Northeast
The presence of food insecurity varies considerably from each geographic
region and within each state. Of all regions, the Northeast has held the lowest
rates for food insecurity (12.4%) compared to the South (16%). In 2010, 17.9%
(1,201 households) of households with children in the Northeast were food-
insecure. Of those food-insecure households with children, 8.6% experienced
low food security and 0.7% experienced very low food security (Coleman-Jensen
et al, 2011). Although Connecticut is one of the wealthiest states in the nation, it
has one of the highest rates of income disparity, which is associated with health
risks, food insecurity and hunger. Food insecurity in Connecticut should not be of
great concern yet of the 1.4 million households in 2010, 172,000 (12.7%) of
households were food insecure, 66,000 (4.8%) of those households considered
to have very low food security (FRAC, 2010). Prior to the recession, the
Connecticut Food Bank surveyed food pantry and soup kitchen clients who
revealed that 42% had to choose between food or utilities, 34% had to choose
between food or rent and 30% had to choose between food or medical care
(Connecticut Food Bank, n.d.)
Causes of Food Insecurity
While there are many underlying factors related to food security, poverty
has been strongly associated with food insecurity and hunger in the U.S. (Boyle
et al, 2006; Coleman-Jensen et al, 2011). Food insecurity results from financial

11
constraint leading to a decrease in food budget. More specifically, food
insufficiency refers to an inadequate amount of food intake due to resource
constraint (Jyoti et al, 2005). In the most basic sense, households experience
food insecurity when their resources are inadequate to obtain "enough food" to
meet basic needs. In 2009, food insecurity was four times more prevalent when
households had an annual income below 185% of the federal poverty guideline
as compared to households above that level (Nord et al, 2010). Nearly 9% of
Connecticut residents live in poverty (U.S. Census, 2011). Of the 9,248 residents
living in the Upper Albany neighborhood, where Freshplace is located, 32.5% are
living below the poverty level, even higher than the city’s overall rate (City Data,
2011). In 2009, the median household income among Upper Albany residents
was $27,396 (City Data, 2011).
The causes of food insecurity are complex and extend beyond insufficient
income. Not all food insecure households live in poverty, and not all households
living in poverty are food insecure. Using data from the Current Population
Survey, 20% of food insecure households had midrange or high incomes (Nord
et al, 2002). A diverse and extensive range of barriers impede procurement of
adequate food such as financial constraints associated with income and job loss,
the high cost of a nutritious diet, and limited access to large stores with more
variety and lower prices (Mabli et al, 2010). Low-income individuals often live in
fragile situations where one event can trigger a stress on the household budget,
which forces households deeper into poverty thus becoming food insecure. Food
insecure households are much more likely to have experienced recent events

12
that stress household budgets, such as losing a job, gaining a household
member or losing food assistance benefits (Biggerstaff et al, 2002; Rose, 1999).
These life events may burden the household budget, which may not be
accurately captured in annual income measures (Nord et al., 2005).
Very low food security, resulting in reduced food intake and disrupted eating
patterns, is usually occasional or episodic and not usually a chronic problem.
When interpreting food security measures it is important to note that the
questions used to assess household’s food security status ask whether a
condition, experience, or behavior occurred at any time in the past 12 months,
and households can be classified as having very low food security based on a
single, severe episode during the year. Therefore, it is possible that a single
episode of food insecurity in the last year could classify the household as food
insecure (Nord et al, 2010).
Coping Strategies Among Food Insecure Households
Households experiencing limited resources and difficulty meeting their
food needs utilize a variety of coping strategies to help supplement the food they
purchase. Food acquisition and management coping strategies are practices
used to obtain food and maintain their food supply after it is acquired, thus
avoiding food insecurity and food insufficiency (Kempson et al, 2003).
Households can reduce food expenses when income levels fall. Based on
the USDA Economic Resource System analysis, the typical U.S. household
spent $43.75 per person each week for food in 2010 (Coleman-Jensen et al,
2011). As expected, households with higher incomes spend more money on food

13
than lower income households. When comparing households of similar size and
composition, the typical food-secure household spent 27% more on food than the
typical food-insecure household (Coleman-Jensen et al, 2011; Kaufman et al,
1997). Households utilized a combination of stores, discount coupons, and sales
to obtain foods and ingredients. Ways of stretching foods at home include
preparing food in bulk, utilizing leftovers, freezing food for later use, using food
substitutions such as powdered milk for fresh, reducing or omitting unaffordable
ingredients such as meats, increasing amount of inexpensive and filling
ingredients such as potatoes and rice (Hoisington et al, 2002).
Individuals use support system members to acquire food and maintain
food sufficiency according to semi-structured interviews with SNAP program
users in New Jersey regarding food management practices (Kempson et al,
2003). These support systems included pooling together food with others to
make a meal, utilizing company donations of food to needy employees, trusting
in God to make it through tough times, and receiving general help from others
such as parents, family members, and neighbors to assist with food sufficiency
maintenance (Kempson et al, 2003). More desperate coping strategies were
used as food becomes scarce and other problems become more apparent in the
household. More severe reported strategies include selling one’s blood,
salvaging road kill, participating in research and committing crimes with the intent
to be sent to jail. In more rural areas, individuals also rely on gardening, fishing
and hunting to acquire food (Kempson et al, 2003).

14
While a portion of individuals and households adopt cost-saving practices,
such as buying products that are on sale and buying products in bulk, many low-
income households find it necessary to rely on an extensive network of public
and private emergency food providers to maintain an adequate food supply.
Findings from the 2010 CPS indicated that, in the previous month, 59% of food-
insecure households reported participation in at least one or more of the three
largest Federal food and nutrition assistance programs—Supplemental Nutrition
Assistance Program (formerly Food Stamp Program); the National School Lunch
Program; and the Special Supplemental Nutrition Program for Women, Infant and
Children (WIC) (Coleman-Jensen et al, 2011) shown in Table 1.
Table 1. Participation of food-insecure households in selected Federal food and nutrition assistance programs 2010 (Coleman-Jenson et al, 2011)
SNAP (Supplemental Nutrition Assistance Program) was formerly called the Food Stamp Program
WIC is the Special Supplemental Nutrition Assistance Program for Women, Infants and Children.
In 2009, 4.8 percent of all U.S. households (5.6 million households) accessed
emergency food from a food pantry one or more times (Nord et al, 2010). In
2009, food insecure (low food security or very low food security) households

15
were 15 times more likely than food-secure households to have obtained food
from a food pantry (Nord et al, 2010).
Federal Food and Nutrition Assistance Programs
In response to hunger and food insecurity, the USDA Food and Nutrition
Service (FNS) established and currently regulates a network of 15 domestic food
and nutrition assistance programs. Starting in the 1930’s and largely created in
the 1960’s and 1970’s, these programs act as a “safety net” in addressing the
needs of food insecure populations by providing access to food, a healthful diet
and nutrition education. In 2009, the United States spent more than $90 billion on
nutrition assistance programs for the U.S. population (Andrews, 2010). Below is
a brief review of the three largest programs in order of participation and U.S.
expenditure.
The Supplemental Nutrition Assistance Program (SNAP) formerly
called the Food Stamp Program was first developed to help distribute excess
farm commodities and boost farmers’ income during the Great Depression, and
then was reestablished as a permanent program in 1964. The program provides
monthly benefits for eligible low-income households to purchase approved food
items at authorized food retailers. Clients qualify for the program based on
available household income, assets and various living expenses. SNAP aims to
help prevent household food insecurity and its consequences by helping low-
income households obtain a more nutritious diet by increasing their purchasing
power and lack of nutrition knowledge (USDA: FNS, 2012). In 2010, the program
benefited 40.3 million (13% of individuals) people in the United States (Coleman-

16
Jensen et al, 2011). Through the electronic benefit transfer system (EBT), the
use of food “stamps” is no longer the means in which a client receives their
benefits. EBT replaces the paper coupons through use of a benefits card, similar
to a bankcard. Eligible households are provided with cash equivalents, called
allotments, equal to about 70% of their estimated food budget to purchase food
intended to be prepared at home (Frongillo et al, 2006). The maximum monthly
allotment for a household of four is $668 (USDA: FNS, 2012). In 2010, the
average benefit was $134 per person per month, and total Federal program
expenditures were $68.2 billion (Coleman-Jensen, et al 2011).
The National School Lunch Program (NSLP) was established under the
National School Lunch Act, signed into law by President Harry Truman in 1946
after over 100 years of research and evaluation for the best practices in food and
nutrition service for millions of American school children. The program was
started because many young men were considered unfit to serve in the military
because they were malnourished (USDA: FNS, 2012). The NSLP is a federally-
assisted meal program, which operates in over 101,000 public and nonprofit
private schools and residential child-care institutions. In 2010, the program
provided lunches to an average of 31.6 million children each school day
(Coleman-Jensen et al, 2011). Based on household income, children are eligible
for free meals (income up to 130% of poverty), reduced-price meals (income
from 130 – 185% of poverty), or pay full price. All meals served receive Federal
subsidies for nutritionally balanced lunches. Fifty-six percent of the lunches
served in 2010 were free, and an additional 10% were provided at reduced prices

17
(Coleman-Jensen et al, 2011). Since the modern program began, more than 219
billion lunches have been served (USDA: FNS, 2012).
The Special Supplemental Nutrition Program for Women, Infant, and
Children known as WIC, was created in 1974 as a response to the widespread
hunger and poverty and the dangerous consequences of inadequate nutrition to
pregnant women, new mothers, infants and children. WIC is a preventive
nutrition program that provides grants to States to support the distribution of
supplemental foods, health-care referrals, and nutrition education for low-income
pregnant, breastfeeding, and non-breastfeeding postpartum women, and their
infants and children who are younger than 5 years of age and are at nutritional
risk (USDA: FNS, 2012). The goal of WIC is to prevent nutrition-related health
problems from developing. Each month in 2009, more than 9.1 million
individuals, consisting of 2.2 million women, 2.2 million infants and 4.7 million
children, relied on benefits received from the WIC program with an average
monthly cost of $42 per person (Food Research and Action Center, 2010;
Oliveria, 2010; Nord et al, 2010). Most State WIC programs provide participants
with vouchers to acquire supplemental food packages at authorized food
retailers. In 2009, the USDA issued new regulations for an improved WIC food
package to increase the health and nutritional quality of the foods in the program,
increase participants’ choices, and expand cultural food options. The new
package offers fruits and vegetables, whole grain rice, bread or tortillas, and the
option of soymilk and tofu (USDA: FNS, 2012).

18
Private Food and Nutrition Assistance Programs
To address local food needs, private food assistance programs are often
supported or operated in communities by charities, nonprofit and often faith-
based organizations. These locally based agencies rely heavily on volunteers to
help provide food directly or indirectly to help meet the nutritional needs of
America’s low-income population. Emergency food programs include food banks,
food pantries, soup kitchens, and emergency shelters serving clients with short-
term or emergency assistance. They are designed to distribute food on a short-
term or emergency basis until clients are able to meet their own needs. Food
pantries and soup kitchens are the main direct providers of emergency food
assistance representing 33,500 food pantries, 4,500 soup kitchens and 3,600
emergency shelters in the U.S. (Mabli et al, 2010).
Food banks are charitable organizations that solicit, receive, inventory,
store and distribute donated food and grocery products to charitable agencies
that directly serve needy clients. Food banks are the most important source of
food for agencies with emergency food providers, accounting for 75% of the food
distributed by pantries, 50% distributed by kitchens, and 41% distributed by
shelters (Mabli et al, 2010).
Food banks obtain their food from a variety of sources such as the food
industry, religious organizations, direct purchases from wholesalers and retailers,
and the federal government through The Commodity Supplemental Food
Program and the Emergency Food Assistance Program (TEFAP) (USDA: FNS,
2012). In 2009, TEFAP supplied 852 million pounds of commodities to
19
community emergency food providers. Over half of all food pantries and
emergency kitchens received TEFAP commodities in 2000, and these
commodities accounted for about 14% of all food distributed by them (Nord et al,
2010).
Food pantries, also called food shelves, traditionally distribute a limited
amount of unprepared foods and other grocery products for clients to prepare
and use these items where they live. Along with variation in physical pantry
structure, pantries differ in types of foods available, number of people served,
and hours of operation. Some food pantries distribute canned, fresh, frozen food
or prepared food. In 2000, an estimated 32,737 pantries operated and distributed
on average 239 million pounds of food per month. Households using food
pantries received an average of 38.3 pounds of food per visit (Nord et al, 2010).
Soup kitchens, sometimes referred to as emergency kitchens or
community kitchens, provide individuals with prepared food or meals, which are
eaten onsite. In 2000 an estimated 5,262 soup kitchens served 474,000 meals
on an average day (Nord et al, 2010).
Shelters provide shelter and serve one or more meals a day on a short-
term basis to low-income clients in need. Providing shelter may be the primary or
secondary purpose of the service. Examples include homeless shelters, shelters
with substance abuse programs, and transitional shelters such as those for
battered women (Nord et al, 2010).
Food Pantry Clientele
Food-insecure families and individuals often rely on neighborhood food

20
pantries for emergency food assistance. Many clients rely on emergency food
assistance provided by the food pantry because they are not enrolled in public
food assistance programs, their benefits have run out, or the high cost of living
has stressed household food budgets beyond capacity (Algert et al, 2006). Food
pantry users are considered a difficult-to-sample population, consisting of
subgroups of few individuals that are difficult to identify, locate, enumerate, or
interview. These include subgroups of the U.S. population who are at increased
risk of adverse effects associated with poor nutritional state. Examples include
pregnant women (few in number relative to the total population), migrant workers
(difficult to locate), homeless individuals (difficult to locate and difficult to
enumerate), and substance abusers (difficult to identify and difficult to interview).
A panel of experts in research and the fields of nutrition, food security, food
consumption and public policy identified nine nutritional concerns for these
populations: obesity, hypercholesterolemia, hypertension, iron status, food
security, drug-nutrient interactions, protein energy malnutrition, vitamin A status,
and folate status as a marker for quality of diets limited in variety and quantity of
foods (Anderson, 2000). Due to these factors, food pantry clients are generally
characterized by high levels of food insecurity, obesity and poor diet quality
(Duffy et al, 2009).
Food Pantry Numbers and Characteristics. For the past 30 years,
private food assistance programs have grown in number so that nearly every
community has a food pantry. The use of food pantries varies considerably by
household structure, race and ethnicity. Data show that a significant number of

21
individuals and families—many of whom are employed— seek food assistance
(Biggerstaff et al, 2002). Based on a cross-sectional study of Feeding America
clients, the average monthly household income among pantry clients was 71.4%
of the federal poverty level, indicating an average monthly income of $990 (Mabli
et al, 2010). In 2009, food pantry use was especially high among households
with children headed by single women (13.7%), Black (8.6%) and Hispanic
(7.6%) households, households with incomes below the poverty level (20%),
those living in cities of metropolitan areas (5.0%) and nonmetropolitan areas
(5.9%) and those living in the Midwest and West (Nord et al, 2010).
Diet Quality Assessment and U.S. Surveillance
Diet quality is complex and multidimensional as food choices are
influenced not only by cost and income, but also family structure, convenience,
culture, psychological factors, nutrition and food assistance programs (USDA:
ERS, 2008). The role of adequate nutrition and a diet high in fruits and
vegetables has been linked to reducing the risk of certain chronic diseases, such
as obesity, cardiovascular disease, diabetes, and some forms of cancer (USDA,
2010). The 2010 Dietary Guidelines for Americans recommend a healthy eating
pattern that emphasizes nutrient-dense foods and beverages – fruits, vegetables,
whole grains, lean protein (e.g. lean meats, poultry, seafood, eggs, beans, nuts
and seeds), fat-free or low-fat dairy products and limits in the intake of sodium,
solid fats, added sugars, and refined grains (USDA, 2010).
However, based on nutrition surveillance of the U.S. population, most
adults and children do not meet these diet recommendations, replacing nutrient-

22
dense foods and beverages with those too high in sodium and energy from solid
fats, added sugars and refined grains (USDA, 2010). Specifically, analysis of
two-day 24-hour recall data from the National Health And Nutrition Examination
Survey (NHANES) 2003-2004 indicated that fewer than 1 in 10 Americans met
their energy-specific fruit or vegetable recommendations (Kimmons et al, 2009).
The mean intake of fruit and vegetables among Americans is estimated to be 4.7
servings per day (Guenther et al, 2006). Orange juice is the primary contributor
to overall fruit intake among U.S. adults and adolescents. Legumes, dark green
and orange vegetables account for a small portion of overall vegetable intake,
with potatoes being the primary vegetable consumed, particularly among
adolescents. When including fried potatoes, adolescent mean vegetable intake
increased from 0.72 cup to 1.21 cups per day (Kimmons et al, 2009).
The USDA developed the Healthy Eating Index (HEI) to measure how well
American diets correspond to recommended healthful eating patterns. The HEI is
food-based and compares dietary components with USDA and Dietary
Guidelines recommendations. Four components are nutrient-based for
comparison to fat and saturated fat, cholesterol, and sodium and the last
component assesses variety. Total HEI scores higher than 80 imply healthy
diets, scores between 51 and 80 suggest improvement is needed, and scores
less than 50 indicate poor diets. Using NHANES data to calculate HEI scores,
Basiotis and colleagues (2004) found that individuals with incomes below 100%
of poverty had a mean overall score of 61.7 with 7.0 for the variety component,
as compared to respective scores of 65.0 and 8.2 in the same categories for

23
those with incomes above 185% poverty threshold. Thus, although the average
HEI score for most Americans needs improvement, individuals from low-income
households, with less education, and those between 15 to 39 years of age were
most likely to have lower average scores (USDA, 1995). Increasing America's
fruit and vegetable consumption is an important public health strategy for weight
management and reduction of risk for chronic disease.
Food Insecurity and Diet Quality
An inadequate diet may directly compromise nutritional status, heath and
overall quality of life particularly among those who are food insecure. Common
household responses to inadequate food supplies include food budget
adjustments, reduced food intake, and alterations in types of food served.
About two-thirds of food-insecure households in 2009 avoided reductions or
disruptions in food intake by relying on a few basic foods and reducing variety in
their diets (Nord et al, 2010). While dietary variety decreases, consumption of
energy-dense foods increases. These energy-dense foods, including refined
grains, added sugars, and added saturated/trans fats, tend to be of poor
nutritional quality and less expensive calorie-for-calorie than alternatives
(Monsivais, 2007; Seligman et al, 2010). Consumers with limited resources may
select energy-dense diets high in refined grains, added sugars and fats as an
effective way to save money (Drewnowski et al, 2005). U.S. adults living in food-
insecure households consume fewer weekly servings of fruits, vegetables, and
dairy and lower levels of energy and micronutrients, including B vitamins,
magnesium, iron, zinc, and calcium (Dixon et al, 2001; Rose et al, 1997; Tarasuk

24
et al, 1999). The odds of consuming intakes <50% of the Recommended Dietary
Allowances (RDA) are higher for food-insecure households, particularly adult
women and elderly, which places them at higher risk for nutrient deficiencies
(Rose, 1999; Tarasuk et al, 1999). Poverty and food insecurity have been
associated with lower food expenditures, low fruit and vegetable consumption,
and lower-quality diets (Drewnoski et al, 2004).
Those living in food-insufficient families have diets that may compromise
their overall health (table 2). Food-insufficient young adults had lower serum
concentrations of total cholesterol, vitamin A and three other carotenoid levels.
Older adults (60 years and older) from food-insufficient families had lower intake
of energy (specifically cereals, salty snacks and non-alcoholic beverages),
vitamin B-6, magnesium, iron, zinc and had lower serum concentrations of high-
density lipoprotein (HDL) cholesterol, albumin, vitamin A, and vitamin E. Both
younger and older adults from food-insufficient families were more likely to have
very low serum albumin (<35g/L) (Dixon et al, 2001).

25
Table 2. Number of times foods were consumed during 1-mo period by younger and older adults from food-insufficient families (FIF) and food-sufficient (FSF) (Dixon et al, 2001)
Affordability and access to fresh fruits and vegetables may also contribute
to poor diet quality. Dietary variety and the consumption of fresh produce are
generally associated with higher food costs. Several studies have discovered that
food purchases are influenced by diet costs, which act as a barrier to dietary
behavior change, especially among low-income respondents (Drewnoski et al,
2004). A 1992 study of household spending on food showed that food purchases
made by high-income households differed markedly from those made by low-
income households (Kaufman, 1999). Wealthier households bought higher-
quality meats, more fish and seafood, more fruit and vegetables, and more
convenience foods. Despite buying lower-cost items, poor households devoted a
far greater share of their disposable income to food.
Individuals living in rural areas or poor central cities can have poorer diet
quality because of lower access to quality food stores, which carry a wider variety
of more nutritious items. Such areas are referred to as food-deserts (Cummings
26
and Macintyre, 2002). A USDA study shows that, limited by the type and location
of food stores, low-income and minority households are forced to purchase
household groceries at inflated prices, especially produce (Kaufman, 1999). Such
access and affordability problems result in low-income households paying more
for basic nourishment compared to higher-income families.
Aside from affordability and accessibility, other contributing factors to poor
diet quality include lack of nutrition knowledge and food preparation skills, and
overeating when food is available (Drewnoski, 2004; Dietz, 1995; Polivy, 1996;
Cummings and Macintyre, 2002).
Food Insecurity and Health Status Recent research suggests that food insecurity may negatively impact
overall health by exacerbating the onset or persistence of other adverse health
conditions, including chronic disease, overweight and obesity (Cook et al, 2004,
Larson et al, 2011). Food insecurity disproportionately affects children and
families at the highest risk for obesity, including low-income households and
members of racial/ethnic minority groups (Larson et al, 2011; Olson, 1999). As
the prevalence of obesity among U.S. children and adults has reached
“epidemic” levels, there is an urgent need to better understand a way to address
obesity and its association with food insecurity.
Food Insecurity, Overeating, and Obesity
A tendency to overeat after food deprivation has been observed in
humans dating back to the starvation study by Keys et al (1950) during World
World II (Polivy, 1996). Research on eating patterns support the idea that food

27
deprivation can result in overeating (Olson, 1999). Polivy (1996) found that food
restriction and deprivation, whether voluntary or involuntary, results in a variety of
cognitive, emotional and behavioral changes such as preoccupation with food
and eating. Dietz (1995) published a case study of a 7-year-old obese girl whom
experienced regular monthly food shortages before her mother received the
welfare check, which appeared to be a contributing factor to her weight. It was
hypothesized that either food choices or physiologic adaptations in response to
episodic food shortages could cause increased body fat thus leading to
overweight and obesity.
The association of binge eating with dietary restraint among subgroups of
obese adults may represent another example of a physiologic adaptation to
periods of food surfeit and insufficiency. No studies have yet to link self-reports of
restrained eating directly with actual reductions in food intake and while it is
tempting to compare the regular episodic reduction in food intake by members of
food-insecure households to the “yo-yo” dieting of restricted eaters, the
physiologic response may differ from the response to involuntary food restriction
(Dietz, 1995).
The associations between food insecurity and obesity are consistent among
women, whereas the literature on children is conflicting. From a review of food
insecurity literature by Larson and Story (2011), at least 20 cross-sectional and
five longitudinal studies have examined whether there is a relationship between
household food insecurity and weight status among U.S. children and
adolescents. Six studies found evidence indicating that some groups of children

28
living in food-insecure households are more likely to be obese or to experience
greater gains in BMI over time compared to children who are in food-secure
households. However, the majority of studies either found no evidence of a direct
relationship between household food insecurity and weight status or found
evidence indicating that children living in food-insecure households are less likely
to be obese.
Female children living in food-insecure households were likely to be
influenced by parents weight status. Analysis of data from a convenience sample
of 200 parents and their 212 children (aged 2-12) in Hartford, Connecticut found
that food insecure adults were significantly more likely to be obese as those who
were food secure (Martin et al, 2007). Being a female and having an obese
parent doubled the likelihood of children being overweight, and those with a
family income below 100% of poverty were half as likely to be overweight than
those with higher incomes. Consistent with findings from other studies, food
insecurity did not increase the odds of childhood overweight.
A few studies have further investigated whether household food insecurity
may be linked to weight status in children and adolescents via influencing
parental behaviors (Larson et al, 2011). The stress of food insecurity on adult
members of a household may result in inconsistent parenting practices. One
longitudinal study indicated that parents in food-insecure households may be less
likely to adhere to recommended infant feeding practices suggesting that non-
adherence (e.g., early introduction of solid foods) in food-insecure households
may ultimately lead to obesity in early childhood (Larson et al, 2011).

29
Food insecurity and health. Household food insecurity is of great
concern among children because of the implications on their health especially
during development. Nationwide, food insecurity is experienced by 21% of U.S.
households with children (Nord et al, 2009).
Food insecurity has been associated with inadequate intakes of several
important nutrients, cognitive developmental deficits, behavioral and
psychosocial dysfunction, and poor health in children (Cook et al, 2004). Children
in food insecure households have a 75% greater odds of health being reported
fair/poor than those in food secure households and nearly 33% greater risk of
being hospitalized since birth (Cook et al, 2004). Recent research also suggests
that affective or psychological stresses, such as those accompanying resource-
constrained food insecurity, adversely influences child health and well-being. Not
being able to purchase enough nutritious food, and the emotional or
psychological stresses arising in the household, can contribute to poor health
effects or exacerbate poor health including malnutrition.
Food insecurity has also been linked to developmental consequences for
kindergarten children, more specifically including impaired social skill
development among boys and decreased reading performance among girls (Jyoti
et al, 2005). Among 6 to 12 year-old children, food insufficiency was associated
with poorer mathematics scores, grade repetition, absenteeism, tardiness, visits
to a psychologist, anxiety, aggression, psychosocial dysfunction, and difficulty
getting along with other children (Alaimo et al, 2001; Jyoti et al, 2005). Among
15- to 16-year-old adolescents, food insufficiency, which results from resource

30
constraint, was associated with depressive disorders and suicide symptoms after
controlling for income and other factors (Alaimo et al, 2002).
Studies examining the health effects of food insecurity among adults are
generally more limited and focus on the association between food insecurity and
self-reported disease. The association between food insecurity and self-reported
or laboratory evidence of diet-sensitive chronic disease was examined using
NHANES data (1999-2004 waves) of poor adults aged 18-65 years (Seligman et
al, 2010). Food insecurity was associated with hypertension and diabetes,
indicating that food insecurity is linked to cardiovascular risk factors.
Does Participation in Food Assistance Programs Alleviate Food Insecurity?
The relationship between food security and the use of food and nutrition
assistance programs is complex. Since the programs provide food and other
resources to reduce the severity of low-income households’ food insecurity, one
would assume that households using food assistance programs would be more
food secure than those not using the programs. However, it may be that those
households who seek food assistance are more at risk and have the lowest level
of food security that may not be alleviated with the food assistance participation.
Since program participation is elective, it is difficult to determine the effects of the
program to alleviate food insecurity against the selection effects on the choice to
participate.
In 2010, 52% percent of households who received SNAP benefits, 48%
who received free or reduced-cost school lunches, and 46% who received WIC
benefits were food insecure (Coleman-Jensen et al, 2011). The prevalence of

31
very low food security among households participating in SNAP was 8.8
percentage points higher than that of nonparticipating households in the same
low-income range (20.1% versus 11.3%). For households who received free or
reduced-cost school lunches, the prevalence of very low food security was more
than twice that of nonparticipating households with school-age children in the
same income range (15.6% versus 7.5%).
As of 2011, one in seven Americans received SNAP benefits (USDA:
ERS, 2011; FRAC, 2010). Slightly over half (50.8%) of all Americans between
the ages of 20 and 65 will at some point receive SNAP benefits. Based on the life
course patterns of SNAP use, it is estimated that at least 42% of the American
population will experience food insecurity at some point between the ages of 20
and 65 (Rank et al, 2005). Use of the program takes place over relatively short
periods of time but typically recurs at several points throughout the life course.
Race and education have a strong influence on the odds of program
participation. Those who had less than 12 years of education and were African
American were more likely to participate.
Similar to the National School Lunch Program, the School Breakfast
Program offers breakfast to low-income children at no cost or a reduced price.
Enrollment in the program has been linked to positive changes in meal patterns
and nutritional outcomes, which may increase household food security. Bartfield
and Ahn (2011) examined the relationship between availability of the School
Breakfast Program and household food security among low-income third-grade
students using data from the Early Childhood Longitudinal Survey-Kindergarten
32
Cohort (n = 3010). Access to school breakfast reduced the risk of marginal food
insecurity by offsetting food-related concerns among at-risk families, but in
alleviating the risk of food insecurity once hardships had crossed the food
insecurity threshold. Increasing the availability of school breakfast may be an
effective strategy to help maintain food security among low-income households
with elementary school children.
Participation in Food and Nutrition Assistance Programs on Health
As national survey data indicate that food insecurity disproportionately
affects populations at the highest risk for obesity, the relationship between food
assistance programs on food insecurity and weight status is of great interest.
Several studies have examined whether there is a relationship between
participation in SNAP and weight status in children and adults (Larson et al,
2011). It was found that long-term receipt of SNAP benefits is related to having a
higher BMI among certain groups (girls aged 12 years, young daughters of obese
mothers, those with family incomes at or below 130% poverty, and preschool
children living in cities with high food prices). Although many factors are likely to
influence the relationship between SNAP benefits and child BMI, this study
accounted for participation in other public food assistance programs, family
structure, maternal education, maternal employment, mother’s BMI, the
household’s income-to-poverty ratio, and food insecurity (Larson et al, 2011).
SNAP may play a role in the relationship between food insecurity and
obesity according to analysis of a nationally representative sample of 20,922
women collected between 1981 and 2002. The BMI of a typical woman
33
participating in SNAP was more than one unit higher than the BMI of someone
with the same socioeconomic characteristics who was not in the program. The
duration of participation had a cumulative impact on BMI; longer periods of SNAP
participation were associated with greater increases in BMI (Larson et al, 2011).
SNAP participation may benefit non-nutritional outcomes, specifically
academic learning, among school-aged children. Data from the Early Childhood
Longitudinal Study-Kindergarten cohort, a large nationally representative sample,
was used to determine whether SNAP participation was associated with child
reading and mathematics learning, weight gain and social skills (Frongillo et al,
2006). Starting SNAP participation in the four years between preschool and third
grade was associated with a 3-point increase in reading and mathematics score,
most significantly among female students, and tended to be associated with less
weight gain, compared to children living in households who stop SNAP
participation during that same period. These findings were consistent with other
studies and indicated that SNAP participation was associated with either lower or
equal risk of overweight children (e.g., Jones et al, 2003).
When comparing differences among women living in WIC households to
those participating in WIC and the Farmer’s Market Nutrition Program, Kropf and
colleagues (2007) found that WIC/Farmers’ Market Nutrition Program participants
reported greater daily intake of vegetables and more indicators of a healthful diet,
but did not appear to be more food secure. Both perceived benefit of the program
and perceived diet quality was greater for Farmers’ Market Nutrition Program
(Kropf et al, 2007).

34
Food Panty Clients and Barriers to Federal Food Assistance Program Participation Food pantry users represent a group at highest risk for being food
insecure and therefore can benefit from participation in SNAP and other federal
food assistance programs. Most food pantry clients are eligible to receive SNAP
benefits because of low household income, but a substantial number are not
enrolled. Nationally, approximately one in four people eligible for the SNAP are
not receiving benefits, according to USDA (USDA: ERS, 2011; FRAC, 2010). To
gain insight for SNAP outreach programs, background characteristics of food
pantry users in Los Angeles (n =14317) were analyzed. Ninety percent of food
pantry users were living well below poverty level, 59% were Hispanic, and 44%
were homeless (Algert et al, 2006). However, only 15% of the food pantry clients
received SNAP, with homelessness and limited English language skills acting as
barriers to SNAP participation. Additional circumstances for enrolling for SNAP
benefits included lack of permanent address for homeless individuals and
undocumented immigrants. Children of undocumented immigrants born in the
U.S. are eligible to receive food stamps and can be enrolled through additional
outreach efforts.
Little research is available on food pantry users in Connecticut. However,
a cross-sectional retrospective study of low-income households (below 185% of
poverty) helped to identify barriers for lack of participating in public (SNAP) and
private (food pantries and soup kitchens) food assistance programs (Martin et al,
2003). Of 330 randomly selected low-income Hartford households, researchers
found that over one-third of respondents did not participate in any food

35
assistance programs, while the majority received SNAP alone or received SNAP
and utilized food pantries. Those who utilized food pantries went on average 4
times in the previous year. Black and elderly households were less than half as
likely to receive SNAP compared to Hispanic and non-elderly households.
Barriers for not participating in SNAP included “believing their family was not
eligible,” “difficulty with applying,” or they “applied but were found ineligible.” The
main reasons against food pantry and soup kitchen were that they “don’t need
the food,” “feel uncomfortable using the program,” “have no transportation,” “don’t
know where the program is located,” or “have difficulty carrying the food home
from the pantry” (Martin et al, 2003). Additional research is needed to understand
what types of interventions can help to increase participation rates, especially in
Hispanic and elderly households. Outreach for food stamps and private food
assistance programs should accommodate these differences so that food-
insecure households can benefit from all available food assistance programs.
Food Pantry Clients’ Access to Food
Food pantries are a type of private emergency food assistance focusing
on providing short-term assistance to low-income households with packages of
food items that generally require additional preparation. There is high variability
in food offered at pantries because the sources of food vary among food banks,
farms, retail store salvage, individual donations, and direct purchases (Akobundu
et al, 2004). Donations to food pantries is motivated by a variety of underlying
factors. The major factor is the knowledge that there were hungry people in the
community in need of food and the feeling that contributing food was the right

36
thing to do to solve local hunger problems. In-depth focus groups revealed that
many donors did not consciously consider nutrition when deciding which foods to
donate (Verpy et al, 2003). Others indicated that they tended to rely on the food
shelf operators to request nutritious foods or to buy the foods that people
needed. Some indicated that they knew some products were not nutritious but
wanted to provide "treats" for children such as cookies, chips, candy, or cereal
high in sugar.
Most food pantries distribute, on average, foods that meet or exceed
recommended dietary levels for 3-days consisting mainly of perishable food
items with limited variety of fresh fruits and vegetables. The occasional donation
of single fruit or vegetables are limited and distributed quickly due to quick
spoilage, leaving clients with only a small volume of canned or frozen fruits and
vegetables at each visit (Algert et al, 2006).
Food donations may not match client needs for people with different ethnic
backgrounds or age groups and food safety concerns (Verpy et al, 2003). These
feelings were identified with in-depth focus groups with pantry clients and food
donors conducted to obtain information regarding attitudes and beliefs of
individuals who donate food and perceptions of needs among food shelf clients.
Four major themes were identified from pantry users including (1) the need for
food choice, (2) concern regarding the safety and quality of the food provided, (3)
the need for nonfood items, and (4) thoughts on how the food shelves might
improve services for clients. Food types desired by pantry users included fresh
dairy products (not powdered), more meat products (fresh, frozen, or canned),

37
more fresh and seasonal vegetables and fruits, increased variety of vegetables,
and coordinated meal items (e.g.,, a staple to coordinate with a meat or
vegetable item or a meat to coordinate with a staple or vegetable item).
Food pantry clients, many living in poor ethnic neighborhoods, are at
highest risk for inadequate intake of fruits and vegetables as emergency food
assistance often does not include a supply of fresh produce (Algert et al, 2006).
Because low-income and minority families are less likely to meet recommended
intake for selected nutrients or food groups, the type of food acquired from the
emergency food system is important (Verpy et al, 2003).
Algert et al (2006) examined the distance that food pantry clients (n =
3,985) live within reasonable walking distance (0.8 km network buffer) of stores
(n = 84) carrying fresh produce in Pomona, California. Food stores were
categorized as selling a “variety of produce” or “limited produce” using
geographic information systems technology. Forty-one percent of food pantry
clients were within walking distance of a store with a variety of fresh produce,
83% were within walking distance of stores with limited produce, 13% were not
within walking distance of either store type.
Diet Quality in Food Pantries
Despite the large quantity of food distributed, little is known about the
nutritional quality of foods distributed from pantries. Akobundu et al (2004)
examined the nutrient value and food group content of food items given to 133
clients using 19 pantry sites in Western Massachusetts. Using the USDA’s Food
Guide Pyramid, approximately one bag contained sufficient grains to last 7 days,

38
vegetable and meat/protein to last 5 days, and fruit and milk products to last only
3 days. The majority of servings came from fats, oils and sweets, followed by
grains (e.g., bread, cereal, rice, pasta). Fruit and dairy products (e.g., milk,
yogurt, cheese) were among the least available. Pantry foods distributed were of
adequate or high nutrient density for protein, fiber, iron, and folate, yet were
lacking nutrient density for calcium, vitamin A, and vitamin C (Akobundu et al,
2004). Findings indicate the need for creative efforts for pantries to procure,
store, and distribute additional fruit, dairy products, and other sources of vitamins
A and C and calcium.
Food insecurity is associated with higher BMI and overall poor diet quality.
Among 55 female food pantry clients (19-50 years of age) in Lee County,
Alabama, 65% were food insecure, 67% were obese and diet quality was
generally poor (HEI of a 43 out of 100). The majority of women reported no
consumption of fruit/whole fruit, whole grains, dark green/orange vegetables or
legumes. The maximum score received was for the meat and beans category.
Low overall diet quality was associated with having low education levels (less
than a high school degree) and being a smoker (Duffy et al, 2009).
Freshplace Food Pantry Intervention
The Freshplace food pantry resulted after several years of planning and
the combined support of three community-based organizations—Chrysalis
Center, Junior League of Hartford and Foodshare. Freshplace is located within
the Chrysalis Center, which is a private, non-profit healthcare agency that
provides support services to people with psychiatric disabilities, substance abuse

39
issues, and/or HIV/AIDS. The Chrysalis Center provides funds to support
staffing of a paid Project Manager and coordinates multiple volunteers who
support the program. The Junior League of Hartford is an organization of women
committed to promoting voluntarism and improving communities through effective
action and leadership of trained volunteers. The League has agreed to provide
volunteer staff to support Freshplace by stocking pantry shelves, assisting clients
with selecting food and supporting the Program Manager for up to five years.
Foodshare is the regional food bank of Greater Hartford, which collects,
warehouses and distributes food to serve food pantries, soup kitchens, and
shelters in Hartford and Tolland counties. Foodshare agreed to provide all food
products to Freshplace for 3 years, 90% of which would be fresh fruit,
vegetables, dairy and meats.
People who attend Freshplace are called members rather than clients.
Freshplace is a client-choice pantry meaning that members are able to make
their own food selection as they would in a grocery store, as opposed to
traditional food pantries, which provide pre-packaged grocery bags. Food items
are arranged by categories (meat, dairy, produce, dried/canned) and members
walk through with a volunteer and select items based on family size. This model
allows for clients to handle the food and look at nutrition labels just as if they
were shopping in a store. Freshplace is open three days per week, on Tuesdays,
Thursdays and Saturdays. As an entry-point to Freshplace, members have
access to fresh food at the pantry once every two weeks. All members meet with
the Project Manager to create a Freshstart Service Plan, which identifies and

40
monitors goals, expectations and potential barriers for becoming food secure and
self-sufficient. This involves developing concrete target behaviors with small
achievable goals to be reached by the next month. At each monthly meeting,
goals are discussed and member’s progress is monitored.
To help meet their goals, Freshplace offers an array of services and
referrals tailored to address individual needs of each client by collaborating with
community partners and existing programs. Examples of these services include
nutrition education, budget coaching and money management, and referrals to
social services, General Educational Development (GED) classes, job training
and determination of eligibility for federal food assistance programs such as
SNAP, WIC, and free-reduced price school meals. When applicable these
services are provided on-site at Freshplace.
Nutrition Education at Freshplace. Along with the availability of healthy
food options at Freshplace, members are offered various nutrition education
opportunities. Participants are able to participate in a 6-week nutrition and
culinary series provided by Share Our Strength called Cooking Matters for Adults
(Share Our Strength, n.d.). The course teaches low-income adults how to
prepare and shop sensibly for healthy meals on a limited budget. The program
was offered at Freshplace two times (Fall/Spring) with 25 total Freshplace
participants. In the two-hour class, one hour is focused on nutrition education and
the second hour is devoted to cooking three recipes and sharing a meal together.
This program served to increase the knowledge, skills, behaviors and confidence
of Freshplace members.

41
In addition, undergraduate Department of Allied Health Sciences dietetic
students and dietetic interns from the University of Connecticut provided nutrition
education resources to Freshplace members. Students tabled dietary handouts,
healthy recipes, and samples and were available for individualized nutrition—
related questions periodically as experience in community nutrition.
The Freshplace intervention is formed around the social cognitive theory
(SCT), which posits that in order to achieve behavior change people go through
stages. It specifies a core set of determinants, the process in which they work,
and how to translate knowledge of health promotion and disease prevention into
effective health practices. Self-efficacy is the idea that one can exercise control
over their own health habits and is key to motivation and action (Bandura, 2004).
In gaining a better self-control over his/her lifestyle and health habits, members
will utilize knowledge and skills to increase their food security and self-
sufficiency. Other core determinants of SCT are the health goals people set for
themselves, the concrete plans and strategies for acknowledging them, and the
social and structural impediments to the changes they seek (Bandura, 2004).
The emphasis of the Freshplace program is to help members set small
achievable goals for behavior change that if accomplished could boost their
confidence in coping with similar problems in the future (Martin, 2009).
Summary
This literature review highlights the need to examine associations between
food security, food assistance participation, obesity and diet quality among food
pantry clients, particularly in Connecticut. As a new food pantry model, the

42
Freshplace program provides an opportunity to compare members who go to
Freshplace with clients who go to traditional food pantries. Results can be
compared to this previous literature. This thesis will examine the following
research questions with specific hypotheses.

43
Research Questions How is food insecurity related to diet quality and participation in food assistance
programs among Freshplace clients and control group at baseline?
Is participation in Freshplace across 3 months associated with food security, diet
quality and participation in SNAP?
Hypothesis H1: Food insecurity will be associated with lower diet quality and participation in
private (food pantry and soup kitchen) food assistance programs.
H2: Three months of participation in Freshplace will be associated with improved
food security and participation in SNAP.
H3: Three months of participation in Freshplace will be associated with improved
diet quality, measured by increased intake of fruits and vegetables.

44
METHODS
The data used for this thesis are part of a larger, 18-month randomized
control study to evaluate Freshplace that is lead by principal investigator, Dr.
Katie Martin, and her research team at the University of Connecticut. The 100
clients who participate in the Freshplace program and 100 clients who utilize
traditional food pantries in Hartford’s North End were studied with surveys at
baseline and then repeated at 3, 6, 9, 12, 15 and 18 months. The survey data
used for this thesis was collected at baseline and 3 months follow-up. The
University of Connecticut Health Center’s Institutional Review Board (IRB)
approved the study protocol.
Setting and Participants. Study participants were recruited from two
local food pantries serving residents of the Upper Albany neighborhood of
Hartford. Both pantries operate on different days of the week at different times.
One pantry was open from 8-10am each Tuesday and Friday, while the other
pantry was open from 4:30-6:30pm on Thursdays. The Research Team visited
each pantry on different days and times of the week to obtain a representative
sample.
Study Recruitment. To be eligible for the study, participants must be over
18 years old, live in one of three Hartford zip codes (06105, 06112, 06120),
speak English, receive food from a Hartford food pantry, and be the only study
participant in their household. As determined by the Research Team, participants
were considered to be in the same household if they contribute to the same food
budget, which indicates that they share a food supply and prepare meals

45
together. Researchers approached participants as they arrived at the pantry to
briefly explain the study. They were informed that they were being invited to
participate in a study about how food pantries help people get enough food,
commitment was required for up to one year, the decision to participate is
voluntary and they have a right to discontinue participation. If a pantry user
lacked interest in participation, researchers continued recruitment until someone
agreed to enroll. If a pantry user decided to participate, researchers read through
the consent form and received participant’s signature. To protect participant
confidentiality, participants were assigned a unique identification number (ID),
which was used for all data collection and data entry. Upon recruitment and
collection of baseline survey data, participants blindly selected one of two colored
balls from a bag indicating either Freshplace (red) or Comparison group (blue).
Participants randomized to Freshplace were invited to go to Freshplace and were
given a scheduled appointment with the Program Manager. Participants
randomized to the Comparison group would continue to receive food from
traditional food pantries. Participants were paid $10 after baseline collection and
$5 at the 3-month follow-up collection.
A total of 226 participants were recruited into the study and data collection
for this research was conducted from June 2010 to July 2011.
Survey Instruments
All data were collected in-person at the food pantry or at Freshplace using
interviewer-administered surveys. Survey sections included demographic

46
information, food insecurity, diet intake, and health including body mass index
(BMI) (See Appendix 2).
Demographic information included household size, number of children,
age, ethnicity and gender. The survey responses were numeric (e.g., age),
categorical (e.g., ethnicity, Black, West Indian, Hispanic, other) and dichotomous
(yes, no). The survey took approximately 25-35 minutes to complete and was
administer by research assistants, including this student, and the Principal
Investigator of the Freshplace evaluation, Dr. Katie Martin. To ensure
consistency in survey administration, a training session was held by the
researchers prior to the start of interviewing.
Food Security—Household food security was measured using the gold
standard 18-item USDA Household Food Security Module screener. As
described in the introduction, this module consists of 18 questions about
experiences and behaviors related to food insecurity that proceed based on the
severity of a household’s experiences with food insufficiency during the last 3
months. Three items regarding household food insecurity were asked of all
respondents. If the respondent had children, they would proceed to questions
about child and household measures. If the respondent did not have children and
answered, “sometimes or often true” to any of the three, they would proceed to
another 5 questions regarding adult and household measures. If respondent
answered, “never true” to all 3 questions, the food insecurity section was
completed and the interviewer would skip to the next section. Households
without children have a total sum of 10 possible affirmative responses, and

47
households with children have a possible total of 18 responses. For households
without children, the adult measures equal the household measure (USDA,
2011). Based on the food security scoring module (see Table 3), food security
status was categorized as 1. high food security, 2. marginal food security, 3. low
food security, 4. very low food security. For some analyses, food security status
was condensed into a dichotomous variable as food secure (high food security
and marginal food security) and food insecure (low food security and very low
food security), based on USDA standards.
Table 3. Food Security Scoring Module
Number of Affirmative Responses Food Security Status Households with
no children (Raw Score out of
10)
Households with one or more children
(Raw Score out of 18)
USDA Category
0 0 High food security 1-2 1-2 Marginal food security 3-5 3-7 Low food security
6-10 8-18 Very low food security
Food Assistance Participation—To determine participation in food
assistance programs, participants were asked, “Which of the following has your
family used to get food in the past 3 months?” Programs included soup kitchens,
food pantries, SNAP, WIC, free/reduced price school meal, Earned Income Tax
Credit, Energy Assistance/Rent Rebate, and “other” category. For all the “yes”
answers, the frequency (e.g. times visited each week/month) and amount (e.g.,
number of pantries utilized each week/month) of use was determined.
Dietary Quality—The Block Food Frequency Screener, a validated tool for
measuring usual dietary nutrient intake over one-month, was used to assess diet

48
quality (Block et al, 2009). This screener has been proven to provide nutrient
estimates that correlate with the “gold standard” 1995 Block 100-item Food
Frequency Questionnaire and more extensive methods, such as multi-day food
intakes (Block et al, 2000). This present study utilized both the Block
Fruit/Vegetable/Fiber and Block Dietary Fat Screener (NutritionQuest, 2009).
Portion sizes are not asked. The screener used is a one-page tool that is
comprised of two sections, Fruit/Vegetable and Meat/Snacks.
The Fruit/Vegetable section included 7 questions about fruit and vegetable
intake and 3 questions related to fiber intake (e.g., brown rice, whole grain
cereals and bread). This section was designed to assess individual’s usual fruit,
vegetable, and fiber intake. Participants were asked to think about the foods they
ate in the last month for breakfast, lunch, dinner, snacks and eating out and
respond to how often they ate different items using response categories of: less
than once a week, once a week, 2-3 times a week, 4-6 times per week, once a
day and two or more times a day. The responses were scored 0, 1, 2, 3, 4, 5 and
when fruit and vegetable intake was examined alone, possible scores ranged
from 0 to 35. A score of 0-10 correlated with less than 3 servings of fruits and
vegetables a day, indicating very low amounts of micronutrients. A score of 11-12
correlated with less than four servings per day. A score of 13-15 correlated with
less than 5 servings per day, indicating a healthy diet but still consisting of less
than recommended servings. A score of 16 or above correlated with five or more
servings, which is consistent with several national guidelines.
The Meat/Snacks section is comprised of 17 items designed to capture

49
dietary fats, dairy and snack items. This section was designed to assess
individual’s usual fat intake. Participants were asked to think about the foods they
ate in the last month for breakfast, lunch, dinner, snacks and eating out and
respond to how often they ate different items using response categories of: once
a month of less, 1-2 times a month, 3-4 times a week, or 5 or more times a week.
Categories were scored 0, 1, 2, 3, 4 and ranged from 0-60. Scores of 0-7
indicated “very low fat” intake and 8-14 indicated a “moderate fat” intake,
approximately 30-35% of total calories. A score of 15-22 indicated a “high fat”
diet and a score of 23 indicated a diet “very high” in fat intake, approximately 40-
50% of calories. Portion sizes were not asked for either section (Block et al,
2000).
Self-Reported Health and BMI—To determine BMI, height was measured
at baseline using a Stadiometer (Seca 213) and weight was measured at each
survey using a digital medical scale (Healthometer). Data were collected by
researchers in pounds and feet, therefore, body mass index was computed as
follows: [weight (lb)/height (in)2] x 703. Once calculated, BMI was classified
according to the CDC criteria: BMI of less than 18.5 indicated underweight, 18.5
to 24.9 indicated normal weight, 25 to 29.9 indicated overweight, 30 and 40
indicated obesity, and >40 indicated morbidly obesity (CDC, 2011). Participants
were asked to rate their overall health on a scale of 1-5 (1 being excellent, 5
being poor). Participants were also asked if a doctor ever told them or someone
in their household that they have diabetes or high blood pressure.

50
Statistical Analysis
The survey cover sheet, which included participants’ contact information
and member number was entered manually into an Access Database. Once
entered, all survey data was electronically entered into a Microsoft Excel file.
Analyses were conducted using PASW (SPSS) Version 18.0. Descriptive
statistics (frequencies) were used to describe the total sample of food pantry
participants. Bivariate associations among food security measures and
categorical or dichotomous variables were analyzed using χ2 tests and Fishers
Exact Test for small expected cell counts (less than 5). Baseline measures and
the average change in baseline to 3 months follow-up measures in intervention
versus control group was compared (i.e., 3 month baseline score – baseline
score) and analyzed using independent samples t-tests.
Prediction equations for daily nutrient intake based on food screener
scores, sex, age, and race were used to estimate total fat, saturated fat, dietary
cholesterol, fruit/vegetable servings, dietary fiber, vitamin C, magnesium, and
potassium as shown in table 4 (Block, Gillespie, Rosenbaum, Jenson, 2000).
Daily nutrient intakes were compared to the recommendations set by the Dietary
Guidelines for Americans 2010 which are intended for Americans 2 years and
older including those who are at risk for chronic diseases (USDA, 2010).

51
Table 4. Predictive Equations for Daily Nutrient Intake Based on Food Screener Scores (Block et al, 2009)
Nutrient Equation Total Fat (g) = 32.7 + 2.4 (Meat/Snack Score) + 11.2 S Saturated Fat (g) = 9.4 + 0.88 (Meat/Snack Score) – 3.5 S Dietary Cholesterol (g) = 120 + 7.8 (Meat/Snack Score) – 54.65 S + 36.6 R Dietary Fiber (g) = 7.9 + 0.74 (Fruit/Vegetable/Beans Score) – 4.5 S Vitamin C (mg) = 56.5 + 6.6 (Fruit/Vegetable/Beans Score) – 26.7 S –
0.45 A Magnesium (mg) = 272 + 11.6 (Fruit/Vegetable/Beans Score) – 92.3 S –
1.7 A Potassium (mg) = 2348 + 114.8 (Fruit/Vegetable/Beans Score) – 759 S –
13.8 A S = Sex: Male = 0, Female = 1 R = Race: White = 0, Nonwhite = 1 A = Age: Actual age directly substituted for the A variable

52
RESULTS
Sample Characteristics at Baseline
A total of 226 surveys were completed at baseline and 110 surveys
completed at 3 months follow-up. Of the total 226 participants, 112 (49.6%) were
randomized into Freshplace and 114 (50.4%) were part of the Control group.
Sample characteristics of Freshplace and Control groups are displayed in Table
5. The majority of food pantry users were between the ages of 30-64 years, with
a mean age of 52 years for both men and women. Food pantry participants were
predominately Black, followed by West Indian, female and single. Food pantry
participants had limited education, employment and transportation. The majority
(87.2%) of food pantry participants had less than a college degree. Only 20.4%
of food pantry participants were employed at the time of their baseline interview.
Approximately 80% did not own a car.
The average household size of food pantry participants was three
members, with 16.4% having children age five and under, and 34.4% having
children between the ages of 6-17. There was a significant difference (p =.05) in
the distribution of household size; Freshplace participants were relatively evenly
distributed across the household size categories whereas the Control participants
were distributed toward smaller household sizes. Approximately 83% of food
pantry users had some form of health insurance for some adults (8.8%), children
and adults (16.4%) or everyone (58.4%) in the household.

53
Table 5. Frequency Characteristics of Sample Population
Control Freshplace P Value
Characteristic N % N % Total Sample 114 100 112 100
Gender Male Female
48 66
42.1 57.9
44 68
39.3 60.7
.67
Age 18-50 50+
50 63
44.2 55.8
53 57
48.2 51.8
.53
Race Black West Indian Hispanic/mixed
84 20 7
74.3 17.7 8.0
81 21 9
72.3 18.8 8.1
.89
Education < High school degree High school/ GED Some College, Associates, BA/BS degree
50 45 19
43.9 39.5 16.7
49 52 10
43.8 47.3 8.9
.17
Marital Status Single Married/living with Partner Separated/divorced/widowed
70 20 24
61.4 17.5 21.2
66 21 25
58.9 18.8 22.4
.46
Employment Status Employed Unemployed/retired
25 75
21.9 65.8
21 79
18.8 70.5
.75
Household Size 1 2 3 4 5+
34 32 24 13 11
29.8 28.1 21.1 11.4 9.6
20 25 25 20 22
17.9 22.3 22.3 17.9 19.6
.05
Own a Car Yes No
21 93
18.4 81.6
26 86
23.2 76.8
.38
Food Security Status at Baseline
As shown in Table 6, 85% of food pantry participants were food insecure
(low or very low food security) and only 15% were food secure (high or marginal

54
food security) at baseline. Of those considered food insecure, about one third
were experiencing low food security and half were experiencing very low food
security (food insecurity with hunger). Of households considered food secure,
7.5% responded positively to one or two of the food insecurity indicators,
demonstrating marginal food security, or some worries or difficulties in obtaining
enough food. These results are the reverse for the 2010 U.S. rates of food
security status (Figure 1).
Five forms of food assistance programs (2 private and 3 public) were
inquired about during the interview. The majority utilized food pantries once a
week or more each week (62.9%). Those using food pantries went to an average
of three pantries each month, while some reported visiting 5 to 8 different
pantries (results not shown). Approximately 43% of all participants reported using
a soup kitchen to obtain a meal. Over a third (36.1%) of those using a soup
kitchen went 2-4x/week and 11.3% reported going on a daily basis. As
anticipated, the most used federal food assistance program was SNAP, with
58.5% enrolled at baseline. Of 37 households eligible for WIC, those having
children 5 years or under, only 2 were enrolled. Of the 45 households eligible to
receive free/reduced price school meals, those with children 6-17 years of age,
15 households were not enrolled. There was a significant difference (p =.01) in
food pantry use between Freshplace and the Control group at baseline;
participants of Freshplace were more les likely to go to food pantries once per
week or more, whereas Control participants were more likely to report once per
week or more (71.1% versus 54.4%).

55
Table 6. Frequency of Food Security and Food Assistance Use
Control Freshplace P Value Characteristic N % N %
Total Sample 114 100 112 100 Food Security Status Food secure Food insecure
16 98
14.0 86.0
18 94
16.1 83.9
.67
Food Pantry Use Less than weekly Once per week or more
33 81
28.9 71.1
51 61
45.5 54.4
.01
Soup Kitchen Use Less than weekly Once per week of more
13 32
28.9 71.1
15 34
30.6 69.4
.86
Food Assistance Use SNAP WIC Free/reduced price school meals
70 1
26
61.4
.9 22.8
35 1
28
59.3
.9 25.0
.43 1.0 .99
Diet Quality at Baseline
The frequencies for Freshplace and the Control for diet quality measures
based on Block Food Screener scores are shown in table 7. There were no
significant differences for diet quality categories at baseline between the two
groups. On average, pantry users consumed less than four servings of fruits and
vegetables each day. Nearly half (47.3%) consumed less than 3 servings/day
and five pantry users had a fruit/vegetable score of 0. These servings compare
unfavorably to the Dietary Guidelines for Americans recommendation of five to
nine servings of fruits and vegetables per day. Assuming that each fruit or
vegetable consumed was a standard serving, only about 20% of all pantry users
had scores indicating they were meeting the recommended levels (5 servings per
day). Approximately 85% of all pantry users consume a diet that is considered
high or very high in fat. The mean meat/snack score was 27.17 indicating a “very

56
high” fat intake among this population (table 8). One participant scored a 67,
which was the maximum range.
Table 7. Frequency of Dietary Intake by Dietary Quality Categories among Food Pantry Participants (Control) and Freshplace Food Pantry Control Freshplace P Value
Characteristic N % N % Total Sample 114 100 112 100
Fruit and Vegetable Score < 5 servings per day (0-15) 5 or more servings per day (16+)
92 22
80.7 19.3
89 23
79.5 20.5
.81
Meat and Snack Score Low/ Moderate fat intake (0-14) High/ Very high fat intake (15- 23+)
19 93
17.0 83.0
14 97
12.6 87.4
.36
Daily Nutrient Intake* Total Fat (g/day) Desirable (≤65) Above Desirable (>65) Saturated Fat (g/day) Desirable (<20) Above Desirable (≥20) Dietary Cholesterol (g/day) Desirable (<300) Above Desirable (≥300) Dietary Fiber (g/day) Below Desirable (<25) Desirable (≥25) Vitamin C (mg/day) Below Desirable (<75) Desirable (≥75) Magnesium (mg/day) Below Desirable (<420) Desirable (≥420) Potassium (mg/day) Below Desirable (<4,700) Desirable (≥4,700)
9 101
14 94
61 51
111
3
30 73
111
3
113 1
8.2 91.8
13.0 87.0
54.5 45.5
97.4 2.6
29.1 70.9
97.4 2.6
99.1
.9
6 104
12 96
55 55
107
2
35 61
104
8
112 0
5.5 94.5
11.1 88.9
50.0 50.0
98.2 1.8
36.5 63.5
92.9 7.1
100 0.0
.42
.68
.51
1.0
.27
.13
1.0
*Based on a 2,000 calorie diet for individuals aged 31-50
Mean Intake Diet Score. The mean intake scores for diet quality
measures in the total sample at baseline are shown in table 8. Overall findings
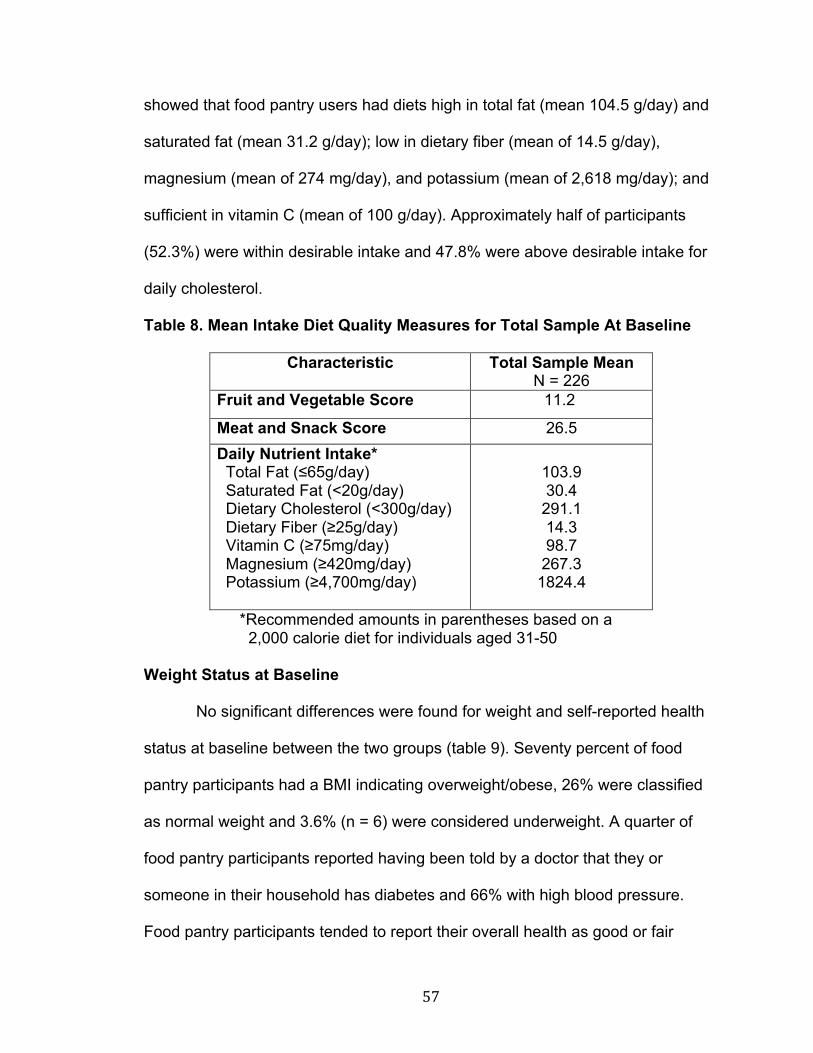
57
showed that food pantry users had diets high in total fat (mean 104.5 g/day) and
saturated fat (mean 31.2 g/day); low in dietary fiber (mean of 14.5 g/day),
magnesium (mean of 274 mg/day), and potassium (mean of 2,618 mg/day); and
sufficient in vitamin C (mean of 100 g/day). Approximately half of participants
(52.3%) were within desirable intake and 47.8% were above desirable intake for
daily cholesterol.
Table 8. Mean Intake Diet Quality Measures for Total Sample At Baseline
Characteristic Total Sample Mean N = 226
Fruit and Vegetable Score 11.2
Meat and Snack Score 26.5 Daily Nutrient Intake* Total Fat (≤65g/day) Saturated Fat (<20g/day) Dietary Cholesterol (<300g/day) Dietary Fiber (≥25g/day) Vitamin C (≥75mg/day) Magnesium (≥420mg/day) Potassium (≥4,700mg/day)
103.9 30.4
291.1 14.3 98.7
267.3 1824.4
*Recommended amounts in parentheses based on a 2,000 calorie diet for individuals aged 31-50
Weight Status at Baseline
No significant differences were found for weight and self-reported health
status at baseline between the two groups (table 9). Seventy percent of food
pantry participants had a BMI indicating overweight/obese, 26% were classified
as normal weight and 3.6% (n = 6) were considered underweight. A quarter of
food pantry participants reported having been told by a doctor that they or
someone in their household has diabetes and 66% with high blood pressure.
Food pantry participants tended to report their overall health as good or fair

58
(70.4%). Less than a quarter (21.9%) of food pantry participants considered their
health as excellent or very good.
Table 9. Frequency of Weight and Self-Reported Health Status
Characteristic Control Freshplace P Value N % N %
Total Sample 114 100 112 100 BMI Classification Normal weight Overweight Obese/ Very obese
8
18 20
17.4 39.1 43.5
9
15 22
19.6 32.6 47.8
.81
Diabetes Yes No
86 28
75.4 24.6
30 82
26.8 73.2
.70
High Blood Pressure Yes No
71 43
62.3 37.7
76 36
67.9 32.1
.38
Self-Report Health Status Excellent/very good Good/fair/poor
12 48
20.0 80.0
13 42
23.6 76.4
.64
Food Security Associations at Baseline
To understand how food insecurity relates to diet quality and participation
in food assistance programs, bivariate associations between food security and
demographics, food assistance and diet quality were assessed (table 10). For
these analyses, food security status was dichotomized into two categories, food
secure and food insecure. Food secure individuals had a greater number who
reported consuming five fruits and vegetables per day (p = .05), yet there were
still only about 1/3 of food security individuals who did so. Interestingly food
insecure individuals tended to be more likely to consume adequate intakes of
vitamin C (p = .06). No significant differences were found for demographic
characteristics, food assistance participation or BMI.

59
Table 10. Dietary Intake at Baseline by Food Security Status
Characteristic Food Secure
N= 34
Food Insecure
N = 192
P Value
Fruit and Vegetable Score < 5 servings per day (0-15) 5 or more servings per day (16+)
23 (67.6%) 11 (32.4%)
158 (82.3%) 34 (17.7%)
.05
Meat and Snack Score Low/ Moderate fat intake (0-14) High/ Very high fat intake (15- 23+)
2 (6.3%)
30 (93.8%)
31 (16.5%)
157 (83.5%)
.18
Daily Nutrient Intake* Total Fat (g/day) Desirable (≤65) Above Desirable (>65) Saturated Fat (g/day) Desirable (<20) Above Desirable (≥20) Dietary Cholesterol (g/day) Desirable (<300) Above Desirable (≥300) Dietary Fiber (g/day) Below Desirable (<25) Desirable (≥25) Vitamin C (mg/day) Below Desirable (<75) Desirable (≥75) Magnesium (mg/day) Below Desirable (<420) Desirable (≥420) Potassium (mg/day) Below Desirable (<4,700) Desirable (≥4,700)
1 (3.0%) 32 (97.0%)
1 (3.1%)
31 (96.9%)
17 (53.1%) 15 (46.9%)
0 (0.0%)
34 (100.0%)
24 (82.8%) 5 (17.2%)
1 (2.9%)
33 (97.1%)
0 (0.0%) 34 (100%)
14 (7.5%) 173 (92.5%)
25 (13.6%)
159 (86.4%)
99 (52.1%) 91 (47.9%)
5 (2.6%)
184 (97.4%)
110 (64.7%) 60 (35.3%)
10 (5.2%)
182 (94.8%)
1 (.5%) 191 (99.5%)
.71
.14
.91
1.0
.06
1.0
1.0
BMI Classification Under/normal weight Overweight Obese/very obese
10 (38.5%) 6 (23.1%)
10 (38.5%)
40 (28.0%) 51 (35.7%) 52 (36.4%)
.39
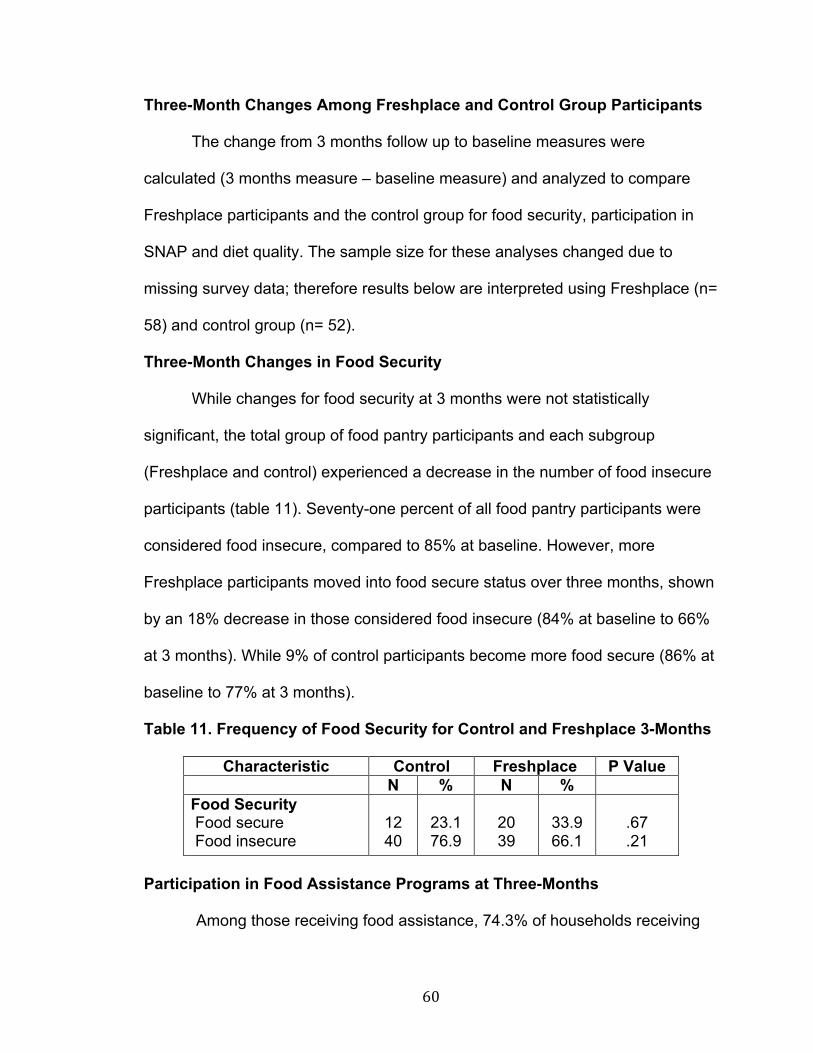
60
Three-Month Changes Among Freshplace and Control Group Participants
The change from 3 months follow up to baseline measures were
calculated (3 months measure – baseline measure) and analyzed to compare
Freshplace participants and the control group for food security, participation in
SNAP and diet quality. The sample size for these analyses changed due to
missing survey data; therefore results below are interpreted using Freshplace (n=
58) and control group (n= 52).
Three-Month Changes in Food Security
While changes for food security at 3 months were not statistically
significant, the total group of food pantry participants and each subgroup
(Freshplace and control) experienced a decrease in the number of food insecure
participants (table 11). Seventy-one percent of all food pantry participants were
considered food insecure, compared to 85% at baseline. However, more
Freshplace participants moved into food secure status over three months, shown
by an 18% decrease in those considered food insecure (84% at baseline to 66%
at 3 months). While 9% of control participants become more food secure (86% at
baseline to 77% at 3 months).
Table 11. Frequency of Food Security for Control and Freshplace 3-Months
Characteristic Control Freshplace P Value N % N %
Food Security Food secure Food insecure
12 40
23.1 76.9
20 39
33.9 66.1
.67 .21
Participation in Food Assistance Programs at Three-Months
Among those receiving food assistance, 74.3% of households receiving

61
SNAP, 77.5% of households receiving free or reduced school meals, 79.3% of
those using soup kitchens and 100% of those receiving WIC benefits remained
food insecure.
Three-Month Changes in Food Assistance Program Participation
Change in program participation rates over three months were not
statistically significant (table 12), however frequency of use of soup kitchen at 3
months was close to nearing significance (p= .06). Freshplace participants
tended to report no longer using soup kitchens to obtain food more frequently
than did Control group participants. Seven new households were enrolled in
SNAP at Freshplace, compared to 3 households in the control group. This
enrollment may have seen an even larger increase if missing data was
incorporated. There were an equal number (n =35) of total participating
households receiving SNAP at 3 months from each group. One household in the
control group went from receiving SNAP benefits at baseline to not receiving
SNAP at 3 months follow-up.

62
Table 12. Frequency of Food Assistance Participation for Control and Freshplace at 3 Months
Characteristic Control
Freshplace P
Value N % N %
Food Pantry Yes No Soup Kitchen Yes No SNAP Yes No WIC Yes No Free/Reduced Price Meals Yes No
51 1
18 34
35 17
1
51
17 35
98.1 1.9
34.6 65.4
67.3 32.7
1.9
98.1
32.7 67.3
59 0
11 48
35 24
3
56
23 36
100.0
0.0
18.6 81.4
59.3 40.7
5.1
94.9
39.0 61.0
.47
.06
.38
.62
.49
Three-Month Diet Quality Associations Among Total Sample
When comparing diet quality changes from 3 months to baseline for the
total sample, statistically significant differences were found for age and average
fat snack intake (p =.01), with older participants consuming more fat and snacks
than younger participants (<50 years old). Among Freshplace participants,
women consumed less fiber than men (p =.03). In the control group, a significant
difference (p=.05) was found for average dietary fiber intake and ethnicity, with
Blacks and West Indians consuming more fiber than Hispanic/mixed ethnicities.
Food insecurity and vitamin C intake approached significance (p =.06) in the
control group. No significant differences were found for average dietary intake,
education, employment or marital status among either sample.

63
Three-Month Average Nutrient Intake
Average nutrient intake at 3 months is show in table 13. Freshplace
participants had an average fruit and vegetable score of 13.0 (<5 servings per
day), which is greater than that for the Control participants (score of 9.9 or <3
servings/day), but still less than the recommended 5-9 servings each day.
Despite Freshplace participants having a higher average of fat and snack intake
than Control participants (23.1 versus 28.6), the snack intake is reflective of a
diet that is very high in fat. As anticipated from average fat and snack intake
results, Freshplace participants had significantly higher daily average intakes for
total fat (109.9g/day), saturated fat (31.9 g/day) and cholesterol (302.4 g/day,
when compared to the control group (94.6 g/day; 27.7 g/day; 269.9 g/day,
respectively). Dietary fiber intake was the most similar nutrient intake between
the two groups. When assessing daily micronutrient intakes, Freshplace
participants had greater average intakes of vitamin C and magnesium, compared
to the control group. The control group participants had only a slightly higher
average intake of potassium than Freshplace participants.

64
Table 13. Mean Dietary Score (Standard Error of Mean) for Control and Freshplace at 3-Months
Characteristic Control Freshplace P Value Mean (SEM) Mean (SEM)
Fruit and Vegetable Score Baseline 3 Months
11.0 (.50) 9.7 (.66)
11.0 (.52) 13.0 (.66)
.93 .00
Fat and Snack Score Baseline 3 Months
26.5 (1.08) 23.1 (1.60)
27.9 (1.08) 28.6 (1.41)
.36 .01
Daily Nutrient Intake Total Fat (g/day) Baseline 3 Months Saturated Fat (g/day) Baseline 3 Months Dietary Cholesterol (g/day) Baseline 3 Months Dietary Fiber (g/day) Baseline 3 Months Vitamin C (mg/day) Baseline 3 Months Magnesium (mg/day) Baseline 3 Months Potassium (mg/day) Baseline 3 Months
102.7 (2.6) 94.7 (3.9)
30.7 (.99) 27.7 (1.4)
296.5 (9.2)
269.9 (13.0)
14.5 (.46) 13.6 (.62)
99.8 (3.8) 90.7 (5.2)
274.6 (7.7)
257.1 (10.6)
2620.3 (72.0) 1181.1 (54.9)
106.4 (2.5) 109.9 (3.4)
31.8 (.99) 31.9 (1.3)
305.68 (9.3)
302.48 (11.8)
14.5 (.47) 15.3 (.57)
100.1 (3.9) 109.5 (4.7)
273.7 (8.1) 282.9 (9.3)
2616.8 (75.2) 1060.1 (47.8)
.32
.00
.42
.31
.48
.07
.98
.04
.94
.01
.94
.07
.97
.10
Three-Month Changes In Diet Quality Scores
Changes in diet quality were assessed for each participant by subtracting
3 month measures from baseline measure for fruit and vegetable score, fat and
snack score and seven daily nutrient intake values (total fat, saturated fat, dietary

65
cholesterol, dietary fiber, vitamin C, potassium, magnesium) as shown in table
14. Overall Freshplace participants had greater mean changes than the Control
participants for all diet quality measures. As hypothesized, 61.2% (n=36) of
Freshplace participants reported an increase in their fruit and vegetable intake
over 3 months, compared to 49% (n=26) of the control group. However, the
control group showed a greater change in fat and snack scores. Approximately
half of Freshplace participants had a decrease in their fat and snack score,
compared to 61.1% of the control participants.
Significant differences (p <.05) for the change in dietary intake from
baseline to 3 months among Freshplace and the control group were found for
fruit and vegetable intake (p= .04), dietary fiber (p = .03), vitamin C (p = .03), and
magnesium (p=.03) (table 14).
Table 14. Change Scores from Baseline to 3-Months for Mean Diet Quality Scores
Characteristic Control (n = 52)
Freshplace (n= 58)
P Value
Change (SEM) Change (SEM) Fruit and Vegetable Score -.321 (.62) 1.525 (.63) .04 Fat and Snack Score -2.384 (1.20) .483 (1.23) .10 Daily Nutrient Intake* Total Fat (g/day) Saturated Fat (g/day) Dietary Cholesterol (g/day) Dietary Fiber (g/day) Vitamin C (mg/day) Magnesium (mg/day) Potassium (mg/day)
-5.723 (2.89) -2.098 (1.06) -18.60 (9.38)
-.399 (.50) -3.554 (4.46) -6.246 (7.83)
-1333.31 (85.17)
1.158 (2.95) .425 (1.08)
3.765 (9.60) 1.192 (.52)
10.627 (4.62) 18.678 (8.13)
-1487.43 (95.58)
1.0 .10 .10 .03 .03 .03 .23
66
Three-Month Changes in Weight Status
The average BMI for Freshplace participants (29.3) indicated
overweight, while the control participants average BMI (30.7) indicated obesity.
A significant change in BMI was not anticipated due to a short period of elapse
between survey follow-ups.

67
DISCUSSION
This study explored the possible consequences associated with food
insecurity in relation to participation in food assistance programs, diet quality, and
health, and compared outcomes for Freshplace, a novel new food pantry with a
control group receiving food from traditional pantries. Findings suggest the need
for improving the nutritional status of food pantry users in the North End of
Hartford, and the available safety net of food assistance programs. A strength of
this study is that it utilized validated measures of food security status, diet quality,
and BMI. Food insecurity is a widespread measure that captures one of the daily
struggles experienced by this population.
Food Security
The use of client-choice food pantries, such as Freshplace, may play a
role in changing the level of food security experienced by participants. Over three
months the number of food insecure participants decreased in the total group by
13%, decreased 19% for Freshplace participants, and decreased 9% for the
control group. The use of Freshplace showed a greater change in becoming food
secure over 3 months compared to the control thus supporting the hypothesis
(H2).
The influence of food insecurity among low-income households directly
affects the food security status of the surrounding community. Community food
security focuses on the underlying social, economic, and institutional factors
within a community that affect the quantity, quality, and affordability of food
(Kantor, 2001). While Connecticut is the second wealthiest state in the U.S.,
68
Hartford is the second poorest medium-sized city in the country, with an
estimated poverty rate of 30.6% for 2010. The poverty rate for the neighborhood
in this study is higher, at 39.3% (City Data, 2011). Poverty has been associated
with food insecurity and hunger (Boyle et al, 2006; Coleman-Jensen et al, 2011).
The prevalence of food insecurity (85%) in this sample was almost 6 times
greater than the U.S. average rate (14.5%) in 2010 and over 7 times the
Connecticut average rate of household food insecurity (12.7%) (Coleman-Jensen
et al, 2010; FRAC, 2010). Among food insecure households at baseline, about
one third were experiencing low food security and half were experiencing very
low food security, meaning they were experiencing food insecurity with hunger by
members including children. Of households considered food secure, half were
experiencing marginal food security, or some worries or difficulties in obtaining
enough food.
In this sample, the majority of households were predominately Black,
single, and female, all characteristics associated with food insecurity in the
United States (Coleman-Jensen et al, 2011). Race and food insecurity were
close to reaching significance (p = .08). Approximately 85% of the North End is
Black, with a very strong Caribbean presence, 14% is Hispanic, less than 1% is
Asian and Caucasian and approximately 23% are foreign-born residents (Upper
Albany Main Street, Inc (UAMS), 2009). Less than 60% of Hartford’s North End
residents possess a high school degree and only 5% are college graduates
(UAMS, 2009). The study sample reflects the demographics of the neighborhood.
Residents of this area represent a largely unstudied high-risk population with

69
respect to food insecurity and nutritional health.
Participation in Food Assistance Programs
Soup kitchens and SNAP were the two most used food assistance
programs among this sample of food pantry participants. Enrollment rates show
that food pantry users were more likely to use private food assistance programs
more often than public programs. Results for participation in food assistance
programs were consistent with those of Feeding America from Hunger in
America 2010, which found that emergency food from pantries are now a part of
households’ long-term strategies to supplement monthly shortfalls in food. This is
evident among Hartford’s North End pantry users who utilize an average of three
pantries or more on a weekly basis. Yet, it should be noted that households in
this study, all receiving emergency food assistance, were still categorized as food
insecure. This indicates the unmet needs of food pantry clients and explains the
reoccurring use of emergency food assistance programs (Robaina, 2011). The
2010 study also found that among those receiving SNAP benefits, over half
(58%) are recurrent or frequent clients, suggesting that clients need additional
help from food banks and SNAP benefits do not go far enough in helping families
meet their basic nutritional needs. The high levels of household food insecurity
represented here present additional concern about the dependence of charitable
food assistance programs as a response to hunger. While SNAP alleviates some
of the effects of food insecurity on the health status of Hartford’s North End
children and families, it did not prevent the majority from being food insecure.

70
As other research on emergency food providers has shown, a large
number of these food pantry recipients were not enrolled in SNAP (41.5%) as
well as WIC benefits (46%) (Feeding America, 2010). The reason emergency
food recipients do not apply for benefits is not well understood, but access to
enrollment offices and lack of eligibility information are considerable factors.
Since this sample is largely of West Indian decent, it is likely that concern of
immigration status or language gap may pose a barrier to enrolling in a federal
program such as SNAP. Access to welfare offices tends to be limited, especially
for the elderly and working poor. Lack of transportation options, experienced by
80% of participants, and conflicting office hours with work and childcare
responsibilities may account for the notably low percentage of families
participating in programs such as WIC (O’Brien et al, 2000).
Diet Quality As supported by previous research and hypothesized, food insecurity was
significantly associated with low fruit and vegetable intake. Food pantry
participants in this study had diets low in fruits, vegetables, dietary fiber,
potassium, and magnesium and diets high in fat, saturated fat, and cholesterol.
These findings are consistent with research of U.S. adults living in food-insecure
households (Dixon et al, 2001; Rose et al, 1997; Tarasuk et al, 1999). As
hypothesized, Freshplace participants had a greater increase in fruit and
vegetable scores, along with slightly higher meat and snack scores (total fat,
saturated fat and cholesterol), and optimal vitamin C and potassium over 3
months. The control group had less fruit and vegetable intake, lower meat and

71
snack scores, and optimal magnesium intake. Freshplace participants had
greater mean score changes over 3 months than the control group for all diet
quality measures which may have occurred due to an increase in their overall
calorie intake. Dietary measures were compared to the Dietary Guidelines for
American which provides evidence-based nutrition information for people 2 years
and older. The recommendations also serve as a basis for food and nutrition
education programs (USDA: HHS, 2010).
This food pantry population averaged <4 serving of fruits and vegetables
each day, while almost half consumed less than three servings each day.
Freshplace participants averaged <4 servings of fruit and vegetables a day, one
more serving than the control group. Americans 4 years and older, along with
Hartford pantry users, are not consuming the recommended 5-9 servings each
day. Although it was a small portion of the participants, it was alarming to find
that some pantry users in this study were going some days without consuming
any fruits or vegetables. Over 3 months, Freshplace participants reported an
increase in their fruit and vegetable intake, while over one third of pantry users in
the control group had a decrease in their fruit and vegetable intake. The
increased intake of fruits and vegetables among Freshplace participants may be
due to twice monthly access to a larger variety of fresh produce.
At baseline, this pantry population received desirable amounts of vitamin C
(≥75 mg/day) but lacked intake of magnesium (<420 mg/day) and potassium
(<4,700 mg/day). Potassium and magnesium are two of the four nutrients (along
with calcium and vitamin D) of concern among Americans (USDA, 2010). While

72
the intake of these nutrients is a concern for the average person, it becomes an
even greater concern among disadvantaged populations (Mello et al, 2010).
Over 3 months, Freshplace participants had greater average intakes of vitamin C
and magnesium, while the control group had slightly higher average intake of
potassium. Dietary potassium intake can help lower blood pressure by negating
the adverse effects of sodium (USDA, 2010). Evidence suggests that African
Americans and those with hypertension specifically benefit from increasing
potassium intake. It would be beneficial for the 66% of pantry users and their
family members with high blood pressure to learn more about the benefits of
potassium and increase access to rich food sources like fruit, vegetables, nuts,
dairy products, meat and seafood sources.
Findings showed that food pantry users had diets high in total fat (mean
104.5 g/day) and saturated fat (mean 31.2 g/day). Pantry participants consumed
almost twice as many calories from total fat (40-50%) than recommended (20-
35%) by The Dietary Guidelines for Americans 2010. While Freshplace
participants consumed 4 more grams of fat each day, both groups’ fat and snack
scores correlated with diets very high in fat. Over three months, more control
group participants showed a decrease in their fat and snack scores, than
Freshplace participants. Average saturated fat contributed 14% of calories
among all food pantry users, which is higher than the American average (11%)
and the USDA recommended amount (10%) (USDA, 2010). Similar to average
American diets, major sources of saturated fat in food pantry users came from
margarine, butter, vegetable oil, eggs, full-fat cheese, fried chicken, and

73
corn/potato chips (USDA, 2010). Opposite from the majority of Americans, over
half (54%) are consuming whole milk on a regular basis. The Dietary Guidelines
for Americans 2010 recommended 3 cups of low-fat or fat-free milk and milk
products per day for those 9 to 18 years of age. Choosing low-fat milk and milk
products provides the same nutrients with less saturated fat and thus fewer
calories. . Consumption of whole milk may be based on cultural preferences, and
therefore targeted information may be needed to create behavior change for
lower-fat milk. Food pantry suppliers need to select items that are lower in
saturated fat such as lean red meats, low-fat dairy products, beans, seafood and
soy products, and provide more items high in unsaturated fats such as vegetable
oils, avocados, poultry and unsalted nuts and seeds.
It should be noted that when analyzing total fat intake one must consider
the other subcomponents besides saturated fat, such as monounsaturated and
polyunsaturated fats, which may have different health effects on blood
cholesterol and cardiovascular risk (USDA, 2010). Block et al notes that the Food
Screener does a good job at identifying individuals with high saturated fat intake,
which correlates more highly than that of total fat. If a respondent scores high on
this screener, they most certainly have a high saturated fat intake and a high
monounsaturated fat intake (Block et al, 2000).
Approximately half (52.3%) of participants were within desirable intake
and 47.8% were above desirable intake for daily cholesterol. Dietary cholesterol
has been show to raise blood LDL cholesterol levels and increase risk of
cardiovascular disease. Cholesterol intake among this food pantry population is

74
alarming considering the high number of those who reported having been told by
a doctor that they or someone in their household has diabetes or high blood
pressure, which are conditions related to cardiovascular disease. For individuals
at risk of cardiovascular disease, cholesterol intake should remain <200mg/day
(USDA, 2010).
The average dietary fiber intake among this sample was half the
recommended intake of 25-30 grams per day (USDA, 2010). This is not
surprising considering the low consumption of fruits and vegetables in this
sample. Sources of fiber in this sample of pantry users came from dark bread,
beans and fiber cereal. Male pantry participants had greater average intakes
compared to female pantry users, which may be influenced by an overall greater
calorie intake. Freshplace participants only consumed one gram more of dietary
fiber a day than the control group. Fiber helps to promote digestive health,
reduce cholesterol, stabilize blood sugars and increase satiety, which in turn
minimizes chances of chronic disease and overeating. High-fiber foods are under
consumed in the American diet and replaced with unfavorable refined flour
products. In order to meet recommendations for fiber, pantry users need to
increase their consumption of whole grains, fruits, vegetables, nuts, beans and
peas, that are naturally high in fiber.
The Block Food Screener used in this study was developed to simply
assess fat, fiber, and fruit and vegetable intake. These nutrients are most closely
associated with morbidity and mortality, and are of interest to physicians,
epidemiologists, nutritionists, and diet-conscious individuals. The screeners

75
provide a reasonably accurate ranking of nutrient intake, similar to that of a full-
length dietary questionnaire, and therefore can help identify persons with high-fat
or high-cholesterol intake, or with low fruit and vegetable intake. Because the
screeners are brief, they offer an inexpensive way to provide basic dietary
evaluation and feedback to all patients (Block et al, 2000).
Access to Healthy Foods
The low consumption of fruits and vegetables and high consumption of fat
and snacks may be due to environmental factors such as the availability of local-
area grocery stores that offer healthy, affordable products and produce to North
End residents. Supermarkets characteristically offer a larger variety of food with
cheaper prices than small stores, yet are less available in low income
communities. High food demands drive low-income families to frequent fast food
chains and convenience marts, which are more expensive and lower quality
(Powell et al, 2007). The growth of fast food and gas station mini-marts may also
explain the high fat and snack intake consumed by 85% of food pantry
participants.
Nutrition Education Efforts
Future interventions with food-insecure individuals should include nutrition
education as well as efforts to increase access and availability to healthier foods,
particularly in food pantries. The Cooking Matters program helps families improve
the way they shop, cook and eat. In a typical week, a low-income family will cook
4 dinners from scratch, 2 from a package, and 1 from a fast food restaurant
(Share Our Strength, n.d.). In 2010, Cooking Matters taught over 1,000 courses

76
to close to 12,000 low-income individuals. Nationally, program graduates showed
improvements in their eating habits, food budgeting skills and food safety
practices, all behaviors proven to reduce food insecurity and improve overall
health. (Share Our Strength, n.d). The Cooking Matters program is a beneficial
component to increasing food security as it teaches skills that will last a lifetime
and beyond as they can share knowledge, techniques and recipes with relatives
and friends. Nutrition education opportunities are often a community collaboration
and beneficial to both parties. While undergraduate students were able to
practice counseling skills and fulfill requirements for their community nutrition
rotation, Freshplace members were able to ask individualized questions and
learn about nutrition.
This research and its findings will help to fill a gap in the current literature
regarding the effects of food pantries on food security, food and nutrition
assistance program participation and diet quality.

77
Implications
This research explored relationships between food security and diet
quality of food pantry users in the North End section of Hartford and those
enrolled in Freshplace. The community founders of Freshplace, Foodshare,
Chrysalis Center and the Junior League of Hartford, can use the information to
encourage more community involvement and further development of the
Freshplace program. This information can also help encourage more donations
of healthy items such as produce, lean meats, low-fat dairy, and whole grains to
food pantries. In addition, these positive preliminary results can provide support
for community contributors in improving food security and diet quality of this
population by applying for additional grants to continue running Freshplace and
expand research regarding community food security.
This information will also serve as an important resource for community
and public health educators who serve, educate and assist food pantry
participants. This research may help them to better address the needs and
knowledge gap among the food pantry population.
Client Choice Pantries
With the demands being stressed by the current population, reliance on
private food assistance programs to solve the problem of hunger is unrealistic.
While food assistance programs do help to alleviate hunger, they temporarily
mask the symptoms. The traditional food pantry system of handing out pre-
bagged groceries for clients from a posted list are not fitting the lifestyle needs of
today’s clients. While well-meaning, often food donations are not appropriate for

78
the health conditions or cultural needs of food pantry clients. As a result, new
models such as client choice pantries, and pantries offering case management,
are being found.
Researchers at Purdue University Extension in collaboration with the
Indiana TEFAP (The Emergency Food Assistance Program) found that most of
us take for granted the wide-variety of choices and more importantly the control
over what we buy at the grocery store. No matter what income level, people
should be able to select their own food and control what they eat, a concept that
carries over into client choice pantries. Client choice is a food distribution system
used at the pantry-level that allows clients to receive greater amounts of food
while maintaining their dignity in using the pantry. Clients choose their own food
from shelves as they would at a grocery store. Less waste, resulting in less
costs, has also been seen as clients select food based on their individual
preferences, needs and circumstances and not what is solely given to them
(Purdue University, 2005). Within the client choice model there are several
methods to implement depending on the facility, staff and equipment. Other
systems include the point system, where clients are allocated points depending
on family size and items are labels with dotted stickers indicating the cost it
would be at the grocery store; the total number of items method, where each
family is given a total number of items to choose based on size and there are no
constraints except for the available amount of food; and the item list methods
which provides clients a list of available items on paper and allows them to
choose from that list (America’s Second Harvest, n.d.).

79
Like the North End’s food pantry users, most pantries are serving families
or single mothers who may have conflicts with traditional hours of operation.
Flexibility in pantry hours become important to families who may have to choose
between going to the pantry or losing income by taking work off. Freshplace
meets the needs by serving clients on both weekdays and weekends.
Community-Based Initiatives
Low-income households, specifically those in rural areas and poor central
cities, have less access to high quality, reasonably priced foods than other
households (Algert et al, 2006). There is a need for public health efforts to help
modify the current food environment. Identification of the locations with high
concentrations of food pantry clients would provide a potential incentive to
increase fresh fruit and vegetable access via mobile food trucks (Algert et al,
2006). Community-based initiatives, such as community gardens and farmers
markets, have been established in communities to increase the availability of
high quality and affordable foods for residents, especially low-income households
(Jones et al, 2011). Other food security programs include food recovery
programs, community supported agriculture and SNAP outreach programs. Many
local grocery stores participate in food recovery programs where unused
products are frozen and then donated to food banks for distribution to clients.
More programs such as these and Freshplace are needed to simultaneously
boost the effectiveness of nutrition assistance and education programs. In rural
communities these programs also help to strengthen the traditional relationship
that exists between farmers and urban consumers (Kantor, 2001).

80
LIMITATIONS
There are existing limitations to this study. All data, except for height,
weight, and BMI, were self-reported by each participant which increases social
response biases. The survey was also conducted in person by a member of the
research team, which may have influenced participants’ responses, especially in
regards to household food security and dietary intake. For example, food
insecure women may be hesitant to report that their child went without food for a
day in fear that they could be taken out of their care.
Because data was collected over a 14-month period, each season
presented a new difficulty in collecting data. In the summer months, pantry users
came more frequently when children were home from school and needed to
serve additional meals. Winter months, holidays and inclement weather changed
the pantry schedule and attendance rates. Changes to weight protocol also had
to be adjusted to account for additional layers, winter jackets, and heavy boots
for BMI calculations.
Despite using the validated Block Food Screen to measure diet quality,
Block et al (2000) suggests that the screener may be less appropriate for
persons with unusual dietary practices, such as immigrants, a population that
makes up a large portion of this sample. As a participant may have responded to
eating pizza “once a month or less,” the minimal fat and snack response, they
may instead consume other high fat cultural items weekly such as tamales or
fried plantains, which would be missed on the screener.

81
The findings of this study are specific to pantry clients who attended two
food pantries and reside in the North End of Hartford, which may lead to
coverage bias. Considering the niche of this group, the findings from this
population may not be generalized to other pantry populations.

82
CONCLUSION
While even the average American is not meeting the recommendations of
Dietary Guidelines, the consequences of poor nutrition become exacerbated
among the food-insecure. Based on the risk of food insecurity and nutrient
insufficiency present in this population, food distributors and donors to food
pantries need to reevaluate the nutritional quality of products being offered to
pantry participants. To fill the gap, more fresh fruits and vegetables are needed in
food pantries where millions of Americans rely on food. While cost of food
purchases is a barrier to dietary change, it is necessary for the government to
continue funding for food assistance programs and subsize healthier foods.
The food environment of food pantry clients needs further examination as
access to fresh produce and other healthy foods differs greatly between poor
ethnic and wealthier non-ethnic neighborhoods. Food pantry clients, many living
in poor ethnic neighborhoods, are at the greatest risk for inadequate intake of
fruits and vegetables (<4 servings/day) as many emergency food assistance
programs do not always supply fresh produce. Identification of neighborhoods
with high concentrations of food insecurity and food pantry clients with limited
access to stores carrying fresh produce could provide a potential solution to
increase fresh fruit and vegetable intake via community-based interventions.
These interventions could involve food retailers, mobile produce trucks, and more
produce in food pantries, such as Freshplace.
To help prevent food insecurity and obesity, households must have
routine, steady, and reliable access to healthy food. Grocery stores offer an

83
outlet to reach and serve low-income populations. Food-insecure individuals can
benefit from additional knowledge and skills on how to manage their food
budgets by learning how to make food and their money last. Supermarket
dietitians can serve as a resource to food insecure families by teaching about
proper nutrition and how to shop on a budget. In this economy, it is vital for this
population to adapt to changing food costs and learn budget management.
Future efforts are needed to provide low-income households with a source of
fresh fruits and vegetables, low-fat dairy products, lean meats and seafood.
The use of case management within food pantries can help address the
underlying issues of poverty to help prevent obesity and malnutrition. Policy
changes along with other intervention strategies should simultaneously consider
these nutritional problems, without putting families at more risk for food insecurity
and under nutrition. The role of food and nutrition assistance programs such as
SNAP and WIC should be reevaluated to more effectively promote healthful food
choices and reduce risk for obesity to underserved populations such as the
homeless, children of undocumented immigrants and those with limited English
skills (Larson et al, 2011).
The link between food insecurity, poor diet quality and obesity explained
here, supports the evidence that nutritional problems do coexist. This further
emphasizes the need to reduce the risk of food insecurity with adequate funding
for food and nutrition assistance programs, availability of healthy food choices,
nutrition education and programs to help build the livelihood of food insecure
individuals, families and households.

84
APPENDIX 1
3
Household Food Security in the United States, 2009 / ERR-108 Economic Research Service/USDA
1. “We worried whether our food would run out before we got money to buy more.” Was that often, sometimes, or never true for you in the last 12 months?
2. “The food that we bought just didn’t last and we didn’t have money to get more.” Was that often, sometimes, or never true for you in the last 12 months?
3. “We couldn’t afford to eat balanced meals.” Was that often, sometimes, or never true for you in the last 12 months?
4. In the last 12 months, did you or other adults in the household ever cut the size of your meals or skip meals because there wasn’t enough money for food? (Yes/No)
5. (If yes to question 4) How often did this happen—almost every month, some months but not every month, or in only 1 or 2 months?
6. In the last 12 months, did you ever eat less than you felt you should because there wasn’t enough money for food? (Yes/No)
7. In the last 12 months, were you ever hungry, but didn’t eat, because there wasn’t enough money for food? (Yes/No)
8. In the last 12 months, did you lose weight because there wasn’t enough money for food? (Yes/No)
9. In the last 12 months did you or other adults in your household ever not eat for a whole day because there wasn’t enough money for food? (Yes/No)
10. (If yes to question 9) How often did this happen—almost every month, some months but not every month, or in only 1 or 2 months?
(Questions 11-18 were asked only if the household included children age 0-17)
11. “We relied on only a few kinds of low-cost food to feed our children because we were running out of money to buy food.” Was that often, sometimes, or never true for you in the last 12 months?
12. “We couldn’t feed our children a balanced meal, because we couldn’t afford that.” Was that often, sometimes, or never true for you in the last 12 months?
13. “The children were not eating enough because we just couldn’t afford enough food.” Was that often, sometimes, or never true for you in the last 12 months?
14. In the last 12 months, did you ever cut the size of any of the children’s meals because there wasn’t enough money for food? (Yes/No)
15. In the last 12 months, were the children ever hungry but you just couldn’t afford more food? (Yes/No)
16. In the last 12 months, did any of the children ever skip a meal because there wasn’t enough money for food? (Yes/No)
17. (If yes to question 16) How often did this happen—almost every month, some months but not every month, or in only 1 or 2 months?
18. In the last 12 months did any of the children ever not eat for a whole day because there wasn’t enough money for food? (Yes/No)
Questions Used To Assess the Food Security of Households in the CPS Food Security Survey

85
APPENDIX 2
Evaluating Freshplace1
COVER SHEET
I want to ask you a few questions about you and the people you live with. Please remember, your answers will be kept completely confidential. Contact Information: Member # _______ First Name _______________________ Last Name _________________________ Home Phone _________________ Cell Phone __________________ No Phone ____ Address ___________________________________ Apt. # ___________________ ZIP ______________ Please name an emergency contact who does not live with you but knows you well and how to contact you: Name of Friend or Relative ______________________________ Phone ___________ Name of Friend or Relative ______________________________ Phone____________ Once randomize into two groups, mark which group: _____ Freshplace _____ Food Pantry comparison group
[This cover sheet stays with the Freshplace client file, and will be filed separately for the UConn files
to maintain the confidentiality of clients.] BASELINE SURVEY INSTRUMENT
1 Version 3, revised June 21, 2010.

86
Member # _______________________ Date of Survey ______________________ Interviewer ________________________ Place of Recruitment: Food Pantry Name ___________________________________ Demographic Information: How many people, including you, live in your household? _______________ What is your date of birth? __________ How many children are 5 years of age or under? _________ How many children are between 6 – 17 years of age?______ Which of the following does your family use to get food? For all YES answers, ask how often they use the program ____ Soup kitchens Frequency:__________________________________ ____ Food pantries Frequency:__________________________________ If yes to Food pantries, how many different pantries do you usually go to ____ ____ Food Stamps / EBT / SNAP Frequency:___________________ ____ WIC Frequency:___________________ ____ Free/reduced price school meals Frequency:___________________ ____ Earned Income Tax Credit Frequency:___________________ ____ Energy Assistance / Rent Rebate Frequency:___________________ ____ Other ____________________ Frequency:___________________ How do you describe your race or ethnicity? ____ Hispanic / Latino ____Black / African American ___White ____Asian / Pacific Island ____West Indian Other: ____________ What is your marital status? ____ Single ____Married ____Separated ___Living with Partner ____Widowed [Interviewer: please mark based on observation:] Gender: ____ Female ____ Male

87
Food Insecurity / Hunger Survey
(Adapted from Food Security / Hunger Core Module, 3-Stage Design, with Screeners: USDA, FCS: 2/20/97)
Available at http://www.ers.usda.gov/Briefing/FoodSecurity/surveytools.htm.) Now I’m going to read you several statements that people have made about their food situation. For these statements, please tell me whether the statement was OFTEN true, SOMETIMES true, or NEVER true for your household in the last 12 months, that is, since last (name of current month). Often Sometimes Never DK/ True True True Refused 1. The first statement is “We worried whether our food would run out before we got money to buy more.” 2. “The food that we bought just didn’t last, and we didn’t have money to get more.” 3. “We couldn’t afford to eat balanced meals.” [If needed: Probe: We couldn't eat a variety of foods, we used the same foods over and over.] SCREENER: If have children, continue to Q4. If do not have children and “sometimes or often true” to any question, go to Q7. If “never true” to all 3 questions, stop and go to Page 5. Often Sometimes Never DK/ True True True Refused 4. “We relied on only a few kinds of low-cost food to feed my/our child/the children because we were running out of money to buy food.” 5. “We couldn’t feed my/our child/the children a balanced meal, because we couldn’t afford that.” 6. “(My child was/ My children were) not eating enough because we just couldn’t afford enough food.” SCREEN Two: Questions 7-12 [INTERVIEWER: If "often true" or "sometimes true" to any one of Questions 1-6, then continue to Q7; otherwise, go to Page 5.] 7. In the last 12 months, since last (name of current month), did you or other adults in your household ever cut the size of your meals or skip meals because there wasn’t enough money for food? Yes No (Go to Q9) DK/Refused (Go to Q9)
8. [IF YES to Q7, ASK] How often did this happen - almost every month, some months but not every month, or in only 1 or 2 months?
Almost every month Only 1 or 2 months Some months but not every month DK/Refused

88
Yes No DK/Refused
9. In the last 12 months, did you ever eat less than you felt you should because there wasn’t enough money to buy food? 10. In the last 12 months, were you ever hungry but didn’t eat because you couldn’t afford enough food? 11. In the last 12 months, did you lose weight because you didn’t have enough money for food? 12. In the last 12 months, did you or other adults in your household ever not eat for a whole day because there wasn’t enough money for food? Yes No (go to Q14) DK/Refused (go to Q14)
13. [IF YES to Q12, ASK] How often did this happen - almost every month, some months but not every month, or in only 1 or 2 months?
Almost every month Only 1 or 2 months
Some months but not every month DK/Refused SCREEN Three: If do not have children, go to Page 5. If have children and If affirmative response to any one of Questions 7-13, then continue to Q14; otherwise, go to Page 5.] 14. The next questions are about children living in the household who are under 18 years old. In the last 12 months, since (current month) of last year, did you ever cut the size of (your child/any of the children’s) meals because there wasn’t enough money for food? Yes No DK/Refused 15. In the last 12 months, did any of the children ever skip meals because there wasn’t enough money for food? Yes No (go to Q17) DK/Refused (go to Q17)
16. [IF YES to Q15, ASK] How often did this happen - almost every month, some months but not every month, or in only 1 or 2 months?
Almost every month Only 1 or 2 months
Some months but not every month DK/Refused
Yes No DK/ Refused
17. In the last 12 months, (was your child/were the children) ever hungry but you just couldn’t afford more food? 18. In the last 12 months, did (your child/any of the children) ever not eat for a whole day because there wasn’t enough money for food?

89
Self Efficacy Scale for Food Security
It is often hard to prepare meals the way we might want to. There are usually a lot of demands on our time, and other things often get in the way. Given these problems, I would like to ask you how confident you are that you can do some things that are related to getting enough food for your family. For each of the following items I would like you to tell me, on a scale from 1 to 4, how confident you are that you can do each thing. The scale is: 1 = not at all confident, 2 = not very confident, 3 = somewhat confident, 4 = very confident How confident are you that you can (Repeat this stem for each item):
1. Plan meals ahead of time? 1 2 3 4
2. Make your food money last all month? 1 2 3 4
3. Make a shopping list before going to the grocery store? 1 2 3 4
4. Compare prices before you buy food to get the best deal? 1 2 3 4
5. Make low-cost meals? 1 2 3 4
6. Buy foods that you think are healthy for your family? 1 2 3 4

90
Fruit, Vegetable, Fiber and Fat Screener Think about what you usually ate last month. Think about the foods you ate at breakfast, lunch, dinner, snacks and eating out. About how many times per month, week or day did you eat the following foods?
Fruit, vegetable or grain Less than 1/WEEK
Once a WEEK
2-3 times / WEEK
4-6 times / WEEK
Once a DAY
2+ a DAY
100% Fruit juice, like orange, apple, grape, (not soda or juice drinks)
How often do you eat any fruit, fresh or canned (not counting juice)
Vegetable juice, like tomato or V-8
Green lettuce salad Vegetable soup or stew with veggies
Any other vegetables, including peas, corn, broccoli or any other kind
Fiber cereals like Raisin Bran, Total or Shredded Wheat
Brown rice Beans such as pinto, kidney or lentils
Dark bread such as whole wheat or rye
Again, thinking about your eating habits over the past 30 days. About how often do you eat each of the following foods? Remember breakfast, lunch, dinner, snacks and eating out.
Meats and Snacks 1/ MONTH or less
2-3 times/ MONTH
1-2 times a WEEK
3-4 times a WEEK
5+ times a WEEK
Hamburgers, ground beef, meat burritos, tacos
Beef or pork, such as steaks, roasts, ribs
Fried chicken Hot dogs, or sausage Bacon or breakfast sausage Salad dressings (not low-fat) Margarine, butter or mayo on bread
Margarine, butter or oil in cooking
Eggs (not Egg Beaters or egg whites)
Pizza Cheese (not low-fat) Whole milk French fries, fried potatoes Corn chips, potato chips or crackers
Doughnuts, pastries, cake, or cookies
Ice cream Soda (not diet)

91
Multidimensional Scale of Perceived Social Support (Zimet, Dahlem, Zimet & Farley, 1998)
Next, we are interested in how you feel about the following statements. For each statement, please tell me how you feel about each one based on the following scale: 1 = Strongly Disagree 2 = Disagree a little 3 = Neutral 4 = Agree a little 5 = Strongly Agree SD D N A SA 1. There is a special person who is around when I am in need. 1 2 3 4 5 2. There is a special person with whom I can share my joys and sorrows.1 2 3 4 5 3. My family really tries to help me. 1 2 3 4 5 4. I get the emotional help and support I need from my family. 1 2 3 4 5 5. I have a special person who is a real source of comfort to me. 1 2 3 4 5 6. My friends really try to help me. 1 2 3 4 5 7. I can count on my friends when things go wrong. 1 2 3 4 5 8. I can talk about my problems with my family 1 2 3 4 5 9. I have friends with whom I can share my joys and sorrows. 1 2 3 4 5 10. There is a special person in my life who cares about my feelings 1 2 3 4 5 11. My family is willing to help me make decisions 1 2 3 4 5 12. I can talk about my problems with my friends. 1 2 3 4 5
Social Capital Scale: Now I’m going to ask you some questions about your neighborhood. For each of these questions, please tell me whether you strongly disagree = 1, disagree = 2, agree = 3 or strongly agree = 4. SD D A SA 1. People around here are willing to help their neighbors. 1 2 3 4 2. This is a close-knit, or "tight" neighborhood where people 1 2 3 4
generally know one another. 3. If I had to borrow $30 in an emergency, I could borrow it 1 2 3 4
from a neighbor. 4. People in this neighborhood generally don't get along with 1 2 3 4
each other. 5. People in this neighborhood can be trusted. 1 2 3 4 6. If I were sick I could count on my neighbors to shop for 1 2 3 4
groceries for me. 7. People in this neighborhood do not share the same values. 1 2 3 4
Is anyone in your family a member of a social or civic organization such as the Boy Scouts, a church, or the PTA? ______ Yes ______ No
How long have you lived in your house or apartment? ______________ years

92
Health Information
1. Has a doctor ever told you or someone in your household that you: Have diabetes? _____ Yes _____ No
1a. If yes, are you getting treatment or taking medication? ______ Yes ______ NO 2. Has a doctor ever told you or someone in your household that you:
Have high blood pressure? _____ Yes _____ No 2a. If yes, are you getting treatment or taking medication? ______ Yes ______ NO Now I want to measure your height and weight. 3. Measuring using scale and stadiometer: Height (without shoes) ____________ inches Weight (without shoes) ____________ pounds 4. BMI calculation (entered later in office): _______
____Underweight _____ Normal Weight _____ Overweight _____ Obese
5. How often do you get moderate exercise, like walking for at least 20 minutes? ____Once/month ___2-3 x/month ____1x/wk ___2-3 x/wk ___4-6x/wk ____1x/day

93
Self Sufficiency Scale 2 (Missouri Community Action Family Self Sufficiency Scale)
IMPORTANT IMPORTANT IMPORTANT IMPORTANT IMPORTANT The Scale should be administered in the presence of the family, with their full participation Text in Bold should be read verbatim Numbers in parentheses at the end of items indicates the appropriate score for that response
Tell the family: Now I want to ask you some questions about your family. We will be looking at your CURRENT situation, specifically how your ability to be self-sufficient is influenced by certain situations. Your input is very important. We will look at ten areas. For each area I will ask several questions about your CURRENT situation. If you are not comfortable answering a question, please let me know and decline the question. Please do NOT give inaccurate information. We will do a follow-up interview in about three months so we can see your progress and evaluate the plan we put together. Do you have any questions? EDUCATIONAL ATTAINMENT 1a. What is the highest grade you completed in school? (Circle response) Grade 1 2 3 4 5 6 7 8 9 10 11 12 HSDIPLOMA GED COLLEGE AS BS/BA MA If less than an associate’s degree, ASK:
1b. Have you served a trade apprenticeship or completed a technical certificate?___________
1c. Have you continued your education in any other way? For example, have you taken a Certified Nursing Assistant (CNA) course or other vocational courses; attended college classes or schooling provided by your employer? __________________________________________
2 Interview for Scale Administration Missouri Community Action Family Self-‐Sufficiency Scale © Missouri Association for Community Action and Annette Backs, LCSW 3-28-99
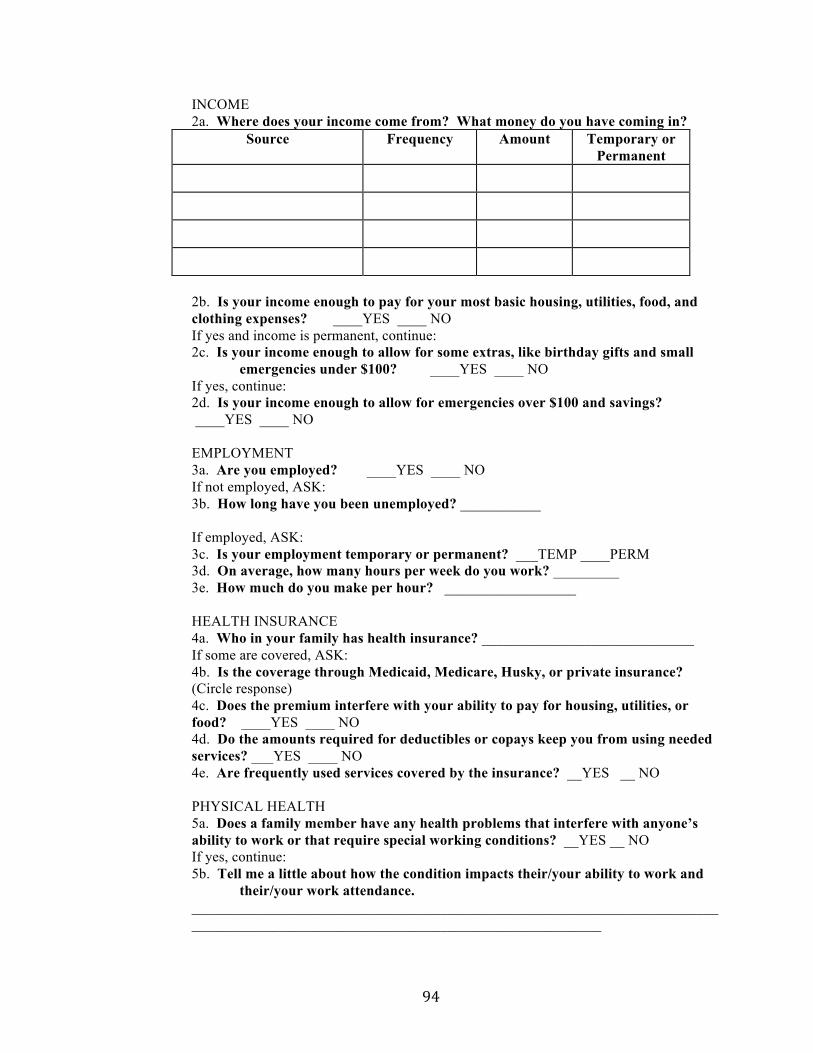
94
INCOME 2a. Where does your income come from? What money do you have coming in?
Source Frequency Amount Temporary or Permanent
2b. Is your income enough to pay for your most basic housing, utilities, food, and
clothing expenses? ____YES ____ NO If yes and income is permanent, continue:
2c. Is your income enough to allow for some extras, like birthday gifts and small emergencies under $100? ____YES ____ NO
If yes, continue: 2d. Is your income enough to allow for emergencies over $100 and savings? ____YES ____ NO
EMPLOYMENT 3a. Are you employed? ____YES ____ NO
If not employed, ASK: 3b. How long have you been unemployed? ___________ If employed, ASK: 3c. Is your employment temporary or permanent? ___TEMP ____PERM 3d. On average, how many hours per week do you work? _________ 3e. How much do you make per hour? __________________
HEALTH INSURANCE 4a. Who in your family has health insurance? _____________________________
If some are covered, ASK: 4b. Is the coverage through Medicaid, Medicare, Husky, or private insurance? (Circle response) 4c. Does the premium interfere with your ability to pay for housing, utilities, or food? ____YES ____ NO 4d. Do the amounts required for deductibles or copays keep you from using needed services? ___YES ____ NO
4e. Are frequently used services covered by the insurance? __YES __ NO
PHYSICAL HEALTH 5a. Does a family member have any health problems that interfere with anyone’s ability to work or that require special working conditions? __YES __ NO
If yes, continue: 5b. Tell me a little about how the condition impacts their/your ability to work and
their/your work attendance. ________________________________________________________________________
________________________________________________________

95
MENTAL HEALTH AND SUBSTANCE ABUSE These next questions make some people uncomfortable. If you don’t feel you can answer a question, please let me know and we’ll move on to the next section. It’s important that I have accurate information. That way, I will be better able to measure changes.
6a. Does anyone in your household have any problems with their emotions or mental health?
____YES ____ NO If yes, continue: 6b. Please tell me a little about the situation and how it affects your family.
If necessary, follow-up with questions about impact on finances, housing, utilities, employment, treatment programs, and medication costs.
______________________________________________________________ _____________________________________________________________
6c. Does anyone in your household ever use alcohol or drugs in a way that might keep your family from reaching its goals?
____YES ____ NO If yes, continue:
6d. Please tell me a little about the situation and how it affects your family. If necessary, follow-up with questions about impact on finances, housing,
utilities, employment, treatment programs, and legal problems. ________________________________________________________________ ________________________________________________________________
HOUSING 7a. How do you describe your housing situation? ____________________________ ___ Own _____ Rent ____ Temporary/living w friend ____ Transitional/Shelter ____Homeless
7b. Do you get any help paying your rent?_____________________________
____ Family helping ____ Renters Rebate _____ Section 8
7c. Do you have any problems paying your rent/mortgage on time? __YES __NO
7d. Have there been any threats of eviction/foreclosure or are you in danger of losing your apt? ____YES ____NO
7e. What problems, if any, are there with the plumbing, electrical work, heating, water, or structure of the home?_________________________

96
CHILD CARE 8a. Do you have children under age 13? ____YES ____NO (10)
If yes, continue: 8b. What arrangements, if any, do you have for your children while you work or
attend school? _____________________________________ 8c. Are there any barriers, such as transportation, hours of operation, reliability, or
copays that make child care a problem? _____________________________________________
8d. Do you receive any financial assistance for child care? ____________________________________________________
8e. How would you describe your child care arrangements in terms of each of the following:
Safety: _________________________________________________ Cleanliness and general environment: _________________________ Nutritious meals: _________________________________________ Structured activities: ______________________________________ Adult supervision: ________________________________________
Age-appropriate toys: _____________________________________ 8f. What back-up plan(s) do you have if your usual provider isn’t available or your child is ill? ________________________________________________________________ TRANSPORTATION 9a. Do you own a car? _____ Yes _____ No
9b.Can you borrow a car from a friend or relative? _____ Yes _____ No
9c. How do you usually get around when going to work, school, grocery store, and appointments?
________________________________________________________________
9d. What problems, if any, do you have with transportation? For example: reliability, cost, needed routes and schedules, access, need for second car. _________________________________________________________________ ______________________________________________________________
If the family has a CAR, ASK: 9e. How often do you have difficulty paying for gas?
____ Never ____ Sometimes ____ Frequently
9f. How dependable is the car? ___Very dependable ___Usually dependable ___ Needs repair now __ Highly undependable

97
PSYCHOSOCIAL AND ENVIRONMENTAL STRESSORS While everyone experiences some amount of stress, sometimes certain s tressors interfere with a family’s ability to work toward its goals. For example, domestic violence, legal problems, divorce, dissatisfaction with work, heavy debt, stressful relationships, problems with your children, truancy, and the like can make it hard to keep focused on the things you want to do for your family. I’d like to take a moment now for us to discuss any of these, or other stressors, that might CURRENTLY be affecting your family.
10a. Are you CURRENTLY experiencing any stressors that might make it hard for you to achieve your goals? If so, may we talk about them so we can track changes over time?
Stressor(s) _________________________________________________________________
10b. How does the stress impact your ability to take care of your family? ________________________________________________________________________________________________________________________________________________________________________________________________________________________________________________________________________ 10c. Are you getting help from any other sources to cope with these difficulties? ___________________________________________________________________________________________________________________________________________________________________________________________________ 10d. Have you ever thought about getting help? __________________________________________________________________________________________________________________________________ Remember, we will repeat these questions again in 3 months and will pay you another $5 then. Thank you very much!

98
References
Akobundu, U.O., Cohen, N.L., Laus, M.J., Schulte, M.J., Soussloff, M.N. (2004).
Vitamins A and C, calcium, fruit and dairy products are limited in food
pantries. Journal of American Dietetic Association, 104, 811-813.
Alaimo, K., Olson, C.M., Frongillo, E.A. (2001). Food insufficiency and American
school-aged children’s cognitive, academic and psychosocial
development. Pediatrics, 108, 44 –53.
Alaimo, K., Olson, C.M., Frongillo, E.A. (2002). Family food insufficiency, but not
low family income, is positively associated with dysthymia and suicide
symptoms in adolescents. Journal of Nutrition, 132,719–725.
Algert, S.J., Agrawal, A., Lewis, D. (2006). Disparities in access to fresh produce
in low- income neighborhoods in Los Angeles. American Journal of
Preventative Medicine, 30(5), 365–370.
Algert, S.J., Reibel, M., Renvall, M.J. (2006). Barriers to participation in the Food
Stamp Program among food pantry clients in Los Angeles. American
Journal of Public Health, 96, 807–809.
America’s Second Harvest. (n.d.) Ending hunger through client choice pantries.
Accessed October 14, 2011 from
http://pantrynet.org/college/Ending%20Hunger%20Through%20Client%20
Choice%20Pantries.htm
Anderson, S.A. (1990). Core indicators of nutritional status for difficult to sample
populations. Journal of Nutrition, 20(11), 1557-1600.

99
Andrews, M. (2010). More Americans relied on food assistance during recession.
Amber Waves: The Economics of Food, Farming, Natural Resources and
Rural America. Retrieved June 10, 2011, from
http://www.ers.usda.gov/AmberWaves/December10/Findings/FoodAssista
nce.ht m
Bandura, A. (2004). Health promotion by social cognitive means. Health
Education & Behavior, 31(2), 143-164.
Bartfield, J.S., Ahn, H.M. (2011). The School Breakfast Program strengthens
household food security among low-income households with elementary
school children. Journal of Nutrition, 141(3), 470-475.
Basiotis, P.P., Carlson, A., Gerrior, S.A., Juan, W.Y., Lino, M. (2004). The
Healthy Eating Index, 1999-2000: Charting dietary patterns of Americans.
Family Economics and Nutrition Review, 16, 39-48.
Bickel, G., Nord, M., Price, C., Hamilton, W., Cook, J. (2000). Guide to
Measuring Household Food Security, Revised 2000. Alexandria, VA: U.S.
Department of Agriculture, Food and Nutrition Service.
Biggerstaff, M.A., McGrath Morris, P., Nichols-Casebolt, A. (2002). Living on the
edge: Examination of people attending food pantries and soup kitchens.
Social Work, 47(3), 267-277.
Block, G., Gillespie, C., Rosenbaum, E.H., Jenson, C. (2000). A rapid food
screener to assess fat and fruit and vegetable intake. American Journal of
Preventative Medicine, 18(4), 284-288.

100
Block, J.P., Scribner, R.A., DeSalvo, K.B. (2004). Fast food, race/ethnicity, and
income: A geographic analysis. American Journal of Prevative
Medicine, 27(3), 211-217.
Boyle, M.A., Holben, D.H. (2006). Food Insecurity and the Food Assistance
Programs. Community Nutrition in Action. 4th ed. Belmont, CA:
Thomason Wadsworth,116-163.
Campbell, C.C. (1991). Food insecurity: a nutritional outcome or a predictor
variable? Journal of Nutrition, 121, 408-415.
Center for Disease Control and Prevention: National Center for Chronic Disease
Prevention and Health Promotion Division of Nutrition. (2001). About BMI
for Adults. Retrieved July 16, 2011, from
http://www.cdc.gov/healthyweight/assessing/bmi/adult_bmi/index.html.
City Data. (2011). Upper Albany neighborhood in Hartford, Connecticut (CT),
06105, 06112 detail profile. Retrieved October 14, 2011 from
http://www.city-data.com/neighborhood/Upper-Albany-Hartford-CT.html
Coleman-Jensen, A., Nord, M., Andrews, M., Carlson, S. (2011). Household
Food Security in the United States in 2010. United States Department of
Agriculture. Retrieved June 10, 2011, from
http://www.ers.usda.gov/Publications/ERR125/
Connecticut Food Bank. (n.d.). Hunger Learning Center: Facts and stats.
Retrieved October 13th, 2011, from http://www.ctfoodbank.org/facts.php.

101
Cook, J.T., Frank, D.A., Berkowitz, C., Black, M.M., Casey, P.H., … Nord, M.
(2004). Food insecurity is associated with adverse health outcomes in
human infants and toddlers. Journal of Nutrition, 134, 1432-1438.
Duffy, P., Zizza, C., Jacoby, J., Tavie, F.A. (2009). Diet quality is low among
female food pantry clients in Eastern Alabama. Journal of Nutrition
Education and Behavior, 41, 414-419.
Dietz, W. H. (1995). Does hunger cause obesity? Pediatrics, 95, 766–767.
Dixon, L.B., Winkleby, M.A., Radimer, K.L. (2001). Dietary intakes and serum
nutrients differ between adults from food-insufficient and food- sufficient
families: Third National Health and Nutrition Examination Survey, 1988–
1994. Journal of Nutrition, 131, 1232–1246.
Drewnowski, A., Darmon, N. (2005). Food choices and diet costs: an economic
analysis. Journal of Nutrition, 135, 900–904.
Drewnowski, A., Specter, S.E. Poverty and obesity: the role of energy density
and energy costs. American Journal of Clinical Nutrition, 2004,79, 6-16.
Echevarria, S., Santos, R. (2011). Feeding America Report of Food Banks:
Hunger’s New Staple. Retrieved October 7, 2011, from
http://feedingamerica.org/press-room/press-releases/hungers-new-
staple.aspx
Feeding America. (2010). 2010 Annual Report. Chicago, IL: Feeding America.
Retrieved June 25, 2011, from http://annualreport.feedingamerica.org.
Food Research and Action Center (FRAC). (2009). Hunger in the US. Retrieved
July 1, 2011, from

102
http://www.frac.org/html/hunger_in_the_us/hunger_index.html.
Food Research and Action Center (FRAC). (2010). Federal food/nutrition
programs. Retrieved June 25, 2011, from http://frac.org/federal-
foodnutrition-programs/
Food Research and Action Center (FRAC). (2011). SNAP/ Food Stamp Monthly
Participation Data 201. Retrieved February 20, 2012, from
http://frac.org/reports-and-resources/snapfood-stamp-monthly-
participation- data/
Frongillo, E.A., Jyoti, D.F., Jones, S.J. (2006). Food Stamp Program participation
is associated with better academic learning among school children.
Journal of Nutrition, 136(4), 1077-1080.
Guenther, P.M., Dodd, K.W., Reedy, J., Krebs-Smith, S. (2006). Most Americans
eat much less than recommended amounts of fruits and vegetables.
Journal of American Dietetic Association, 106, 1371-1379.
Hoisington, A., Schultz, J.A., Butkus, S. (2002). Coping strategies and nutrition
education needs among food pantry users. Journal of Nutrition Education
and Behavior, 34, 326-333.
Jones, P., Bhatia, R. (2011). Supporting equitable food systems through food
assistance at farmers’ markets. American Journal of Public Health, 101,
781-783.
Jones, S.J., Jahns, L., Laraia, B., Haughton, B. (2003). Lower Risk of overweight
in school-aged food insecure girls who participate in food assistance:

103
Results from the Panel Study of Income Dynamics Child Development
Supplement. Archives of Pediatrics & Adolescent Medicine, 157, 780–784.
Jyoti, D.F., Frongillo, E.A., Jones, J.S. (2005). Food insecurity affects school
children’s academic performance, weight gain, and social skills. Journal of
Nutrition, 135, 2831-2839.
Kantor, L.S. (2001). Community food security programs improve food access.
Food Review, 24(1), 20-26.
Kaufman, P.K., MacDonald, J.M., Lutz, S.M., Smallwood, D.M. (1997). Do the
Poor Pay More for Food? Item Selection and Price Differences Affect Low-
Income Household Food Costs. Food and Rural Economics Division,
Economic Research Service, United States Department of Agriculture,
Agricultural Economic Report No. 759.
Kempson, K., Keenan, D.P., Sadan, P.S., Adler, A. (2003). Maintaining food
sufficiency: coping strategies identified by limited-resource individuals
versus nutrition educators. Journal of Nutrition Education and Behavior,
35, 179-188.
Keenan, D.P., Olson, C., Hersey, J., Parmer, S.M. (2001). Measures of food
insecurity/security. Journal of Nutrition Education and Behavior, 33, 49-58.
Kimmons, J., Gillespie, C., Seymous, J., Serdula, M., Blanck, H.M. (2009). Fruit
and vegetable intake among adolescents and adults in the United States:
percentage meeting individualized recommendations. Medscape Journal
of Medicine, 11(1), 26.
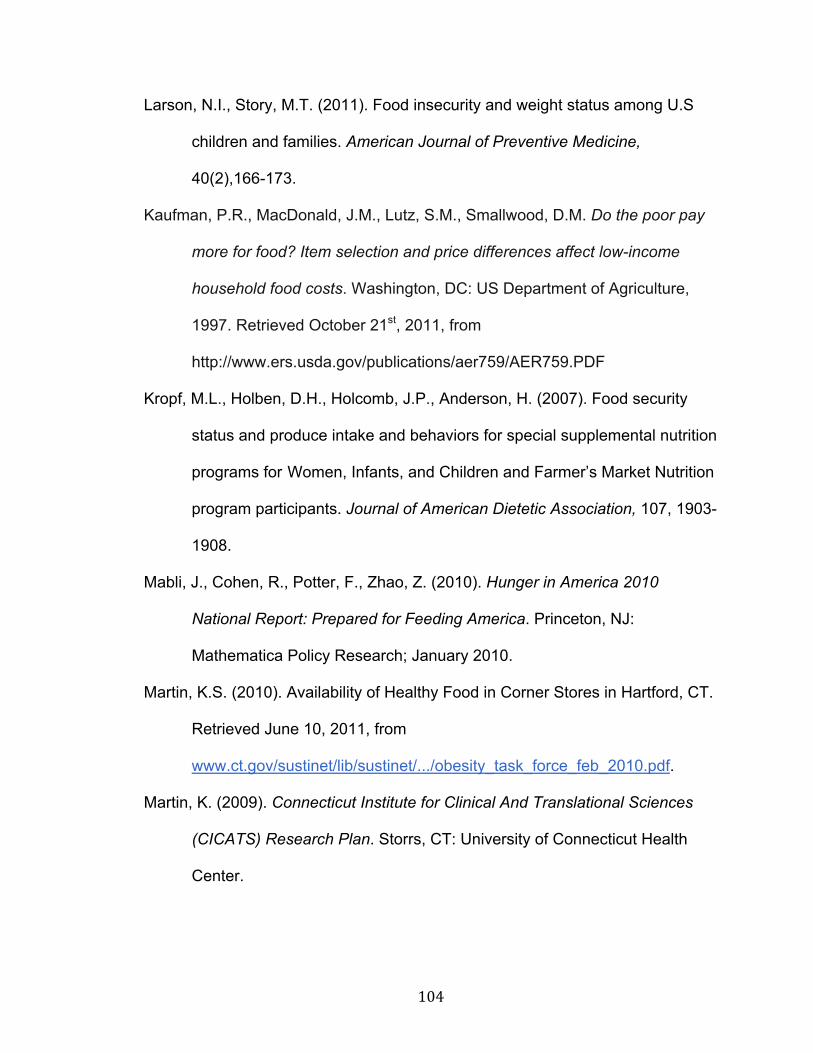
104
Larson, N.I., Story, M.T. (2011). Food insecurity and weight status among U.S
children and families. American Journal of Preventive Medicine,
40(2),166-173.
Kaufman, P.R., MacDonald, J.M., Lutz, S.M., Smallwood, D.M. Do the poor pay
more for food? Item selection and price differences affect low-income
household food costs. Washington, DC: US Department of Agriculture,
1997. Retrieved October 21st, 2011, from
http://www.ers.usda.gov/publications/aer759/AER759.PDF
Kropf, M.L., Holben, D.H., Holcomb, J.P., Anderson, H. (2007). Food security
status and produce intake and behaviors for special supplemental nutrition
programs for Women, Infants, and Children and Farmer’s Market Nutrition
program participants. Journal of American Dietetic Association, 107, 1903-
1908.
Mabli, J., Cohen, R., Potter, F., Zhao, Z. (2010). Hunger in America 2010
National Report: Prepared for Feeding America. Princeton, NJ:
Mathematica Policy Research; January 2010.
Martin, K.S. (2010). Availability of Healthy Food in Corner Stores in Hartford, CT.
Retrieved June 10, 2011, from
www.ct.gov/sustinet/lib/sustinet/.../obesity_task_force_feb_2010.pdf.
Martin, K. (2009). Connecticut Institute for Clinical And Translational Sciences
(CICATS) Research Plan. Storrs, CT: University of Connecticut Health
Center.

105
Martin, K., Cook, J., Rogers, B., Joseph, H. (2003). Public versus private food
assistance: Barriers to participation differ by age and ethnicity. Journal of
Nutrition Education and Behavior, 35(5), 249-254.
Martin, K., Ferris, A. (2007). Food insecurity and gender are risk factors for
obesity. Journal of Nutrition Education and Behavior, 39(1), 31-36.
Martin, K.S., Rogers, B.L, Cook, J.T., Joseph, H.M. (2004). Social capital is
associated with decreased risk of hunger. Social Science Medicine. 58,
2645-2654.
Mello, J.A., Gans, K.M., Risica, P.M., Kirtania, U., Strolla, L.O., Fournier, L. How
is food insecurity associated with dietary behaviors? An analysis with low-
income, ethnically diverse participants in a nutrition intervention study.
Journal of the American Dietetic Association. 2010, 10(12), 1906-1911.
Monsivais P, Drewnowski A. The rising cost of low-energy-density foods. Journal
of American Dietetic Association. 2007, 107, 2071–2076.
NutritonQuest. (2009). Assessment and analysis services: Questionnaires and
screeners. Retrieved March 18, 2012, from
http://www.nutritionquest.com/assessment/list-of-questionnaires-and-
screeners/
Nord, M., Coleman-Jensen, A., Andrews, M., Carlson, S. (2010). Measuring food
security in the United States: Household food security in the United
States, 2009. United States Department of Agriculture. Retrieved June
10, 2011, from
http://www.ers.usda.gov/Publications/ERR108/ERR108.pdf

106
O’Brien, D., Prendergast, K., Thompson, E., Fruchter, M., Aldeen, H.T. (2000).
The Red Tape Divide: State-by-State Review of Food Stamp Applications.
America's Second Harvest, Retrieved February 25, 2012, from
www.ilaborate.org/fetch/feeding_america_1.pdf.
Oliveira, V. (2010). The Food Assistance Landscape: FY 2009 Annual Report,
EIB-6-7, USDA, Economic Research Service. Retrieved June 25, 2011,
from www.ers.usda.gov/publications/eib6-7/.
Olson, C.M. (1999). Nutrition and health outcomes associated with food
insecurity and hunger. Journal of Nutrition, 129(suppl), 521S–524S.
Purdue University. (2005). Client Choice Food Pantries: Models For Now
And Then. Accessed October 14, 2011, from
http://www.cfs.purdue.edu/safefood/Choice/client%20choice%20manual.p
df
Polivy, J. (1996) Psychological consequences of food restriction. Journal of
American Dietetic Association, 96, 589–592.
Powell, L.M., Auld, C, Chaloupka, F.J., O’Malley, P.M., Johnston, L.D. (2007).
Associations Between Access to Food Store and Adolescent Body Mass
Index. Journal of Preventative Medicine, 33, 301-307.
Rank, M., Hirschl, T.A. (2005). Likelihood of using Food Stamps during the
adulthood years. Journal of Nutrition Education and Behavior, 37,137-146.
Robaina, K,A. (2011). Food security, diet quality and health of food pantry
participants in the North End of Hartford. Retrieved January 15, 2012,
from

107
http://digitalcommons.uconn.edu/do/search/?q=food%20security&start=0&
context=209736
Rose, D., Oliveria, V. (1997). Nutrient intakes of individuals from food-insufficient
households in the United States. American Journal of Public Health.
87,12,1956-1961.
Seligman, H.K., Laraia, B.A., Kushel, M.B. (2010). Food insecurity is associated
with chronic disease among low-income NHANES participants. Journal of
Nutrition, 140, 304-310.
Share Our Strength. (n.d.). Our Program. Retrieved February 20, 2012, from
http://cookingmatters.org/what-we-do/our-program/.
Tarasuk, V.S., Beaton, G.H. (1999). Women’s dietary intakes in the context of
household food insecurity. Journal of Nutrition, 129, 672–679.
U.S. Census Bureau. (2011). Income, Poverty and Health Insurance in the
United States: 2010 - Tables & Figures. Retrieved March 18, 2012, from
http://www.census.gov/hhes/www/poverty/data/incpovhlth/2010/tables.htm
l
United States Department of Agriculture (USDA). (2011). Food Security in the
U.S.: Household Survey Tools. Retrieved August 25, 2011, from
http://www.ers.usda.gov/briefing/foodsecurity/surveytools.htm
United States Department of Agriculture (USDA): Center for Nutrition Policy and
Promotion. (1995). Healthy Eating Index. Retrieved July 16, 2011, from
http://www.cnpp.usda.gov/publications/hei/HEi89-90report.pdf.

108
United States Department of Agriculture: Economic Research Service (USDA:
ERS). (2011). Supplemental Nutrition Assistance Program (SNAP).
Retrieved March 23, 2012 from http://www.ers.usda.gov/Briefing/SNAP/
United States Department of Agriculture: Economic Research Service (USDA:
ERS). (2008). Diet quality and food consumption: Dietary patterns, diet
quality and obesity. Retrieved January 30, 2012, from
//www.ers.usda.gov/Briefing/DietQuality/DietaryPatterns.htm.
United States Department of Agriculture: Food and Nutrition Service (USDA:
FNS). (2012). Nutrition assistance programs. Retrieved March 18, 2012,
from http://www.fns.usda.gov/fns/
United States Department of Agriculture and U.S. Department of Health and
Human Service (USDA). (2010). Dietary Guidelines for Americans 2010.
7th Edition, Washington, DC: U.S. Government Printing Office. Retrieved
October 3, 2011, from www.dietaryguidelines.gov
Verpy, H., Smith, C., Reicks, M. (2003). Attitudes and behaviors of food donors
and perceived needs and wants of food shelf clients. Journal of Nutrition
Education and Behavior, 35, 6-15.


![Food diet -_nutrients[1]](https://static.fdocuments.us/doc/165x107/55642d01d8b42a73298b58a5/food-diet-nutrients1.jpg)