Food Security and Climate Change in the Caribbean · 04/06/2008 · Food Security and Climate...
32
Food Security and Climate Change in the Caribbean Roger E. Rivero Vega Rome, June 2008
Transcript of Food Security and Climate Change in the Caribbean · 04/06/2008 · Food Security and Climate...

Food Security and Climate Change in the Caribbean
Roger E. Rivero Vega
Rome, June 2008

Some old stories …1
Back in the fifties, in a large developed country, they have a quiet attitude toward the impact of drought episodes assuming that … if there were a drought in the Southeast … that would be compensated by normal and higher than normal rains in the Northwest.
In the seventies that point of view had to be changed …

Some old stories …2
Back in mid-nineties a collective of authors recommended for developing countries …
If you expect negative impacts from climate change in the agriculture sector then:
1. The government should withdraw from interfering in food production issues …
2. Farmers should adapt themselves through spontaneous (market) adaptations …
3. The now excessive agricultural labor force could be redistributed in other sectors ...
4. If you lack food enough for your people then … go and buy it in the global market!

Those drizzles got us …
Those drizzles:
Withdrawal of the (developing countries) governments …
Spontaneous (market driven, cash crops) adaptations …
Relocation of agricultural labor force …
Total dependence (at incredible prices) from global food markets …

… into this mud!
This mud:
Poverty, under nourishing, unemployment, migration to urban centers and more developed countries, hunger and lack of food security…
In the face of climate change …
… Southeast and Northwest are not even in the same country

CC … a far away future
Also in the mid – nineties climate change impacts on agriculture, water resources and coastal ecosystems… as a far away future … began to be examined in the Caribbean region.
With a lot of uncertainties, not very amenable to stakeholders and decision makers. With a top – down approach of course looking at the first third of the 21st century and beyond.
The most often envisaged future was that of a warmer, drier future based on HadCM2, ECHAM and NIES global coupled ocean-atmosphere general circulation models.

First Conclusions … 1
It was rapidly observed that for the period 1961 –90 … in Cuba
Mean annual temperatures have rose almost 0.9 Celsius with respect to the fifties
Mean annual minimum temperatures have increased by almost 2.0 Celsius
Mean annual precipitations have decreased by 4%
Frequency of moderate and strong drought episodes have almost doubled with respect to 1931 - 60

First Conclusions … 2
General Circulation Models chosen were predicting a strong decrease in annual precipitation and an increase in aridity through the whole country during the 21st century
This general decrease in precipitation, accompanied by an increase in evaporation, conduced to a sizable decrease in hydrological potential (runoff) of water catchments.

UNEP Aridity Index (P / E0) for 1961-90

UNEP Aridity Index (P / E0) for 2086-2115

Hydrological Potential for Every Watershed in Camagüey during 2010-2100
Table 1. Unitary Hydrological Potential (in percent of 1961 – 90),
obtained by using four different impact models (M1 – M4) in the E1climate change scenario used by Planos et al. (1999) and Rivero et al.
(2005).
78.083.088.092.096.0M4
65.072.080.086.093.0M3
62.070.078.085.092.0M2
67.073.081.087.093.0M1
21002075205020302010Impact Model

First Conclusions … 3
Staple crops in Cuba are mostly C3 type plants usually grown in the drier, coolest season of the year, under irrigated conditions.
Simulation experiments made with crop models as WOFOST and those contained in DSSAT 3.0 and 3.5, under the specified climate change scenarios, gave results indicating a sizable decreasing trend in yields during the 21st century. Potato and rice were among the most affected crops because of the integrated impact of higher temperatures and decreasing availability of irrigation water.

First Conclusions … 4
The integrated impact of rising temperatures and decreasing irrigation water availability are better shown using our MIIA 1.0 and MIIA 2.0 integrated models.
These results were confirmed by preliminary studies made in Haiti, Dominican Republic and Saint Kitts - Nevis
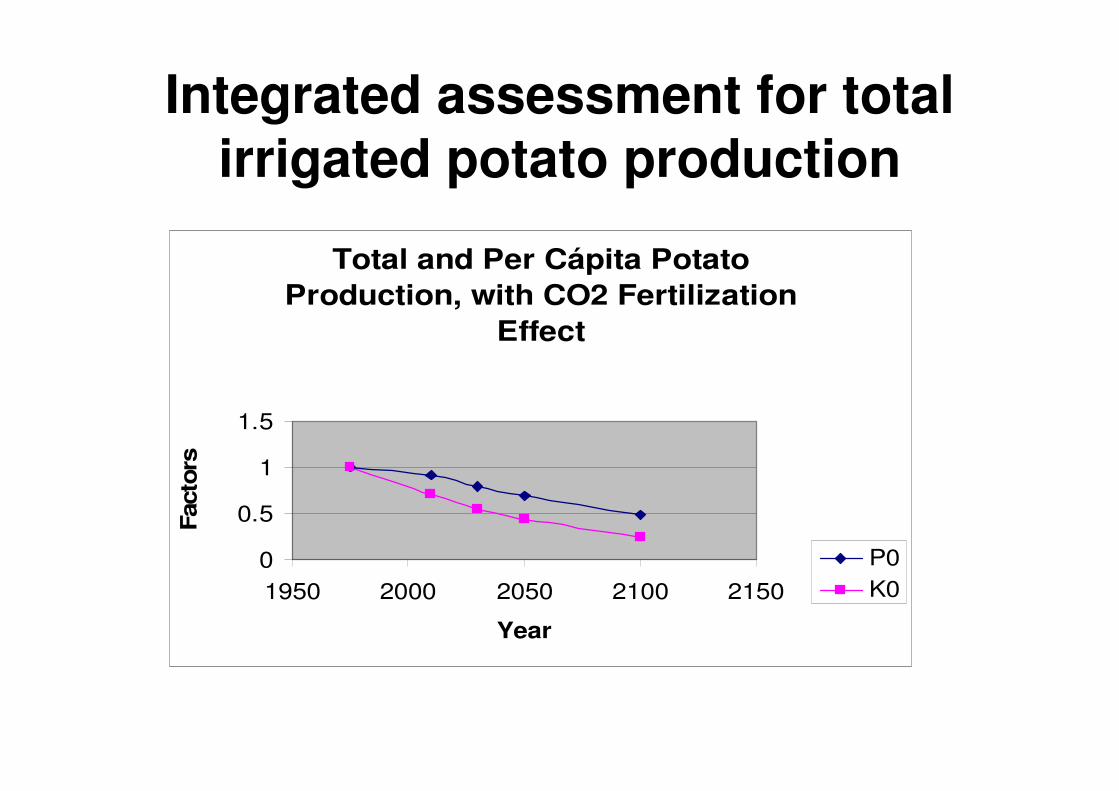
Integrated assessment for total irrigated potato production
Total and Per Cápita Potato
Production, with CO2 Fertilization
Effect
0
0.5
1
1.5
1950 2000 2050 2100 2150
Year
Facto
rs
P0
K0

Integrated assessment for total irrigated corn production
Total corn production (P2) in Sierra de
Cubitas, Camagüey, without CO2
fertilization effect
0
1
2
3
4
0 5 10 15
Planting Month
Th
ou
san
ds o
f
metr
ic t
on
s
2010
2030
2050
2100

Potential rice yields with different planting dates as given by WOFOST 7.1.2
Potential Yield of Irrigated Rice in Florida
1961- 90
0
5000
10000
0 10 20 30
Fifteen days periods
Kg
/ h
a
R. Pot.
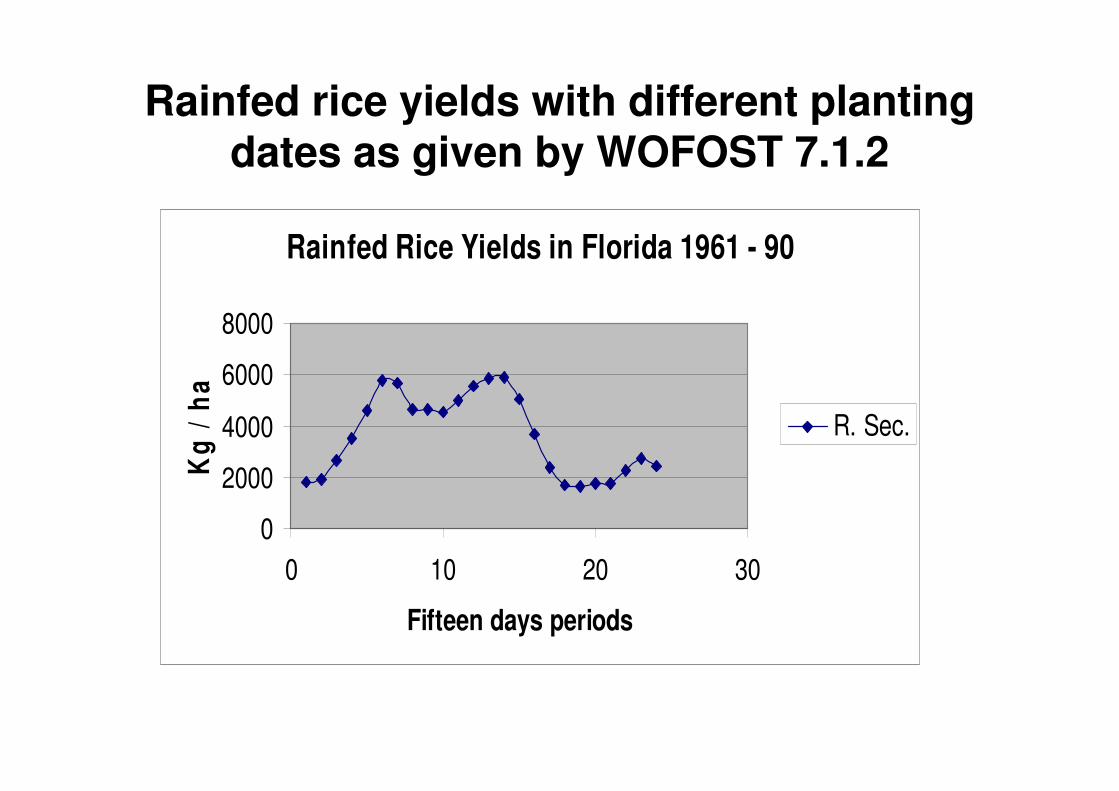
Rainfed rice yields with different planting dates as given by WOFOST 7.1.2
Rainfed Rice Yields in Florida 1961 - 90
0
2000
4000
6000
8000
0 10 20 30
Fifteen days periods
Kg
/ h
a
R. Sec.

Evolution of total (irrigated plus rainfed) rice production with climate change (MIIA 2.0)
Irrigated (PR), rainfed (PS) and total
rice (PT) production in 1000 ha
0
5000
10000
15000
1950 2000 2050 2100 2150
Years
To
ns PR
PS
PT

Dominican Republic … 1
Potential Potato Yield with emergence at
December 15th
0
1000
2000
3000
4000
5000
6000
1950 2000 2050 2100 2150
Kg
DM
/ h
a
Modelo CSTR IS92c
Modelo ECH4 IS92a
Modelo HCM2 IS92f
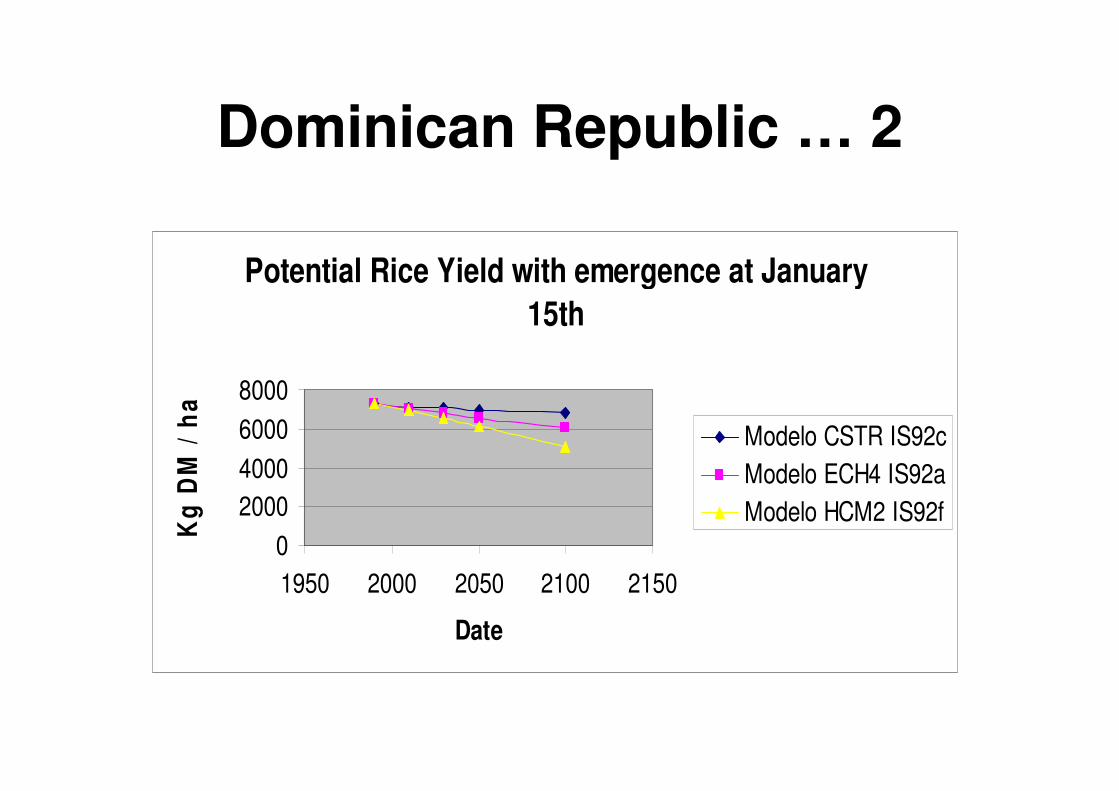
Dominican Republic … 2
Potential Rice Yield with emergence at January
15th
0
2000
4000
6000
8000
1950 2000 2050 2100 2150
Date
Kg
DM
/ h
a
Modelo CSTR IS92c
Modelo ECH4 IS92a
Modelo HCM2 IS92f

Saint Kitts - Nevis
Rainfed yields of sugarcane relative
to reference climate in HADCM2e
scenario
0
0.5
1
1.5
1950 2000 2050 2100 2150
Year
yie
ld /
yie
ld
19
61
- 9
0
HADCM2e

A focus on extreme agrometeorologicalevents and analysis of risks
Strangely enough most impact assessments described were based on mean 30 years results. But we clearly know that a “natural” dispersion of yields and agricultural production will occur in 30 years, with very good years and very bad (disastrous) ones (Rivero et al., 2003).
This is a lesson history taught us in the past few years. Hurricanes, drought episodes and El Niño / La Niñaevents might lead to very low food production at times that can disrupt our agricultural production systems and our food security. Oranges, grapefruit, potatoes and rice production during 1991 – 2005 in our country have been relevant examples of the climate variability impact on agriculture and water resources in actual climate.

They originally told us ...
Back in the nineties they told us than in assessing climate change impact we should assume that our agricultural systems were already in equilibrium with our reference climate ... I never agree with that. Our agricultural systems was very probable in equilibrium with many others … non-climatic forcings.
Besides … climate had already changed and continue changing. In the following years droughts, floods and Force 5 hurricanes disrupted our agricultural systems.

A focus on extreme agrometeorologicalevents… (continued)
Modelled impact assessments of drought episodes on agriculture were first done in Cuba by Rivero et al. (1999) in an effort isolated from the National Communication process and not reported on it (Lapinelet al., 2001). Later these efforts were extended to the Dominican Republic (UNDP, 2007).
Actual agrometeorological extremes will probably increase in number and in kind with climate change. In particular, temperature extremes damaging to the flowering and pollinating phenological phase will occur in some crops as rice. These kind of agrometeorological extremes have never been studied in our country, many of them being out of actual capabilities of prevailing process-based crop models.

A focus on extreme agrometeorologicalevents… (continued)
As a single extreme agrometeorological event can disrupt our food security system leading to large economical costs, to the bankruptcy of farmers and to a deterioration in the livelihood of agricultural workers and population as a whole, a risk analysis of the impact of extremeagrometeorological events on agriculture and water resources will be in order for every future assessment of climate change impacts.
Bottom – up studies started to help agricultural adaptation to … already non – natural climate variability in Cuba, Costa Rica, El Salvador and other Central American and Caribbean Countries.
The Caribbean Effort …
Since the very beginning of the 21st century different agreements and collaboration efforts have come to the executive phase among Caribbean and Central American countries.
These include collaborative National, Bilateral and Regional Vulnerability and Adaptations Projects as well as a sizable amount of efforts directed to Capacity Building in scientific and educational institutions, stakeholders groups and affected communities. More than fifteen such capacity building activities have taken place in the last three years ... and still continue.

Regional Annual Temperature Scenarios Using High Resolution RCM PRECIS

Regional Annual Precipitation Scenarios Using High Resolution RCM PRECIS

Adaptation Strategies I
Very basic adaptations strategies are already being implemented, especially in the agriculture and water resources sectors ...
First: Capacity building and public education and awareness
Second: Water harvest and strengthening of supply systems mixed with a reduction of water use and an increase of efficiency in order to make agriculture more resilient to the impact of droughts

Adaptation Strategies II
Third: Changes in technologies associated to basic crops – as rice and banana – directed to raise agriculture efficiency and food security issues based on increasing diversity and total production of basic staples crops
Fourth: National synergy of efforts associated to the three basic UN Conventions ... related to limit the degradation and desertification of agricultural lands, increasing forested areas and preserving good health of natural coastal ecosystems.

Thanks to you all !