FAO/WHO Global Individual Food consumption data Tool (FAO ...
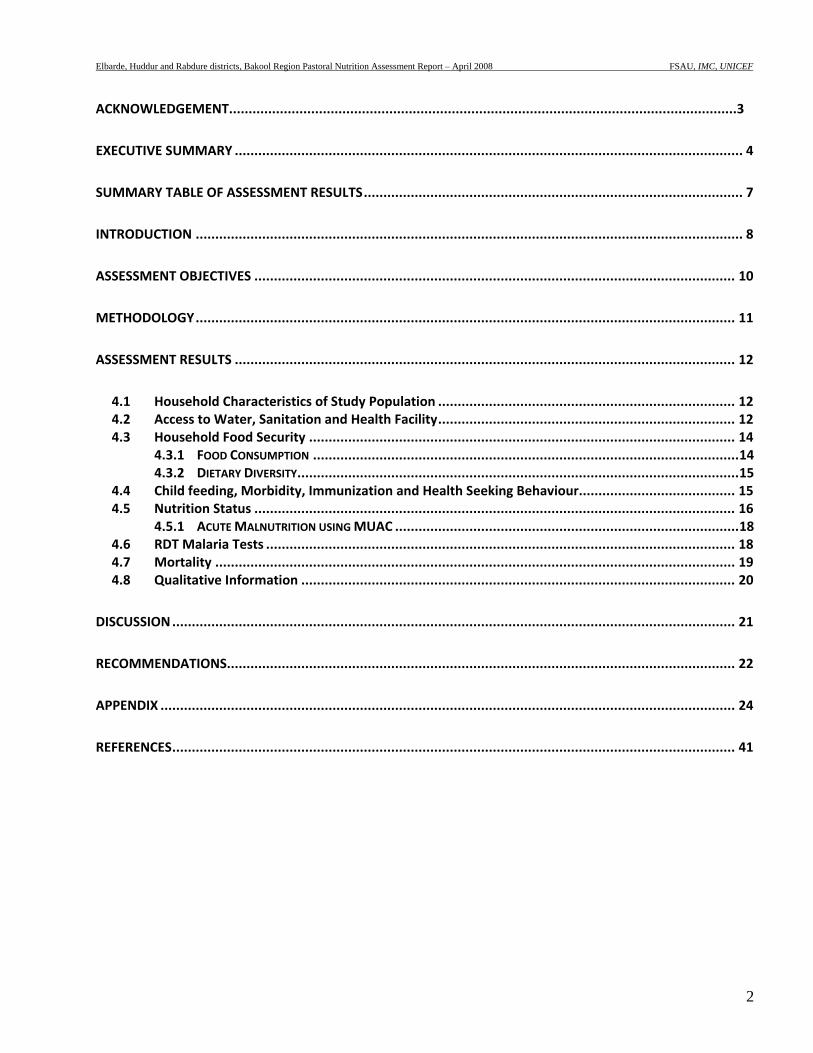
NUTRITION ASSESSMENT REPORT
ELBARDE, HUDDUR AND RABDURE PASTORAL DISTRICTS BAKOOL REGION, SOMALIA
Food Security Analysis Unit (FSAU/FAO) United Nation Children Funds (UNICEF)
International Medical Corps (IMC)
April 2008
Elbarde, Huddur and Rabdure districts, Bakool Region Pastoral Nutrition Assessment Report – April 2008 FSAU, IMC, UNICEF
2
ACKNOWLEDGEMENT..................................................................................................................................3
EXECUTIVE SUMMARY .................................................................................................................................. 4
SUMMARY TABLE OF ASSESSMENT RESULTS ................................................................................................. 7
INTRODUCTION ............................................................................................................................................ 8
ASSESSMENT OBJECTIVES ........................................................................................................................... 10
METHODOLOGY .......................................................................................................................................... 11
ASSESSMENT RESULTS ................................................................................................................................ 12
4.1 Household Characteristics of Study Population ............................................................................ 12 4.2 Access to Water, Sanitation and Health Facility ............................................................................ 12 4.3 Household Food Security ............................................................................................................. 14
4.3.1 FOOD CONSUMPTION ............................................................................................................. 14 4.3.2 DIETARY DIVERSITY ................................................................................................................. 15
4.4 Child feeding, Morbidity, Immunization and Health Seeking Behaviour........................................ 15 4.5 Nutrition Status ........................................................................................................................... 16
4.5.1 ACUTE MALNUTRITION USING MUAC ........................................................................................ 18 4.6 RDT Malaria Tests ........................................................................................................................ 18 4.7 Mortality ..................................................................................................................................... 19 4.8 Qualitative Information ............................................................................................................... 20
DISCUSSION ................................................................................................................................................ 21
RECOMMENDATIONS.................................................................................................................................. 22
APPENDIX ................................................................................................................................................... 24
REFERENCES ................................................................................................................................................ 41
Elbarde, Huddur and Rabdure districts, Bakool Region Pastoral Nutrition Assessment Report – April 2008 FSAU, IMC, UNICEF
3
ACKNOWLEDGEMENT
The Nutrition Surveillance Project of the Food Security Analysis Unit (FSAU) acknowledges the participation of UNICEF and International Medical Corps (IMC) in the nutrition survey among the pastoralist population in Bakool region, Elbarde, Rabdure and Northern Huddur districts. FSAU provided technical support including two assessment coordinators and six supervisors, FSAU also financed the cost of transport, supervisors, nurses, team leaders, enumerators and data entry clerks. UNICEF provided funding for the transport costs, while IMC provided logistical and financial support for transport of the participants and the training venue, they also assisted in providing staff; supervisors, nurses, team leaders and enumerators during the nutrition assessment. Special thanks goes to the mothers, caregivers, leaders and the community as a whole in Bakool Region for their cooperation, time and for providing information individually and/or in focus group discussions that helped the survey team to get a better understanding of the nutrition situation in the area. Comments from partners in Bakool Regions, local community and members of the Nutrition Working Group in Nairobi on the preliminary results are also highly appreciated. FSAU also expresses sincere appreciation to the assessment team for their high level of commitment demonstrated during all stages of this assessment.
Elbarde, Huddur and Rabdure districts, Bakool Region Pastoral Nutrition Assessment Report – April 2008 FSAU, IMC, UNICEF
4
EXECUTIVE SUMMARY Bakool region comprises of five districts that are Huddur, Tieglow, Wajid, Elberde and Rabdure. The region is predominantly agro pastoral with exception of southern inland pastoral livelihood zone located in Elberde district and parts of Rabdure and Northern Huddur. The southern inland pastoralists keep mainly camel, sheep and goats. A rapid nutrition assessment carried out in December 2007 among 500 children screened from five villages in Elberde district indicated a Critical nutrition situation. Data from feeding centres in Elberde town, Qurajome and Elbarde MCH showed an increase in the admission of acutely malnourished children, although more accurate information was lacking due to inaccessibility caused by insecurity in the area. Consequently there was great need to carry out a nutrition survey and determine the malnutrition levels in the area to duly inform on the intervention responses required in the region. From 3rd to 16th April 2008, FSAU in partnership with UNICEF and IMC conducted a nutritional assessment among the southern inland pastoral population in Elbarde and parts of Rabdure and Huddur districts. The main objective of the survey was to determine the level of wasting among children aged 6‐59 months, and to analyze the possible factors contributing to acute malnutrition namely; dietary diversity, morbidity, care practices and mortality rates in the southern inland pastoralists of Bakool region. Using two‐stage cluster probability proportional to size sampling (PPS) methodology, a total of 502 children, from 255 households aged 6 – 59 months were assessed, while 882 households were assessed for mortality. The mean household size was 5.9 (±2.2), while the mean number of children under five was 2.1 (±0.8). The results indicate a global acute malnutrition (GAM ‐weight for height <‐2 Z score or oedema) rate of 24.1% (18.5 – 29.7) and severe acute malnutrition rate (SAM weight for height <‐3 or oedema) of 2.8% (1.2 – 4.4). This indicates a Very Critical nutrition situation based on WHO classification. Although a direct comparison is not possible due to seasonal variations, these findings at the start of the Gu season (April 08) indicate a deterioration from the last nutrition survey conducted in the Deyr 07 season December 2006, which indicated a GAM of 17.7% and 3.2%. Based on NCHS, the stunting and underweight rates reported were 14.5% (10.3 – 18.8) and 34.5% (30.0 – 38.9) respectively. No oedema cases were reported. The 90 days retrospective crude and under five mortality rates were estimated at 0.59 (0.34 – 0.93) and 1.08 (0.0 – 2.17) deaths/10,000/day respectively, and are both at alert levels according to the WHO classification. Majority of the reported deaths for children <5 years were caused mainly by diarrhoea, followed by acute respiratory illness (ARI), and suspected measles. Other reported causes of death among adults were complications arising during birth, accidents and anaemia. The integrated analysis of the nutrition situation in the pastoral areas of Bakool region conducted in January 2008 indicated a Critical situation with likelihood to worsen. As predicted, the current findings now show that the nutrition situation in the area has deteriorated to Very Critical levels. High morbidity rates were reported in the study population with 43.2% of the assessed children reportedly suffering from one or more communicable childhood diseases in the two weeks prior to the assessment. The incidences of reported diarrhoea, ARI, suspected malaria/febrile illness in Elbarde were 28.6%, 30.6%, 13.0% respectively. However, Rapid Diagnostic Tests (RDT) conducted for malaria confirmed only 3.4% cases of malaria as positive for Plasmodium falciparum. The reported suspected measles was low but significant at 1.5% (0.0 – 3.5). These levels were consistent with seasonal morbidity patterns recorded from the health facilities. Previous studies have shown strong associations with morbidity, however, in this survey analysis did not show any direct association between morbidity and acute malnutrition, it is valuable to note that the proportion of children that were both acutely malnourished and ill in the two weeks prior to the assessment was significant, given that almost half (44.6%) of the children reported to be ill two weeks prior to the assessment were also malnourished (GAM ‐weight for height <‐2 Z score or oedema). In addition, it was noted that 30.5% of the children reported to have suffered from diarrhoea, and 33.1% reported to have suffered from acute respiratory illness (ARI) were also malnourished. Adequate and appropriate water, health and sanitation facilities remain lacking, with as little as 12.5% of the households having access to clean drinking water, a deplorable 4.3% of the households having toilet facilities, and barely 14.2% of the children who were reported to be sick visiting a health facility or clinic for treatment. Consumption of water from unsafe sources was a predisposing factor to water borne illness such as diarrhoea and cholera while limited access to health services may have lead to complications of these curable diseases and contributed to acute malnutrition and death. Poor coverage for health programmes is a crucial risk factor to the very critical nutrition situation in the study area. Measles vaccination coverage for eligible children (9‐59 months old) in the study population was very low at 32.6%, as was coverage for
Elbarde, Huddur and Rabdure districts, Bakool Region Pastoral Nutrition Assessment Report – April 2008 FSAU, IMC, UNICEF
5
vitamin A supplementation at 32.8% and polio immunization at 48.2%, all fell absolutely below the recommended 95% level (Sphere, 2004). The lack of sufficient and effective coverage of health services has deprived children of the associated health and nutritive benefits. Poor feeding practices persist in Bakool region like in other parts of Somalia and have been associated with high levels of acute malnutrition. Most children are introduced to breastfeeding very late after 2‐3 days after birth, vis a vis the recommended 1‐2 hours. Additionally they are also introduced to complimentary foods after 2‐3 days contrary to recommended international standard of age 6 months, with 86.7% being given other foods at less than 3 months of age. Persistent, breastfeeding does not continue to the recommended 24 and months above, with 95.2% of ceasing breastfeeding at age 18 months and below. At the time of the assessment, 61.4% of the children below the age of 24 months were breastfeeding. Furthermore, only 27.7% of the children aged 6‐24 months were fed the recommended five times in a day. While there was no statistical association between malnutrition and complimentary feeding frequency, it is critical to note that 82.3% of the malnourished children were fed less than 5 times a day. In spite of this, analysis of distribution of levels of acute malnutrition between the different age groups did not show a significant difference in the likelihood of acute malnutrition between the breastfeeding age groups and older children. Poor breastfeeding practices not only deny the children the multiple nutritive and health benefits associated with breastfeeding but also expose them to malnutrition, morbidity and even death. The food security and nutrition situation remains precarious owing to major water shortages for human and livestock consumption, poor livestock body conditions, animal diseases and deaths, decline in the production of milk and reduced livestock prices coupled with high inflation and increased food prices. 1 According to the survey, majority (81.9%) of the household’s main source of income was through the sale of animals and animal products. 74.5% of the households relied on purchasing as their main source of food. The main source of cereals for the household was through purchases (80.7%), while 38.4% of the households main source of milk was through own production and 22.4% through purchase. This was consistent with the poor wealth groups in the region2. The remaining proportion of the households were not consuming milk, with a very small percentage (<1%) obtaining milk through gifts and bartering. Although there was no statistical association between acutely malnourished children and the household’s food sources, it is essential to note that 77.6% of the children who were acutely malnourished were from households, whose main source of food was through purchases, thus highlighting the nutritional vulnerability of this group. The mean number of food groups consumed 24 hours prior to the assessment in the households was 2.8 ±1.1, with only 23.9% of the assessed households consuming the recommended diversified diet of four or more food groups in a day. The main food groups consumed were cereals (98%), sugar (82%), milk (62.4%) and oils (34.9%) the remaining food groups; meat, pulses, roots, vegetables, fruits and fish were the least (<10%) consumed in the households, yet they are the main source of micronutrients. Further to this it is vital to note that although there was no statistical association between malnutrition and the number of food groups consumed by the children, 74.7% of the malnourished children consumed less than 4 food groups in the 24 hours prior to the assessment. Only 28.2% of the households were able to consume 3 meals a day, with a high number of the households (67.1%) consuming two meals a day and the remaining percentage consuming a meal a day. In conclusion the nutrition situation in Elbarde district is Very Critical; there has been no improvement from the previous rapid assessment conducted in December 2007. Even though the key underlying factors affecting the nutritional status of the children i.e. morbidity, poor child care, lack of safe drinking water and limited sanitation and hygiene facilities remain key risk factors, it is important to note that food security, is also currently a critical factor affecting the nutrition status of the population. Low consumption of milk due to reduced production, increased food prices with majority of the households currently relying on purchase of food as their main source, reduced quantity and quality of food intake are also contributing factors to the current poor nutrition status among the study population. Specific recommendations are outlined below: Immediate Interventions
• Urgent rehabilitation of acutely malnourished children through the existing selective feeding and outreach programs and active case finding until household food security is restored to prevent further deterioration. Capacity building
1 FSAU Food Security Elbarde Pastoral Assessment Field Report April 2008 2 Livelihood Baseline Profile, Southern Inland Pastoral
Elbarde, Huddur and Rabdure districts, Bakool Region Pastoral Nutrition Assessment Report – April 2008 FSAU, IMC, UNICEF
6
of the existing MCH and the community to manage acutely malnourished children through locally available resources.
• Water tankering for human and animal consumption, to assist in alleviating the water shortage. Intervention programmes on improving water, sanitation and hygiene practices including health education to educate the community on domestic treatment of drinking water should also be done to help prevent disease outbreaks. Proper sanitation practices should also be promoted.
• Improving coverage for health programmes, especially for measles, polio vaccination and vitamin A supplementation. Vigorous campaigns are required, to reduce the risk of disease. Care givers should also be trained on the need to let their children receive these services.
• Intensify nutrition and health education targeting children care givers with messages on the importance of exclusive breastfeeding, improved child‐feeding practices appropriate health‐seeking behaviour and improved hygiene & sanitation practices.
Long term Interventions
• There is need to focus on programmes that improve and sustain dietary diversity and consumption of micronutrient rich foods. Food distribution for pulses and micronutrient enriched oil could help improve dietary diversity especially among poor people. Promoting production and consumption of vegetables and fruits may also enhance dietary diversity especially for vitamin and minerals.
• To address the issues of limited access to safe water, there is a need for rehabilitation/protection of water systems including the well and water catchments. Potential for domestic water harvesting from the roofs and conservation could also be explored. The community should be trained on sanitation of the water systems.
• There is need for establishment or strengthening of health facilities and satellite services especially in rural villages where there are no health facilities. Cross border issues should also be monitored and addressed accordingly.
• Intensifying health and nutrition education activities at the household level to address care concerns, targeting mothers, and other caregivers. The main areas of focus should include promoting exclusive breastfeeding, appropriate young child feeding, diet diversification, and improvements in household hygiene including health care practices. Advocacy campaigns on domestic water treatment such as boiling of drinking water to minimise risks of water born diseases.
• Provision of sanitary facilities including large scale building of latrine at household level or at strategic locations in the region for appropriate disposal of human excretal waste. This should be coupled with awareness on the need to use such facilities.
• Providing appropriate veterinary services and programmes in the area for livestock treatment, care and inoculation to promote animal health, as this is the main source of income among the pastoralists.
Elbarde, Huddur and Rabdure districts, Bakool Region Pastoral Nutrition Assessment Report – April 2008 FSAU, IMC, UNICEF
7
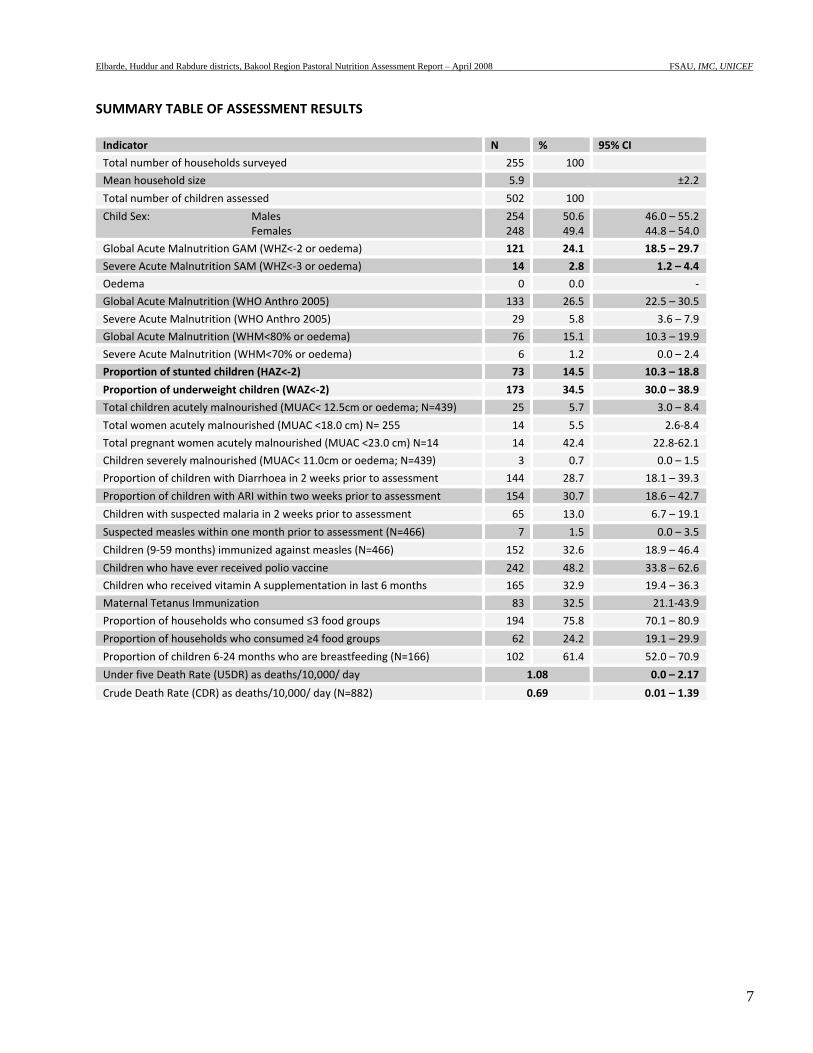
SUMMARY TABLE OF ASSESSMENT RESULTS Indicator N % 95% CI
Total number of households surveyed 255 100
Mean household size 5.9 ±2.2
Total number of children assessed 502 100
Child Sex: Males Females
254248
50.6 49.4
46.0 – 55.2 44.8 – 54.0
Global Acute Malnutrition GAM (WHZ<‐2 or oedema) 121 24.1 18.5 – 29.7
Severe Acute Malnutrition SAM (WHZ<‐3 or oedema) 14 2.8 1.2 – 4.4
Oedema 0 0.0 ‐
Global Acute Malnutrition (WHO Anthro 2005) 133 26.5 22.5 – 30.5
Severe Acute Malnutrition (WHO Anthro 2005) 29 5.8 3.6 – 7.9
Global Acute Malnutrition (WHM<80% or oedema) 76 15.1 10.3 – 19.9
Severe Acute Malnutrition (WHM<70% or oedema) 6 1.2 0.0 – 2.4
Proportion of stunted children (HAZ<‐2) 73 14.5 10.3 – 18.8
Proportion of underweight children (WAZ<‐2) 173 34.5 30.0 – 38.9
Total children acutely malnourished (MUAC< 12.5cm or oedema; N=439) 25 5.7 3.0 – 8.4
Total women acutely malnourished (MUAC <18.0 cm) N= 255 14 5.5 2.6‐8.4
Total pregnant women acutely malnourished (MUAC <23.0 cm) N=14 14 42.4 22.8‐62.1
Children severely malnourished (MUAC< 11.0cm or oedema; N=439) 3 0.7 0.0 – 1.5
Proportion of children with Diarrhoea in 2 weeks prior to assessment 144 28.7 18.1 – 39.3
Proportion of children with ARI within two weeks prior to assessment 154 30.7 18.6 – 42.7
Children with suspected malaria in 2 weeks prior to assessment 65 13.0 6.7 – 19.1
Suspected measles within one month prior to assessment (N=466) 7 1.5 0.0 – 3.5
Children (9‐59 months) immunized against measles (N=466) 152 32.6 18.9 – 46.4
Children who have ever received polio vaccine 242 48.2 33.8 – 62.6
Children who received vitamin A supplementation in last 6 months 165 32.9 19.4 – 36.3
Maternal Tetanus Immunization 83 32.5 21.1‐43.9
Proportion of households who consumed ≤3 food groups 194 75.8 70.1 – 80.9
Proportion of households who consumed ≥4 food groups 62 24.2 19.1 – 29.9
Proportion of children 6‐24 months who are breastfeeding (N=166) 102 61.4 52.0 – 70.9
Under five Death Rate (U5DR) as deaths/10,000/ day 1.08 0.0 – 2.17
Crude Death Rate (CDR) as deaths/10,000/ day (N=882) 0.69 0.01 – 1.39
Elbarde, Huddur and Rabdure districts, Bakool Region Pastoral Nutrition Assessment Report – April 2008 FSAU, IMC, UNICEF
8
1 INTRODUCTION
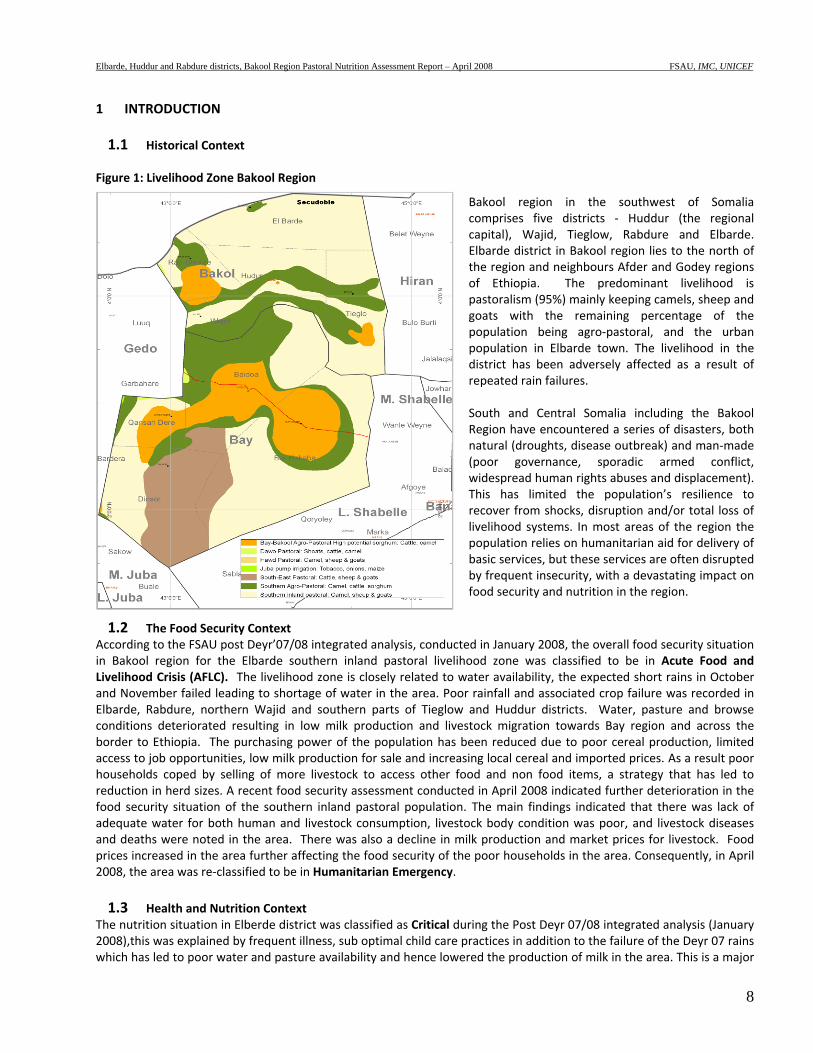
1.1 Historical Context Figure 1: Livelihood Zone Bakool Region
Bakool region in the southwest of Somalia comprises five districts ‐ Huddur (the regional capital), Wajid, Tieglow, Rabdure and Elbarde. Elbarde district in Bakool region lies to the north of the region and neighbours Afder and Godey regions of Ethiopia. The predominant livelihood is pastoralism (95%) mainly keeping camels, sheep and goats with the remaining percentage of the population being agro‐pastoral, and the urban population in Elbarde town. The livelihood in the district has been adversely affected as a result of repeated rain failures. South and Central Somalia including the Bakool Region have encountered a series of disasters, both natural (droughts, disease outbreak) and man‐made (poor governance, sporadic armed conflict, widespread human rights abuses and displacement). This has limited the population’s resilience to recover from shocks, disruption and/or total loss of livelihood systems. In most areas of the region the population relies on humanitarian aid for delivery of basic services, but these services are often disrupted by frequent insecurity, with a devastating impact on food security and nutrition in the region.
1.2 The Food Security Context According to the FSAU post Deyr’07/08 integrated analysis, conducted in January 2008, the overall food security situation in Bakool region for the Elbarde southern inland pastoral livelihood zone was classified to be in Acute Food and Livelihood Crisis (AFLC). The livelihood zone is closely related to water availability, the expected short rains in October and November failed leading to shortage of water in the area. Poor rainfall and associated crop failure was recorded in Elbarde, Rabdure, northern Wajid and southern parts of Tieglow and Huddur districts. Water, pasture and browse conditions deteriorated resulting in low milk production and livestock migration towards Bay region and across the border to Ethiopia. The purchasing power of the population has been reduced due to poor cereal production, limited access to job opportunities, low milk production for sale and increasing local cereal and imported prices. As a result poor households coped by selling of more livestock to access other food and non food items, a strategy that has led to reduction in herd sizes. A recent food security assessment conducted in April 2008 indicated further deterioration in the food security situation of the southern inland pastoral population. The main findings indicated that there was lack of adequate water for both human and livestock consumption, livestock body condition was poor, and livestock diseases and deaths were noted in the area. There was also a decline in milk production and market prices for livestock. Food prices increased in the area further affecting the food security of the poor households in the area. Consequently, in April 2008, the area was re‐classified to be in Humanitarian Emergency. 1.3 Health and Nutrition Context
The nutrition situation in Elberde district was classified as Critical during the Post Deyr 07/08 integrated analysis (January 2008),this was explained by frequent illness, sub optimal child care practices in addition to the failure of the Deyr 07 rains which has led to poor water and pasture availability and hence lowered the production of milk in the area. This is a major
Elbarde, Huddur and Rabdure districts, Bakool Region Pastoral Nutrition Assessment Report – April 2008 FSAU, IMC, UNICEF
9
concern given that milk is the most important source of both nutrients and is sold and used to purchase other food and non food items for pastoral communities. High food prices in the area have further compounded the situation making access to food difficult. Insecurity greatly disrupts humanitarian activities in the area and also affects access to the available health and nutrition services in the area, which is a major factor given that morbidity and malnutrition exhibits a synergistic relationship. Common illness reported in Bakool from the MCH and nutrition/health assessments include watery diarrhoea, ARI, malaria/febrile illness, kalazar, intestinal worms and skin diseases. Health services in the area are scarce due to limited health facilities that are not accessible by the bulk of the rural population, and sick people often resort to seeking health services from traditional healers, over counter drugs or reading of the Koran. With the poor health services, the negative impact of morbidity is obvious. In the beginning of 2007, a large area of southern Somalia, Bakool region inclusive experienced an outbreak of Acute Watery Diarrhoea with varying degrees of severity in case load and case fatality rates. Overall, Bakool Region recorded 652 cases of AWD with case fertility rate of 6.53 from January to June 2007 (Source of Data: WHO AWD June 28th Update). The main agencies providing health and nutrition services are IMC, MSF‐B, ACF and World Vision.
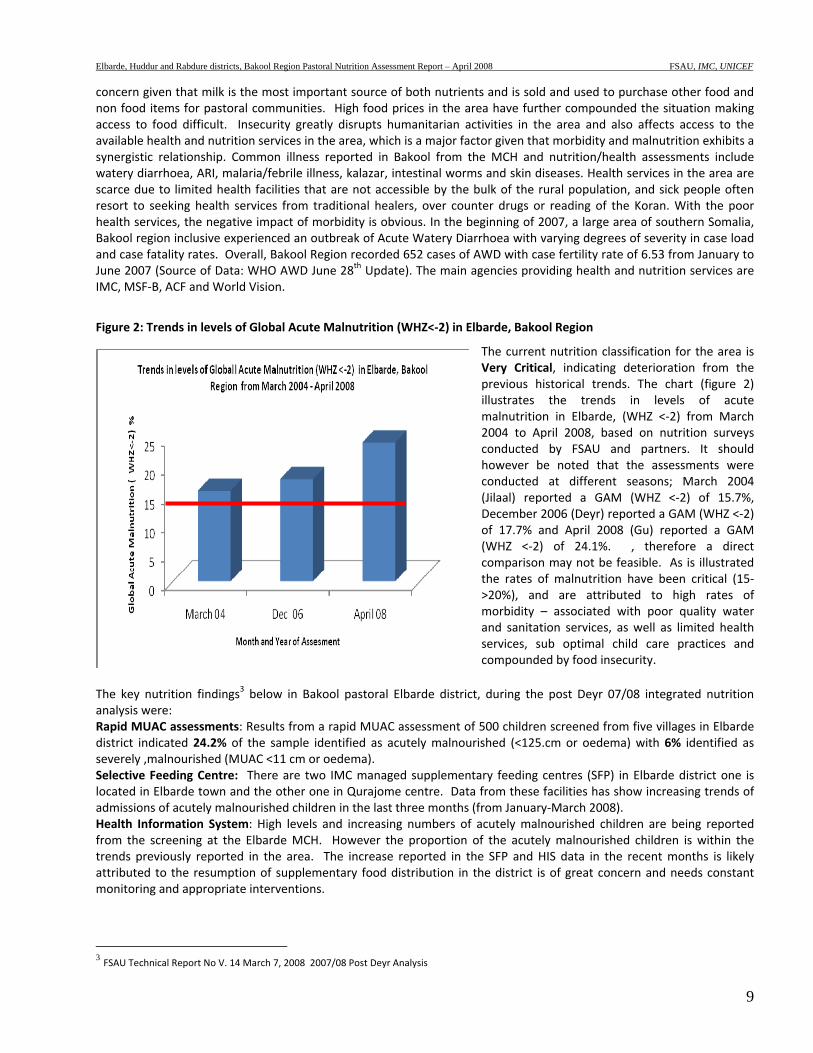
Figure 2: Trends in levels of Global Acute Malnutrition (WHZ<‐2) in Elbarde, Bakool Region
The current nutrition classification for the area is Very Critical, indicating deterioration from the previous historical trends. The chart (figure 2) illustrates the trends in levels of acute malnutrition in Elbarde, (WHZ <‐2) from March 2004 to April 2008, based on nutrition surveys conducted by FSAU and partners. It should however be noted that the assessments were conducted at different seasons; March 2004 (Jilaal) reported a GAM (WHZ <‐2) of 15.7%, December 2006 (Deyr) reported a GAM (WHZ <‐2) of 17.7% and April 2008 (Gu) reported a GAM (WHZ <‐2) of 24.1%. , therefore a direct comparison may not be feasible. As is illustrated the rates of malnutrition have been critical (15‐>20%), and are attributed to high rates of morbidity – associated with poor quality water and sanitation services, as well as limited health services, sub optimal child care practices and compounded by food insecurity.
The key nutrition findings3 below in Bakool pastoral Elbarde district, during the post Deyr 07/08 integrated nutrition analysis were: Rapid MUAC assessments: Results from a rapid MUAC assessment of 500 children screened from five villages in Elbarde district indicated 24.2% of the sample identified as acutely malnourished (<125.cm or oedema) with 6% identified as severely ,malnourished (MUAC <11 cm or oedema). Selective Feeding Centre: There are two IMC managed supplementary feeding centres (SFP) in Elbarde district one is located in Elbarde town and the other one in Qurajome centre. Data from these facilities has show increasing trends of admissions of acutely malnourished children in the last three months (from January‐March 2008). Health Information System: High levels and increasing numbers of acutely malnourished children are being reported from the screening at the Elbarde MCH. However the proportion of the acutely malnourished children is within the trends previously reported in the area. The increase reported in the SFP and HIS data in the recent months is likely attributed to the resumption of supplementary food distribution in the district is of great concern and needs constant monitoring and appropriate interventions.
3 FSAU Technical Report No V. 14 March 7, 2008 2007/08 Post Deyr Analysis
Elbarde, Huddur and Rabdure districts, Bakool Region Pastoral Nutrition Assessment Report – April 2008 FSAU, IMC, UNICEF
10
2 ASSESSMENT OBJECTIVES
The overall objective of the assessment was to establish the extent and severity of malnutrition, determine the causes of
malnutrition and to monitor the trends of malnutrition in the pastoral population in Bakool region, Somalia.
Specific Objectives were:
1. To estimate the level of acute malnutrition and nutritional oedema among children aged 6‐59 months in Bakool
pastoral livelihood zone.
2. To estimate the level of acute malnutrition among women aged 15‐49 years in Bakool pastoral livelihood zone.
3. To identify factors influencing the nutritional status of the children in Bakool pastoral livelihood zone.
4. To estimate the prevalence of some common diseases (measles, diarrhoea, febrile illnesses and ARI) in Bakool
pastoral livelihood zone.
5. To estimate malaria prevalence in Bakool pastoral livelihood zone, using Rapid Diagnostic Tests (RDT).
6. To estimate the measles and polio vaccination and Vitamin A supplementation coverage among children Bakool
pastoral livelihood zone.
7. To assess child feeding and care practices in Bakool pastoral livelihood zone.
8. To estimate the retrospective crude and under‐five mortality rates in Bakool pastoral livelihood zone.
Elbarde, Huddur and Rabdure districts, Bakool Region Pastoral Nutrition Assessment Report – April 2008 FSAU, IMC, UNICEF
11
3 METHODOLOGY
A cross‐sectional assessment was conducted among the southern inland pastoral populations of Elbarde district and parts of Rabdure Hudur and districts in April 2008. Probability proportion to size (PPS) sampling technique was used to identify the households to be sampled for the study. A list of all the villages/settlements and towns in the study population with their respective population was drawn and constituted the sampling frame4, and used to construct cumulative population figures (See appendix) for the assessment area. The number of clusters to be visited was determined as 30, which were randomly drawn and identified using the ENA SMART software. The number of children required for the nutrition and mortality survey was calculated using ENA. Nutrition data was collected from children aged 6‐59 months from a total of 502 children, while mortality data was collected from 882 households. Both qualitative and quantitative data collection techniques were used. Quantitative data was collected through a standard household questionnaire for nutrition assessment (appendix 1) and a standard mortality questionnaire (appendix 2). Quantitative data collected included household characteristics; child anthropometry, morbidity; vitamin A supplementation, measles and polio immunization coverage; dietary diversity; and water and sanitation. Qualitative data was collected by an interagency team comprising of assessment supervisors and coordinators through focus group discussions and key informant interviews to provide further understanding of possible factors influencing nutritional status. A four‐day training of enumerators and supervisors was conducted covering interview techniques, sampling procedure, inclusion and exclusion criteria, sources and reduction of errors, taking of measurements (height, weight and MUAC), standardisation of questions in the questionnaire, levels of precision required in measurements, diagnosis of oedema and measles, verification of deaths within households, handling of equipment, and the general courtesy during the assessment. Standardisation of measurement and pre‐testing of the questionnaire and equipment were carried out in three villages in within the vicinity of Elbarde town. Quality of data was also ensured through (i) monitoring of fieldwork by coordination team, (ii) crosschecking of filled questionnaires on daily basis and recording of observations and confirmation of measles, severe malnutrition and death cases by supervisors. All households sampled were visited and recorded including empty ones (iii) daily review was undertaken with the teams to address any difficulties encountered, (iv) progress evaluation was carried out according to the time schedule and progress reports shared with partners on regular basis, (v) continuous data cleaning and plausibility checks (vi) monitoring accuracy of equipment (weighing scales) by regularly measuring objects of known weights and (vii) continuous reinforcement of good practices. All measurements were loudly shouted by both the enumerators reading and recording them to reduce errors during recording. Household and child data was entered, processed (including cleaning) and analysed using ENA and EPI6 software. Mortality data was entered and crude and under five mortality rates generated in Nutrisurvey software.
4 Bakool pastoral has an estimated population size of 52,925 based on UNDP 2005 and further verified by the assessment team
Elbarde, Huddur and Rabdure districts, Bakool Region Pastoral Nutrition Assessment Report – April 2008 FSAU, IMC, UNICEF
12
4 ASSESSMENT RESULTS
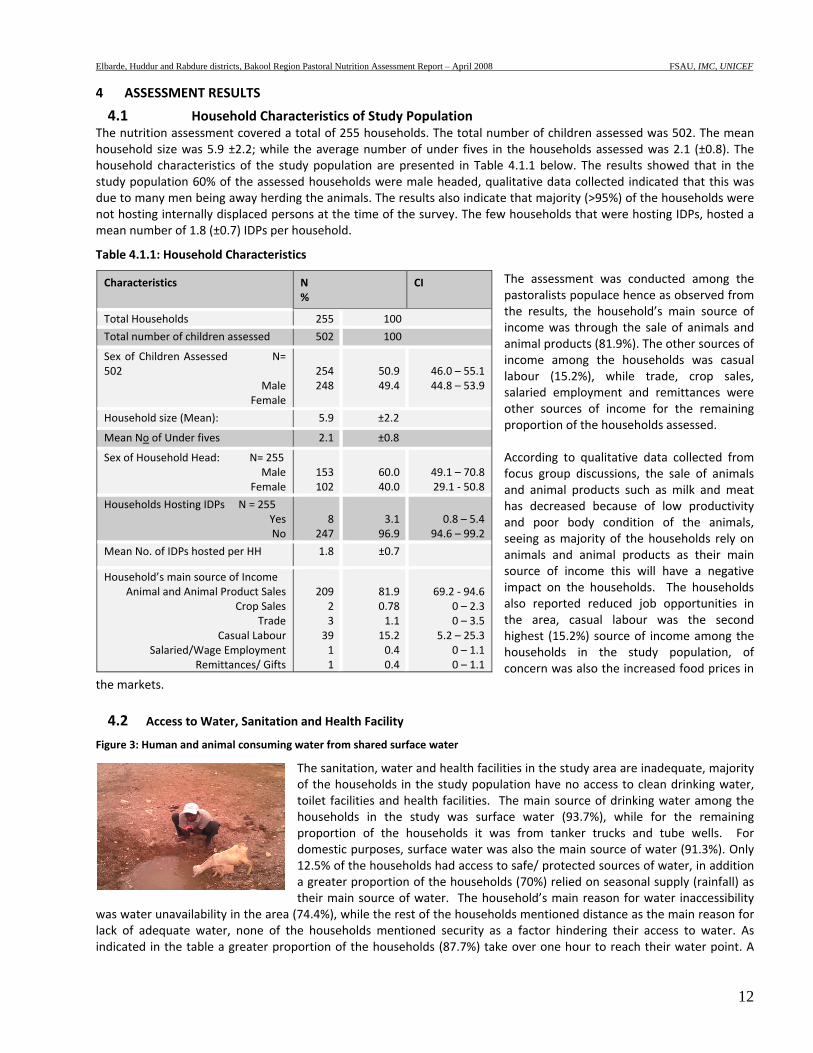
4.1 Household Characteristics of Study Population The nutrition assessment covered a total of 255 households. The total number of children assessed was 502. The mean household size was 5.9 ±2.2; while the average number of under fives in the households assessed was 2.1 (±0.8). The household characteristics of the study population are presented in Table 4.1.1 below. The results showed that in the study population 60% of the assessed households were male headed, qualitative data collected indicated that this was due to many men being away herding the animals. The results also indicate that majority (>95%) of the households were not hosting internally displaced persons at the time of the survey. The few households that were hosting IDPs, hosted a mean number of 1.8 (±0.7) IDPs per household.
Table 4.1.1: Household Characteristics
The assessment was conducted among the pastoralists populace hence as observed from the results, the household’s main source of income was through the sale of animals and animal products (81.9%). The other sources of income among the households was casual labour (15.2%), while trade, crop sales, salaried employment and remittances were other sources of income for the remaining proportion of the households assessed. According to qualitative data collected from focus group discussions, the sale of animals and animal products such as milk and meat has decreased because of low productivity and poor body condition of the animals, seeing as majority of the households rely on animals and animal products as their main source of income this will have a negative impact on the households. The households also reported reduced job opportunities in the area, casual labour was the second highest (15.2%) source of income among the households in the study population, of concern was also the increased food prices in
the markets. 4.2 Access to Water, Sanitation and Health Facility
Figure 3: Human and animal consuming water from shared surface water
The sanitation, water and health facilities in the study area are inadequate, majority of the households in the study population have no access to clean drinking water, toilet facilities and health facilities. The main source of drinking water among the households in the study was surface water (93.7%), while for the remaining proportion of the households it was from tanker trucks and tube wells. For domestic purposes, surface water was also the main source of water (91.3%). Only 12.5% of the households had access to safe/ protected sources of water, in addition a greater proportion of the households (70%) relied on seasonal supply (rainfall) as their main source of water. The household’s main reason for water inaccessibility
was water unavailability in the area (74.4%), while the rest of the households mentioned distance as the main reason for lack of adequate water, none of the households mentioned security as a factor hindering their access to water. As indicated in the table a greater proportion of the households (87.7%) take over one hour to reach their water point. A
Characteristics N %
CI
Total Households 255 100
Total number of children assessed 502 100
Sex of Children Assessed N= 502
Male Female
254248
50.949.4
46.0 – 55.144.8 – 53.9
Household size (Mean): 5.9 ±2.2
Mean No of Under fives 2.1 ±0.8
Sex of Household Head: N= 255 Male
Female 153102
60.040.0
49.1 – 70.829.1 ‐ 50.8
Households Hosting IDPs N = 255 Yes No
8247
3.196.9
0.8 – 5.4 94.6 – 99.2
Mean No. of IDPs hosted per HH 1.8 ±0.7
Household’s main source of Income Animal and Animal Product Sales
Crop Sales Trade
Casual Labour Salaried/Wage Employment
Remittances/ Gifts
209233911
81.90.781.115.20.40.4
69.2 ‐ 94.60 – 2.30 – 3.5
5.2 – 25.30 – 1.10 – 1.1
Elbarde, Huddur and Rabdure districts, Bakool Region Pastoral Nutrition Assessment Report – April 2008 FSAU, IMC, UNICEF
13
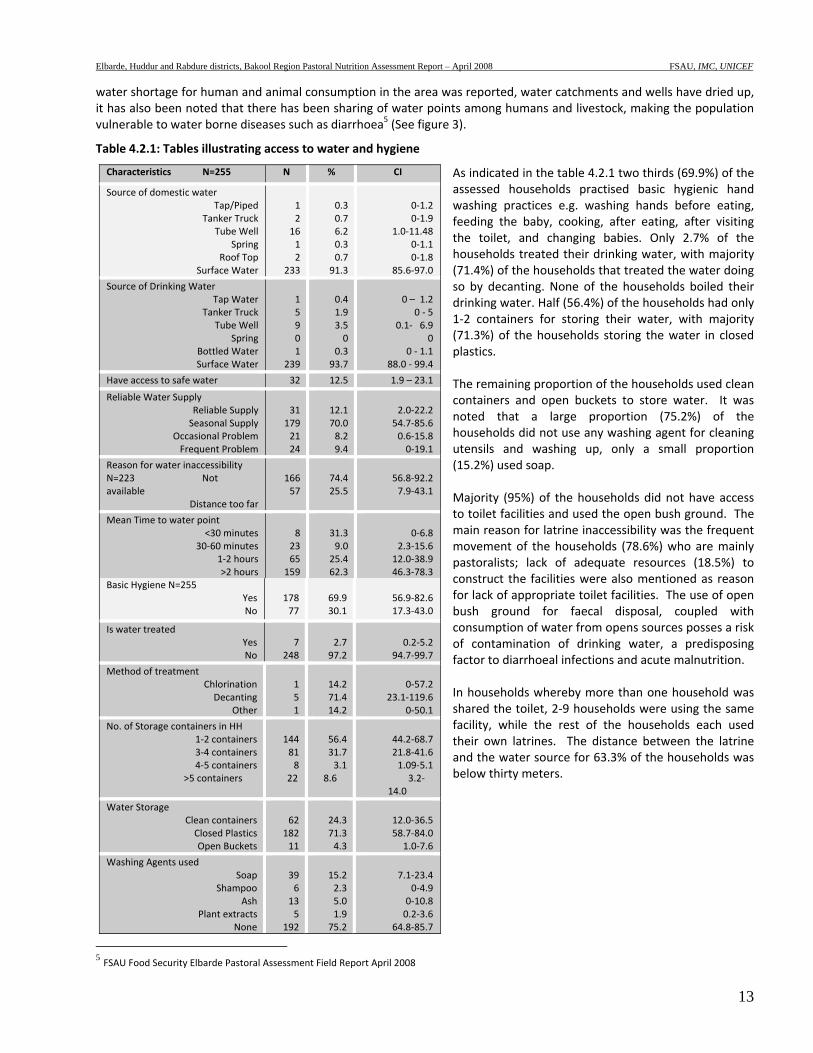
water shortage for human and animal consumption in the area was reported, water catchments and wells have dried up, it has also been noted that there has been sharing of water points among humans and livestock, making the population vulnerable to water borne diseases such as diarrhoea5 (See figure 3).
Table 4.2.1: Tables illustrating access to water and hygiene
As indicated in the table 4.2.1 two thirds (69.9%) of the assessed households practised basic hygienic hand washing practices e.g. washing hands before eating, feeding the baby, cooking, after eating, after visiting the toilet, and changing babies. Only 2.7% of the households treated their drinking water, with majority (71.4%) of the households that treated the water doing so by decanting. None of the households boiled their drinking water. Half (56.4%) of the households had only 1‐2 containers for storing their water, with majority (71.3%) of the households storing the water in closed plastics. The remaining proportion of the households used clean containers and open buckets to store water. It was noted that a large proportion (75.2%) of the households did not use any washing agent for cleaning utensils and washing up, only a small proportion (15.2%) used soap. Majority (95%) of the households did not have access to toilet facilities and used the open bush ground. The main reason for latrine inaccessibility was the frequent movement of the households (78.6%) who are mainly pastoralists; lack of adequate resources (18.5%) to construct the facilities were also mentioned as reason for lack of appropriate toilet facilities. The use of open bush ground for faecal disposal, coupled with consumption of water from opens sources posses a risk of contamination of drinking water, a predisposing factor to diarrhoeal infections and acute malnutrition. In households whereby more than one household was shared the toilet, 2‐9 households were using the same facility, while the rest of the households each used their own latrines. The distance between the latrine and the water source for 63.3% of the households was below thirty meters.
5 FSAU Food Security Elbarde Pastoral Assessment Field Report April 2008
Characteristics N=255 N % CI
Source of domestic water Tap/Piped
Tanker Truck Tube Well
Spring Roof Top
Surface Water
1 2 16 1 2
233
0.3 0.7 6.2 0.3 0.7 91.3
0‐1.2 0‐1.9
1.0‐11.48 0‐1.1 0‐1.8
85.6‐97.0
Source of Drinking Water Tap Water
Tanker Truck Tube Well
Spring Bottled Water Surface Water
1 5 9 0 1
239
0.4 1.9 3.5 0
0.3 93.7
0 – 1.2 0 ‐ 5
0.1‐ 6.9 0
0 ‐ 1.1 88.0 ‐ 99.4
Have access to safe water 32 12.5 1.9 – 23.1
Reliable Water Supply Reliable Supply Seasonal Supply
Occasional Problem Frequent Problem
31
179 21 24
12.1 70.0 8.2 9.4
2.0‐22.2 54.7‐85.6 0.6‐15.8 0‐19.1
Reason for water inaccessibility N=223 Not available
Distance too far
166 57
74.4 25.5
56.8‐92.2 7.9‐43.1
Mean Time to water point <30 minutes
30‐60 minutes 1‐2 hours >2 hours
8 23 65
159
31.3 9.0 25.4 62.3
0‐6.8 2.3‐15.6
12.0‐38.9 46.3‐78.3
Basic Hygiene N=255 Yes No
178 77
69.9 30.1
56.9‐82.6 17.3‐43.0
Is water treated Yes No
7
248 2.7 97.2
0.2‐5.2 94.7‐99.7
Method of treatment Chlorination Decanting
Other
1 5 1
14.2 71.4 14.2
0‐57.2 23.1‐119.6
0‐50.1
No. of Storage containers in HH 1‐2 containers 3‐4 containers 4‐5 containers
>5 containers
144 81 8
22
56.4 31.7 3.1
8.6
44.2‐68.7 21.8‐41.6 1.09‐5.1
3.2‐14.0
Water Storage Clean containers Closed Plastics Open Buckets
62
182 11
24.3 71.3 4.3
12.0‐36.5 58.7‐84.0
1.0‐7.6
Washing Agents used Soap
Shampoo Ash
Plant extracts None
39 6 13 5
192
15.2 2.3 5.0 1.9 75.2
7.1‐23.4 0‐4.9
0‐10.8 0.2‐3.6
64.8‐85.7
Elbarde, Huddur and Rabdure districts, Bakool Region Pastoral Nutrition Assessment Report – April 2008 FSAU, IMC, UNICEF
14
4.3 Household Food Security
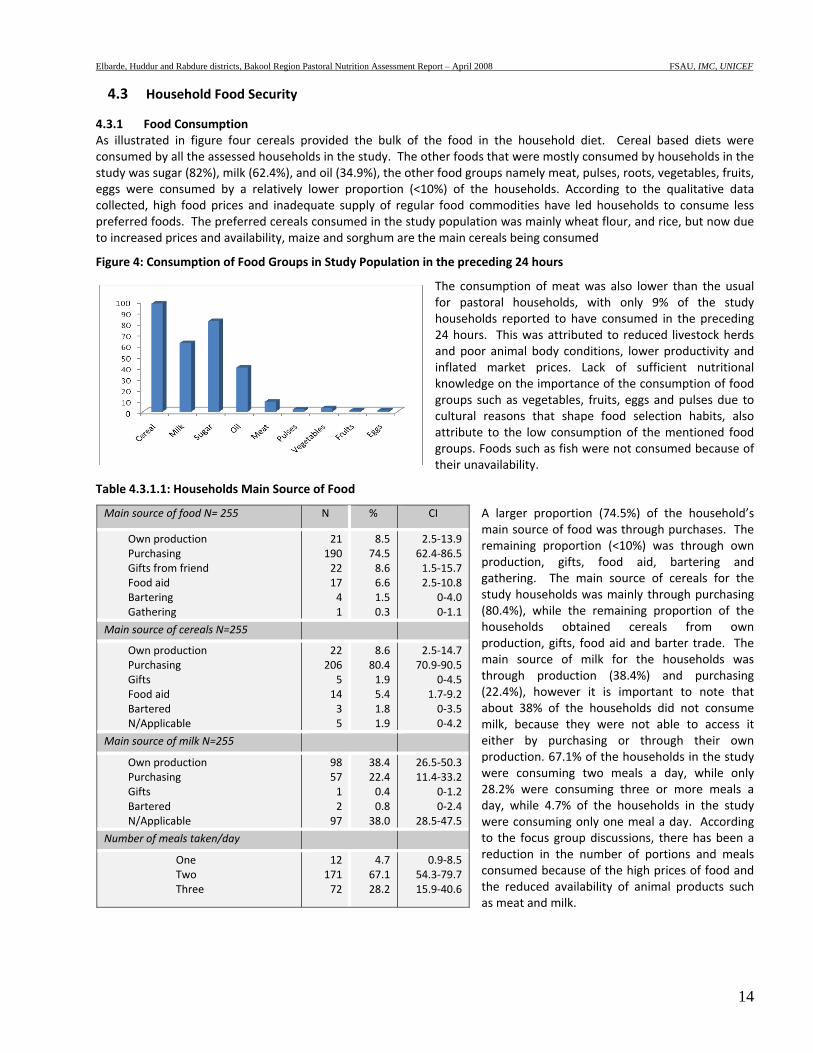
4.3.1 Food Consumption As illustrated in figure four cereals provided the bulk of the food in the household diet. Cereal based diets were consumed by all the assessed households in the study. The other foods that were mostly consumed by households in the study was sugar (82%), milk (62.4%), and oil (34.9%), the other food groups namely meat, pulses, roots, vegetables, fruits, eggs were consumed by a relatively lower proportion (<10%) of the households. According to the qualitative data collected, high food prices and inadequate supply of regular food commodities have led households to consume less preferred foods. The preferred cereals consumed in the study population was mainly wheat flour, and rice, but now due to increased prices and availability, maize and sorghum are the main cereals being consumed
Figure 4: Consumption of Food Groups in Study Population in the preceding 24 hours
The consumption of meat was also lower than the usual for pastoral households, with only 9% of the study households reported to have consumed in the preceding 24 hours. This was attributed to reduced livestock herds and poor animal body conditions, lower productivity and inflated market prices. Lack of sufficient nutritional knowledge on the importance of the consumption of food groups such as vegetables, fruits, eggs and pulses due to cultural reasons that shape food selection habits, also attribute to the low consumption of the mentioned food groups. Foods such as fish were not consumed because of their unavailability.
Table 4.3.1.1: Households Main Source of Food
A larger proportion (74.5%) of the household’s main source of food was through purchases. The remaining proportion (<10%) was through own production, gifts, food aid, bartering and gathering. The main source of cereals for the study households was mainly through purchasing (80.4%), while the remaining proportion of the households obtained cereals from own production, gifts, food aid and barter trade. The main source of milk for the households was through production (38.4%) and purchasing (22.4%), however it is important to note that about 38% of the households did not consume milk, because they were not able to access it either by purchasing or through their own production. 67.1% of the households in the study were consuming two meals a day, while only 28.2% were consuming three or more meals a day, while 4.7% of the households in the study were consuming only one meal a day. According to the focus group discussions, there has been a reduction in the number of portions and meals consumed because of the high prices of food and the reduced availability of animal products such as meat and milk.
Main source of food N= 255 N % CI
Own production Purchasing Gifts from friend Food aid Bartering Gathering
21190221741
8.574.58.66.61.50.3
2.5‐13.962.4‐86.51.5‐15.72.5‐10.8
0‐4.00‐1.1
Main source of cereals N=255
Own production Purchasing Gifts Food aid Bartered N/Applicable
2220651435
8.680.41.95.41.81.9
2.5‐14.770.9‐90.5
0‐4.51.7‐9.20‐3.50‐4.2
Main source of milk N=255
Own production Purchasing Gifts Bartered N/Applicable
98571297
38.422.40.40.838.0
26.5‐50.311.4‐33.2
0‐1.20‐2.4
28.5‐47.5
Number of meals taken/day
One Two Three
1217172
4.767.128.2
0.9‐8.554.3‐79.715.9‐40.6
Elbarde, Huddur and Rabdure districts, Bakool Region Pastoral Nutrition Assessment Report – April 2008 FSAU, IMC, UNICEF
15
4.3.2 Dietary Diversity
Table 4.3.1.2: Number of food groups consumed in assessed households in the preceding 24 hours
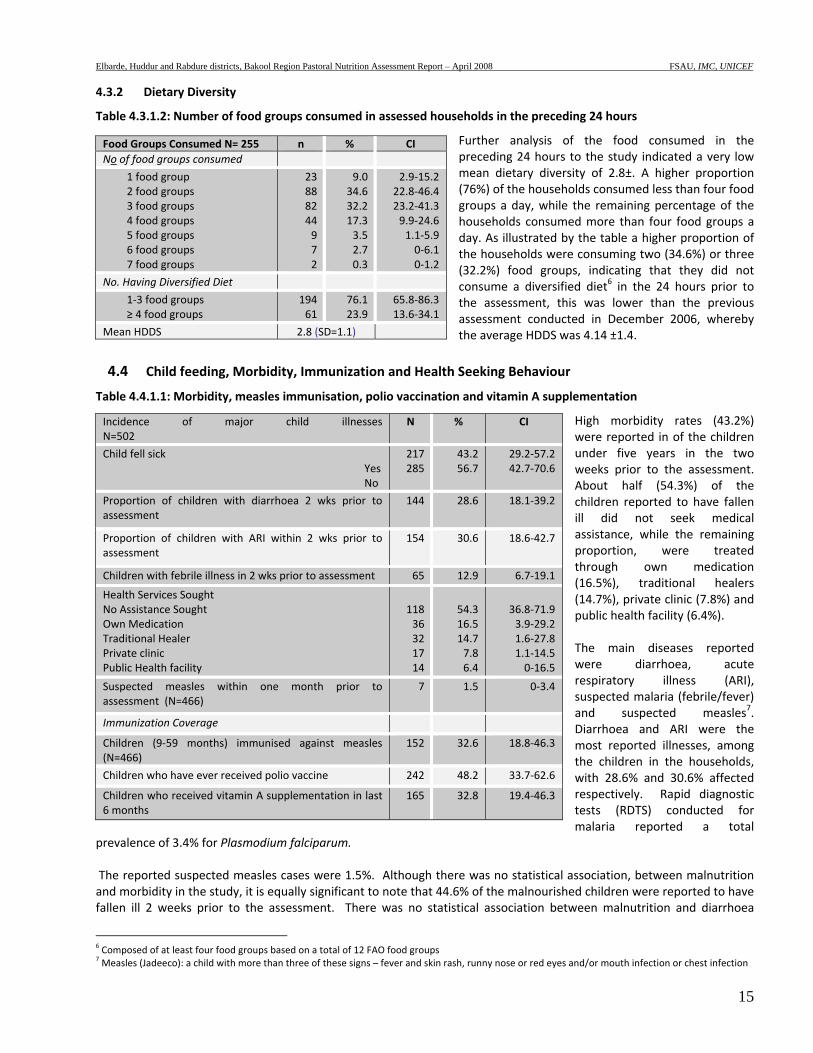
Further analysis of the food consumed in the preceding 24 hours to the study indicated a very low mean dietary diversity of 2.8±. A higher proportion (76%) of the households consumed less than four food groups a day, while the remaining percentage of the households consumed more than four food groups a day. As illustrated by the table a higher proportion of the households were consuming two (34.6%) or three (32.2%) food groups, indicating that they did not consume a diversified diet6 in the 24 hours prior to the assessment, this was lower than the previous assessment conducted in December 2006, whereby the average HDDS was 4.14 ±1.4.
4.4 Child feeding, Morbidity, Immunization and Health Seeking Behaviour
Table 4.4.1.1: Morbidity, measles immunisation, polio vaccination and vitamin A supplementation
High morbidity rates (43.2%) were reported in of the children under five years in the two weeks prior to the assessment. About half (54.3%) of the children reported to have fallen ill did not seek medical assistance, while the remaining proportion, were treated through own medication (16.5%), traditional healers (14.7%), private clinic (7.8%) and public health facility (6.4%). The main diseases reported were diarrhoea, acute respiratory illness (ARI), suspected malaria (febrile/fever) and suspected measles7. Diarrhoea and ARI were the most reported illnesses, among the children in the households, with 28.6% and 30.6% affected respectively. Rapid diagnostic tests (RDTS) conducted for malaria reported a total
prevalence of 3.4% for Plasmodium falciparum. The reported suspected measles cases were 1.5%. Although there was no statistical association, between malnutrition and morbidity in the study, it is equally significant to note that 44.6% of the malnourished children were reported to have fallen ill 2 weeks prior to the assessment. There was no statistical association between malnutrition and diarrhoea
6 Composed of at least four food groups based on a total of 12 FAO food groups 7 Measles (Jadeeco): a child with more than three of these signs – fever and skin rash, runny nose or red eyes and/or mouth infection or chest infection
Food Groups Consumed N= 255 n % CI No of food groups consumed
1 food group 2 food groups 3 food groups 4 food groups 5 food groups 6 food groups 7 food groups
23 88 82 44 9 7 2
9.034.632.217.33.52.70.3
2.9‐15.222.8‐46.423.2‐41.39.9‐24.61.1‐5.90‐6.10‐1.2
No. Having Diversified Diet
1‐3 food groups ≥ 4 food groups
194 61
76.123.9
65.8‐86.313.6‐34.1
Mean HDDS 2.8 (SD=1.1)
Incidence of major child illnesses N=502
N % CI
Child fell sick Yes No
217285
43.256.7
29.2‐57.242.7‐70.6
Proportion of children with diarrhoea 2 wks prior to assessment
144 28.6 18.1‐39.2
Proportion of children with ARI within 2 wks prior to assessment
154 30.6 18.6‐42.7
Children with febrile illness in 2 wks prior to assessment 65 12.9 6.7‐19.1
Health Services Sought No Assistance Sought Own Medication Traditional Healer Private clinic Public Health facility
11836321714
54.316.514.77.86.4
36.8‐71.93.9‐29.21.6‐27.81.1‐14.50‐16.5
Suspected measles within one month prior to assessment (N=466)
7 1.5 0‐3.4
Immunization Coverage
Children (9‐59 months) immunised against measles (N=466)
152 32.6 18.8‐46.3
Children who have ever received polio vaccine 242 48.2 33.7‐62.6
Children who received vitamin A supplementation in last 6 months
165 32.8 19.4‐46.3
Elbarde, Huddur and Rabdure districts, Bakool Region Pastoral Nutrition Assessment Report – April 2008 FSAU, IMC, UNICEF
16
among the children in the study. Immunization coverage for measles, polio and vitamin A supplementation in the area was well below recommended standards8. Only 32.6% of the children were immunized against measles, 48.2% against polio and only 32.8% had received vitamin A supplementation.
4.4.2 Child Feeding Practices
Table 4.4.2.1: Breastfeeding and Complimentary Feeding Practices
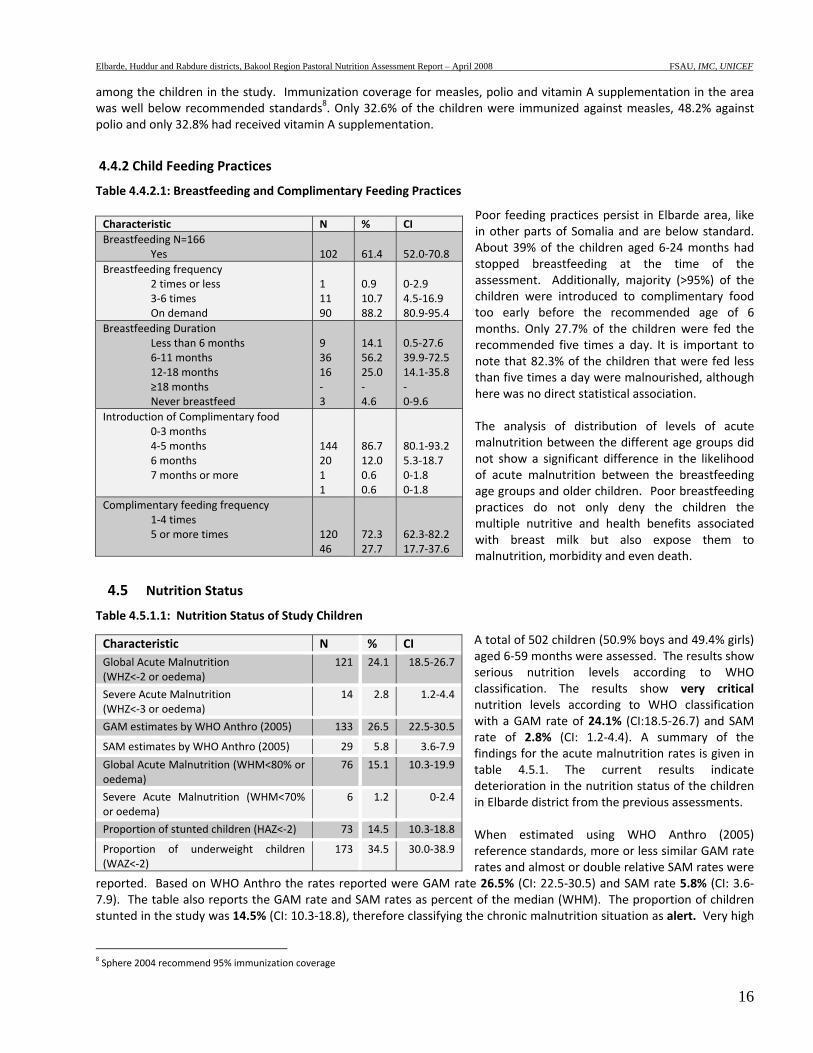
Poor feeding practices persist in Elbarde area, like in other parts of Somalia and are below standard. About 39% of the children aged 6‐24 months had stopped breastfeeding at the time of the assessment. Additionally, majority (>95%) of the children were introduced to complimentary food too early before the recommended age of 6 months. Only 27.7% of the children were fed the recommended five times a day. It is important to note that 82.3% of the children that were fed less than five times a day were malnourished, although here was no direct statistical association. The analysis of distribution of levels of acute malnutrition between the different age groups did not show a significant difference in the likelihood of acute malnutrition between the breastfeeding age groups and older children. Poor breastfeeding practices do not only deny the children the multiple nutritive and health benefits associated with breast milk but also expose them to malnutrition, morbidity and even death.
4.5 Nutrition Status
Table 4.5.1.1: Nutrition Status of Study Children
A total of 502 children (50.9% boys and 49.4% girls) aged 6‐59 months were assessed. The results show serious nutrition levels according to WHO classification. The results show very critical nutrition levels according to WHO classification with a GAM rate of 24.1% (CI:18.5‐26.7) and SAM rate of 2.8% (CI: 1.2‐4.4). A summary of the findings for the acute malnutrition rates is given in table 4.5.1. The current results indicate deterioration in the nutrition status of the children in Elbarde district from the previous assessments. When estimated using WHO Anthro (2005) reference standards, more or less similar GAM rate rates and almost or double relative SAM rates were
reported. Based on WHO Anthro the rates reported were GAM rate 26.5% (CI: 22.5‐30.5) and SAM rate 5.8% (CI: 3.6‐7.9). The table also reports the GAM rate and SAM rates as percent of the median (WHM). The proportion of children stunted in the study was 14.5% (CI: 10.3‐18.8), therefore classifying the chronic malnutrition situation as alert. Very high
8 Sphere 2004 recommend 95% immunization coverage
Characteristic N % CI Breastfeeding N=166
Yes 102
61.4
52.0‐70.8
Breastfeeding frequency 2 times or less 3‐6 times On demand
1 11 90
0.9 10.7 88.2
0‐2.9 4.5‐16.9 80.9‐95.4
Breastfeeding Duration Less than 6 months 6‐11 months 12‐18 months ≥18 months Never breastfeed
9 36 16 ‐ 3
14.1 56.2 25.0 ‐ 4.6
0.5‐27.6 39.9‐72.5 14.1‐35.8 ‐ 0‐9.6
Introduction of Complimentary food 0‐3 months 4‐5 months 6 months 7 months or more
144 20 1 1
86.7 12.0 0.6 0.6
80.1‐93.2 5.3‐18.7 0‐1.8 0‐1.8
Complimentary feeding frequency 1‐4 times 5 or more times
120 46
72.3 27.7
62.3‐82.2 17.7‐37.6
Characteristic N % CIGlobal Acute Malnutrition (WHZ<‐2 or oedema)
121 24.1 18.5‐26.7
Severe Acute Malnutrition (WHZ<‐3 or oedema)
14 2.8 1.2‐4.4
GAM estimates by WHO Anthro (2005) 133 26.5 22.5‐30.5
SAM estimates by WHO Anthro (2005) 29 5.8 3.6‐7.9
Global Acute Malnutrition (WHM<80% or oedema)
76 15.1 10.3‐19.9
Severe Acute Malnutrition (WHM<70% or oedema)
6 1.2 0‐2.4
Proportion of stunted children (HAZ<‐2) 73 14.5 10.3‐18.8
Proportion of underweight children (WAZ<‐2)
173 34.5 30.0‐38.9
Elbarde, Huddur and Rabdure districts, Bakool Region Pastoral Nutrition Assessment Report – April 2008 FSAU, IMC, UNICEF
17
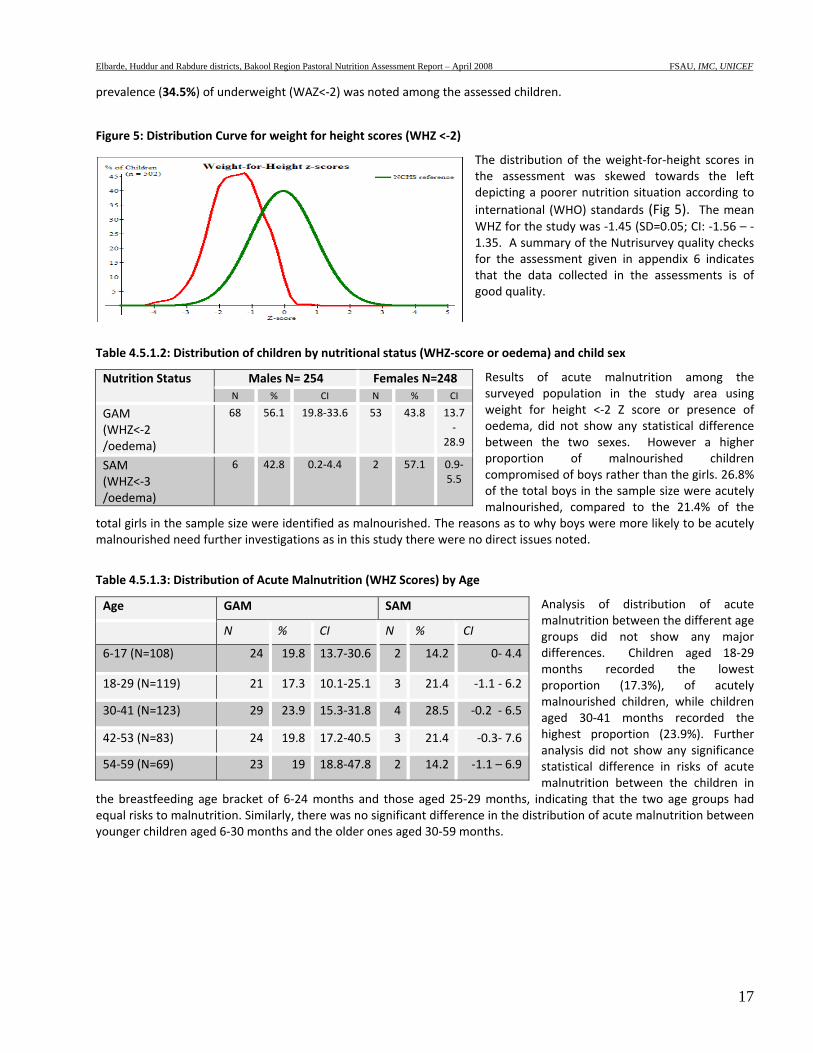
prevalence (34.5%) of underweight (WAZ<‐2) was noted among the assessed children.
Figure 5: Distribution Curve for weight for height scores (WHZ <‐2)
The distribution of the weight‐for‐height scores in the assessment was skewed towards the left depicting a poorer nutrition situation according to international (WHO) standards (Fig 5). The mean WHZ for the study was ‐1.45 (SD=0.05; CI: ‐1.56 – ‐1.35. A summary of the Nutrisurvey quality checks for the assessment given in appendix 6 indicates that the data collected in the assessments is of good quality.
Table 4.5.1.2: Distribution of children by nutritional status (WHZ‐score or oedema) and child sex
Results of acute malnutrition among the surveyed population in the study area using weight for height <‐2 Z score or presence of oedema, did not show any statistical difference between the two sexes. However a higher proportion of malnourished children compromised of boys rather than the girls. 26.8% of the total boys in the sample size were acutely malnourished, compared to the 21.4% of the
total girls in the sample size were identified as malnourished. The reasons as to why boys were more likely to be acutely malnourished need further investigations as in this study there were no direct issues noted.
Table 4.5.1.3: Distribution of Acute Malnutrition (WHZ Scores) by Age
Analysis of distribution of acute malnutrition between the different age groups did not show any major differences. Children aged 18‐29 months recorded the lowest proportion (17.3%), of acutely malnourished children, while children aged 30‐41 months recorded the highest proportion (23.9%). Further analysis did not show any significance statistical difference in risks of acute malnutrition between the children in
the breastfeeding age bracket of 6‐24 months and those aged 25‐29 months, indicating that the two age groups had equal risks to malnutrition. Similarly, there was no significant difference in the distribution of acute malnutrition between younger children aged 6‐30 months and the older ones aged 30‐59 months.
Nutrition Status Males N= 254 Females N=248N % CI N % CI
GAM (WHZ<‐2 /oedema)
68 56.1 19.8‐33.6 53 43.8 13.7‐
28.9
SAM (WHZ<‐3 /oedema)
6 42.8 0.2‐4.4 2 57.1 0.9‐5.5
Age GAM SAM
N % CI N % CI
6‐17 (N=108) 24 19.8 13.7‐30.6 2 14.2 0‐ 4.4
18‐29 (N=119) 21 17.3 10.1‐25.1 3 21.4 ‐1.1 ‐ 6.2
30‐41 (N=123) 29 23.9 15.3‐31.8 4 28.5 ‐0.2 ‐ 6.5
42‐53 (N=83) 24 19.8 17.2‐40.5 3 21.4 ‐0.3‐ 7.6
54‐59 (N=69) 23 19 18.8‐47.8 2 14.2 ‐1.1 – 6.9
Elbarde, Huddur and Rabdure districts, Bakool Region Pastoral Nutrition Assessment Report – April 2008 FSAU, IMC, UNICEF
18
4.5.1 Acute Malnutrition using MUAC
Table 4.5.1.4: Child and Adult Nutrition Status by MUAC
Based on MUAC measurements, acute malnutrition rates were lower than the rates recorded by WHZ and consistent with past assessments which have indicated lower rates of acute malnutrition when using MUAC. (MUAC< 12.5 cm or oedema) of 5.6% (CI: 3.0‐8.3)
with 0.6% severely malnourished was reported in the assessment. Among the assessed women; high malnutrition rates were recorded among the pregnant women (MUAC< 23.0 cm) at 42.4%. Pregnancy raises physiological and nutritional demands of women making them vulnerable to malnutrition. High rates of acute malnutrition were recorded among the non pregnant women. 4.6 RDT Malaria Tests
Table 4.5.1.5: RDT Malaria Assessment Results
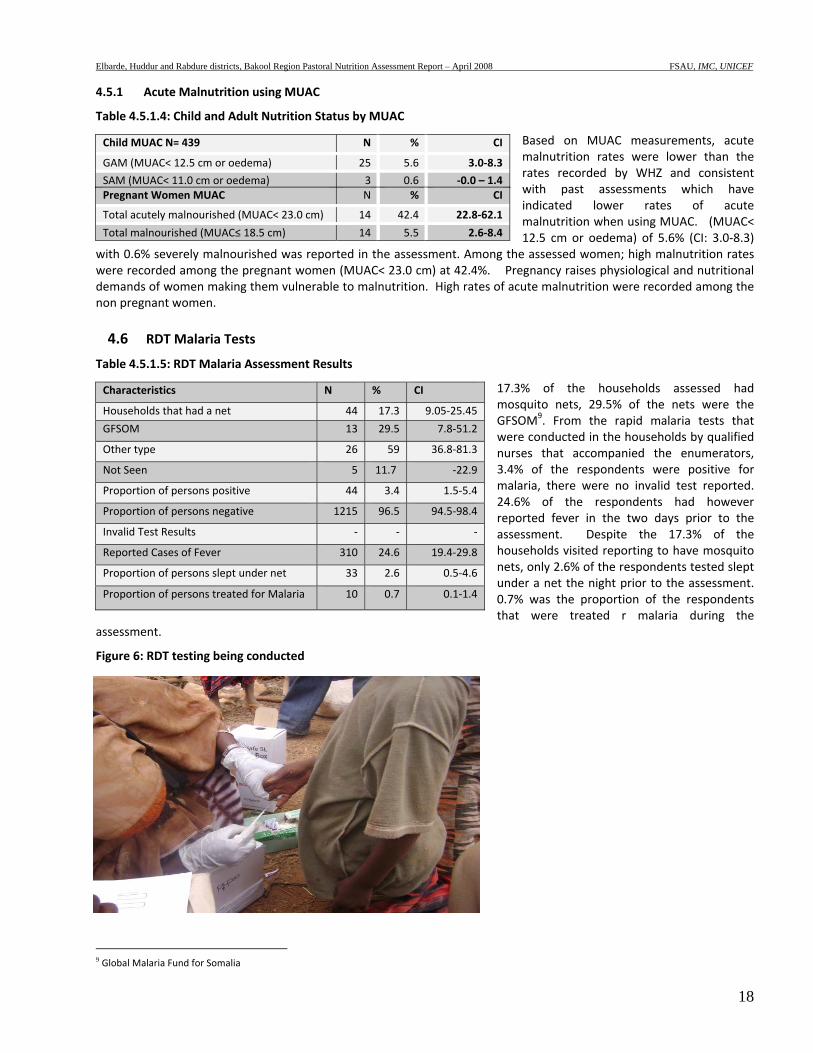
17.3% of the households assessed had mosquito nets, 29.5% of the nets were the GFSOM9. From the rapid malaria tests that were conducted in the households by qualified nurses that accompanied the enumerators, 3.4% of the respondents were positive for malaria, there were no invalid test reported. 24.6% of the respondents had however reported fever in the two days prior to the assessment. Despite the 17.3% of the households visited reporting to have mosquito nets, only 2.6% of the respondents tested slept under a net the night prior to the assessment. 0.7% was the proportion of the respondents that were treated r malaria during the
assessment.
Figure 6: RDT testing being conducted
9 Global Malaria Fund for Somalia
Child MUAC N= 439 N % CI
GAM (MUAC< 12.5 cm or oedema) 25 5.6 3.0‐8.3
SAM (MUAC< 11.0 cm or oedema) 3 0.6 ‐0.0 – 1.4 Pregnant Women MUAC N % CI
Total acutely malnourished (MUAC< 23.0 cm) 14 42.4 22.8‐62.1
Total malnourished (MUAC≤ 18.5 cm) 14 5.5 2.6‐8.4
Characteristics N % CI
Households that had a net 44 17.3 9.05‐25.45
GFSOM 13 29.5 7.8‐51.2
Other type 26 59 36.8‐81.3
Not Seen 5 11.7 ‐22.9
Proportion of persons positive 44 3.4 1.5‐5.4
Proportion of persons negative 1215 96.5 94.5‐98.4
Invalid Test Results ‐ ‐ ‐
Reported Cases of Fever 310 24.6 19.4‐29.8
Proportion of persons slept under net 33 2.6 0.5‐4.6
Proportion of persons treated for Malaria 10 0.7 0.1‐1.4
Elbarde, Huddur and Rabdure districts, Bakool Region Pastoral Nutrition Assessment Report – April 2008 FSAU, IMC, UNICEF
19
4.7 Mortality
Table 4.7.1: Summary of mortality results
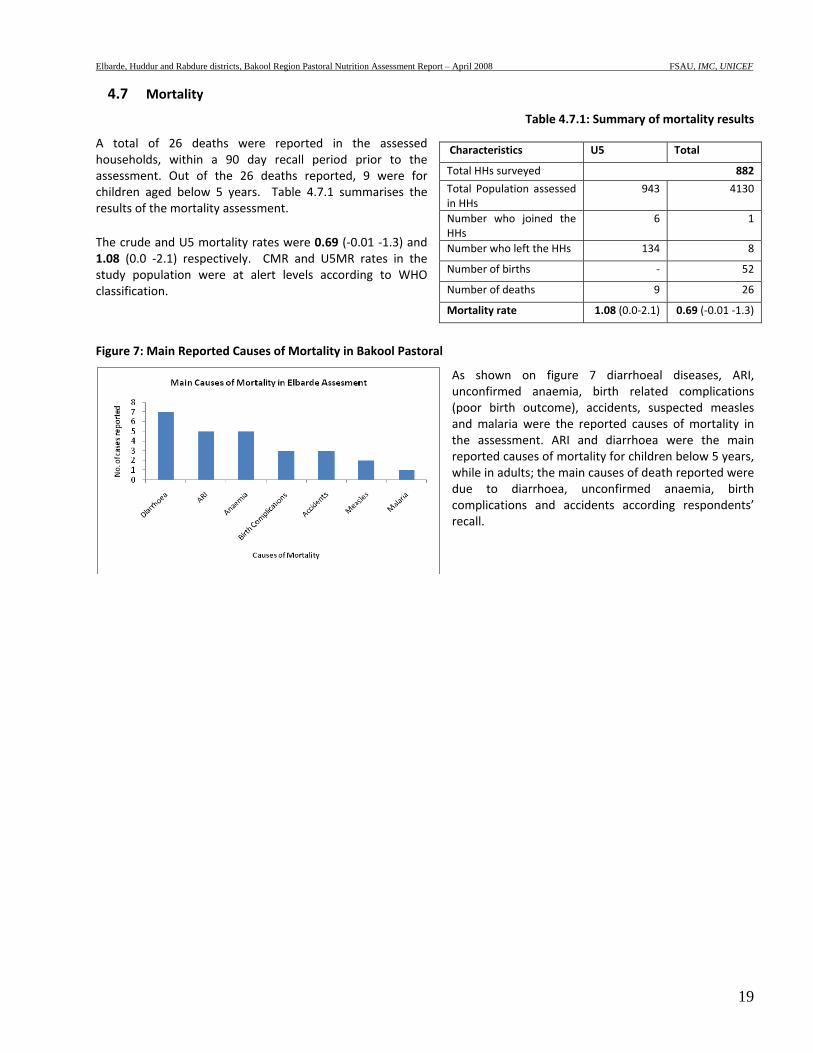
A total of 26 deaths were reported in the assessed households, within a 90 day recall period prior to the assessment. Out of the 26 deaths reported, 9 were for children aged below 5 years. Table 4.7.1 summarises the results of the mortality assessment. The crude and U5 mortality rates were 0.69 (‐0.01 ‐1.3) and 1.08 (0.0 ‐2.1) respectively. CMR and U5MR rates in the study population were at alert levels according to WHO classification.
Figure 7: Main Reported Causes of Mortality in Bakool Pastoral
As shown on figure 7 diarrhoeal diseases, ARI, unconfirmed anaemia, birth related complications (poor birth outcome), accidents, suspected measles and malaria were the reported causes of mortality in the assessment. ARI and diarrhoea were the main reported causes of mortality for children below 5 years, while in adults; the main causes of death reported were due to diarrhoea, unconfirmed anaemia, birth complications and accidents according respondents’ recall.
Characteristics U5 Total
Total HHs surveyed 882
Total Population assessed in HHs
943 4130
Number who joined the HHs
6 1
Number who left the HHs 134 8
Number of births ‐ 52
Number of deaths 9 26
Mortality rate 1.08 (0.0‐2.1) 0.69 (‐0.01 ‐1.3)
Elbarde, Huddur and Rabdure districts, Bakool Region Pastoral Nutrition Assessment Report – April 2008 FSAU, IMC, UNICEF
20
4.8 Qualitative Information Additional Information on food security, water & sanitation and childcare practices, dietary patterns, and morbidity was collected through qualitative approaches. Semi‐structured interviews with key informants and community focus groups were used for collecting the information.
Figure 8: Water Source in Elbarde District
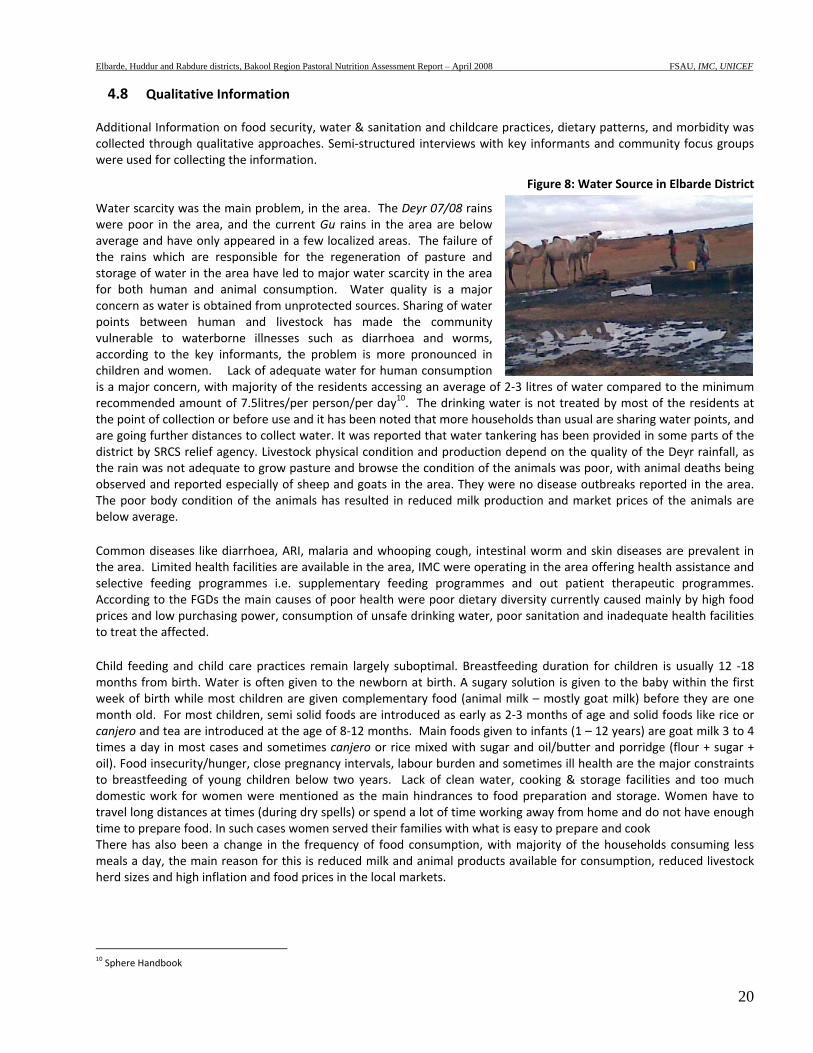
Water scarcity was the main problem, in the area. The Deyr 07/08 rains were poor in the area, and the current Gu rains in the area are below average and have only appeared in a few localized areas. The failure of the rains which are responsible for the regeneration of pasture and storage of water in the area have led to major water scarcity in the area for both human and animal consumption. Water quality is a major concern as water is obtained from unprotected sources. Sharing of water points between human and livestock has made the community vulnerable to waterborne illnesses such as diarrhoea and worms, according to the key informants, the problem is more pronounced in children and women. Lack of adequate water for human consumption is a major concern, with majority of the residents accessing an average of 2‐3 litres of water compared to the minimum recommended amount of 7.5litres/per person/per day10. The drinking water is not treated by most of the residents at the point of collection or before use and it has been noted that more households than usual are sharing water points, and are going further distances to collect water. It was reported that water tankering has been provided in some parts of the district by SRCS relief agency. Livestock physical condition and production depend on the quality of the Deyr rainfall, as the rain was not adequate to grow pasture and browse the condition of the animals was poor, with animal deaths being observed and reported especially of sheep and goats in the area. They were no disease outbreaks reported in the area. The poor body condition of the animals has resulted in reduced milk production and market prices of the animals are below average. Common diseases like diarrhoea, ARI, malaria and whooping cough, intestinal worm and skin diseases are prevalent in the area. Limited health facilities are available in the area, IMC were operating in the area offering health assistance and selective feeding programmes i.e. supplementary feeding programmes and out patient therapeutic programmes. According to the FGDs the main causes of poor health were poor dietary diversity currently caused mainly by high food prices and low purchasing power, consumption of unsafe drinking water, poor sanitation and inadequate health facilities to treat the affected. Child feeding and child care practices remain largely suboptimal. Breastfeeding duration for children is usually 12 ‐18 months from birth. Water is often given to the newborn at birth. A sugary solution is given to the baby within the first week of birth while most children are given complementary food (animal milk – mostly goat milk) before they are one month old. For most children, semi solid foods are introduced as early as 2‐3 months of age and solid foods like rice or canjero and tea are introduced at the age of 8‐12 months. Main foods given to infants (1 – 12 years) are goat milk 3 to 4 times a day in most cases and sometimes canjero or rice mixed with sugar and oil/butter and porridge (flour + sugar + oil). Food insecurity/hunger, close pregnancy intervals, labour burden and sometimes ill health are the major constraints to breastfeeding of young children below two years. Lack of clean water, cooking & storage facilities and too much domestic work for women were mentioned as the main hindrances to food preparation and storage. Women have to travel long distances at times (during dry spells) or spend a lot of time working away from home and do not have enough time to prepare food. In such cases women served their families with what is easy to prepare and cook There has also been a change in the frequency of food consumption, with majority of the households consuming less meals a day, the main reason for this is reduced milk and animal products available for consumption, reduced livestock herd sizes and high inflation and food prices in the local markets.
10 Sphere Handbook
Elbarde, Huddur and Rabdure districts, Bakool Region Pastoral Nutrition Assessment Report – April 2008 FSAU, IMC, UNICEF
21
5 DISCUSSION In the assessment, a total of 502 children aged 6‐59 months and measuring 65‐109.9 cm in height/length from 255 households were assessed; and mortality data collected from 886 households. Results indicated a GAM rate of 24.1% (CI: 18.5‐29.7) and a SAM rate of 2.8% (CI: 1.2‐4.4), the results indicate a Very Critical nutrition situation according to WHO classification and indicate a deterioration and the worst situation in the district from previous assessments conducted in the area. The retrospective crude and under five mortality rates were estimated at 0.69 (‐0.01– 1.3) and 1.08 (0.0‐2.1) deaths/10,000/day respectively, and are both at Alert levels according to the WHO classification. Most of the reported deaths of children aged below five years and those aged above five years were reportedly caused by diarrhoea, Acute Respiratory Infection (ARI), measles, unconfirmed anaemia and malaria, in that order. Other reported causes of death included complications arising during birth and accidents. High morbidity rates (43.2%) were reported in the region, in the two weeks prior to the study. The incidence of reported diarrhoea, ARI, suspected malaria/febrile illness was 28.6%, 30.6% and 13.0% respectively. However, Rapid Diagnostic Tests (RDT) conducted for malaria confirmed only 3.4% as positive for Plasmodium falciparum. The suspected measles cases were low (1.5%) but significant. Although there was no statistical association in this study with morbidity, it was noted that 24.9% of the malnourished children were ill two weeks prior to the study. Poor feeding practices persist in Bakool like in other parts of Somalia and have been associated with high levels of malnutrition. Most children are not only initiated to breastfeeding late after 2‐3 days after birth , but are also introduced to complimentary foods early in life and breastfeeding does not continue to the recommended 24 months. 38.5% of the children aged 6‐24 months had stopped breastfeeding at the time of the assessment, in addition majority of the children (86.7%) had been introduced to complimentary food too early, i.e. before the recommended age of six months, and this predisposes the children to malnutrition. Moreover, only 27.7% of the children aged 6‐24 months were fed for the recommended five times in a day. However, analysis of distribution of acute malnutrition between the different age groups did not show a significant difference in the likelihood of acute malnutrition between the breastfeeding age groups and older children. Poor breastfeeding and complimentary feeding habits expose children to morbidity, malnutrition and even death. The reduced food intake among the children and the household in general was blamed on high food prices in the market and the reduced production of milk and animal products in the area. Poor coverage of health programmes are an important risk factor to the poor nutrition situation in Bakool region. Measles vaccination was low (32.6%), vitamin A supplementation was also below standard (32.8%) and polio immunization was also low (48.2%) falling way below the recommended 95% level (Sphere, 2004), poor health programme and immunization coverage are high risk factors that predispose children to malnutrition and high morbidity in an area. Access to basic services of water, health and sanitation is a major problem in the region. A mere 12.5% of the households had access to clean drinking water, while only 4.3% used proper toilet facilities and only 14.2% of the children who fell ill visited a public or private health facility. These indicators give an indication of the poor water, sanitation and health situation in the area, all of which are major risk factors affecting malnutrition and morbidity. The poor rains in the region have aggravated the situation, leading households to consume unsafe water and using less water than they require for their daily needs. The pastoralists rely on their animals (81.9%) for milk and also sell them to be able to purchase other food and non food items, with poor animal conditions, and low production of milk due to the weakened animal body conditions because of lack of adequate pasture and water, their food intake becomes compromised. This is made worse by the fact that majority of the households will then rely on purchasing food (74.5%), and the current food prices in the market are very high. Milk is relied on for both consumption at the household level and for sale to purchase other food and non food requirements. It was noted that a larger proportion of the households (76%) consumed less than four food groups in a day. A slightly lower proportion (67.1%) consumed two meals a day, low consumption of food groups such as fruits, vegetables and pulses is also a chief concern because these food groups are important sources of micronutrients. This exposes the population to the risk of micronutrient deficiencies. Given that there is only one main source of income (sale of animals and animal products), when this one income source becomes affected, the food and nutrition security of the population is put under threat, a situation that is being compounded by the soaring food prices in the region.
Elbarde, Huddur and Rabdure districts, Bakool Region Pastoral Nutrition Assessment Report – April 2008 FSAU, IMC, UNICEF
22
In conclusion the nutrition situation in Elbarde district, Bakool pastorals, is Very Critical and perilous. The nutrition situation in the area has deteriorated from previous assessments done in the area, and is currently at the worst recorded levels so far. Overall the key underlying factors are child care and morbidity, diarrhoea in particular; poor sanitation and lack of adequate and safe water, integrated approaches should be undertaken to reduce risk factors such as poor child care, unsafe drinking water, limited sanitation and hygiene services. Measure s to increase access to health facilities and improved coverage of health programmes would play a critical role in both preventing and treating morbidity. In spite of this, the current situation among the pastoral population Bakool region, it is very crucial to note the role of increased food prices and inadequate water and pasture which have affected the animal sales and production (hence directly affecting the income of the households) in the area cannot be ignored and are probably currently the direct cause of inadequate food intake in the households.
6 RECOMMENDATIONS The poor nutrition and health situation in the study area is attributed to multiple and interrelated factors that calls for integrated intervention efforts to address both immediate life saving needs in addition to developing longer term strategies to enhance access to basic services and support and sustain livelihood systems and social protection mechanisms. Specific recommendations include:
Immediate Interventions
• Rehabilitation of acutely malnourished children through the existing selective feeding and outreach programs and active case finding until household food security is restored and critical public health issues are addressed. Capacity building of the existing MCH and the community to manage acutely malnourished children through locally available resources could be explored.
• Intervention programmes on improving water, sanitation and hygiene practices including health education to educate the community on domestic treatment of drinking water.
• Improving coverage for health programmes, especially for measles vaccination and vitamin A supplementation. Vigorous campaigns targeting the bulk of rural population are required in Bakool region. Care givers should also be trained on the need to let their children receive these services.
• Intensify nutrition and health education targeting children care givers with messages on the importance of exclusive breastfeeding, improved child‐feeding practices appropriate health‐seeking behaviour and improved hygiene & sanitation practices
• Education on proper disposal of human faecal waste to avoid contamination of water sources.
Long term Interventions
• There is need to focus on programmes that improve and sustain dietary diversity and consumption of micronutrient rich foods. Food distribution for pulses and micronutrient enriched oil could help improve dietary diversity especially among poor people. Introduction of kitchen gardens to promote production and consumption of vegetables and fruits may also enhance dietary diversity especially for vitamin and minerals.
• To address the issues of limited access to safe water, there is a need for rehabilitation/protection of water systems including the well and water catchments. Potential for domestic water harvesting from the roofs and conservation could also be explored. The community should be trained on sanitation of the water systems
• To initiate income generating activities to improve the socio‐economic situation in Bakool. Introduction of small‐scale credit system for small business would help improve livelihoods especially among the Bakool community.
• There is need for establishment or strengthening of health facilities and satellite services especially in rural villages where there are no health facilities
• Intensifying health and nutrition education activities at the household level to address care concerns, targeting mothers, and other caregivers. The main areas of focus should include promoting exclusive breastfeeding, appropriate young child feeding, diet diversification, and improvements in household hygiene including health care practices.
• Advocacy campaigns on domestic water treatment such as boiling of drinking water to minimise risks of water born diseases.

Elbarde, Huddur and Rabdure districts, Bakool Region Pastoral Nutrition Assessment Report – April 2008 FSAU, IMC, UNICEF
23
• Provision of sanitary facilities including large scale building of latrine at household level or at strategic locations in the region for appropriate disposal of human excretal waste. This should be coupled with awareness on the need to use such facilities.
Elbarde, Huddur and Rabdure districts, Bakool Region Pastoral Nutrition Assessment Report – April 2008 FSAU, IMC, UNICEF
24
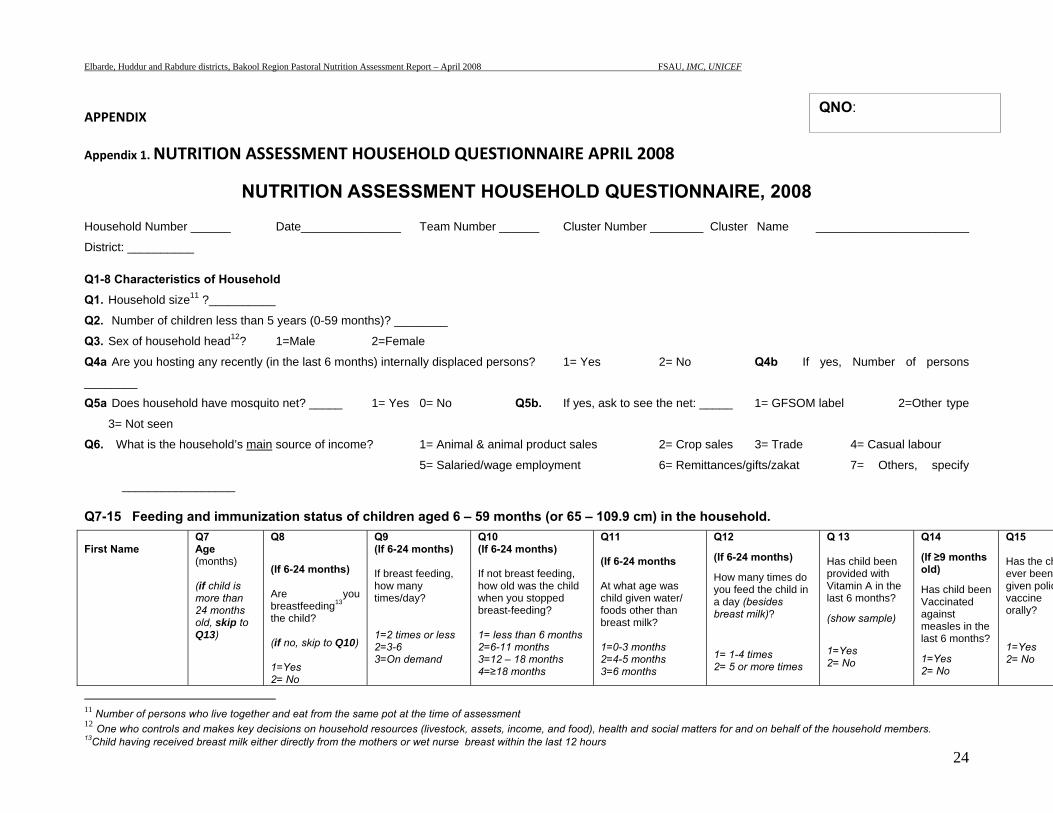
APPENDIX
Appendix 1. NUTRITION ASSESSMENT HOUSEHOLD QUESTIONNAIRE APRIL 2008
NUTRITION ASSESSMENT HOUSEHOLD QUESTIONNAIRE, 2008
Household Number ______ Date_______________ Team Number ______ Cluster Number ________ Cluster Name _______________________
District: __________
Q1-8 Characteristics of Household Q1. Household size11 ?__________
Q2. Number of children less than 5 years (0-59 months)? ________
Q3. Sex of household head12? 1=Male 2=Female
Q4a Are you hosting any recently (in the last 6 months) internally displaced persons? 1= Yes 2= No Q4b If yes, Number of persons
________
Q5a Does household have mosquito net? _____ 1= Yes 0= No Q5b. If yes, ask to see the net: _____ 1= GFSOM label 2=Other type
3= Not seen
Q6. What is the household’s main source of income? 1= Animal & animal product sales 2= Crop sales 3= Trade 4= Casual labour
5= Salaried/wage employment 6= Remittances/gifts/zakat 7= Others, specify
_________________
Q7-15 Feeding and immunization status of children aged 6 – 59 months (or 65 – 109.9 cm) in the household.
First Name
Q7 Age (months) (if child is more than 24 months old, skip to Q13)
Q8
(If 6-24 months) Are you breastfeeding13 the child? (if no, skip to Q10) 1=Yes 2= No
Q9 (If 6-24 months) If breast feeding, how many times/day? 1=2 times or less 2=3-6 3=On demand
Q10 (If 6-24 months) If not breast feeding, how old was the child when you stopped breast-feeding? 1= less than 6 months 2=6-11 months 3=12 – 18 months 4=≥18 months
Q11 (If 6-24 months At what age was child given water/ foods other than breast milk? 1=0-3 months 2=4-5 months 3=6 months
Q12
(If 6-24 months)
How many times do you feed the child in a day (besides breast milk)?
1= 1-4 times 2= 5 or more times
Q 13 Has child been provided with Vitamin A in the last 6 months?
(show sample)
1=Yes 2= No
Q14
(If ≥9 months old)
Has child been Vaccinated against measles in the last 6 months?
1=Yes 2= No
Q15 Has the chever been given poliovaccine orally? 1=Yes 2= No
11 Number of persons who live together and eat from the same pot at the time of assessment 12 One who controls and makes key decisions on household resources (livestock, assets, income, and food), health and social matters for and on behalf of the household members. 13Child having received breast milk either directly from the mothers or wet nurse breast within the last 12 hours
QNO:
Elbarde, Huddur and Rabdure districts, Bakool Region Pastoral Nutrition Assessment Report – April 2008 FSAU, IMC, UNICEF
25
5= Never breastfed 4=7 months or more.
1
2
3
4
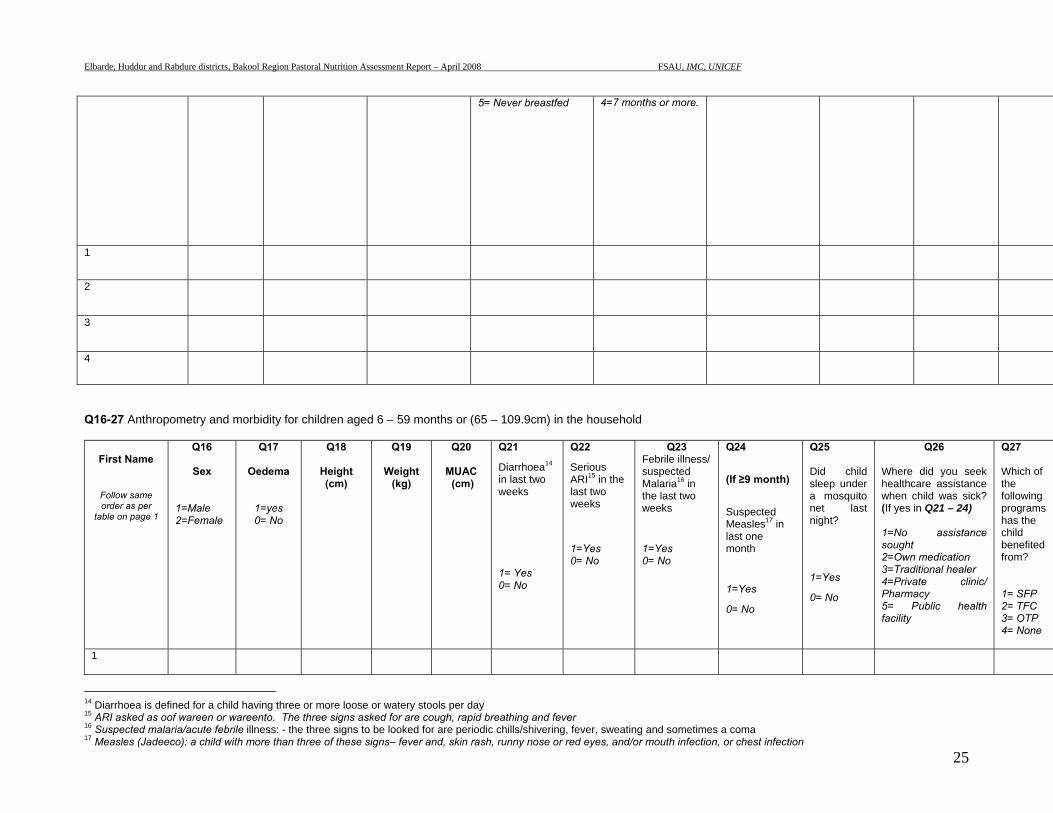
Q16-27 Anthropometry and morbidity for children aged 6 – 59 months or (65 – 109.9cm) in the household
First Name
Follow same order as per
table on page 1
Q16
Sex
1=Male 2=Female
Q17
Oedema
1=yes 0= No
Q18
Height (cm)
Q19
Weight (kg)
Q20
MUAC (cm)
Q21
Diarrhoea14 in last two weeks
1= Yes 0= No
Q22
Serious ARI15 in the last two weeks
1=Yes 0= No
Q23 Febrile illness/ suspected Malaria16 in the last two weeks
1=Yes 0= No
Q24
(If ≥9 month)
Suspected Measles17 in last one month
1=Yes
0= No
Q25 Did child sleep under a mosquito net last night?
1=Yes
0= No
Q26 Where did you seek healthcare assistance when child was sick? (If yes in Q21 – 24) 1=No assistance sought 2=Own medication 3=Traditional healer 4=Private clinic/ Pharmacy 5= Public health facility
Q27 Which of the following programs has the child benefited from? 1= SFP 2= TFC 3= OTP 4= None
1
14 Diarrhoea is defined for a child having three or more loose or watery stools per day 15 ARI asked as oof wareen or wareento. The three signs asked for are cough, rapid breathing and fever 16 Suspected malaria/acute febrile illness: - the three signs to be looked for are periodic chills/shivering, fever, sweating and sometimes a coma 17 Measles (Jadeeco): a child with more than three of these signs– fever and, skin rash, runny nose or red eyes, and/or mouth infection, or chest infection
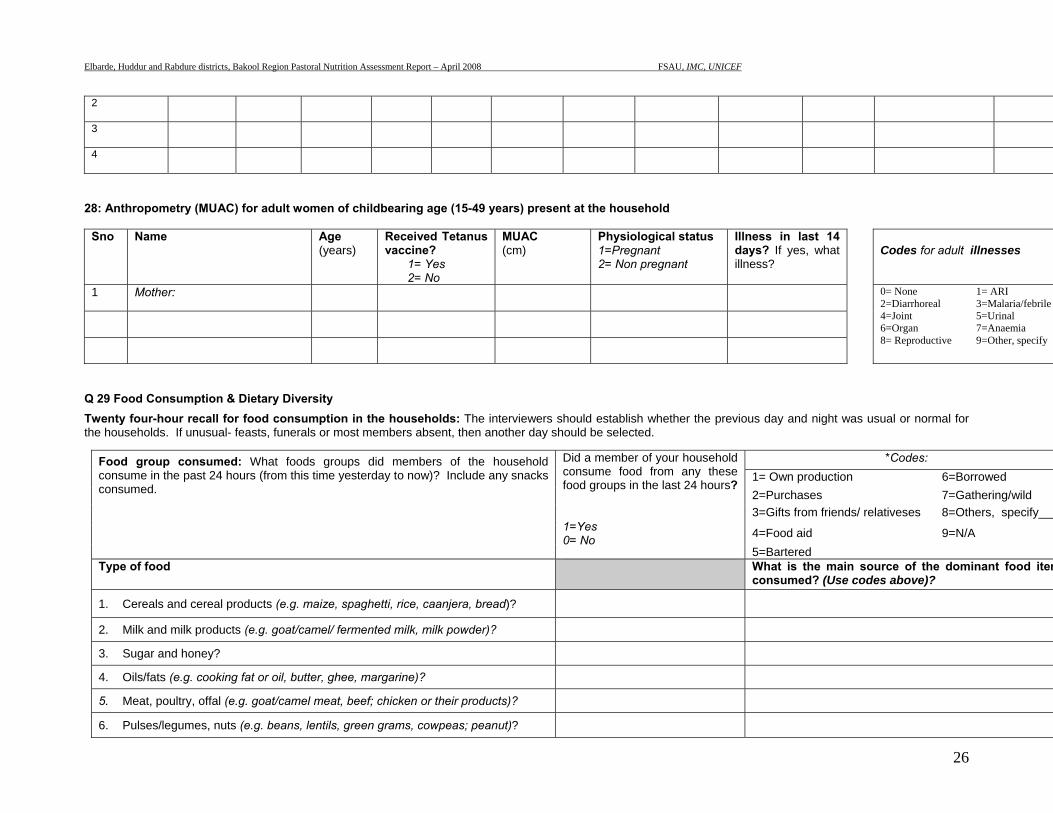
Elbarde, Huddur and Rabdure districts, Bakool Region Pastoral Nutrition Assessment Report – April 2008 FSAU, IMC, UNICEF
26
2 3 4
28: Anthropometry (MUAC) for adult women of childbearing age (15-49 years) present at the household
Sno Name Age(years)
Received Tetanus vaccine?
1= Yes 2= No
MUAC(cm)
Physiological status1=Pregnant 2= Non pregnant
Illness in last 14 days? If yes, what illness?
Codes for adult illnesses
1 Mother: 0= None 1= ARI 2=Diarrhoreal 3=Malaria/febrile 4=Joint 5=Urinal 6=Organ 7=Anaemia 8= Reproductive 9=Other, specify
Q 29 Food Consumption & Dietary Diversity
Twenty four-hour recall for food consumption in the households: The interviewers should establish whether the previous day and night was usual or normal for the households. If unusual- feasts, funerals or most members absent, then another day should be selected.
Food group consumed: What foods groups did members of the household consume in the past 24 hours (from this time yesterday to now)? Include any snacks consumed.
Did a member of your household consume food from any these food groups in the last 24 hours? 1=Yes 0= No
*Codes: 1= Own production 6=Borrowed 2=Purchases 7=Gathering/wild 3=Gifts from friends/ relativeses 8=Others, specify___
4=Food aid 9=N/A 5=Bartered
Type of food What is the main source of the dominant food itemconsumed? (Use codes above)?
1. Cereals and cereal products (e.g. maize, spaghetti, rice, caanjera, bread)?
2. Milk and milk products (e.g. goat/camel/ fermented milk, milk powder)?
3. Sugar and honey?
4. Oils/fats (e.g. cooking fat or oil, butter, ghee, margarine)?
5. Meat, poultry, offal (e.g. goat/camel meat, beef; chicken or their products)?
6. Pulses/legumes, nuts (e.g. beans, lentils, green grams, cowpeas; peanut)?
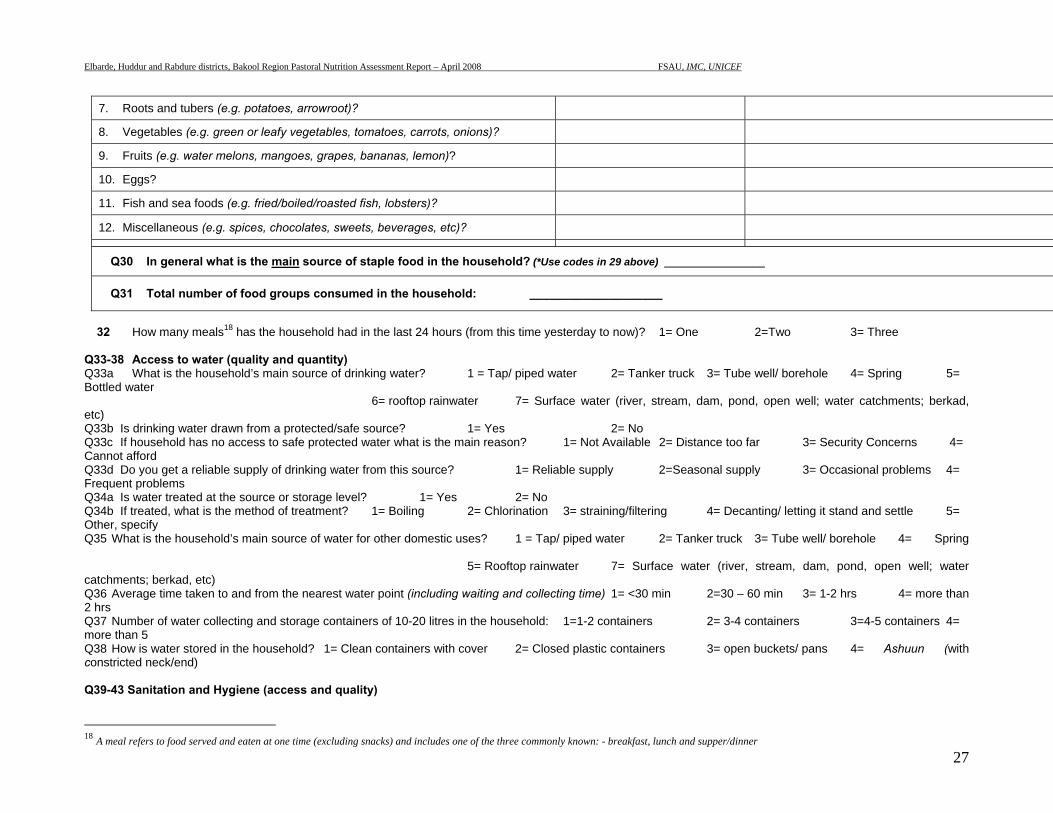
Elbarde, Huddur and Rabdure districts, Bakool Region Pastoral Nutrition Assessment Report – April 2008 FSAU, IMC, UNICEF
27
32 How many meals18 has the household had in the last 24 hours (from this time yesterday to now)? 1= One 2=Two 3= Three
Q33-38 Access to water (quality and quantity) Q33a What is the household’s main source of drinking water? 1 = Tap/ piped water 2= Tanker truck 3= Tube well/ borehole 4= Spring 5= Bottled water 6= rooftop rainwater 7= Surface water (river, stream, dam, pond, open well; water catchments; berkad, etc) Q33b Is drinking water drawn from a protected/safe source? 1= Yes 2= No Q33c If household has no access to safe protected water what is the main reason? 1= Not Available 2= Distance too far 3= Security Concerns 4= Cannot afford Q33d Do you get a reliable supply of drinking water from this source? 1= Reliable supply 2=Seasonal supply 3= Occasional problems 4= Frequent problems Q34a Is water treated at the source or storage level? 1= Yes 2= No Q34b If treated, what is the method of treatment? 1= Boiling 2= Chlorination 3= straining/filtering 4= Decanting/ letting it stand and settle 5= Other, specify Q35 What is the household’s main source of water for other domestic uses? 1 = Tap/ piped water 2= Tanker truck 3= Tube well/ borehole 4= Spring 5= Rooftop rainwater 7= Surface water (river, stream, dam, pond, open well; water catchments; berkad, etc) Q36 Average time taken to and from the nearest water point (including waiting and collecting time) 1= <30 min 2=30 – 60 min 3= 1-2 hrs 4= more than 2 hrs Q37 Number of water collecting and storage containers of 10-20 litres in the household: 1=1-2 containers 2= 3-4 containers 3=4-5 containers 4= more than 5 Q38 How is water stored in the household? 1= Clean containers with cover 2= Closed plastic containers 3= open buckets/ pans 4= Ashuun (with constricted neck/end) Q39-43 Sanitation and Hygiene (access and quality)
18 A meal refers to food served and eaten at one time (excluding snacks) and includes one of the three commonly known: - breakfast, lunch and supper/dinner
7. Roots and tubers (e.g. potatoes, arrowroot)?
8. Vegetables (e.g. green or leafy vegetables, tomatoes, carrots, onions)?
9. Fruits (e.g. water melons, mangoes, grapes, bananas, lemon)?
10. Eggs?
11. Fish and sea foods (e.g. fried/boiled/roasted fish, lobsters)?
12. Miscellaneous (e.g. spices, chocolates, sweets, beverages, etc)?
Q30 In general what is the main source of staple food in the household? (*Use codes in 29 above) _________________
Q31 Total number of food groups consumed in the household: ____________________
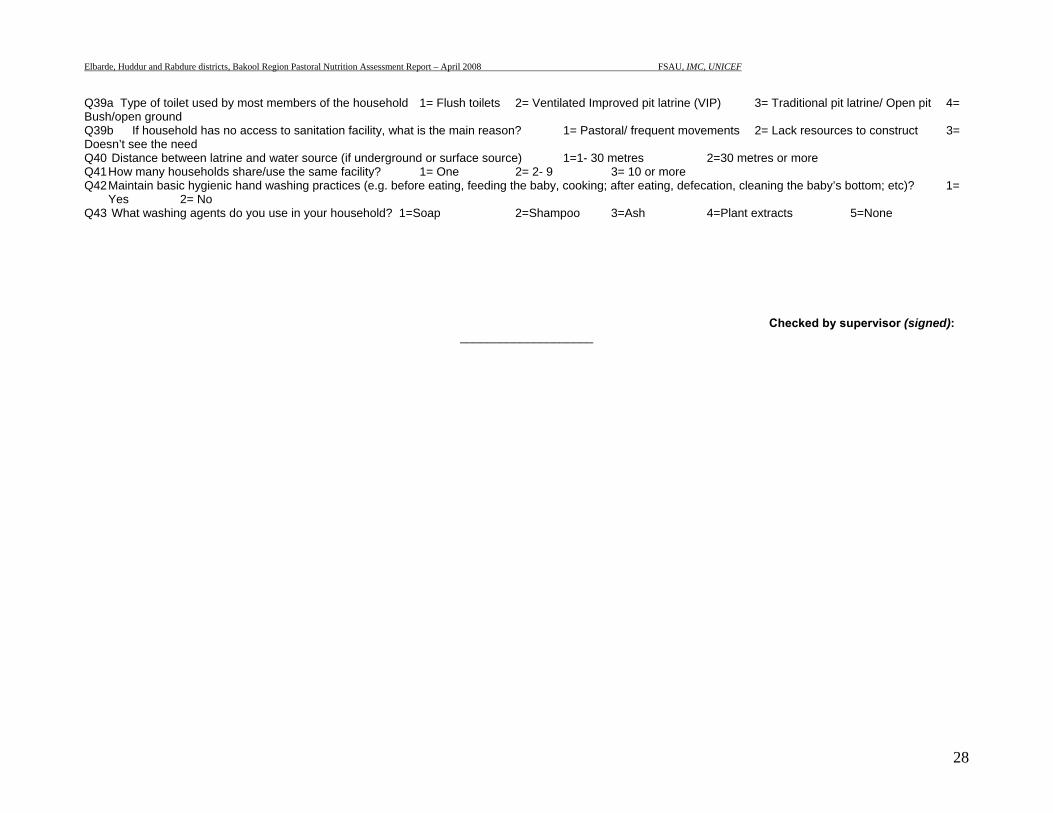
Elbarde, Huddur and Rabdure districts, Bakool Region Pastoral Nutrition Assessment Report – April 2008 FSAU, IMC, UNICEF
28
Q39a Type of toilet used by most members of the household 1= Flush toilets 2= Ventilated Improved pit latrine (VIP) 3= Traditional pit latrine/ Open pit 4= Bush/open ground Q39b If household has no access to sanitation facility, what is the main reason? 1= Pastoral/ frequent movements 2= Lack resources to construct 3= Doesn’t see the need Q40 Distance between latrine and water source (if underground or surface source) 1=1- 30 metres 2=30 metres or more Q41 How many households share/use the same facility? 1= One 2= 2- 9 3= 10 or more Q42 Maintain basic hygienic hand washing practices (e.g. before eating, feeding the baby, cooking; after eating, defecation, cleaning the baby’s bottom; etc)? 1=
Yes 2= No Q43 What washing agents do you use in your household? 1=Soap 2=Shampoo 3=Ash 4=Plant extracts 5=None
Checked by supervisor (signed):
____________________
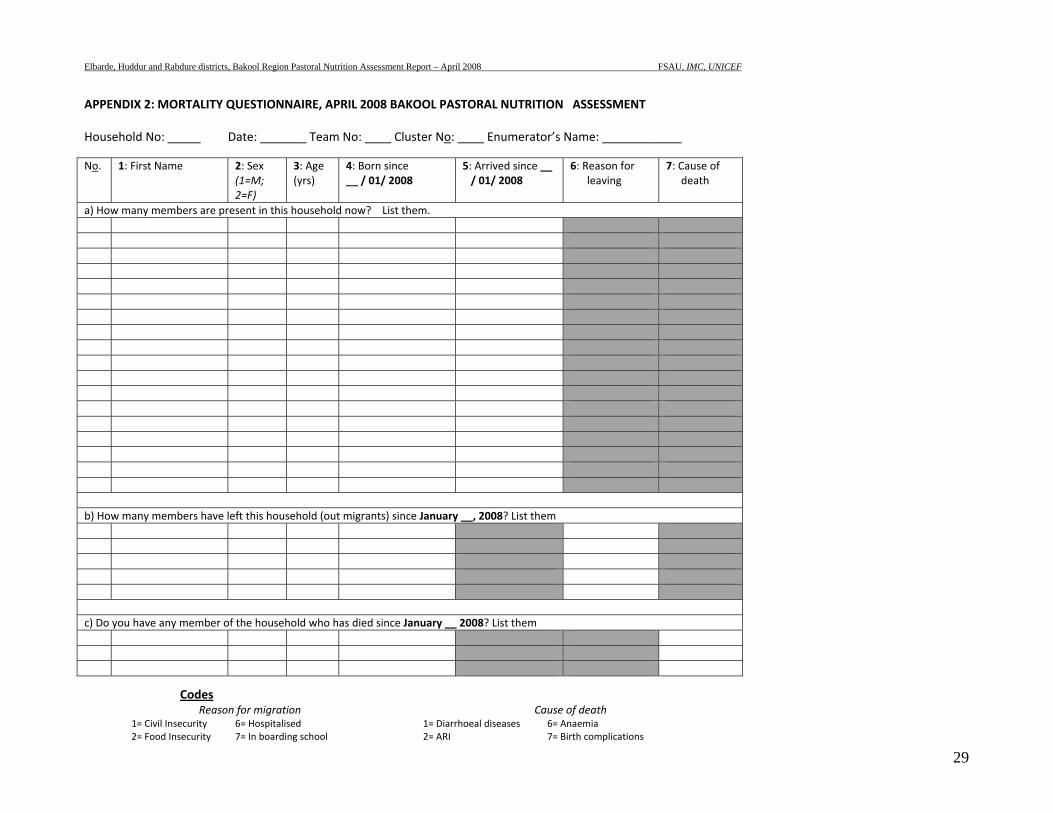
Elbarde, Huddur and Rabdure districts, Bakool Region Pastoral Nutrition Assessment Report – April 2008 FSAU, IMC, UNICEF
29
APPENDIX 2: MORTALITY QUESTIONNAIRE, APRIL 2008 BAKOOL PASTORAL NUTRITION ASSESSMENT Household No: _____ Date: _______ Team No: ____ Cluster No: ____ Enumerator’s Name: ____________ No. 1: First Name 2: Sex
(1=M; 2=F)
3: Age (yrs)
4: Born since __ / 01/ 2008
5: Arrived since __ / 01/ 2008
6: Reason for leaving
7: Cause of death
a) How many members are present in this household now? List them. b) How many members have left this household (out migrants) since January __, 2008? List them c) Do you have any member of the household who has died since January __ 2008? List them
Codes Reason for migration Cause of death
1= Civil Insecurity 6= Hospitalised 2= Food Insecurity 7= In boarding school
1= Diarrhoeal diseases2= ARI
6= Anaemia7= Birth complications
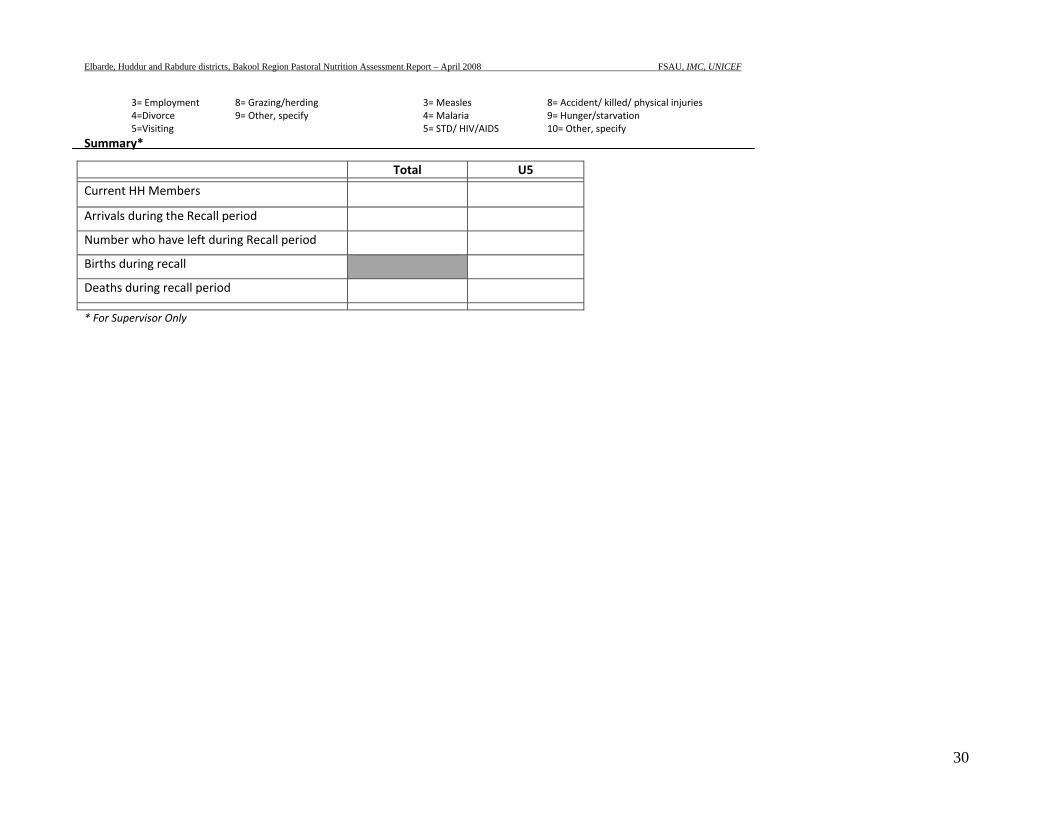
Elbarde, Huddur and Rabdure districts, Bakool Region Pastoral Nutrition Assessment Report – April 2008 FSAU, IMC, UNICEF
30
3= Employment 8= Grazing/herding 4=Divorce 9= Other, specify 5=Visiting
3= Measles4= Malaria 5= STD/ HIV/AIDS
8= Accident/ killed/ physical injuries9= Hunger/starvation 10= Other, specify
Summary*
Total U5
Current HH Members
Arrivals during the Recall period
Number who have left during Recall period
Births during recall
Deaths during recall period
* For Supervisor Only
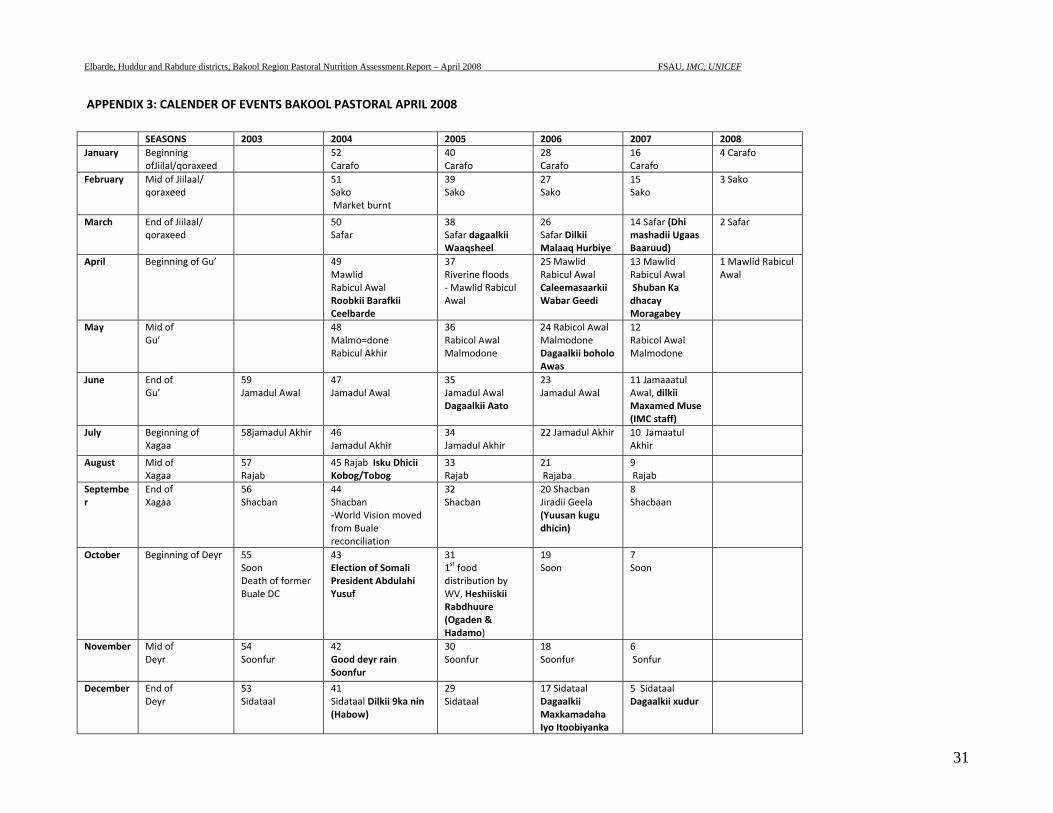
Elbarde, Huddur and Rabdure districts, Bakool Region Pastoral Nutrition Assessment Report – April 2008 FSAU, IMC, UNICEF
31
APPENDIX 3: CALENDER OF EVENTS BAKOOL PASTORAL APRIL 2008
SEASONS 2003 2004 2005 2006 2007 2008January Beginning
ofJiilal/qoraxeed 52
Carafo 40Carafo
28Carafo
16 Carafo
4 Carafo
February Mid of Jiilaal/ qoraxeed
51Sako Market burnt
39Sako
27Sako
15 Sako
3 Sako
March End of Jiilaal/ qoraxeed
50Safar
38Safar dagaalkii Waaqsheel
26Safar Dilkii Malaaq Hurbiye
14 Safar (Dhi mashadii Ugaas Baaruud)
2 Safar
April Beginning of Gu’ 49Mawlid Rabicul Awal Roobkii Barafkii Ceelbarde
37Riverine floods ‐ Mawlid Rabicul Awal
25 Mawlid Rabicul Awal Caleemasaarkii Wabar Geedi
13 Mawlid Rabicul Awal Shuban Ka dhacay Moragabey
1 Mawlid Rabicul Awal
May Mid of Gu’
48Malmo=done Rabicul Akhir
36Rabicol Awal Malmodone
24 Rabicol Awal Malmodone Dagaalkii boholo Awas
12 Rabicol Awal Malmodone
June End of Gu’
59 Jamadul Awal
47Jamadul Awal
35Jamadul Awal Dagaalkii Aato
23Jamadul Awal
11 Jamaaatul Awal, dilkii Maxamed Muse (IMC staff)
July Beginning of Xagaa
58jamadul Akhir
46Jamadul Akhir
34Jamadul Akhir
22 Jamadul Akhir 10 Jamaatul Akhir
August Mid of Xagaa
57 Rajab
45 Rajab Isku Dhicii Kobog/Tobog
33 Rajab
21 Rajaba
9 Rajab
September
End of Xagaa
56 Shacban
44Shacban ‐World Vision moved from Buale reconciliation
32Shacban
20 Shacban Jiradii Geela (Yuusan kugu dhicin)
8 Shacbaan
October Beginning of Deyr 55 Soon Death of former Buale DC
43Election of Somali President Abdulahi Yusuf
311st food distribution by WV, Heshiiskii Rabdhuure (Ogaden & Hadamo)
19Soon
7 Soon
November Mid of Deyr
54 Soonfur
42Good deyr rain Soonfur
30Soonfur
18Soonfur
6 Sonfur
December End of Deyr
53 Sidataal
41Sidataal Dilkii 9ka nin (Habow)
29Sidataal
17 Sidataal Dagaalkii Maxkamadaha Iyo Itoobiyanka
5 Sidataal Dagaalkii xudur
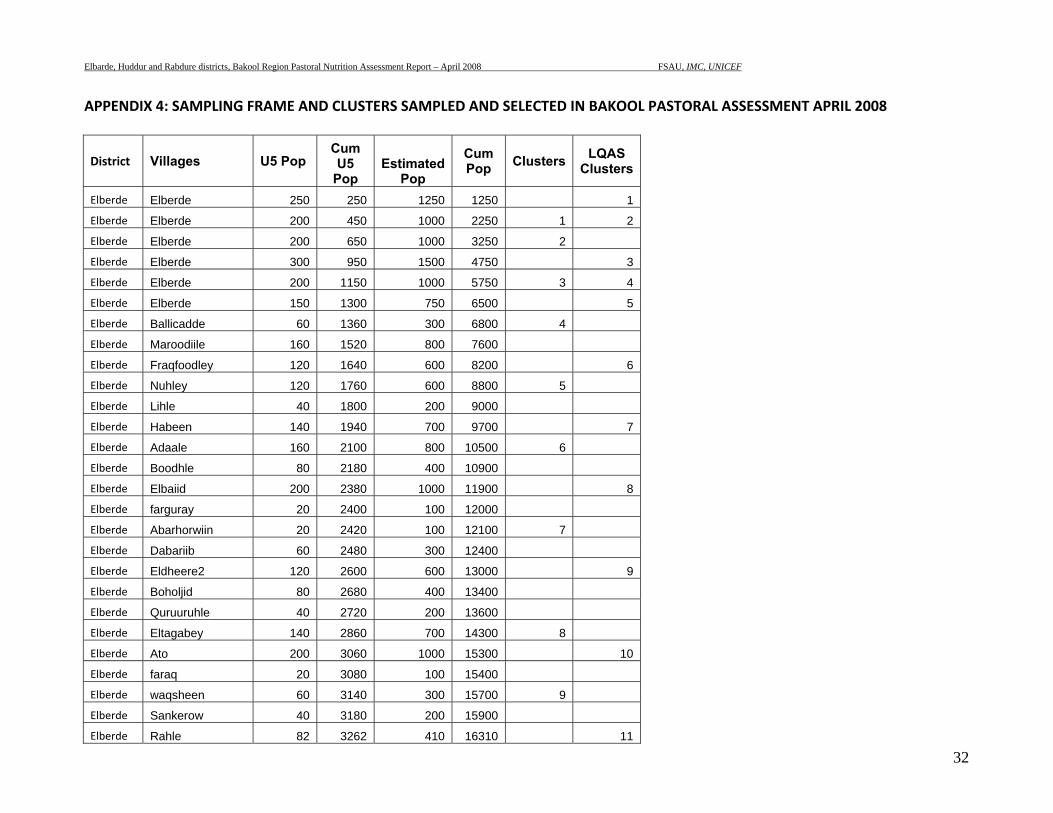
Elbarde, Huddur and Rabdure districts, Bakool Region Pastoral Nutrition Assessment Report – April 2008 FSAU, IMC, UNICEF
32
APPENDIX 4: SAMPLING FRAME AND CLUSTERS SAMPLED AND SELECTED IN BAKOOL PASTORAL ASSESSMENT APRIL 2008
District Villages U5 Pop Cum U5
Pop Estimated
Pop
Cum Pop Clusters LQAS
Clusters
Elberde Elberde 250 250 1250 1250 1
Elberde Elberde 200 450 1000 2250 1 2
Elberde Elberde 200 650 1000 3250 2
Elberde Elberde 300 950 1500 4750 3
Elberde Elberde 200 1150 1000 5750 3 4
Elberde Elberde 150 1300 750 6500 5
Elberde Ballicadde 60 1360 300 6800 4
Elberde Maroodiile 160 1520 800 7600
Elberde Fraqfoodley 120 1640 600 8200 6
Elberde Nuhley 120 1760 600 8800 5
Elberde Lihle 40 1800 200 9000
Elberde Habeen 140 1940 700 9700 7
Elberde Adaale 160 2100 800 10500 6
Elberde Boodhle 80 2180 400 10900
Elberde Elbaiid 200 2380 1000 11900 8
Elberde farguray 20 2400 100 12000
Elberde Abarhorwiin 20 2420 100 12100 7
Elberde Dabariib 60 2480 300 12400
Elberde Eldheere2 120 2600 600 13000 9
Elberde Boholjid 80 2680 400 13400
Elberde Quruuruhle 40 2720 200 13600
Elberde Eltagabey 140 2860 700 14300 8
Elberde Ato 200 3060 1000 15300 10
Elberde faraq 20 3080 100 15400
Elberde waqsheen 60 3140 300 15700 9
Elberde Sankerow 40 3180 200 15900
Elberde Rahle 82 3262 410 16310 11
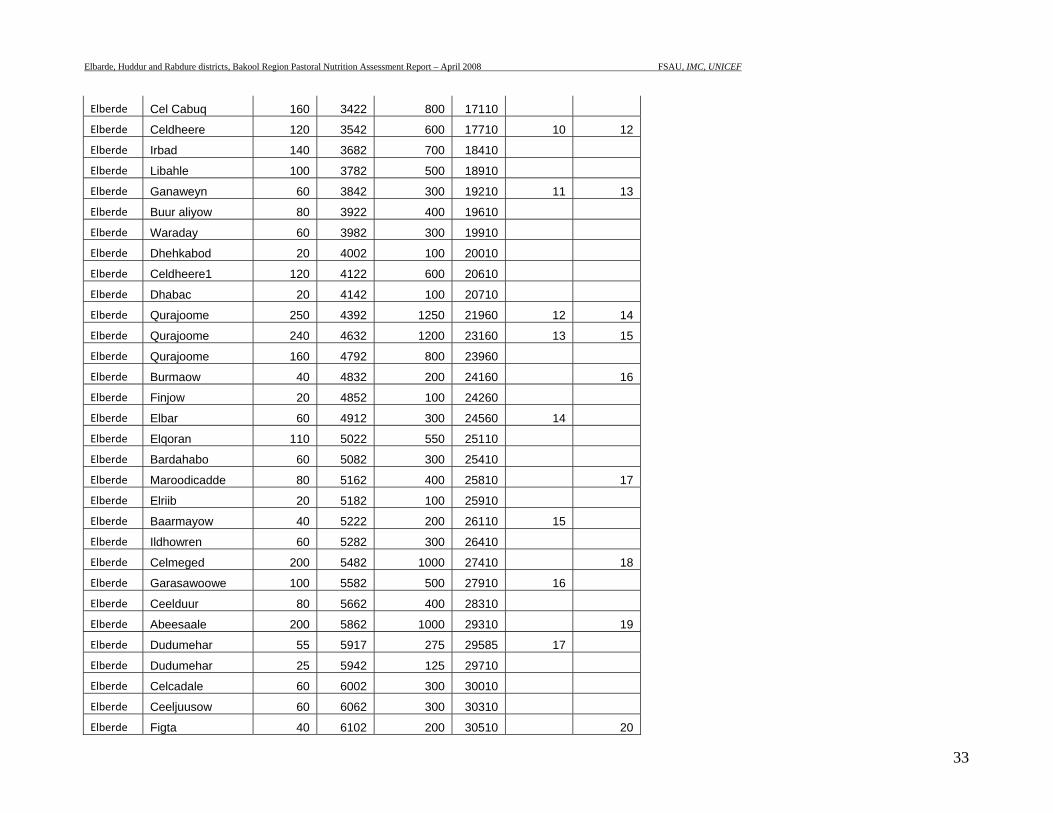
Elbarde, Huddur and Rabdure districts, Bakool Region Pastoral Nutrition Assessment Report – April 2008 FSAU, IMC, UNICEF
33
Elberde Cel Cabuq 160 3422 800 17110
Elberde Celdheere 120 3542 600 17710 10 12
Elberde Irbad 140 3682 700 18410
Elberde Libahle 100 3782 500 18910
Elberde Ganaweyn 60 3842 300 19210 11 13
Elberde Buur aliyow 80 3922 400 19610
Elberde Waraday 60 3982 300 19910
Elberde Dhehkabod 20 4002 100 20010
Elberde Celdheere1 120 4122 600 20610
Elberde Dhabac 20 4142 100 20710
Elberde Qurajoome 250 4392 1250 21960 12 14
Elberde Qurajoome 240 4632 1200 23160 13 15
Elberde Qurajoome 160 4792 800 23960
Elberde Burmaow 40 4832 200 24160 16
Elberde Finjow 20 4852 100 24260
Elberde Elbar 60 4912 300 24560 14
Elberde Elqoran 110 5022 550 25110
Elberde Bardahabo 60 5082 300 25410
Elberde Maroodicadde 80 5162 400 25810 17
Elberde Elriib 20 5182 100 25910
Elberde Baarmayow 40 5222 200 26110 15
Elberde Ildhowren 60 5282 300 26410
Elberde Celmeged 200 5482 1000 27410 18
Elberde Garasawoowe 100 5582 500 27910 16
Elberde Ceelduur 80 5662 400 28310
Elberde Abeesaale 200 5862 1000 29310 19
Elberde Dudumehar 55 5917 275 29585 17
Elberde Dudumehar 25 5942 125 29710
Elberde Celcadale 60 6002 300 30010
Elberde Ceeljuusow 60 6062 300 30310
Elberde Figta 40 6102 200 30510 20
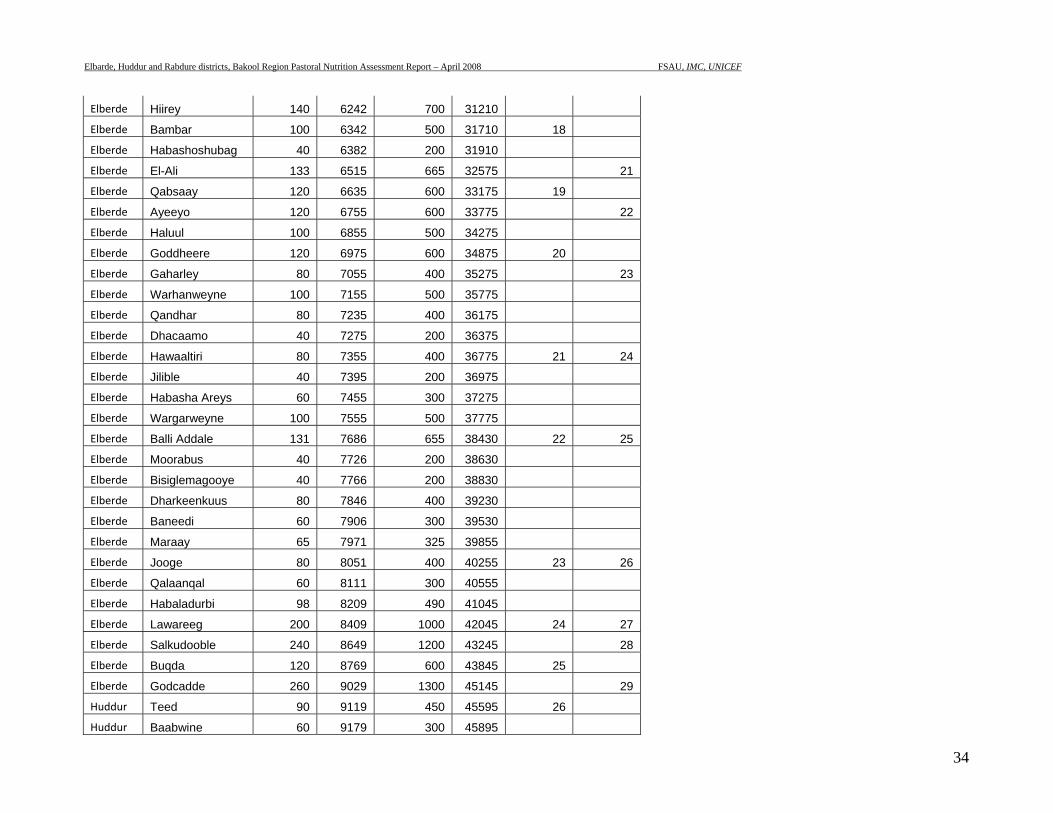
Elbarde, Huddur and Rabdure districts, Bakool Region Pastoral Nutrition Assessment Report – April 2008 FSAU, IMC, UNICEF
34
Elberde Hiirey 140 6242 700 31210
Elberde Bambar 100 6342 500 31710 18
Elberde Habashoshubag 40 6382 200 31910
Elberde El-Ali 133 6515 665 32575 21
Elberde Qabsaay 120 6635 600 33175 19
Elberde Ayeeyo 120 6755 600 33775 22
Elberde Haluul 100 6855 500 34275
Elberde Goddheere 120 6975 600 34875 20
Elberde Gaharley 80 7055 400 35275 23
Elberde Warhanweyne 100 7155 500 35775
Elberde Qandhar 80 7235 400 36175
Elberde Dhacaamo 40 7275 200 36375
Elberde Hawaaltiri 80 7355 400 36775 21 24
Elberde Jilible 40 7395 200 36975
Elberde Habasha Areys 60 7455 300 37275
Elberde Wargarweyne 100 7555 500 37775
Elberde Balli Addale 131 7686 655 38430 22 25
Elberde Moorabus 40 7726 200 38630
Elberde Bisiglemagooye 40 7766 200 38830
Elberde Dharkeenkuus 80 7846 400 39230
Elberde Baneedi 60 7906 300 39530
Elberde Maraay 65 7971 325 39855
Elberde Jooge 80 8051 400 40255 23 26
Elberde Qalaanqal 60 8111 300 40555
Elberde Habaladurbi 98 8209 490 41045
Elberde Lawareeg 200 8409 1000 42045 24 27
Elberde Salkudooble 240 8649 1200 43245 28
Elberde Buqda 120 8769 600 43845 25
Elberde Godcadde 260 9029 1300 45145 29
Huddur Teed 90 9119 450 45595 26
Huddur Baabwine 60 9179 300 45895
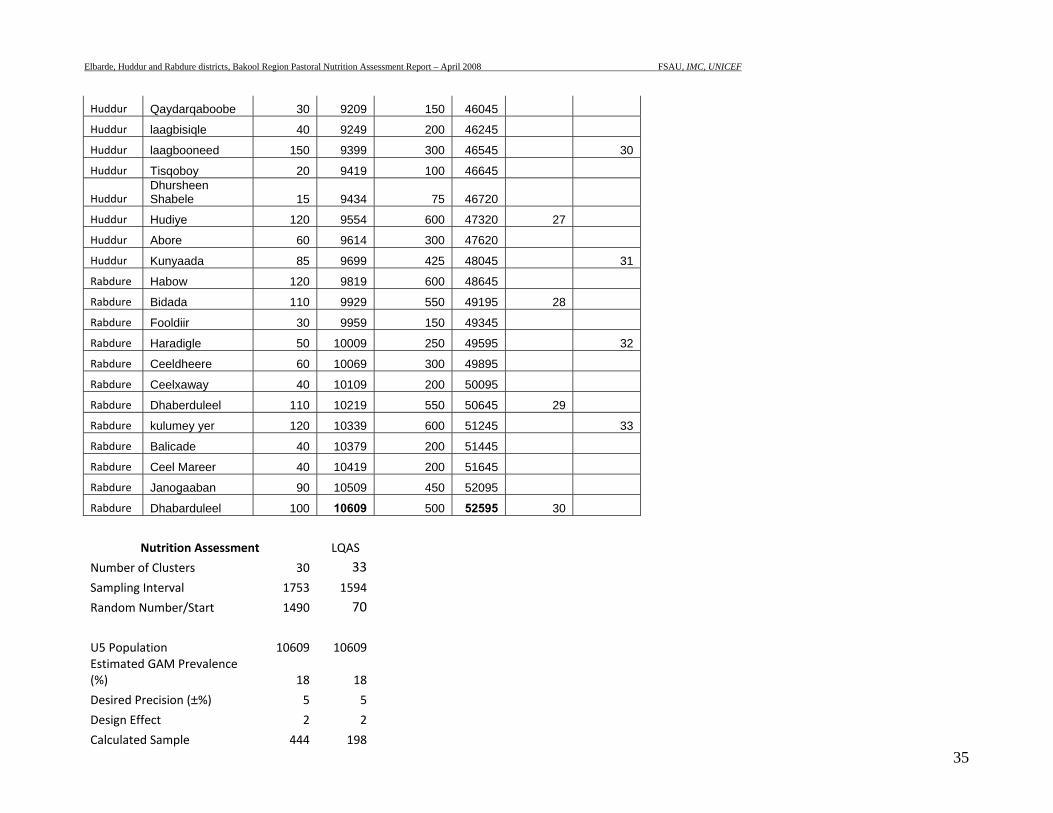
Elbarde, Huddur and Rabdure districts, Bakool Region Pastoral Nutrition Assessment Report – April 2008 FSAU, IMC, UNICEF
35
Huddur Qaydarqaboobe 30 9209 150 46045
Huddur laagbisiqle 40 9249 200 46245
Huddur laagbooneed 150 9399 300 46545 30
Huddur Tisqoboy 20 9419 100 46645
Huddur Dhursheen Shabele 15 9434 75 46720
Huddur Hudiye 120 9554 600 47320 27
Huddur Abore 60 9614 300 47620
Huddur Kunyaada 85 9699 425 48045 31
Rabdure Habow 120 9819 600 48645
Rabdure Bidada 110 9929 550 49195 28
Rabdure Fooldiir 30 9959 150 49345
Rabdure Haradigle 50 10009 250 49595 32
Rabdure Ceeldheere 60 10069 300 49895
Rabdure Ceelxaway 40 10109 200 50095
Rabdure Dhaberduleel 110 10219 550 50645 29
Rabdure kulumey yer 120 10339 600 51245 33
Rabdure Balicade 40 10379 200 51445
Rabdure Ceel Mareer 40 10419 200 51645
Rabdure Janogaaban 90 10509 450 52095
Rabdure Dhabarduleel 100 10609 500 52595 30
Nutrition Assessment LQAS
Number of Clusters 30 33Sampling Interval 1753 1594
Random Number/Start 1490 70
U5 Population 10609 10609 Estimated GAM Prevalence (%) 18 18
Desired Precision (±%) 5 5
Design Effect 2 2
Calculated Sample 444 198
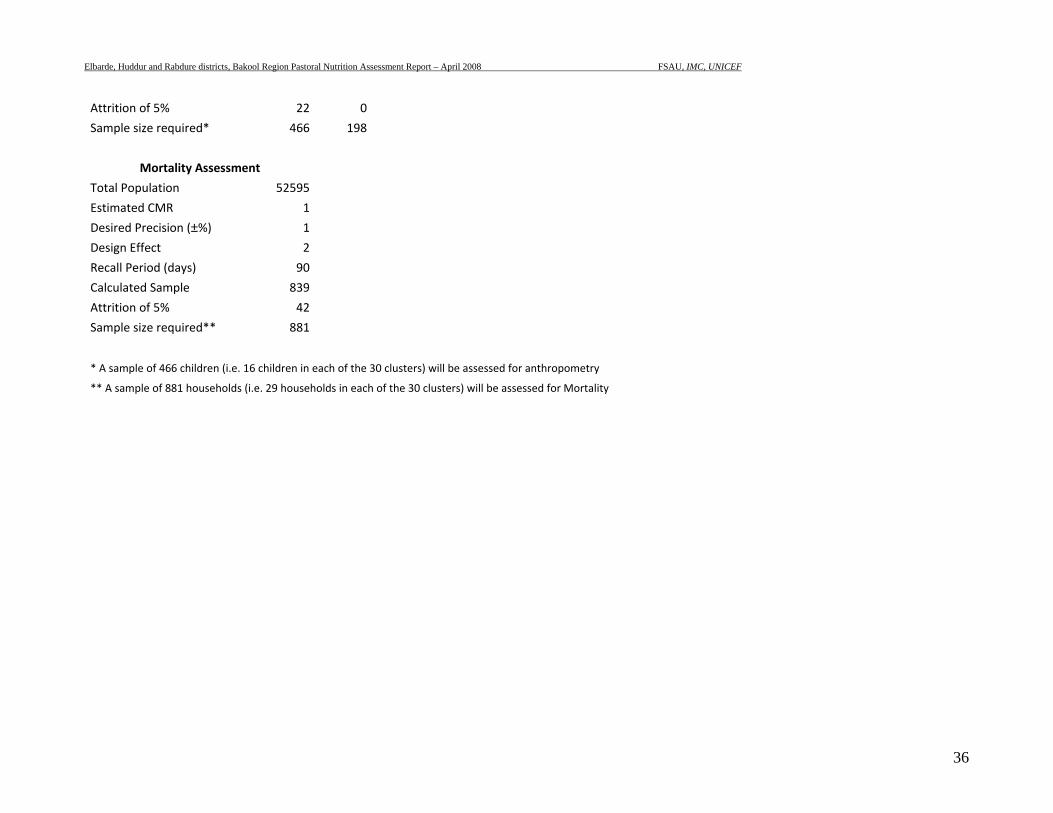
Elbarde, Huddur and Rabdure districts, Bakool Region Pastoral Nutrition Assessment Report – April 2008 FSAU, IMC, UNICEF
36
Attrition of 5% 22 0
Sample size required* 466 198
Mortality Assessment
Total Population 52595
Estimated CMR 1
Desired Precision (±%) 1
Design Effect 2
Recall Period (days) 90
Calculated Sample 839
Attrition of 5% 42
Sample size required** 881
* A sample of 466 children (i.e. 16 children in each of the 30 clusters) will be assessed for anthropometry
** A sample of 881 households (i.e. 29 households in each of the 30 clusters) will be assessed for Mortality
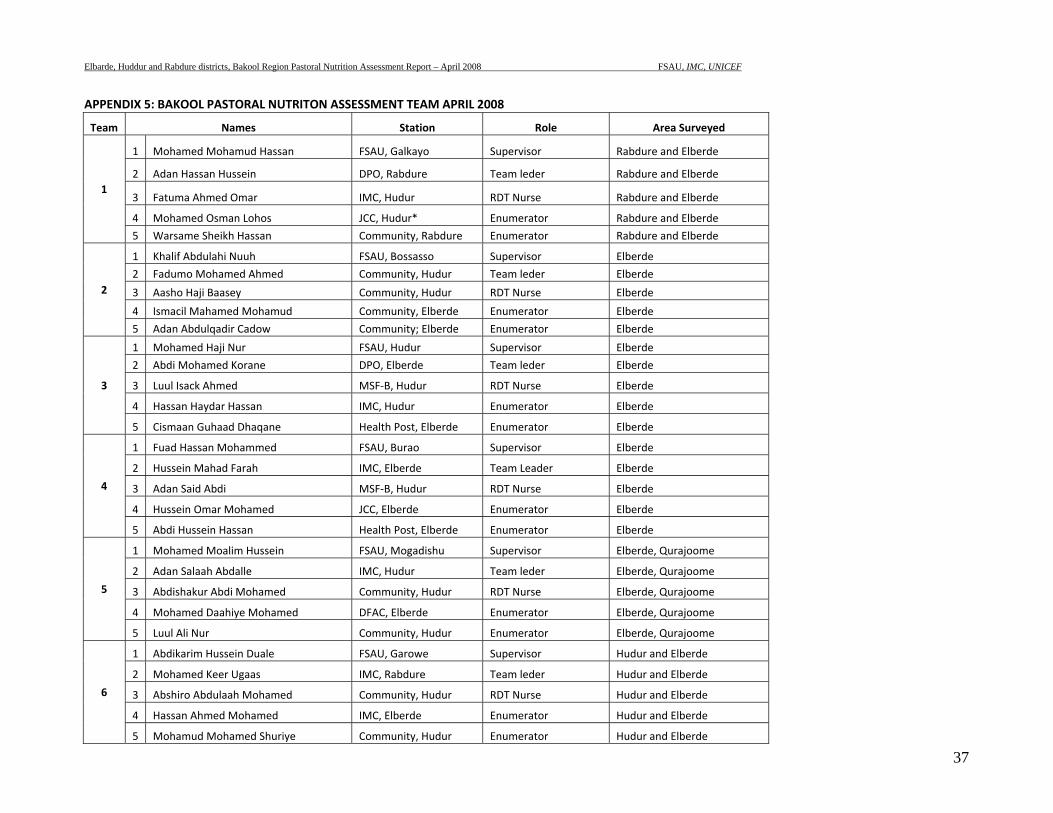
Elbarde, Huddur and Rabdure districts, Bakool Region Pastoral Nutrition Assessment Report – April 2008 FSAU, IMC, UNICEF
37
APPENDIX 5: BAKOOL PASTORAL NUTRITON ASSESSMENT TEAM APRIL 2008
Team Names Station Role Area Surveyed
1
1 Mohamed Mohamud Hassan FSAU, Galkayo Supervisor Rabdure and Elberde
2 Adan Hassan Hussein DPO, Rabdure Team leder Rabdure and Elberde
3 Fatuma Ahmed Omar IMC, Hudur RDT Nurse Rabdure and Elberde
4 Mohamed Osman Lohos JCC, Hudur* Enumerator Rabdure and Elberde
5 Warsame Sheikh Hassan Community, Rabdure Enumerator Rabdure and Elberde
2
1 Khalif Abdulahi Nuuh FSAU, Bossasso Supervisor Elberde
2 Fadumo Mohamed Ahmed Community, Hudur Team leder Elberde
3 Aasho Haji Baasey Community, Hudur RDT Nurse Elberde
4 Ismacil Mahamed Mohamud Community, Elberde Enumerator Elberde
5 Adan Abdulqadir Cadow Community; Elberde Enumerator Elberde
3
1 Mohamed Haji Nur FSAU, Hudur Supervisor Elberde
2 Abdi Mohamed Korane DPO, Elberde Team leder Elberde
3 Luul Isack Ahmed MSF‐B, Hudur RDT Nurse Elberde
4 Hassan Haydar Hassan IMC, Hudur Enumerator Elberde
5 Cismaan Guhaad Dhaqane Health Post, Elberde Enumerator Elberde
4
1 Fuad Hassan Mohammed FSAU, Burao Supervisor Elberde
2 Hussein Mahad Farah IMC, Elberde Team Leader Elberde
3 Adan Said Abdi MSF‐B, Hudur RDT Nurse Elberde
4 Hussein Omar Mohamed JCC, Elberde Enumerator Elberde
5 Abdi Hussein Hassan Health Post, Elberde Enumerator Elberde
5
1 Mohamed Moalim Hussein FSAU, Mogadishu Supervisor Elberde, Qurajoome
2 Adan Salaah Abdalle IMC, Hudur Team leder Elberde, Qurajoome
3 Abdishakur Abdi Mohamed Community, Hudur RDT Nurse Elberde, Qurajoome
4 Mohamed Daahiye Mohamed DFAC, Elberde Enumerator Elberde, Qurajoome
5 Luul Ali Nur Community, Hudur Enumerator Elberde, Qurajoome
6
1 Abdikarim Hussein Duale FSAU, Garowe Supervisor Hudur and Elberde
2 Mohamed Keer Ugaas IMC, Rabdure Team leder Hudur and Elberde
3 Abshiro Abdulaah Mohamed Community, Hudur RDT Nurse Hudur and Elberde
4 Hassan Ahmed Mohamed IMC, Elberde Enumerator Hudur and Elberde
5 Mohamud Mohamed Shuriye Community, Hudur Enumerator Hudur and Elberde
Elbarde, Huddur and Rabdure districts, Bakool Region Pastoral Nutrition Assessment Report – April 2008 FSAU, IMC, UNICEF
38
Ruqiyo Abdi Mohamed Community, Hudur Team leder Elberde
Mohamed Moalim Idow Community, Hudur Enumerator Elberde
Ali Abdi Aden Community, Elberde Enumerator Elberde
Abdulkadir Haji Nur Community, Hudur Team leder Hudur, Elbarde and Rabdure
Abdulkadir Mohamed Bulle MSF‐B, Hudur Enumerator Hudur, Elbarde and Rabdure
Fadumo Hassan Mohamed CPHR, Hudur Enumerator Hudur, Elbarde and Rabdure
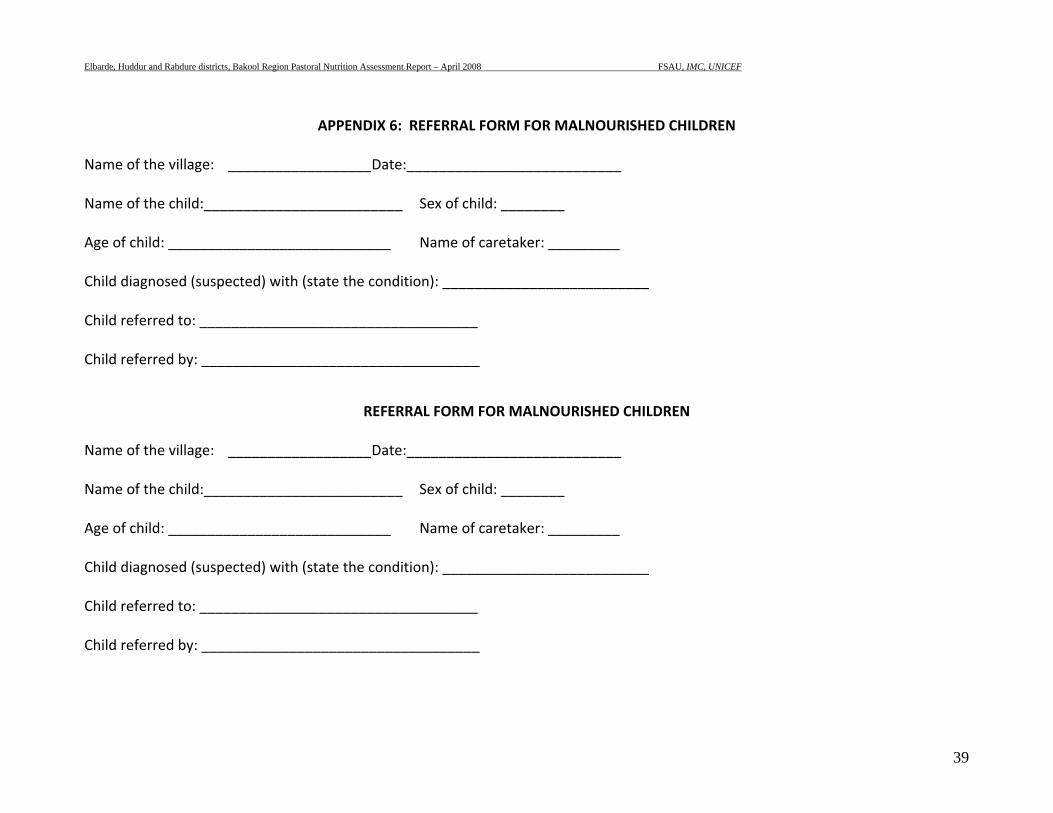
Elbarde, Huddur and Rabdure districts, Bakool Region Pastoral Nutrition Assessment Report – April 2008 FSAU, IMC, UNICEF
39
APPENDIX 6: REFERRAL FORM FOR MALNOURISHED CHILDREN
Name of the village: __________________ Date:___________________________ Name of the child:_________________________ Sex of child: ________ Age of child: ____________________________ Name of caretaker: _________ Child diagnosed (suspected) with (state the condition): __________________________ Child referred to: ___________________________________ Child referred by: ___________________________________
REFERRAL FORM FOR MALNOURISHED CHILDREN Name of the village: __________________ Date:___________________________ Name of the child:_________________________ Sex of child: ________ Age of child: ____________________________ Name of caretaker: _________ Child diagnosed (suspected) with (state the condition): __________________________ Child referred to: ___________________________________ Child referred by: ___________________________________
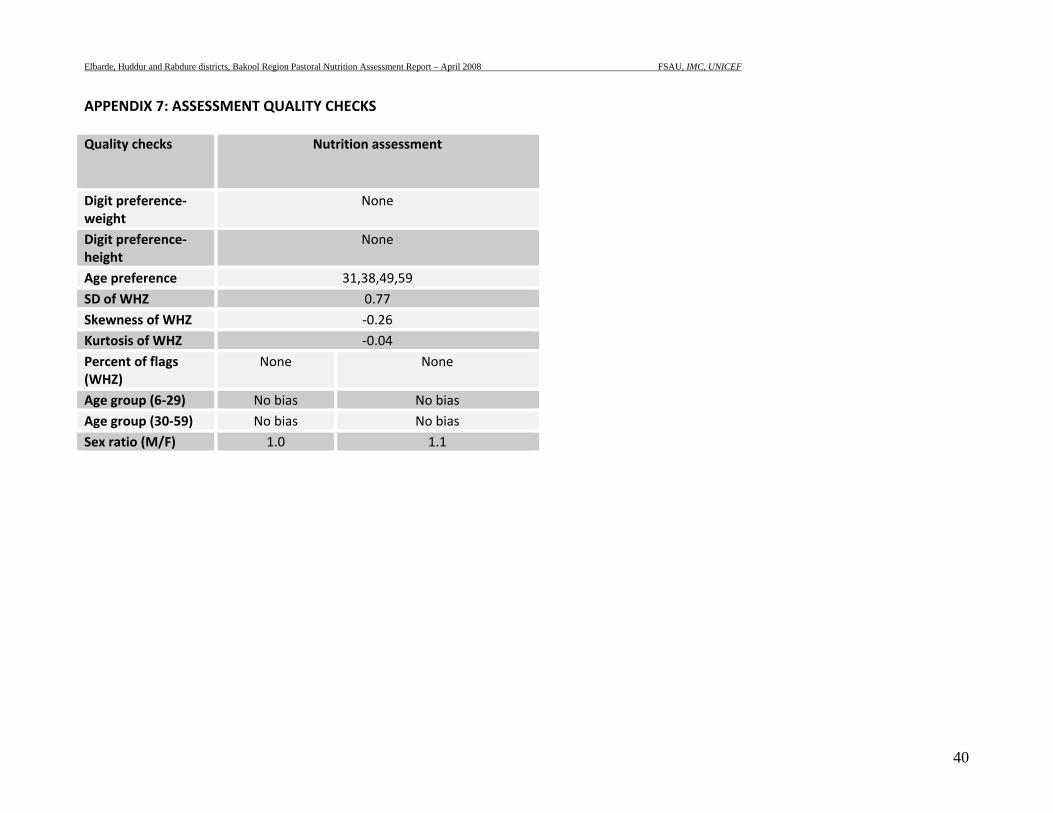
Elbarde, Huddur and Rabdure districts, Bakool Region Pastoral Nutrition Assessment Report – April 2008 FSAU, IMC, UNICEF
40
APPENDIX 7: ASSESSMENT QUALITY CHECKS Quality checks
Nutrition assessment
Digit preference‐weight
None
Digit preference‐height
None
Age preference 31,38,49,59 SD of WHZ 0.77 Skewness of WHZ ‐0.26 Kurtosis of WHZ ‐0.04 Percent of flags (WHZ)
None None
Age group (6‐29) No bias No bias Age group (30‐59) No bias No bias Sex ratio (M/F) 1.0 1.1
Elbarde, Huddur and Rabdure districts, Bakool Region Pastoral Nutrition Assessment Report – April 2008 FSAU, IMC, UNICEF
41
7 REFERENCES
FSAU Monthly Nutrition Update, January 2008 FSAU Monthly Nutrition Update, February to March 2008 FSAU 2007/08 Post Deyr Analysis, January 2008 FSAU 2006/07 Post Gu Analysis, September 2007 FSAU, November 2003: Nutrition Training Manual: A guide to data collection, analysis, interpretation and use. SACB: Nutrition assessment guidelines for Somalia. SC, UK (2004). Emergency Nutrition Assessment. Guidelines for field workers Standardized Monitoring and Assessment of Relief and Transition (SMART). Standardizing. Assessment methodology. Technical Series. July 23 – 26, 2002. Washington, DC. Sphere Guidelines, 2004. Humanitarian Charter and Minimum standards in Disaster Response. Sphere Project WHO, 1995: Guide on rapid nutritional assessment in emergencies WHO, Anthro 2005. Growth reference curves. FSAU Monthly Food Security Report, April 2008