Food Production - Agricultural and Animal Source Food Production

Food Science of Animal Resources Food Sci. Anim. Resour. 2020 September 40(5):689~698 pISSN : 2636-0772 eISSN : 2636-0780
DOI https://doi.org/10.5851/kosfa.2020.e44 http://www.kosfaj.org
© Korean Society for Food Science of Animal Resources. This is an open access article distributed under the terms of the Creative Commons Attribution Non-Commercial License
(http://creativecommons.org/licences/by-nc/3.0) which permits unrestricted non-commercial use, distribution, and reproduction in any medium, provided the original work is properly cited.
Received November 13, 2019
Revised June 9, 2020
Accepted June 15, 2020
*Corresponding author : Adnan Khaliq
Department of Food Science and Technology,
Khwaja Fareed University of Engineering and
Information Technology, Rahim Yar Khan
64200, Pakistan
Tel: +92-3008771970
Fax: +92 68 5882 476
E-mail: [email protected]
*ORCID
Iqra Yasmin
https://orcid.org/0000-0002-6687-6983
Rabia Iqbal
https://orcid.org/0000-0003-4873-5105
Atif Liaqat
https://orcid.org/0000-0002-6371-2529
Wahab Ali Khan
https://orcid.org/0000-0002-5478-3544
Muhamad Nadeem
https://orcid.org/0000-0002-0198-4844
Aamir Iqbal
https://orcid.org/0000-0003-4473-2329
Muhammad Farhan Jahangir Chughtai
https://orcid.org/0000-0003-1527-0794
Syed Junaid Ur Rehman
https://orcid.org/0000-0002-9922-1318
Saima Tehseen
https://orcid.org/0000-0003-0004-2051
Tariq Mehmood
https://orcid.org/0000-0002-5329-0764
Samreen Ahsan
https://orcid.org/0000-0003-2303-0205
Saira Tanweer
https://orcid.org/0000-0002-0423-0554
Saima Naz
https://orcid.org/0000-0001-5107-9634
Adnan Khaliq
https://orcid.org/0000-0003-4572-8129
Characterization and Comparative Evaluation of
Milk Protein Variants from Pakistani Dairy Breeds
Iqra Yasmin1,2, Rabia Iqbal1, Atif Liaqat3, Wahab Ali Khan4, Muhamad Nadeem5, Aamir Iqbal6, Muhammad Farhan Jahangir Chughtai3, Syed Junaid Ur Rehman3, Saima Tehseen1, Tariq Mehmood3, Samreen Ahsan3, Saira Tanweer7, Saima Naz8, and Adnan Khaliq3,*
1Department of Food Science and Technology, Government College Women University, Faisalabad 38040, Pakistan
2Center of Excellence for Olive Research and Training, Barani Agricultural Research Institute, Chkwal 4800, Pakistan
3Department of Food Science and Technology, Khwaja Fareed University of Engineering and Information Technology, Rahim Yar Khan 64200, Pakistan
4Department of Food Science, Lyallpur Institute of Advanced studies, Faisalabad,38000, Pakistan
5Department of Environmental Sciences, COMSATS University Islamabad, Vehari Campus 61100, Pakistan
6College of Food Science and Technology, Huazhong Agricultural University, Wuhan, China
7University College of Agriculture and Environmental Sciences, Islamia University, Bahawalpur 63100, Pakistan
8Department of Clinical Nutrition, Nur International University, Lahore 54000, Pakistan
Abstract The aim of study was to scrutinize the physicochemical and protein profile of
milk obtained from local Pakistani breeds of milch animals such as Nilli-Ravi buffalo,
Sahiwal cow, Kajli sheep, Beetal goat and Brela camel. Physicochemical analysis
unveiled maximum number of total solids and protein found in sheep and minimum in
camel. Buffalo milk contains the highest level of fat (7.45%) while camel milk contains
minimum (1.94%). Ash was found maximum in buffalo (0.81%) and sheep (0.80%) while
minimum in cow’s milk (0.71%). Casein and whey proteins were separated by subjecting
milk to isoelectric pH and then analyzed through sodium dodecyl sulphate-polyacrylamide
gel electrophoresis (SDS-PAGE). The results showed heterogeneity among these species.
Different fractions including αS1, αS2, κ-casein, β-casein and β-lactoglobulen (β-Lg) were
identified and quantitatively compared in all milk samples. Additionally, this electrophoretic
method after examining the number and strength of different protein bands (αS1, αS2, β-
CN, α-LAC, BSA, and β-Lg, etc.), was helpful to understand the properties of milk for
different processing purposes and could be successfully applied in dairy industry. Results
revealed that camel milk was best suitable for producing allergen free milk protein
products. Furthermore, based on the variability of milk proteins, it is suggested to clarify
the phylogenetic relationships between different cattle breeds and to gather the necessary
data to preserve the genetic fund and biodiversity of the local breeds. Thus, the study of
milk protein from different breed and species has a wide range of scope in producing
diverse protein based dairy products like cheese.
Keywords Nilli-Ravi, Sahiwal, Kajli, Beetal, Brela
ARTICLE

Food Science of Animal Resources Vol. 40, No. 5, 2020
690
Introduction
Milk is a physiologically and biologically complex fluid that contains water, proteins, lactose, fat, vitamins and minerals as
its principal constituents (Urgu et al., 2019). Concentration of lactose, proteins, lipids and mineral salts in milk is 5%, 3.2%,
4%, and 0.7%, respectively. Milk is a biotic fluid that has been evolved with mammals to feed their newborns and provide
nutrients important for growth and development (Playne et al., 2003). Milk proteins (i.e. lactoferrin and lactoperoxidase) are
best known to have antimicrobial and immunomodulatory effect (Chen et al., 2019).
Milk composition vary from specie to specie e.g., buffalo milk contains 58% and 40% more calcium and protein while
43% less cholesterol as compared to cow milk (Ahmed et al., 2016). Besides, cow milk is considered as a good source of
essential amino acids that are very close to the amino acid requirement of human body (Pond, 2004). Goat milk has more
digestibility as compared to other bovine milk. Additionally, goat milk protein exhibits antimicrobial activity that plays an
active role in bio-preservation against pathogens (Park et al., 2007). Whereas camel milk has similar composition to cow milk
with few distinctions such as lower in lactose and higher in minerals, e.g., iron, potassium, magnesium, sodium, zinc and
copper. Sheep milk is considered more supportive to human digestive system (Raynal-Ljutovac et al., 2008).
Milk protein provide nutrition to newborn during postnatal period (Dziuba and Dziuba, 2014). Major milk proteins are
casein and whey. Casein is present in the form of micelles and accounts for 80% of the milk proteins comprised of αS1-casein
(αS1-CN), αS2-casein (αS2-CN), β-casein and κ-casein in amount of 40%, 10%, 40%, and 10%, respectively (Holland et al.,
2006; Qian et al., 2017). Whey proteins are about 20% milk proteins having four major components including β-lactoglobulin
(50%), α-lactalbumin (20%), bovine serum albumin (10%) and immunoglobulin (Yasmin et al., 2019). Proteins such as
lactoferrin, proteose peptone, calmodulin, prolactin, and folate binding proteins are also found in milk and considered as
minor proteins (Jovanovic et al., 2007). Milk proteins have positive effects on various body structures such as immune,
nervous, digestive and the cardiovascular system (Kazemalilou and Alizadeh, 2017; Korhonen and Pihlanto, 2006).
Moreover, milk proteins are considered to be core of a wide variety of biologically active peptides with superior nutritive and
immunological activities (Khan et al., 2020). A number of bioactive peptides are utilized for the treatment of several diseases
such as diarrhea, hypertension, thrombosis, dental health diseases, mineral mal-absorption and disease related to immune
deficiency (Dziuba and Dziuba, 2014). Whey is a famous nutritional supplement that helps to regulate immune system,
increase muscle strength and prevent a number of bones and heart diseases (Park, 2007).
The objective of this study was to compare different milk proteins from different species through gel electrophoresis for
better understanding of milk characteristics that can be used further for different purpose.
Materials and Methods
Sample collection
Ten milk samples from each milch animal breed i.e. buffalo (Nili-Ravi), cow (Sahiwal), sheep (Kajli) and goat (Beetal)
were collected from Dairy farm, University of Agriculture, Faisalabad-Pakistan while camel (Brela) milk samples obtained
from local farms of Cholistan area, Pakistan. Milk sample (500 mL) was collected in sterilized glass bottles. Each sample was
labelled and stored below 4℃ until final analysis.
Physicochemical and compositional analysis of milk samples
Samples were analyzed for physicochemical (pH, acidity) and compositional analysis (protein, fat, SNF, total solids and

Milk Proteins Characterization and Comparison of Different Species in Pakistan
691
ash contents). The samples were analyzed for pH using pH meter (Hanna, HI-99161) and acidity through titration method
(AOAC, 2006). Protein, fat, SNF, total solids and ash contents were analyzed through standard methods of AOAC (2006).
The main fractions of protein such as crude protein (CP), true protein (TP), casein, non-casein-nitrogen (NCN), whey proteins
and non-protein-nitrogen (NPN) contents were determined according to standard protocol of International Dairy Federation
(IDF, 1993). TPs in the milk sample were determined by treating with 12% TCA. The nitrogen (%) was converted to NPN
and NCN contents by using the conversion factor 3.60 and 6.38, respectively (Karman and van Boekel, 1986).
Characterization of milk protein by SDS-PAGE
Casein and whey proteins were separated by following the method described by Basch et al. (1985) with slight
modifications. Briefly, milk sample after centrifugation at 5,000 rpm for 30 minutes at 5℃, casein and whey were separated
by adjusting isoelectric pH 4.6 with 1M HCl. Samples were freeze-dried and stored for further analysis. 1 mL of buffer was
added into 0.01 g of sample and vortexed until homogenous mixture obtained. Standard sample was prepared by obtaining
homogenous mixture of sodium-caseinate (0.01 g) and 1 mL buffer by using Vortex mixture.
SDS-PAGE analysis
The electrophoresis was carried out using a 13% gel concentration (Laemmli, 1970). Comb of 10-well with 0.75 mm size
was used in a Bio-Rad mini protein 3 system. The gel size of 7.3–8.3 cm was used. The samples (8 μL/lane) were loaded and
the gels were run constantly at 90 V for 3 h. After that gels were stained with 150 mL Coomassie Brilliant Blue (CBB) dye
and destained with 100 mL methanol, acetic acid water mixture destaining solution. Computerized densitometry (Bio-Rad)
was used to calculate bands’ molecular weight (MW).
Statistical analysis
The obtained data from all experiments were presented as means±SD. Statistical analysis was made by using Statistix 8.1
(Statistix, Florida, USA). Statistical significance of experimental data was performed by applying completely randomized
design (CRD) at 5% level of significance followed by Tukey’s HSD test to compare the significant differences among the
means (Montgomery and Sen, 2008).
Results and Discussion
Physicochemical and compositional analysis of milk samples
The results revealed that the pH of milk from different species such as cow, buffalo, sheep, goat and camel has not varied
significantly (Table 1). The present investigation with respect to pH of cow and buffalo milk was in agreement with the work
of Ahmad et al. (2008) who compared the overall composition of cow and buffalo milk.
Acidity and pH were inversely proportional to each other; with the production of acid pH decreases. Acidity can be
determined as the amount of lactic acid produced in dairy products. All milk samples showed variation in acidic contents
(Table 1). The results showed that buffalo and cow milk had higher acidity values i.e. 0.16% followed by sheep, goat and
camel with values 0.12%, 0.11%, and 0.11%, respectively. Similar results of pH were observed previously for different
species such as camel, buffalo and cow milk (Ozrenk and Inci, 2008).

Food Science of Animal Resources Vol. 40, No. 5, 2020
692
The results of compositional analysis (protein, fat, SNF, total solids and ash contents) varied significantly among different
species of milk (Table 1). The highest CP was observed in sheep milk (4.35%) followed by buffalo milk (4.17%), while cow
and camel milk have the lowest protein contents 3.56% and 3.38%, respectively. Previous studies showed similar values of
total proteins in buffalo, cow, sheep and camel milk, while goat milk was found to have higher amount of protein content
(Huma et al., 2018). The protein content of cow, goat, and sheep milk were 3.4%, 3.7%, and 5.5%, respectively (Moatsou and
Sakkas, 2019). The protein content has a major impact on the nutritional and technological value of milk. The variation
among different milk species was observed regarding major protein fractions like CP, TPs, caseins and whey proteins; and
the nitrogen components such as NCN and NPN contents. The higher content of caseins, CP, TP, and NPN were observed in
sheep milk while lowest were observed in camel milk. The difference in the protein content is due to genetic variation among
these animal species. Whey proteins content were highest in the sheep milk (0.74%) while the lowest content was found in
cow milk (0.53%). NCN content were higher in sheep milk (1.31%) and lower in camel (0.91%) and goat milk (0.90%).
However, the NPN content was the highest in sheep (0.57%) milk followed by buffalo milk (0.52%) as shown in Table 1.
The results of current study are in line with the findings of previous researchers (Huma et al., 2018; Ozrenk and Inci, 2008;
Strzałkowska et al., 2014). Sheep milk is rich in casein and whey proteins 4.2–5.2 g/100 g and 1.02–1.3 g/100 g respectively
(Barros et al., 2017; Selvaggi et al., 2015; Selvaggi et al., 2017) and protein content in camel milk was between 2.15%–4.90%
(Al Kanhal and AL haj, 2010). The current results of casein and whey proteins in camel milk are also similar with the findings
of other researchers (Babiker and El-Zubeir, 2014; El-Agamy et al., 2009; Khaskheli et al., 2005; Musaad et al., 2013).
The ash content in buffalo milk was highest (0.81%) followed by sheep and goat milk 0.80% and 0.77%, respectively.
Camel milk had 0.74% ash content while lowest ash content (0.71%) was found in cow milk. The similar values of ash
contents were observed in cow, goat, and sheep milk i.e. 0.7%, 0.8%, and 0.9%, respectively (Balthazar et al., 2018). A
significant variation of fat content was found among all the species. The buffalo and sheep have highest fat content 7.45%
and 7.27% followed by goat and cow milk 4.95% and 4.13%. The lowest fat content (1.94%) was observed in camel milk.
The fat content of cow, goat, and sheep milk were 3.3%, 3.8%, and 5.9%, respectively (Cavalcanti et al., 2019). The highest
total solids i.e. 18.17% was found in sheep milk followed by buffalo milk 17.51%. Whereas the total solid contents in goat
and cow were 13.86% and 13.02%, respectively. Camel milk had the lowest percentage of total solids (10.44%) among these
Table 1. Physicochemical and compositional analysis of milk from different species
Species pH Acidity
(%)
Ash
(%)
Fat
(%)
TS
(%)
SNF
(%)
Protein
(%)
CP
(%)
TP
(%)
Casein
(%)
WP
(%)
NCN
(%)
NPN
(%)
Buffalo 6.71
±0.11a
0.16
±0.10a
0.81
±0.01a
7.45
±0.42a
17.51
±1.92a
10.36
±1.7ab
4.17
±0.51a
4.10
±0.21a
3.61
±0.02b
2.91
±0.02b
0.72
±0.02a
1.21
±0.02b
0.52
±0.02ab
Camel 6.71
±0.12a
0.11
±0.12b
0.74
±0.1ab
1.94
±1.55c
10.44
±0.63c
8.56
±0.52bc
3.38
±0.05b
3.30
±0.03d
3.08
±0.03c
2.42
±0.03c
0.58
±0.01b
0.91
±0.02c
0.31
±0.02c
Cow 6.62
±0.10b
0.16
±0.01a
0.71
±0.10b
4.95
±1.90b
13.86
±1.81b
8.24
±0.73c
3.56
±0.05ab
3.51
±0.01c
3.10
±0.21c
2.54
±0.01c
0.53
±0.03b
1.03
±0.01c
0.42
±0.01b
Goat 6.68
±0.10a
0.11
±0.01b
0.77
±0.02ab
4.13
±1.81bc
13.02
±2.30bc
9.57
±0.95b
3.44
±0.06ab
3.42
±0.03d
3.07
±0.12c
2.53
±0.02c
0.54
±0.01b
0.90
±0.01c
0.31
±0.31c
Sheep 6.71
±0.14a
0.12
±0.02b
0.80
±0.02a
7.27
±0.51a
18.17
±3.78a
11.79
±1.70a
4.35
±0.78a
5.67
±0.02a
5.08
±0.01a
4.31
±0.03a
0.74
±0.02a
1.31
±0.02a
0.57
±0.21a
Data presented as the mean±SD.
Different letters represent significant difference among the means (p<0.05).
NF, solid-not-fat; TS, total solids; CP, crude protein; TP, true protein; WP, whey proteins; NCN, non-casein nitrogen; NPN, non-protein nitrogen.
Milk Proteins Characterization and Comparison of Different Species in Pakistan
693
species. Similar results were observed by Huque et al. (2018), who performed comparative study of cow and buffalo milk.
Mohsin et al. (2019) worked on the effect of seasonal variation on goat milk composition and found 13.97% total solid in
goat milk. The sheep and buffalo milk had highest SNF contents 11.79% and 10.36% respectively. The SNF values for cow
and goat milk were 8.24% and 9.57% respectively. SNF for camel milk was lowest 8.56% among all the species. The results
of SNF for cow and buffalo milk were in agreement with the findings of Ozrenk and Inci (2008). Although many different
factors affects the composition of milk such as calving, age, order, diet, feeding pattern, lactating stage, environmental
conditions yet the special difference due to genetics always have pronounced contribution.
Characterization of proteins through SDS-PAGE
Characterization of casein proteins
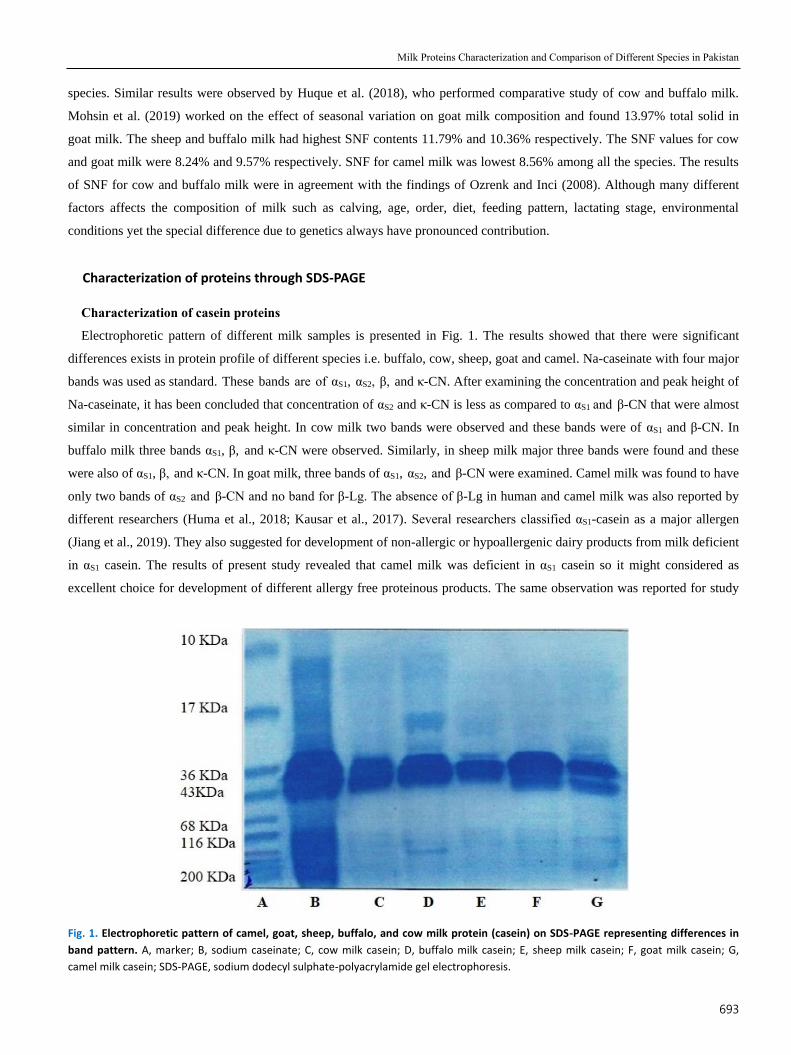
Electrophoretic pattern of different milk samples is presented in Fig. 1. The results showed that there were significant
differences exists in protein profile of different species i.e. buffalo, cow, sheep, goat and camel. Na-caseinate with four major
bands was used as standard. These bands are of αS1, αS2, β, and κ-CN. After examining the concentration and peak height of
Na-caseinate, it has been concluded that concentration of αS2 and κ-CN is less as compared to αS1 and β-CN that were almost
similar in concentration and peak height. In cow milk two bands were observed and these bands were of αS1 and β-CN. In
buffalo milk three bands αS1, β, and κ-CN were observed. Similarly, in sheep milk major three bands were found and these
were also of αS1, β, and κ-CN. In goat milk, three bands of αS1, αS2, and β-CN were examined. Camel milk was found to have
only two bands of αS2 and β-CN and no band for β-Lg. The absence of β-Lg in human and camel milk was also reported by
different researchers (Huma et al., 2018; Kausar et al., 2017). Several researchers classified αS1-casein as a major allergen
(Jiang et al., 2019). They also suggested for development of non-allergic or hypoallergenic dairy products from milk deficient
in αS1 casein. The results of present study revealed that camel milk was deficient in αS1 casein so it might considered as
excellent choice for development of different allergy free proteinous products. The same observation was reported for study
Fig. 1. Electrophoretic pattern of camel, goat, sheep, buffalo, and cow milk protein (casein) on SDS-PAGE representing differences in
band pattern. A, marker; B, sodium caseinate; C, cow milk casein; D, buffalo milk casein; E, sheep milk casein; F, goat milk casein; G,
camel milk casein; SDS-PAGE, sodium dodecyl sulphate-polyacrylamide gel electrophoresis.

Food Science of Animal Resources Vol. 40, No. 5, 2020
694
on milk of Nili-Ravi buffaloes (Kausar et al., 2017). It is also reported that genetic variations are responsible for significant
changes in milk protein (β-CN and κ-CN) of Danish Holstein-Friesian and Jersey cows (Jensen et al., 2012; Kausar et al.,
2017).
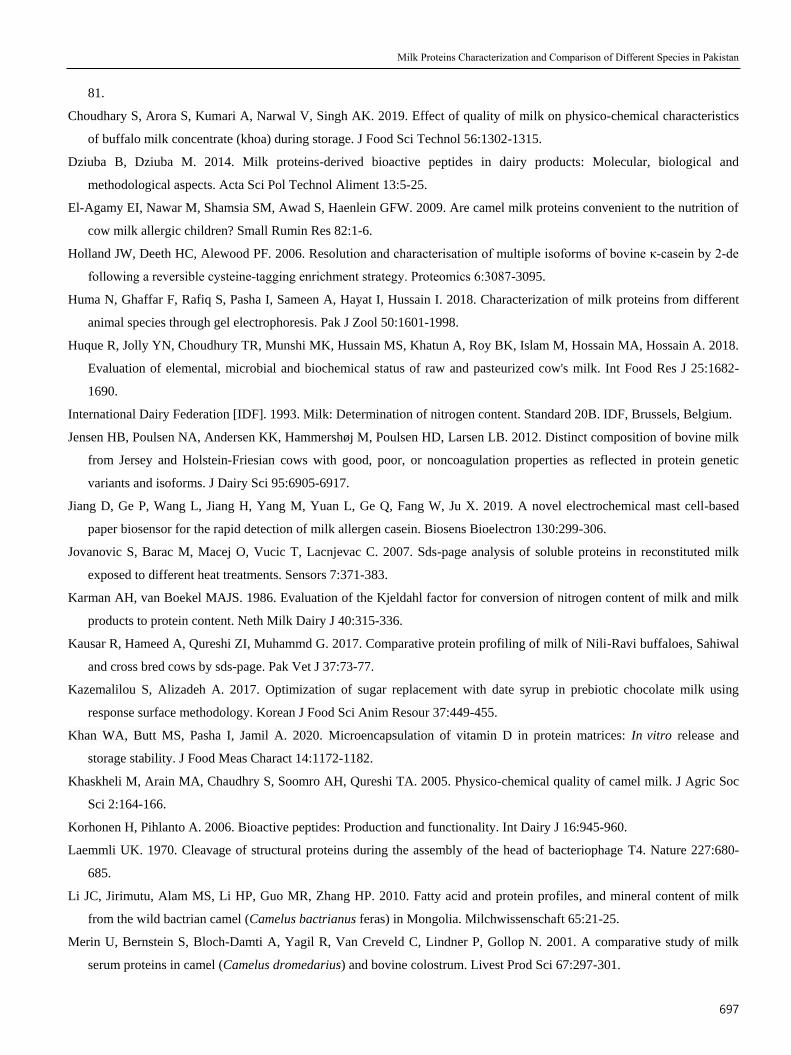
Characterization of whey proteins
Proteins remaining in solution after removal of caseins by acid precipitation have been collectively called whey proteins,
represent about 18%–20% of total milk protein. Protein profiling of milk from different species revealed wide variations as
depicted in Fig. 2. Pre-stained protein ladder of Thermo Scientific ranging from 10–200 KDa was used for comparing the
MWs of whey proteins from selected species. In Sahiwal cow milk, major three bands were observed and band having MW
of 14 KDa was of α-LAC. Previously, with similar molecular mass, α- LAC (14.2 KDa) was identified in milk of Bubalus
bubalis buffalo found in Mediterranean water using RP-HPLC and ESI-MS (Buffoni et al., 2011).The other main band was of
β-Lg that was at 17 KDa. The concentration and peak height of β-Lg was more in comparison of α-LAC. Next band was of
BSA at almost 70 KDa, concentration and peak height of BSA was also less than β-Lg. The other band which was at 26 KDa
was also observed. The band at 26 KDa might be dimer of α-LAC. After that band of the highest MW was obtained at 222
KDa with less concentration and peak height than α-LAC and β-Lg and it could be Ig. Buffalo milk represented four bands.
The lowest molecular band was at 14 KDa of α-LAC. Next to α-LAC band there was band at 27 KDa and could be β-Lg
because it had electrophoretic mobility similar to bovine β-Lg. β-Lg concentration was more in buffalo milk whey. Third
band was observed at 84 KDa and could be of buffalo serum albumin due to having electrophoretic mobility similar to bovine
serum albumin. The last observed band was noted at 108 KDa and it could be of Ig. Sheep milk showed three bands with first
band at 14 KDa, of α-LAC and second band at 18 KDa, of β-Lg. Another band after β-Lg was noticed at 26 KDa and it might
be the dimmer of α-LAC. The sheep serum albumin was noted at 68 KDa and band at 95 KDa was also noticed. Goat milk
having several bands, the band before α-LAC was of low MW proteins and might be protease and peptones. The α-LAC was
Fig. 2. Electrophoretic pattern of cow, buffalo, sheep, goat, and sheep milk protein (whey) on SDS representing differences in band
pattern. A, marker; B, cow milk casein; C, buffalo milk casein; D, sheep milk casein; E, goat milk casein; F, camel milk casein; SDS, sodium
dodecyl sulphate.

Milk Proteins Characterization and Comparison of Different Species in Pakistan
695
at 14 KDa and β-Lg was at 20 KDa. There were two bands at 22 and 30 KDa. The band at 30 KDa might be dimmer of α-
LAC. The goat serum albumin was at 51 KDa and after this 108 and 278 KDa bands were also examined and they could be of
Ig. In camel milk, α-LAC was at 13 KDa and β-Lg was not found. The other band was at 15, 23, and 30 KDa. The camel
serum albumin was at 51 KDa and last band at l08KD and might be Ig. Deferentially detected peptides in milk of tested
species/cattle types may help to distinguish the milk samples and to check the milk adulterations (Kausar et al., 2017).
SDS-PAGE and gel filtration of whey samples from camel and bovine milk were compared with each other to identify
different whey proteins. In bovine whey BSA, α-LAC and β-Lg could be observed. Faint bands could be dimer of α-LAC (28
KDa), β-Lg and octamers. In camel whey bands of α-LAC, of 23, 32, and 43 KDa were noted. β-Lg was missing in camel
whey (Merin et al., 2001). Tomotake et al. (2006) studied the difference in protein of Japanese-Saanen goat’s and Holstein
cow’s milk. Results revealed that α-LAC and β-Lg were the major bands in Japanese-Saanen goat’s and Holstein cow’s milk.
Goat and camel milk do not contain quantifiable amounts of β-Lg (Li et al., 2010; Yoo et al., 2019). Consequently, the main
whey protein in goat and camel milk is α-LAC (Al Kanhal and Al haj, 2010). These characteristics contribute towards low
risk of milk allergy and high digestibility as compare to cow milk (El-Agamy et al., 2009). The difference in the
compositional and nutritional profile of milk directly related to evolution, animal ecology, nutrition, genetics and
environment (Nikkhah, 2012).
These findings also revealed that milk proteins of different sources fractionated into casein and whey protein fractions and
present extend of proteolysis in cheese. It was observed that no significant degradation was observed in the SDS–PAGE gels
for serum albumin, αs1 and β-CN, β-Lg and α-LAC fractions of fresh milk cheese except κ-casein fractions. The results are in
accordance with Choudhary et al. (2019), who worked on SDS–PAGE patterns for Khoa and UHT milk at higher and under
refrigerated storage. Conclusively, it was evident from SDS–PAGE that change in proportions and functionality of proteins is
greater in cheese and could be due to quality of milk.
Conclusion
The present research work showed the composition of milk from different species with special reference to Pakistani
breeds. Sheep milk showed highest content of TS, SNF, total protein, density and concentrated protein bands than milk of
other species. Buffalo milk was classified at second number after sheep milk (as indicated by its composition and
electrophoretic analysis). Results indicated camel and goat milk as best for development of allergen free products. This
comparative milk study could be helpful for better understanding of milk protein properties and functionality. More studies
needed to further explore the effect of different processing conditions on the composition and nutritional profile of milk
during different dairy products development.
Conflicts of Interest
The authors declare no potential conflicts of interest.
Acknowledgements
The authors are thankful to Faculty of Food, Nutrition and Home Sciences, University of Agriculture, Faisalabad, and
Department of Food Science and Technology, Khwaja Fareed University of Engineering and Information Technology, Rahim

Food Science of Animal Resources Vol. 40, No. 5, 2020
696
Yar Khan, Pakistan for research facilities and technical support.
Author Contributions
Conceptualization: Iqbal A, Ahsan S. Data curation: Nadeem M, Chughtai MFJ, Naz S. Formal analysis: Yasmin I, Iqbal A.
Methodology: Tehseen S, Tanweer S. Software: Khan WA, Khaliq A. Validation: Rehman SJU, Khaliq A. Investigation:
Liaqat A, Iqbal A. Writing - original draft: Mehmood T, Khaliq A. Writing - review & editing: Yasmin I, Iqbal R, Liaqat A,
Khan WA, Nadeem M, Iqbal A, Chughtai MFJ, Rehman SJU, Tehseen S, Mehmood T, Ahsan S, Tanweer S, Naz S, Khaliq A.
Ethics Approval
This article does not require IRB/IACUC approval because there are no human and animal participants.
References
Ahmad S, Gaucher I, Rousseau F, Beaucher E, Piot M, Grongnet JF, Gaucheron F. 2008. Effects of acidification on physico-
chemical characteristics of buffalo milk: A comparison with cow’s milk. Food Chem 106:11-17.
Ahmed M, Khaleeq A, Huma R, Qadir MA, Shafiq MI, Israr A, Ali A, Shahzad S. 2016. Optimization and validation
procedure for elemental composition of fresh and pasteurized milk in Pakistan employing microwave digestion followed
by icp-oes: A contribution to risk assessment. Food Anal Methods 9:2933-2942.
Al Kanhal HA, Al haj OM. 2010. Compositional, technological and nutritional aspects of dromedary camel milk. Int Dairy J
20:811-821.
AOAC. 2006. Official methods of analysis. 17th ed. Association of Official Analytical Chemists International, Arlington, VA,
USA.
Babiker WI, El-Zubeir IE. 2014. Impact of husbandry, stages of lactation and parity number on milk yield and chemical
composition of dromedary camel milk. Emir J Food Agric 26:333-341.
Balthazar CF, Santillo A, Figliola L, Silva HLA, Esmerino EA, Freitas MQ, Cruz AG, Albenzio M. 2018. Sensory evaluation
of a novel prebiotic sheep milk strawberry beverage. LWT 98:94-98.
Barros E, Brasil LHA, Tejero JP, Delgado-Bermejo JV, Ribeiro MN. 2017. Population structure and genetic variability of the
Segureña sheep breed through pedigree analysis and inbreeding effects on growth traits. Small Rumin Res 149:128-133.
Basch JJ, Douglas FW, Procino LG, Holsinger VH, Farrell HM. 1985. Quantitation of caseins and whey proteins of processed
milks and whey protein concentrates, application of gel electrophoresis, and comparison with Harland-Ashworth
procedure. J Dairy Sci 68:23-31.
Buffoni JN, Bonizzi I, Pauciullo A, Ramunno L, Feligini M. 2011. Characterization of the major whey proteins from milk of
mediterranean water buffalo (Bubalus bubalis). Food Chem 127:1515-1520.
Cavalcanti RN, Balthazar CF, Esmerino EA, Freitas MQ, Silva MC, Raices RSL, Gut JAW, Cruz AG, Tadini CC. 2019.
Correlation between the dielectric properties and the physicochemical characteristics and proximate composition of
whole, semi-skimmed and skimmed sheep milk using chemometric tools. Int Dairy J 97:120-130.
Chen Z, Leinisch F, Greco I, Zhang W, Shu N, Chuang CY, Lund MN, Davies MJ. 2019. Characterisation and quantification
of protein oxidative modifications and amino acid racemisation in powdered infant milk formula. Free Radic Res 53:68-
Milk Proteins Characterization and Comparison of Different Species in Pakistan
697
81.
Choudhary S, Arora S, Kumari A, Narwal V, Singh AK. 2019. Effect of quality of milk on physico-chemical characteristics
of buffalo milk concentrate (khoa) during storage. J Food Sci Technol 56:1302-1315.
Dziuba B, Dziuba M. 2014. Milk proteins-derived bioactive peptides in dairy products: Molecular, biological and
methodological aspects. Acta Sci Pol Technol Aliment 13:5-25.
El-Agamy EI, Nawar M, Shamsia SM, Awad S, Haenlein GFW. 2009. Are camel milk proteins convenient to the nutrition of
cow milk allergic children? Small Rumin Res 82:1-6.
Holland JW, Deeth HC, Alewood PF. 2006. Resolution and characterisation of multiple isoforms of bovine κ‐casein by 2‐de
following a reversible cysteine‐tagging enrichment strategy. Proteomics 6:3087-3095.
Huma N, Ghaffar F, Rafiq S, Pasha I, Sameen A, Hayat I, Hussain I. 2018. Characterization of milk proteins from different
animal species through gel electrophoresis. Pak J Zool 50:1601-1998.
Huque R, Jolly YN, Choudhury TR, Munshi MK, Hussain MS, Khatun A, Roy BK, Islam M, Hossain MA, Hossain A. 2018.
Evaluation of elemental, microbial and biochemical status of raw and pasteurized cow's milk. Int Food Res J 25:1682-
1690.
International Dairy Federation [IDF]. 1993. Milk: Determination of nitrogen content. Standard 20B. IDF, Brussels, Belgium.
Jensen HB, Poulsen NA, Andersen KK, Hammershøj M, Poulsen HD, Larsen LB. 2012. Distinct composition of bovine milk
from Jersey and Holstein-Friesian cows with good, poor, or noncoagulation properties as reflected in protein genetic
variants and isoforms. J Dairy Sci 95:6905-6917.
Jiang D, Ge P, Wang L, Jiang H, Yang M, Yuan L, Ge Q, Fang W, Ju X. 2019. A novel electrochemical mast cell-based
paper biosensor for the rapid detection of milk allergen casein. Biosens Bioelectron 130:299-306.
Jovanovic S, Barac M, Macej O, Vucic T, Lacnjevac C. 2007. Sds-page analysis of soluble proteins in reconstituted milk
exposed to different heat treatments. Sensors 7:371-383.
Karman AH, van Boekel MAJS. 1986. Evaluation of the Kjeldahl factor for conversion of nitrogen content of milk and milk
products to protein content. Neth Milk Dairy J 40:315-336.
Kausar R, Hameed A, Qureshi ZI, Muhammd G. 2017. Comparative protein profiling of milk of Nili-Ravi buffaloes, Sahiwal
and cross bred cows by sds-page. Pak Vet J 37:73-77.
Kazemalilou S, Alizadeh A. 2017. Optimization of sugar replacement with date syrup in prebiotic chocolate milk using
response surface methodology. Korean J Food Sci Anim Resour 37:449-455.
Khan WA, Butt MS, Pasha I, Jamil A. 2020. Microencapsulation of vitamin D in protein matrices: In vitro release and
storage stability. J Food Meas Charact 14:1172-1182.
Khaskheli M, Arain MA, Chaudhry S, Soomro AH, Qureshi TA. 2005. Physico-chemical quality of camel milk. J Agric Soc
Sci 2:164-166.
Korhonen H, Pihlanto A. 2006. Bioactive peptides: Production and functionality. Int Dairy J 16:945-960.
Laemmli UK. 1970. Cleavage of structural proteins during the assembly of the head of bacteriophage T4. Nature 227:680-
685.
Li JC, Jirimutu, Alam MS, Li HP, Guo MR, Zhang HP. 2010. Fatty acid and protein profiles, and mineral content of milk
from the wild bactrian camel (Camelus bactrianus feras) in Mongolia. Milchwissenschaft 65:21-25.
Merin U, Bernstein S, Bloch-Damti A, Yagil R, Van Creveld C, Lindner P, Gollop N. 2001. A comparative study of milk
serum proteins in camel (Camelus dromedarius) and bovine colostrum. Livest Prod Sci 67:297-301.

Food Science of Animal Resources Vol. 40, No. 5, 2020
698
Moatsou G, Sakkas L. 2019. Sheep milk components: Focus on nutritional advantages and biofunctional potential. Small
Rumin Res 180:86-99.
Mohsin AZ, Sukor R, Selamat J, Hussin ASM, Ismail IH. 2019. Chemical and mineral composition of raw goat milk as
affected by breed varieties available in Malaysia. Int J Food Prop 22:815-824.
Montgomery HE, Sen KD. 2008. Statistical complexity and Fisher–Shannon information measure of H+2. Phys Lett A
372:2271-2273.
Musaad AM, Faye B, Al-Mutairi SE. 2013. Seasonal and physiological variation of gross composition of camel milk in Saudi
Arabia. Emir J Food Agric 25:618-624.
Nikkhah A. 2012. Equidae milk promises substitutes for cow and human breast milk. Turk J Vet Anim Sci 36:470-475.
Ozrenk E, Inci SS. 2008. The effect of seasonal variation on the composition of cow milk in van province. Pak J Nutr 7:161-
164.
Park YW, Juárez M, Ramos M, Haenlein GFW. 2007. Physico-chemical characteristics of goat and sheep milk. Small Rumin
Res 68:88-113.
Park YW. 2007. Rheological characteristics of goat and sheep milk. Small Rumin Res 68:73-87.
Playne MJ, Bennett L, Smithers GW. 2003. Functional dairy foods and ingredients. Aust J Dairy Technol 58:242-264.
Pond WG. 2004. Encyclopedia of animal science. CRC Press, Boca Raton, FL, USA.
Qian F, Sun J, Cao D, Tuo Y, Jiang S, Mu G. 2017. Experimental and modelling study of the denaturation of milk protein by
heat treatment. Korean J Food Sci Anim Resour 37:44-51.
Raynal-Ljutovac K, Lagriffoul G, Paccard P, Guillet I, Chilliard Y. 2008. Composition of goat and sheep milk products: An
update. Small Rumin Res 79:57-72.
Selvaggi M, D'Alessandro AG, Dario C. 2017. Environmental and genetic factors affecting milk yield and quality in three
Italian sheep breeds. J Dairy Res 84:27-31.
Selvaggi M, Laudadio V, Dario C, Tufarelli V. 2015. β-Lactoglobulin gene polymorphisms in sheep and effects on milk
production traits: A review. Adv Anim Vet Sci 3:478-484.
Strzałkowska N, Jóźwik A, Poławska E, Zdanowska-Sąsiadek Ż, Bagnicka E, Pyzel B, Lipińska P, Horbańczuk JO. 2014. A
relationship between somatic cell count, polymorphic form of β4-defensin and susceptibility of cow milk fat to lipolysis.
Anim Sci Pap Rep 32:307-316.
Tomotake H, Okuyama R, Katagiri M, Fuzita M, Yamato M, Ota F. 2006. Comparison between Holstein cow’s milk and
Japanese-Saanen goat’s milk in fatty acid composition, lipid digestibility and protein profile. Biosci Biotechnol Biochem
70:2771-2774.
Urgu M, Türk A, Ü nlütürk S, Kaymak-Ertekin F, Koca N. 2019. Milk fat substitution by microparticulated protein in
reduced-fat cheese emulsion: The effects on stability, microstructure, rheological and sensory properties. Food Sci Anim
Resour 39:23-34.
Yasmin I, Saeed M, Pasha I, Zia MA. 2019. Development of whey protein concentrate-pectin-alginate based delivery system
to improve survival of B. longum BL-05 in simulated gastrointestinal conditions. Probiotics Antimicrob Proteins 11:413-
426.
Yoo J, Song M, Park W, Oh S, Ham JS, Jeong SG, Kim Y. 2019. A comparison of quality characteristics in dairy products
made from Jersey and Holstein milk. Food Sci Anim Resour 39:255-265.