Food Reserves - Cirad · Introducing the potential roles of food reserves in improving food and...
98
Food Reserves Using food reserves to enhance food and nutrition security in developing countries Synthesis Report October 2018 Study carried out on behalf of the European Commission International coopération and development
Transcript of Food Reserves - Cirad · Introducing the potential roles of food reserves in improving food and...

Food Reserves
Using food reserves
to enhance food and nutrition security
in developing countries
Synthesis Report
October 2018
Study carried out on behalf
of the European Commission
International
coopération and
development


This study was commissioned by the Unit C1, in charge of rural Development, food security and nutrition, of the Directorate-General
for International Cooperation and Development of the European Commission
The opinions expressed in this document represent the authors’ points of view,
which are not necessarily shared by the European Commission
or by the authorities of the concerned countries.
This report has been prepared by
Consortium composed by:
DAI Europe, HTSPE, DAI Global, Institute of Development Studies
Leader of the Consortium: DAI Europe
Contact Person: Anne-Sofia Holmberg, [email protected]
Service Contract
“Technical and Advisory
Services for Social
Transfers” (ASiST III)
No 2014/354-31852
DAI Europe Ltd.
3rd Floor Block C, Westside, London Road, Apsley
HP3 9TD
United Kingdom
www.dai.com

About ASiST
ASiST is an advisory service of the European Commission (EC) managed by the unit in charge of rural development, food
security and nutrition (C1) within the Directorate General for International Cooperation and Development (DEVCO). It has been
conceived as a flexible tool to support the work of the European Union (EU) aimed to strengthen food and nutrition security and
sustainable agriculture (FNS-SA) in developing countries. ASiST has been operating since January 2012 under three
successive contracts. It offers short-term expertise, backstopping facilities and support teams in the following areas: social
transfers (and social protection) for FNS-SA; resilience to food crises; budget support and public finance management for FNS-
SA; and, when needed, any other FNS-SA-related issues not covered by any other advisory service. The service is accessible
to all EU Delegations and their partners, as well as EC headquarter units. To request assistance from ASiST, please
contact [email protected].
About this report
This report is one of the products of a study commissioned by the European Commission’s Directorate-General for
International Cooperation and Development (DEVCO). It aims to clarify the potential role of food reserves in enhancing food
and nutrition security in developing countries and make recommendations on how to use food reserves (in complement to
other tools), taking into account the specificities on the context and the constraints of World Trade Organization (WTO)
disciplines.
The study was conducted in 2016 based on i) an extensive review of the existing literature (both theoretical and empirical) and
ii) ten case studies analysing national or regional experiences in Africa, Asia and South America.
All the products of the study, including a compilation of case study summaries, are available at
https://europa.eu/capacity4dev/hunger-foodsecurity-nutrition/discussions/how-can-food-reserves-best-enhance-food-and-
nutrition-security-developing-countries.
Acknowledgements
The overall study was coordinated by Franck Galtier (CIRAD). The present synthesis report has been written by Franck
Galtier with the help of Benoît Daviron (CIRAD) and Henri Leturque (IRAM). The case study reports have been written by the
following experts:
• Bangladesh: Paul Dorosh (IFPRI)
• Brazil: Walter Belik (University of Campinas, São Paulo) and Altivo Almeida Cunha (FAO consultant)
• Burkina Faso: Arlène Alpha (CIRAD) and Bénédicte Pémou (SONAGESS)
• ECOWAS Regional Reserve: Franck Galtier (CIRAD) with the help of Roger Blein (Bureau Issala)
• Ethiopia: Shahidur Rashid (IFPRI), Dawit Alemu (Ethiopian Institute of Agricultural Research) and Paul Dorosh
(IFPRI)
• Indonesia: Peter Timmer (Emeritus, Harvard University)
• Nigeria: Chukwuka Onyekwena (Centre for the Study of the Economies of Africa, Abuja)
• Philippines: Ramon Clarete (University of the Philippines)
• Senegal: Ibrahima Hathié (IPAR)
• Zambia: Antony Chapoto (Indaba Agricultural Policy Research Institute)
All the reports benefited from the reviewing of:
• Ralph Cummings (consultant, ex IFPRI)
• Kalanidhi Subbarao (consultant, ex World Bank)
• Steve Wiggins (Overseas Development Institute)
The authors wish to thank Cécile Cherrier and Nicholas Freeland (ASiST experts) for their helpful comments.
Disclaimer
The authors accept sole responsibility for this report, drawn up on behalf of the Commission of the European Union. The
report does not necessarily reflect the views of the Commission.
How to cite this report
European Commission (2018) Using food reserves to enhance food and nutrition security in developing countries. Synthesis
Report. Brussels: Directorate-General for International Cooperation and Development.

v
TABLE OF CONTENTS
List of Tables, Figures, Boxes and Annexes vii
List of Abbreviations and Acronyms ix
Introducing the potential roles of food reserves in improving food and nutrition
security 1 1.1 Objective and scope of the study 1 1.2 Food and nutrition security 1 1.3 Food reserves 1 1.4 Costs of food reserves 3 1.5 Alternative tools 5 1.6 Performance criteria 6 1.7 Structure of the report 6
I. USING FOOD RESERVES TO IMPROVE NATIONAL FOOD AND NUTRITION SECURITY 7
Which role for food reserves in fighting against chronic food and nutrition insecurity? 8 2.1 The ‘food versus cash’ debate 8
2.1.1 Effectiveness (in improving recipient food and nutrition security) 9 2.1.2 Cost 12 2.1.3 Cost-effectiveness 13
2.2 To what extent are food reserves necessary to supply permanent food transfers? 14
Which role for food reserves in managing food crises? 16 3.1 Drivers of food crises 16
3.1.1 Two major drivers 16 3.1.2 A typology of food market situations 17
3.2 Possible interventions for managing food crises 18 3.3 Principles of intervention 19 3.4 Which role for food reserves in managing food crises? 20
3.4.1 The case of exported food products 20 3.4.2 The case of imported food products 21 3.4.3 The case of food products non-traded on international markets 22 3.4.4 Synthesis on the role for food reserves in managing shortages and price surges on food
markets 22 3.5 Designing food reserves to manage food crises 24
3.5.1 Choosing the products to be included in the food reserves 25 3.5.2 Determining the quantities to be stored 26 3.5.3 Rules for triggering the use of food reserves 28
3.6 Illustrations 30
Which role for food reserves in providing incentives and income to food producers? 35 4.1 Food reserves procurement as a way to provide incentives to producers 35 4.2 Rationale for providing non-targeted incentives to producers 35 4.3 Rationale for providing specific incentives to small farmers 37 4.4 Rationale for providing specific incentives to environmental-friendly production models 38 4.5 Rationale for providing incentives to specific market tools 38 4.6 Illustrations 39
How to govern food reserves? 52 5.1 Defining clear, relevant and realistic objectives 52 5.2 Rules for a good governance of food reserves 52 5.3 Articulating food reserves with private stocks 53
vi
II. INTERNATIONAL DIMENSIONS: THE EFFECT OF NATIONAL FOOD RESERVES ON GLOBAL FOOD
AND NUTRITION SECURITY AND RELATED ISSUES 55
Effect of national food reserves on global food and nutrition security 56 6.1 The need for stocks to guarantee the stability of international prices 56
6.1.1 Theoretical stabilising effect of stocks on international prices 56 6.1.2 Lessons from the 2008 crisis 56 6.1.3 Long-term evidences of the stabilising effect of stocks on international prices 59
6.2 The decisive role of food reserves in importing countries 61
The need to reshape the international governance of food reserves 63 7.1 The need to modify WTO disciplines 63
7.1.1 Issues related to WTO disciplines 63 7.1.2 Develop disciplines on export bans? 63 7.1.3 Modify WTO disciplines on food reserves? 64
7.2 Improve the information on stocks 66 7.3 Support the development of regional reserves 66 7.4 Develop international agreements to coordinate the building and/or the use of national food reserves 67 7.5 Concluding remarks on the international governance of food reserves 67
Conclusion: The decisive role of governance 69
Annexes 71
References 78

vii
LIST OF TABLES, FIGURES, BOXES AND ANNEXES
List of Recommendation Boxes
Recommendation Box 1 15 Recommendation Box 2 29 Recommendation Box 3 38 Recommendation Box 4 54 Recommendation Box 5 62 Recommendation Box 6 68
List of Tables
Table 1 Comparing the cost of food, cash and voucher transfers 12 Table 2 Possible situations of food markets during food crisis 17 Table 3 Proportion of grain in the diet and household expenditures in Mali 18 Table 4 Possible interventions to manage food crises 19 Table 5 Role of food reserves in managing shortages and price surges on food markets 23 Table 6 Estimating the needs of FR of ECOWAS countries 28 Table 7 Effect of grain transfers on domestic grain prices: simulations for Ethiopia 34 Table 8 Types of incentives that can be provided to producers through food reserve procurement 35 Table 9 In Sub-Saharan Africa, a large proportion of small-scale farmers are staple buyers (or net buyers) 37 Table 10 Philippine rice subsidy: cost-benefit calculations 42 Table 11 When used to support both the producer price and the consumer price permanently, food
reserves generate prohibitive costs, that crowds out public spending in other public goods 43 Table 12 Modalities of the Food Acquisition Programme (PAA) 44
List of Figures
Figure 1 Potential use of FR for improving food and nutrition security 2 Figure 2 Size of food reserves by country and commodity (expressed as a percentage of the consumption
of the considered commodity in the considered country) 3 Figure 3 Physical storage costs in different countries (euro per ton per year) 4 Figure 4 Role of FR in providing transfers to food insecure households 8 Figure 5 Relative impacts of food versus cash transfers on per capita calorie intake 10 Figure 6 Relative impacts of food versus cash transfers on food expenditures 11 Figure 7 Evolution of the wheat purchasing power of the cash transfers provided by Ethiopia’s PSNP 13 Figure 8 Seasonality of sorghum producer price and consumer price in Mali 15 Figure 9 Real Rice Prices in Indonesia, Domestic (Rp) (blue), Imported from World (Rp) (red), and
Imported from World (USD) (green) 31 Figure 10 Grain prices in Bamako, Mali 33 Figure 11 Wheat real price in the USA and Malawi 37 Figure 12 Rice wholesale prices in the Philippines, Vietnam and Thailand 41 Figure 13 Aligning the domestic price with the import parity price would allow poor consumer saving 10% of
their current expenditures 41 Figure 14 PAA’s resources (by modality) 45 Figure 15 Weight of food product categories in PAA’s quantity purchased (in 2016) 45 Figure 16 Quantity of food purchased by the PAA (in tons) 46 Figure 17 Number of family farmers supplying the PAA 46 Figure 18 PNAE’s resources and purchases from family farmers (in million R$) 49 Figure 19 Share of the resources transferred by the federal government for school meals used for
purchases from family agriculture (by municipality) 49 Figure 20 Share of PNAE’s purchases made from family farmers 50 Figure 21 PAA and PNAE within the Zero Hunger Strategy 51 Figure 22 Chronology of the 2008 crisis on the international rice market 57 Figure 23 Global grain stocks since 1985 (as a percentage of annual uses) 58 Figure 24 Wheat global stock and international price 59

viii
Figure 25 Maize global stock and international price 60 Figure 26 Rice global stock and international price 60 Figure 27 Grain calories global stock and international price 61 Figure 28 FR procurement price compared to world price (average 2000-2015) 64 Figure 29 Numerical illustration of the biases in WTO rules that specify how the subsidy provided by food
reserves should be calculated 65 Figure 30 September rice stocks in the Philippines (food reserves and private stocks) 75 Figure 31 August maize stocks in the Philippines (food reserves and private stocks) 75
List of Boxes
Box 1 Defining ‘reasonable objectives’ as a way to reduce the cost of FR: lessons from Indonesia 5
Box 2 Estimating the needs for food reserves: the case of ECOWAS countries 28
Box 3 Indonesia success story in stabilising the domestic price of rice by regulating imports and using
food reserves (1973-1997) 30
Box 4 The need for food reserves to manage import timelines: the experience of Bangladesh in 2008 31
Box 5 How to best use food reserves for managing food price crisis? To mitigate staple price increases
or to provide targeted aids? Ethiopia’s experience during the 2008 crisis 32
Box 6 Contracting with private importers to manage import timelines: Hong Kong and Singapore
experiences 32
Box 7 The need for food reserves when the staple most consumed by the poor are not traded on
international markets: the experience of Sahel countries 33
Box 8 Effect of food reserve-supplied transfers on staple prices: simulations for Ethiopia 34
Box 9 Which Indonesian farmers benefit from high rice prices? 40
Box 10 The damaging effects on food and nutrition security of maintaining permanently high staple
prices: lessons from Indonesia and the Philippines 40
Box 11 Supporting permanently the producer price and the consumer price is likely to generate huge
budgetary costs 42
Box 12 Procuring food with small-scale family farmers: Brazil’s Food Acquisition Programme (PAA) and
National School Feeding Plan (PNAE) 43
Box 13 The role of Japanese stocks in ending the 2008 crisis on the international rice market 58
Box 14 Illustration of biases in the WTO rules that specify how the subsidy provided by food reserves (or
other types of public stocks) should be calculated 65
Box 15 Which lessons can be drawn from competitive storage models? 73
List of Annexes
Annex 1 Can subsidising private storage be an alternative to food reserves? 72 Annex 2 On the social costs of targeting – Resisting to targeting in Niger: de-targeting, ‘babies of luck’ and
other stories 76

ix
LIST OF ABBREVIATIONS AND ACRONYMS
AFD Agence Française de Développement
AMIS Agricultural Market Information System
APTERR ASEAN Plus Three Emergency Rice Reserve
ASEAN Plus Three Association of Southeast Asian Nations (ASEAN) and the three East Asia nations of China, Japan and South Korea
BULOG Food logistics agency (Indonesia)
CDDS Direct Purchase for Simultaneous Donation (a modality of the PAA)
CGD Center for Global Development
CIRAD French research institute on developing countries' agricultures
Conab Brazil FR agency
CONSEA National Food and Nutritional Security Council (Brazil)
CPI Consumer Price Index
DEVCO Directorate General for International Cooperation and Development (EC)
EC European Commission
ECOWAS Economic Community of West African States
ECX Ethiopia Commodity Exchange
EU European Union
FAO Food and Agriculture Organization
FNDE National Fund for the Development of Education (Brazil)
FR Food reserves
G20 Group of Twenty
GDP Gross Domestic Product
HEA Household Economy Approach
HLPE High Level Panel of Experts of the UN Committee on World Food Security (hosted at the FAO)
ICAs International Commodity Agreements
IFPRI International Food Policy Research Institute
II PRONAN Second Food and Nutrition National Programme (Brazil)
IPAR Initiative Prospective Agricole et Rurale (Senegal)
IPC Integrated Food Security Phase Classification
IRAM Institut de Recherche et d'Application des Méthodes de développement
LASDEL Laboratoire d'Etudes et de Recherche sur les Dynamiques Sociales et le Développement Local
MAFAP Monitoring and Analysing Food and Agricultural Policies (FAO programme)
MDA Ministry for Agrarian Development (Brazil)
MDS Ministry of Social Development and Fight against Hunger (Brazil)

x
MESA Extraordinary Ministry for Food Security (Brazil)
MPC Marginal propensity to consume
MSF Médecins Sans Frontières
NFA National Food Authority (Philippines)
NGO Non-governmental organisations
OECD Organisation for Economic Co-operation and Development
P4P Purchase for Progress (WFP programme)
PAA Food Acquisition Programme (Brazil)
PD Domestic price
PM Import parity price (import price cost)
PNAE National School Feeding Plan (Brazil)
PPROC FR procurement price
PRONAF National Programme for the Strengthening of Family Farmers (Brazil)
PSNP Productive Safety Net Program (Ethiopia)
SAARC South Asian Association for Regional Cooperation
SFB SAARC Food Bank
SONAGESS Société nationale de gestion du stock de sécurité alimentaire (Burkina Faso)
STUR Stock-to-use ratio
SUSENAS National Socioeconomic Survey (Indonesia)
UNICEF United Nations International Children's Emergency Fund
USA United States of America
USAID United States Agency for International Development
USD US Dollar
USDA United States Department of Agriculture
WFP World Food Programme
WRS Warehouse Receipt Systems
WTO World Trade Organization
ZAMACE Zambia Commodity Exchange

1
INTRODUCING THE POTENTIAL ROLES OF FOOD RESERVES IN
IMPROVING FOOD AND NUTRITION SECURITY
1.1 Objective and scope of the study
The study aims to clarify the potential roles of food reserves (FR) in enhancing food and nutrition security in
developing countries and analyse the substitutability and complementarity between FR and other tools.
The study is based on i) a review of the existing literature (both theoretical and empirical) and ii) ten case studies
analysing experiences in Asia (Bangladesh, Indonesia, and Philippines), South America (Brazil) and Africa
(Burkina Faso, ECOWAS Regional Reserve, Ethiopia, Nigeria, Senegal and Zambia).
1.2 Food and nutrition security
The definition of food and nutrition security strongly evolved with time, reflecting the progressive enlargement of
the concept (FAO, 2006). The definition adopted during the 1996 World Food Summit states that “food security
exists when all people, at all times, have physical and economic access to sufficient, safe and nutritious food that
meets their dietary needs and food preferences for an active and healthy life.”
Compared with the previous definitions, this definition introduces new dimensions by referring to i) nutrients and
dietary needs (thereby going beyond staples and calories), ii) access (thereby going beyond physical availability),
iii) food safety and iv) consumers’ preferences. The widely accepted interpretation of this definition enlarged it
even more by considering the “utilisation” of the food through “adequate diet, clean water, sanitation and health
care” in order to reach “a state of nutritional well-being where all physiological needs are met” (FAO, 2006).
According to this interpretation, food and nutrition security encompasses four dimensions: i) food availability, ii)
food access, iii) utilisation and iv) stability of the three first dimensions. It is worth noting that consumers’
preferences have been left out in this interpretation, which reflects the reduction of food and nutrition security to
its nutritional dimensions. More precisely, consumers’ preferences are implicitly considered as being part of the
“utilisation” dimension, meaning that they are taken into account only as far as they affect food consumption.
However, satisfying consumers’ preferences may be important for other reasons. It has for instance occurred that
maize has being distributed to food insecure households in regions where it was usually only consumed by
animals. Even when recipient households actually consume the maize they receive, there is still a problem, not
related to nutrition but to dignity and self-esteem. In other words, food security cannot be reduced to a component
of nutritional security.
For this reason, this study, considers five dimensions of food and nutrition security: i) food availability, ii) food
access, iii) utilisation, iv) adequacy to preferences and v) stability of the four first dimensions. Note that access
mainly refers to households’ economic access to food but it can also refer to the intra-households’ allocation of
the food (i.e. individual access rather than household access).
Food and nutrition insecurity can be chronic or transitory (World Bank, 1986). Chronic food and nutrition insecurity
refers to households with permanent difficulties to feed themselves whereas transitory food and nutrition security
refers to households in difficulty only when facing a crisis. Of course, households may shift from the category
‘food secure’ to the category ‘transitory food insecure’ or ‘chronically food insecure’ and vice versa.
1.3 Food reserves
What are food reserves? FR are stocks of food products held by a public entity. The considered products should
be food products with content in calories or nutrients that render them important for food and nutrition security
(stocks of coffee or cacao can hardly be considered as FR). In practice, FR are mainly made of grain or other
staples (for instance milled cassava in some regions of the world). The public entity that holds the FR can be
national but also local, regional (ASEAN Plus Three, ECOWAS and SAARC have built regional grain reserves) or
(theoretically) international. By extension, stocks managed by communities are sometimes assimilated to FR as
their effect is quite similar to the effect of local FR (see the case of ‘cereal banks’ in the Sahel). By extension the
expression “food reserves” can also refer to the FR agency (the agency in charge of managing the FR).

2
Impact pathways of food reserves on food and nutrition security. There are three different impact
pathways through which food reserves can be used buy governments to improve national food and
nutrition security (see Figure 1). First, the food stored can be used to supply permanent transfers to
chronically food insecure households. Second, food reserves can be used to manage food crises, by removing
shortages or mitigating price surges through sales into the national market (possibly at a subsidised price)
(strategy 2a), or by supplying emergency transfers to households hit by the crisis (strategy 2b). These two
strategies are not exclusive and are often combined. Third, whatever the way the food stored is used
(permanently or in periods of crisis), food procurement by the food reserve agency offers the opportunity to send
incentives to farmers to stimulate or orient their investment in food production, with potential effect on food and
nutrition security in the medium run. Of course, this third impact pathway is strongly related to the first two ones: a
country’s ability to use food reserve procurement to orient food production strongly depends on the quantity to be
procured and released, as well as the way it is used (permanently or only in periods of crisis).
In contrast with the first three impact pathways that are purposely activated by national governments, the fourth
impact pathway operates at a cross-country level and is often an unintended effect of national food policies. It
results from the fact that food reserves in a given country are likely to benefit other countries (especially importing
countries) through a stabilising effect on regional or international markets. By avoiding or smoothing price
surges on these markets, food reserves can contribute to improving food and nutrition security at the global level
Figure 1 Potential use of FR for improving food and nutrition security
Source: Authors.
Note that these effects are not guaranteed, as they depend on the context and the way FR are managed.
Magnitude of food reserves. Data on the size of FR is scarce and not always reliable. Regardless, an idea of
the importance of FR is provided by the fact that, during the 2008 crisis, many developing countries released
public grain stocks at subsidised prices in order to protect poor consumers: it was the case for 15 Asian countries
Nat
ion
al s
cale
R
egi
on
al &
inte
rnat
ion
al s
cale
4 IMPACT OF FOOD RESERVES ON THE STABILITY OF REGIONAL AND INTERNATIONAL MARKETS
by contributing to avoid shortages, panics and price spikes
3 IMPACT OF FOOD RESERVES ON FOOD PRODUCTION
by using food reserve procurement to provide incentives to stimulate and orient food production
2 IMPACT OF FOOD RESERVES ON MITIGATING FOOD CRISES
1 IMPACT OF FOOD RESERVES ON CHRONIC FOOD INSECURITY
by supplying
permanent transfers to food insecure households
2b by supplying emergency transfers
to food insecure households
2a by supplying food markets through sales
(possibly at a subsidised price) to remove food shortages or mitigate
price increases
and/or

3
(out of 26), 13 African countries (out of 33) and 7 Latin-American countries (out of 22) (for more details, see
Demeke et al., 2008).
Moreover, many countries increased their FR after the 2008 crisis. Bangladesh is a good illustration of this
phenomenon as, after the 2008 crisis, public food grain stocks nearly tripled: from 617,000 tons in 2007/08 to
1,690,000 tons during the July 2012-February 2016 period (see Bangladesh case study report). This process is
still on-going as many developing countries or regions plan to increase the level of their FR. For instance, Ethiopia
is considering expanding its FR up to 1,500,000 (around three times its pre-2013 target), while the ECOWAS
Regional Reserve Project is planning to increase the level of grain FR in West Africa up to more than 840,000
tons (more than three times their 2017 level). In Asia, the ASEAN Plus Three Emergency Rice Reserve
(APTERR) may also lead to a significant increase in the level of FR. Figure 2 gives a brief outlook of current
available data on food and nutrition security FR in some developing countries.
Figure 2 Size of food reserves by country and commodity (expressed as a percentage of the consumption of
the considered commodity in the considered country)
Source: Authors, based on FAO for data on the rice FR of Bangladesh, Brazil, India and the Philippines; Dawe (2016) for the
case of wheat in India; FAO-MAFAP (2016a) for data on Malian FR; Bangladesh, Brazil, Ethiopia and Zambia case
studies for other data on FR; USDA-PSD for data on grain consumption. All data on FR are averages for 2011-2016
(when providing from FAO) or between 2011-2015 when providing from other sources except for wheat and maize
in Brazil for which the data correspond to the year 2011-12.
1.4 Costs of food reserves
Estimating the cost of FR is challenging, as data is scarce, often incomplete and generally not expressed by
activities (procurement, storage, distribution etc.), but rather in the categories used in accountability (wages,
energy, transport…). An additional difficulty stems from the fact that some costs correspond to effective monetary
costs and others to opportunity costs (that are usually not registered). For instance, the financial cost is a
monetary cost if the FR agency has to borrow money to buy food and is an opportunity cost if it purchases with its
own money (as the money used by the FR agency to buy food does not generate interest anymore). The same
can be said with warehouses that can be rented (generating a monetary cost) or owned by the FR authorities
(generating an opportunity cost, as they may have been rented to someone else thereby generating an income).
Of course, opportunity costs should be included in the estimation of the total cost. Nevertheless, existing data
allows one to understand the bigger picture of the magnitude of the cost of FR. This cost can be disaggregated

4
into four components: i) physical costs of storage, ii) financial costs of storage iii) logistical costs of operations
(procurement, sales and distributions) and iv) purchase costs net from sale revenue.
Physical storage costs. They include logistical costs (warehouses, bags, treatments against insects, handling…)
and the costs related to losses, leakages and quality deterioration. These costs strongly depend on the
characteristics of the products stored (vulnerability to insects, to humidity etc.) and the characteristics of the
country (climate but also level of wages and warehouse rental). Some products (milk, meat, fruits and
vegetables…) have to be stored in refrigerated places. Some grains can be stored in warehouses whereas others
require silos. The quality of the rice stored in India begins to deteriorate after 3 months. Conversely, in Sahel
countries, millet and sorghum can be stored for 2 or 3 years. Although many determinants of the physical costs of
storage cannot be changed, an appropriate physical management of the stocks (treatments, rotations etc.) allows
reduce them. Despite the incompleteness and the lack of reliability of certain data, the international comparisons
provided on Figure 3 below show that the annual physical costs of storage range between 13 and 38 euros / t.
Depending on the considered product and the market dynamics, these costs may account for 5 to 10% of the
value of the stocks at the beginning of the year.
It has been reported that, in certain occasions, the physical cost of storage may be higher for FR than for private
storage (the case of India where more than four times higher is often cited, see Gouel et al. 2014). However, the
case of India seems to be rather exceptional. Although data on public and private storage cost in the same
country is not available, the international comparisons provided by Figure 3 suggest many FR have storage costs
in line with the costs of private stocks. When it appears that physical storage costs are lower for the private
sector, outsourcing the physical management of the FR may be an option.
Figure 3 Physical storage costs in different countries (euro per ton per year)
Note: Private storage costs are indicated in red and public storage cost in blue.
Source: Authors, based on World Bank and FAO (2012) for South Korea, Jordan, Egypt (*), Morocco, Saudi Arabia, United States, Netherlands, Lebanon, Qatar and Tunisia; AFD (2014) for Hungary, France, Egypt (**), Mali, Burkina Faso and Ethiopia; Gouel et al. (2014) for India. All storage costs are for wheat except for Mali and Burkina Faso (millet and sorghum). All costs have been converted in euro by using the September 2018 exchange rate provided by the International Monetary Fund (1 euro ≈ 1.166 US dollar).
Financial costs of storage. They are highly country-specific, as they depend on the level of interest rates which
can vary considerably from one country to another. If in one country the interest rate is 8%, this means that, for a

5
product stored one year, the financial cost accounts for 8% of the value of the stock at the beginning of the year.
Of course, the level of interest rates cannot be modified, but financial costs also depend on the length of storage
which is manageable. Sometimes, stocks are kept for too long a time in public warehouses as they have been
procured at a too high price (that prevents exporting them without losing money). This is what happened in
Zambia, for instance, in 2010 and 2011 and in Thailand in 2011.
Logistical costs of FR operations (procurement, sales and distributions). These costs are usually not
reported (either ignored or mixed with others in the categories of ‘transport’, ‘handling’ etc.). For the FR managed
by SONAGESS in Burkina Faso, they have been estimated to 118 FCFA/t for FR procurement and to 65 FCFA/t
for FR sales (respectively 18 euro cents/t and 10 euro cents/t, see AFD 2013), but these values are probably
strongly underestimated. Note that the cost of distributing food products is likely to be much higher than the cost
of selling food products (as distribution is much heavier in terms of logistics: it implies targeting, delivering in
remote areas etc.). The logistical costs of FR operations can be reduced through different means: the use of
tenders for procurement and sales allows both more transparency and reduced costs; innovative options have
been experimented in order to reduce the cost of distributing food (for instance, ESFRA in Ethiopia used to
outsource the distribution to NGOs and it proved to be a cost-effective way to reach food insecure households).
Purchase costs net from sale revenue. These costs strongly depend on the objectives of the FR. When part of
the food purchased is distributed for free or sold at a subsidised price, the revenue generated by sales is much
lower than when the FR are used to mitigate food price increases (which implies that part of the stock is sold in
periods of high prices). Purchase costs strongly depend on whether the objective is i) only supplying the FR, ii)
also supporting producer prices in periods of price collapses or iii) also supporting permanently producer prices.
Trying to support producers and consumers permanently and simultaneously is likely to generate extremely high
costs. In Zambia, purchase costs net from sale revenue reached €108 million in 2011, accounting for 42.5% of the
total cost of the FR and 3.5% of the national budget! Conversely, supporting producers only when the price
collapses and supporting consumers only when the price spikes (or provide permanent support only to food
insecure households) is a way to significantly reduce the cost of FR without undermining their effect on food and
nutrition security (see Box 1 for the example of Indonesia).
Box 1 Defining ‘reasonable objectives’ as a way to reduce the cost of FR: lessons from Indonesia
Indonesia is especially interesting on this issue because the objective of its FR changed in 1998. Prior to this,
the aim was stabilising the domestic price of rice around its mid-term trend value: therefore, the FR agency
(BULOG) was supporting either farmers (when the international price was collapsing) or consumers (when the
international price was increasing sharply), or even none of them (when the international was at acceptable
level). Since 1998, the objective has been to permanently hold the domestic price at a high level while
simultaneously providing support to consumers through targeted food transfers (the Raskin program). The
implication on the cost of the FR has been huge: the current cost of the FR is more than four times its 1991
level, “a year when BULOG was actively managing the price stabilisation effort solely on the basis of its
domestic buffer stock […], [resulting in a full cost] of BULOG’s rice activities of $233 million, which amounted to
0.11 percent of total GDP, and about 1.2 percent of the National Budget” (Timmer, 2013b).
Source: Indonesia case study report, and Timmer (2013b).
Another important way to reduce food purchase costs is timely procurement. Purchasing when the price is low (in
good years and/or during the post-harvest period) allows not only to reduce FR purchase costs but also allows to
smooth the seasonality of prices (by mitigating the collapse in price that often occurs during the post-harvest
period). Allowing timely interventions may imply providing the FR agency with a working capital (in order to allow
quick purchases) and adequate rules and procedures. In Mali, it has been estimated that allowing the two national
FR to do 100% of their procurement during the four months that follow the harvest would allow them to reduce
their purchase costs by around 10 % (FAO-MAFAP, 2016b and 2016c).
1.5 Alternative tools
As we have seen, FR can play a role in i) fighting against chronic food and nutrition insecurity, ii) managing food
crises, and iii) providing incentives to production and income to small farmers.
However, other tools are available to reach the same objectives. The question is therefore to know whether in a
given context FR are likely to perform better than alternative tools.

6
In order to fight against chronic food and nutrition insecurity, permanent transfers can be provided to food
insecure households. When the transfers are made of food, FR may be required to supply them, but it is also
possible to provide cash or vouchers instead of food and in this case there is no need for FR. Even when food
transfers are provided, they can in some occasions be supplied through just-in-time purchases. In this scenario, a
financial reserve is needed instead of a physical reserve. The role of FR in providing transfers is therefore related
to two debates: i) the performance of food transfers compared to transfers of cash or vouchers and, in case food
transfers are preferred, ii) the relevance of supplying food transfers through FR or just-in-time purchases.
In order to manage food crises, two broad categories of policies can be used: providing food insecure households
with emergency transfers and/or implementing interventions to mitigate staple price increases (when a food crisis
occurs, staple prices usually surge, thereby generating a collapse in household purchasing power). FR can play a
role for both policies. They can play a role in supplying food transfers and in mitigating staple price increases.
However, alternative tools do exist such as providing cash transfers or vouchers, increasing imports or reducing
exports, or implementing policies aiming to boost private storage.
In order to incentivise production and provide income to small farmers, FR procurement can be used, as well as
alternative tools: price incentives can be provided through trade policies or policies to boost private storage and
small-scale farmers can be supported through targeted (cash or input) transfers.
1.6 Performance criteria
We selected three categories of performance criteria to evaluate FR and compare their performance to the one of
alternative tools:
• The effectiveness of the tool in improving food and nutrition security (in its different dimensions);
• The cost of the tool;
• The effect on other countries.
The aggregation of the first two criteria gives an estimate of the cost-effectiveness of the tool, which is supposed
to be the main criterion for the decision-making at the country level. However, for a donor such as the EU, the
(negative or positive) spill-over effects on other countries should be taken into account, as the policies
implemented in a given country may affect (positively or negatively) the neighbouring countries or even (in the
case of a ‘big country’) the rest of the world. It is worth noting that the effect of the tools on food and nutrition
security, their cost and therefore their (relative) performance are likely to be highly context-dependent.
1.7 Structure of the report
The country level will be considered first, by presenting how using national FR may improve national food and
nutrition security. We will consider the use of FR to fight against chronic food and nutrition insecurity (Chapter 2),
to manage food crises (Chapter 3) and to provide incentives and incomes to food producers (Chapter 4). The
issue of how to govern FR to maximise their cost-effectiveness in improving food and nutrition security will also be
addressed (Chapter 5).
The second part of the report deals with the international dimensions of FR. The effect of national FR on
international markets (and by this way on global food and nutrition security) is analysed in Chapter 6. Chapter 7
highlights the need for an international governance of FR, demonstrating that the current framework (mainly
based on WTO rules) is not adequate and makes proposals to improve it.

7
I. USING FOOD RESERVES TO IMPROVE
NATIONAL FOOD AND NUTRITION
SECURITY

8
WHICH ROLE FOR FOOD RESERVES IN FIGHTING AGAINST
CHRONIC FOOD AND NUTRITION INSECURITY?
Chronic food and nutrition insecurity refers to permanent deficiencies in the consumption of calories or nutrients
(not deficiencies occurring only in periods of crisis). Permanent transfers targeted to food insecure households
can be an effective way to fight against chronic food and nutrition insecurity. They can also be very useful in post-
crisis periods in order to help poor households rebuild their capabilities and increase their resilience.
Transfer programmes can be classified depending on many variables, the main ones being i) the nature of the
goods transferred, ii) the existence or not of a matching contribution and iii) the way the beneficiaries are targeted.
Transfers can be provided in food but also in cash or vouchers (sometimes, other in-kind transfers are provided,
such as seeds). The matching contribution (if any) may take the form of work (as in cash for work and food for
work programmes), money (if the transferred goods are not distributed for free but subsidised) or the adoption of
specific behaviours by recipient households (such as sending their children to school or attending family planning
awareness meetings). Targeting may rely on a wide variety of methods and may be conducted on different
scales: areas, population categories (e.g. children through school feeding programmes), households or
individuals (e.g. children under five or breast-feeding women).
The role of FR in providing transfers depends on whether food transfers are deemed more appropriate than
transfers of cash or vouchers: when cash or voucher transfers are deemed more appropriate, there is no need for
FR. When food transfers are deemed more appropriate, this does not imply that huge FR are required: the
distributed food can in certain occasions be purchased on a just-in-time basis. The influence of these two debates
(food vs. cash; purchase in advance vs. just-in-time procurement) for the role of FR is summarised on Figure 4.
Figure 4 Role of FR in providing transfers to food insecure households
Source: Authors.
2.1 The ‘food versus cash’ debate
Five key aspects to be considered when selecting the nature of the good distributed by a transfer programme
have been identified (see Gentilini, 2007 and Box 42 in European Commission, 2012):
• The objective of the transfers (for instance: increase resilience, reduce poverty, improve nutrition);
• The situation of markets (for instance: existence of shortages or sharp price increases);
• The implementation capacity (for instance: concerns about security or corruption that may lead to part of
the transfers being diverted);
Is it better to provide food transfers than cash or voucher transfers?
Provide cash or vouchers Provide food
No need for FR
Is it better to procure the food in advance?
Limited needs for FR Needs for FR
No Yes
No Yes

9
• The cost and effectiveness (the logistical and administrative costs to deliver the transfers and their ability
to reach their objective;
• The beneficiary preferences.
In this chapter, we will only consider transfers with the same objective: improving the food consumption and the
nutrition status of food insecure persons. We will also only consider the case of transfers when there is no major
tension on food markets: the use of transfers during food crises will be dealt with in Chapter 3. As far as the
nature of the good transferred is concerned, the implementation capacity is mainly related to risk of diversion.
This risk may be different for cash, food or voucher. We chose to include this dimension in the cost of transfers,
thereby adopting a large definition of the transfer cost. For us it includes not only logistical and administrative
costs but also leakages resulting from diversion, quality deterioration or other causes. We also chose to include in
effectiveness the satisfaction of beneficiary preferences. This choice is coherent with the definition of food and
nutrition security that encompasses the satisfaction of preferences as one of its dimension (see Chapter 1).
Therefore, for us, transfer effectiveness (in improving food and nutrition security) encompasses both objective
dimensions (related to recipients’ food consumption) and subjective dimensions (related to recipients’
satisfaction).
The section will therefore be organised as follows. We will first consider the compared effectiveness of cash, food
and voucher transfers for improving recipients’ food and nutrition security (Section 2.1.1). We will then consider
the compared costs of these different types of transfers (Section 2.1.2), before concluding on their cost-
effectiveness (Section 2.1.3). In each of these sections, we will present both theoretical considerations and
empirical evidences. From an empirical point of view, comparing the effectiveness and the cost of food transfers
and cash transfers is difficult because transfer programmes not only differ by the nature of the goods transferred,
but also by many other parameters (arbitrage between the number of recipient household and the amount
transferred per household, targeting, the triggering rules, context of the considered country, etc.). It is therefore
almost impossible to draw lessons on the influence of the nature of goods transferred, only by comparing existing
transfer programmes. By chance, impact assessment studies have been explicitly designed to compare food
transfers and cash transfers (and sometimes also voucher transfers). We will build on Gentilini (2015) who
compiled findings of this kind of evaluation studies conducted in ten countries.
2.1.1 Effectiveness (in improving recipient food and nutrition security)
The effectiveness of transfers in improving recipients’ food and nutrition security will be analysed by considering
both objective variables (related to their food consumption) and subjective variables (related to the satisfaction of
their preferences). We will not consider data on recipients’ nutritional status, following Gentilini’s statement that
“the multidimensional nature of malnutrition and the non-linear link between food consumption and nutrition make
it difficult to attribute a nutritional outcome to one single tool, whether food or cash” (Gentilini, 2007: 7). Following
Gentilini (2015), the effect of transfers on food consumption will be estimated through three variables: calories
consumption, food expenditures and food consumption diversity (measured through three different indicators). We
will present successively the compared effects of food and cash transfers on i) recipients’ food consumption and
ii) recipients’ satisfaction.
Effects on recipients’ food consumption. The classical (common sense) view is that transferring food (or
voucher) should be better than cash for incentivising households to increase their food consumption: cash can be
used to buy everything whereas using a food transfer or a voucher transfer to buy a non-food product requires
first reselling the food or the voucher received. However, this argument based on transaction cost has been
challenged by economic theory: theoretically, households who receive a food or voucher transfer should use it for
their food consumption and reduce their food purchases for the same amount, thereby saving money that can be
used for any purpose (Southworth, 1945). Therefore, transferring food or vouchers should not generate a stronger
incentive to consume food than transferring cash.
The empirical evidence reviewed by Gentilini (2015) does not confirm any of these theories: it appears that i) the
nature of the transfer matters (the effects of food transfers and cash transfers are often significantly different) and
ii) food transfers and cash transfers may be better depending on the variable considered and the context. In most
cases, food transfers are better for the consumption of calories and cash transfers for food expenditures (see
Figures 5 and 6 below). For the diversity of food consumption, the results are more ambiguous as, depending on
the country and the indicator, cash may be better than food or vice versa.

10
How to explain that food and cash transfers have differentiated effects on recipients’ food consumption? Three
(non-exclusive) hypotheses can be formulated:
The nature of the good transferred may matter because, in some occasion, the amount of food transferred is
higher than the needs of recipient households (related to their usual consumption of the food products received).
Technically speaking, the transfer is considered as “extramarginal”. In this situation, the households have the
choice between increasing their consumption of the received products or resell them (which is not always possible
and, in all cases, generates transaction costs). They are therefore likely to increase their consumption of the food
products received through the transfers. As, in developing countries, food transfers are mainly made of cereals or
other staples, this may explain why food transfers generate a stronger increase in the consumption of calories.
The nature of the good transferred may matter because, in many cultural contexts, the transfer is more likely to be
managed by women when it is made of food or vouchers and by men when it is made of cash (even if the cash
transfer is given to the woman). As men and women may have different preferences, this may result in
differentiated effect on the family food consumption.
The nature of the good transferred may matter by affecting the “citizenship effect” of the transfers. The citizenship
effect has been identified by observing that households increase more their food consumption when their income
increase because of a (cash, food or voucher) transfer than when it increases for other reasons (Banerjee, 2016).
It expresses the fact that transfers do not only provide additional resources to recipient households: they also
convey a message regarding what should be done with these resources. This message can generate increased
awareness and thereby emphasise importance given to the food consumption of the family. The important point
for us is that the message is likely to differ depending on the nature of the goods transferred: transferring staples
conveys the message that more staples should be consumed whereas transferring money can be interpreted as
‘spend more money on food consumption’. This may explain why food transfers usually result in a higher increase
in calorie consumption and cash transfers in a higher increase in food expenditures.
Figure 5 Relative impacts of food versus cash transfers on per capita calorie intake
Note: A positive difference in percentage points means that food transfers are better.
Source: Gentilini (2015).

11
Figure 6 Relative impacts of food versus cash transfers on food expenditures
Note: A positive difference in percentage points means that food transfers are better.
Source: Gentilini (2015).
Effects on recipients’ satisfaction. The results presented above refer to dimensions of food and nutrition
security that are implicitly related to nutrition: increasing calorie consumption, increasing food expenditures and
increasing diet diversity. However, another dimension should be taken into account: the ability of the transfers to
meet recipients’ preferences (this dimension is part of the definition of food and nutrition security, see Chapter 1).
A priori, this dimension clearly plays in favour of cash and against food. First, food transfers may not fit with
recipient habits and preferences. This is obvious in the case of extramarginal transfers as, in this situation, the
amount of food received exceed household needs for the received products, thereby forcing it to increase its
consumption of these products or resell them. This is probably the reason why recipient households living in rural
areas expressed that during the post-harvest period they prefer receiving cash transfers (Gentilini, 2007): in this
period of the year, they have stocks and the food transfers received are likely to be extramarginal. But even when
inframarginal, food transfers may not fit with recipients’ preferences if the products or qualities distributed are not
adequate. This is an extreme example but maize has been distributed in areas where it is usually only used to
feed animals. The problem is not only related to households rejecting this food or consuming it without
appreciating it. If we come back to the idea that transfers not only convey resources but also a message, we
should ask to yourself what is the content of this message when is distributed a food product considered by the
recipients as a feed product only. To sum up, as cash transfers give more freedom to choose, they are likely to
lead to a better fit between the additional consumption allowed by the transfers and recipient preferences. The
situation is in between with vouchers: they provide more choice than food transfers but this choice may be
restricted when vouchers are not accepted by a large share of retailers.
It is more than this: consumers’ preferences are not only related to the nature and quality of the food products but
also the way to get them. Again, cash transfers are likely to better as they allow the consumer to purchase where
they want (instead of having to get their food either in public shops -for food transfers- or with retailers that accept
the vouchers) and to pay exactly as other consumers (whereas paying with a voucher may be a source of
stigmatisation). The freedom to choose does not only allow to a better fit of the consumed products with
recipients’ preferences: it also has a value in itself by providing more dignity to recipient households.
Therefore, cash transfers are usually much better than food transfers to meet recipients’ preferences.
There may be exceptions however because of the already mentioned “gender effect”: in some social
groups, cash transfers are more likely to be managed by men and food transfers by women. Therefore, cash

12
transfers may be better for satisfying men’s preferences and food transfers for satisfying women’s preferences.
This is probably what explains that women often express their preference for food transfers (Gentilini, 2007).
Coherence between the objectives of improving recipients’ food consumption and recipients’
satisfaction. We considered two criteria to assess the effectiveness of transfers in improving food and nutrition
security: improvement in recipients’ food consumption and increase in recipients’ satisfaction. To what extent are
these two criteria convergent or divergent? The dominant view is that recipients know their needs better than
anyone else and are therefore the best judge of what should be done to improve their food and nutrition security.
This suggests that providing more freedom to choose (by giving a priority to cash transfers) is likely to
improve more both recipients’ satisfaction and recipients’ food consumption. This is likely to be true most
of the time, but not always. First, recipients may not be aware of their nutritional problems: Gentilini (2007: 6)
cites a World Bank report about the role of nutrition education programmes in Malawi highlighting that “while very
cost-effective in improving child health, [such programmes] are rarely demanded by communities, as they may not
be aware that their young children are deficient in micronutrients and suffer from anaemia”. Second, gender issue
may play an important role: when food transfers are managed by women and cash transfers by men, giving the
priority to cash transfers may in some occasions reduce the beneficial effect on the household food consumption
(as women are often willing to invest more than men in the consumption of their family).
2.1.2 Cost
It is usually assumed that food transfers entail higher logistical costs than cash or vouchers (the costs of
distribution are higher and additional costs are generated such as procurement and storage costs). It is also
usually assumed that leakages are likely to be higher for food transfers because of losses and potential
deterioration in the quality of the food. The question is more controversial regarding diversions: the classical view
is that “cash [is] more prone to diversion than commodities because of its greater fungibility and appeal, and
because of powerful interests within the target areas” but on the other hand “cash is […] not necessarily as visible
as large-scale commodity distributions” (Gentilini, 2007: 13). According to Banerjee (2016), preventing thefts is
likely to be more difficult for food than for cash. The overall expectation is that, most of the time, food transfers
should be more costly than cash transfers.
These expectations are confirmed by the data provided by Gentilini. Although this data should be taken very
cautiously due to its lack of reliability, it suggests that the cost of transferring food is often much higher than
the cost of transferring cash or voucher (usually between twice and four times the cost of transferring cash,
see Table 1 below). Moreover, according to Banerjee (who reviewed part of the studies reviewed by Gentilini), the
cost of food transfers may be underestimated in these studies because “the possibility of losses since the delivery
in these pilot implementations was tightly controlled”. Last but not least, the gap between the cost of cash
transfers and food transfers is likely to increase in the near future, due to the increased use of Information and
Communications Technology (ICT) (cell phones, credit cards) to transfer cash and vouchers, thereby reducing the
percentage of resources lost in logistical costs or leakages.
Table 1 Comparing the cost of food, cash and voucher transfers
Amount that reaches the recipients for each euro invested in the transfer programme
Food transfers Cash transfers Voucher transfers
Country
Mexico 0.85 0.98
Niger 0.79 0.93
Ecuador 0.78 0.93 0.92
DR of Congo 0.62 0.56
Yemen 0.83 0.92
Source: Authors’ calculus based on data provided by Gentilini (2015).
It should be noted, however, that these costs only cover the costs incurred by the transfer programme, not the
cost incurred by recipients. Receiving cash means incurring transport and transaction costs in order to get food.
This is probably the reason why “people living in remote areas distant from main markets tend to prefer food
transfers, while proximity to markets makes it easier to spend cash on the desired goods” (Gentilini, 2007: 16).

13
In addition, the empirical work done in Niger by Olivier de Sardan and the LASDEL team questions the concepts
of logistical costs and leakages (Olivier de Sardan, 2007 Olivier de Sardan et al., 2014). In a country where the
major part of the population is poor (especially in rural areas), part of the logistical costs (such as the wages of the
persons employed for handling or other activities related to food distributions) cannot be considered as being
without effect on food security (all the more so that the additional incomes earned circulate within traditional
solidarity networks). The same can be said to some extent of “leakages” linked to food being diverted to its normal
distribution channel. If part of logistical costs and leakages have an effect on food security, maybe they cannot be
considered as ‘lost’ even if they fall out of the targeted recipients of the transfer programme.
2.1.3 Cost-effectiveness
The choice between cash and food has often been presented as a dilemma between reducing logistical costs and
leakages and increasing the incentives to consume food. This dilemma is illustrated by the following (striking and
famous) example:
“In a maternal-child health programme in Honduras, it cost 1.03 lempiras to deliver 1 lempira of income
transfer in the form of a cash-like coupon, while it cost 5.69 lempiras to deliver the same income transfer
in the form of food. However, the cash transfer had no effect on child’s calorie consumption nor on use of
the health centres, while the food transfer increased both” (Sanghvi et al, 1995 cited by Rogers and
Coates 2002).
The debate has recently evolved from the above presented dilemma toward the idea that cash (or voucher)
transfers are more cost-effective than food transfers, most of the time: their costs are much lower and likely to
decrease a great deal because of their increasing use of cell phones or smart-cards; the effectiveness of food
transfers is not systematically higher (as we saw, it depends on the context and the considered variables). Data
confirms the view that cash transfers are frequently (but not always) more cost-effective in improving
recipients’ food consumption. In Ecuador, it has been estimated that increasing the calories consumed by 15%
would cost $10.78 with food transfers, $7.58 with cash transfers and $4.50 with voucher transfers (Hidrobo et al.
2014), whereas in Bangladesh, increasing the calories consumed by 100 kcal, will cost Tk249 with food transfers
and Tk255 with cash transfers (Ahmed et al., 2010). In both cases, cash was transferred at a lower cost but its
effect on calorie consumption was also lower. In addition, cash transfers are also often better to improve
recipient satisfaction.
However, it may also occur that, in the same country, food transfers are more cost-effective for some food and
nutrition security objectives (for instance increasing calorie consumption) and for some regions or for some social
groups (for instance, persons living far from markets and social groups where women manage food transfers and
pay more attention than men on the food consumption of the family).
Figure 7 Evolution of the wheat purchasing power of the cash transfers provided by Ethiopia’s PSNP
Source: Rashid and Taffesse (2009).

14
In addition, cash transfers may prove to be ineffective in periods of high inflation rates because in these
situations, the purchasing power of the amount transferred is decreasing over time (see Figure 7 above for the
example of Ethiopia’s Productive Safety Net Programme or PSNP). It is of course possible to increase the amount
transferred but, if the increase in food prices is ongoing, many successive adjustments will be necessary. The
amount of the cash transfers can also be indexed on the Consumer Price Index (or the CPI for food products). But
then there is the risk of exacerbating the inflation of food prices. Therefore, there may be some reasons for
shifting to food transfers in periods of high inflation rates.
The practical implication is that, as cash transfers are often more cost-effective than food transfers to
improve recipients’ food and nutrition security, they should be considered as the default option. This in
line with the recommendations of the European Commission (2012 and 2015). However, specific situations,
regions or social groups do exist where it is worth considering if a mix (cash and food transfers) is
required, or if food transfers alone would be more suitable (as acknowledged in European Commission,
2012).
2.2 To what extent are food reserves necessary to supply permanent food
transfers?
When permanent food transfers are implemented, public purchases are required to supply them. As their needs
are known in advance, it is possible to make these purchases in advance or on a just-in-time basis. Just-in-time
purchases do not mean that the food procured is immediately distributed: managing logistical timelines usually
requires storing them for at least some days or some weeks. However, they reduce the length of public storage
(and thereby storage costs) and, for that reason, they may be preferred.
However, in some occasions, it is relevant to purchase much more in advance (thereby increasing the length of
public storage). This is especially the case when:
• There is a risk of shortages: then just in time purchases may be complicated or take too much time.
• Prices are highly unstable: then the cost of just in time purchases is unpredictable, generating a risk that,
most of the time, cannot be hedged efficiently (lack of future markets for the considered commodities, high
basis risk, high cost).
• Purchasing immediately after the harvest would increase food quality and safety: it may occur in some
developing country when, because of the lack of infrastructures of private companies, public storage is
safer than private storage.
• Purchasing immediately after the harvest would reduce food costs. This is the case when the seasonality
of producer prices is excessive. The seasonality expresses the fact that prices usually decrease with the
arrival of the new harvest, then increase progressively until reaching its highest levels in the months
preceding the next harvest (the lean season). This seasonality of prices is normal: as harvests are
concentrated in time and consumption is daily, there is a need for intra-annual storage, which is costly.
The seasonal pattern of prices therefore reflects these storage costs. However, in many developing
countries, the seasonality of prices is excessive: the price difference between the lean period and the
post-harvest period is higher than storage costs. This situation is frequent in developing countries because
farmers - indebted with traders or relatives and with very limited access to formal credit- have to sell a high
share of their production just after harvesting, thereby provoking a collapse of producer prices during the
post-harvest period. This is why the seasonality of producer prices is usually much higher than the normal
seasonality of prices (accounting for storage costs) reflected by the seasonal pattern of consumer prices
(see Figure 8 below). In this situation, procuring food during the post-harvest period is a way to both
reduce the cost of public purchases and to smooth the excessive seasonality of producer prices.

15
Figure 8 Seasonality of sorghum producer price and consumer price in Mali
Recommendation Box 1
FR may have a role to play for fighting against chronic food and nutrition insecurity: they may be useful
for supplying regular food transfers to food insecure households. Their role depends on two debates: whether it
is more cost-effective to transfer food than cash or vouchers and, in case food transfers are better, whether it is
more cost-effective to supply them through FR or just-in-time purchases.
Food transfers tend to be costlier to administer than cash and voucher transfers and they are not always more
effective in increasing the level or the diversity of food consumption. As they give less choice to recipient
households than cash transfers, they are likely to give these households less dignity and less opportunity to
satisfy their preferences. For these reasons, providing cash transfers is a more cost-effective way (than food
transfers) to fight against chronic insecurity, most of the time. In this situation, there is of course no need for FR
to supply transfer programmes.
However, situations do occur where food transfers are more cost-effective for specific food and nutrition
security objectives (e.g. increasing the consumption of calories or specific nutrients) or specific social groups.
For instance, when cash transfers are managed by men and food transfers by women, food transfers may have
a stronger impact on the family food consumption (and contribute to empower women). This may give
arguments for providing both cash and food, as already done by several safety nets (such as Ethiopian PSNP).
Cash may be provided in specific regions or social groups and food in other. Or both cash and food can be
distributed to the same households, in order to provide them with the right incentives for the different
components of food consumption. In all cases, the choice should be based on empirical evidence: the existing
knowledge on food consumption habits and social practices should be mobilized and, in some occasions, pilot
projects may be run.
When permanent food transfers are implemented, it is often possible to supply them through just-in-time
purchases, which allows reducing the length of public storage (and therefore its cost). In some situations,
however, purchasing in advance is a more cost-effective option. It may be the case for food safety reasons or
when there is a risk of shortages or sharp price increases. It is also the case when the seasonality of producer
prices is excessive: then, procuring food during the post-harvest period is a way to both reduce the cost of
public purchases and to mitigate the collapse in prices that occurs during this period of the year. In practice, all
these issues are more likely to occur when the food products distributed are produced locally, although they
may also occur when they are imported, especially if the country is a big importer.

16
WHICH ROLE FOR FOOD RESERVES IN MANAGING FOOD CRISES?
Food crises occur when the access to food of many households collapses at the same time, generating a sharp rise in hunger and malnutrition rates at local, national, regional or global levels. Depending on each household’s situation, the collapse in access to food may result in reduced or less diversified food consumption (potentially resulting in deficiencies in calories and nutrients), and reduced health expenditures (potentially affecting the ability of the body to absorb the consumed nutrients). They may also constrain households to dig into their savings or sell assets or engage in risky or damaging behaviours, thereby reducing their capital and resilience and affecting their food and nutrition security in the medium run. The internationally agreed definition of food crises acknowledges these different dimensions. This definition (provided by the Integrated Food Security Phase Classification or IPC) is based on four “food security outcomes”: food consumption, nutritional status, mortality and livelihood change (see IPC Global Partners, 2012). It states that there is a food crisis in a given area when “even with any humanitarian assistance at least one in five households in the area have the following or worse: i) food consumption gaps with high or above usual acute malnutrition or ii) are marginally able to meet minimum food needs only with accelerated depletion of livelihood assets that will lead to food consumption gaps”. IPC also provides a classification of the severity of food crises, the most severe type being the famine.
After presenting the drivers of food crises (Section 3.1) and the set of possible interventions that can be
implemented (Section 3.2), we will consider the role of FR for managing two major drivers of food crises: income
collapses (Section 3.3), and shortages or price surges on food markets (Section 3.4). We will then conclude on
implications for the design of FR (Section 3.5).
3.1 Drivers of food crises
3.1.1 Two major drivers
The classical framework of food and nutrition security presented in Chapter 1 identifies three drivers for food
crises: collapses in i) physical access to food (lack of availability), ii) economic access to food (sharp increase in
food prices and/or collapse in the income of many households) and iii) utilisation of food. The last category
(utilisation) is related to situations where people are not able to cook and consume the food they have (for
instance the lack of drinkable water) or where their body is not able to absorb the consumed nutrients
(epidemics). It has very few connection with FR and will therefore not be considered in this report. We will
therefore focus our attention on the two first drivers.
For the purpose of analysing and managing food crisis, the distinction between problems related to physical
access to food (lack of availability) and economic access to food is not really relevant. First, there is a large
overlap between the two because when the availability of food in a given area is not sufficient to cover the needs
of the population, it often results in high food prices that generates economic access problems for the poorest
households. Second, there is a strong heterogeneity among the factors that lead to a limited economic access to
food. Some of them are related to food markets (increased food prices), whereas other are related to the collapse
in income of specific categories of households.
Therefore, instead of using the classical distinction between problems of physical and economic access to food,
we will consider two main drivers: i) a collapse in the income of some categories of households and ii) a
tension on food markets resulting in shortages and/or sharp increases in food prices. The two drivers
result in sharply reducing household access to food. But they may affect different households.
The two drivers can play jointly or separately. Sen (1981) showed the theoretical possibility of crises only
provoked by income collapses, although this type of crisis seems to be rather infrequent. Typical examples of
crises due only to food price increases are crises provoked by a spike in international prices (as occurred in
2008). Crises due to internal causes generally encompass both income collapse for some categories of
households and increased food prices. For instance, major droughts, affecting production, often result in
increased staple prices. But they usually also reduce the endowments of farmers (surplus farmers have less to
sell; deficit farmers have more to buy) and pastoralists (many animals die or become thinner because of the lack
of water and pasture). The price of animals usually goes down: animals became thinner and their supply is
increased because, due to increased staple prices, pastoralists have to sell more animals to get the same
quantity of staple. From farmers and pastoralists (the first categories hit), the food crisis may spread to their
employees (e.g. agricultural workers) and all categories that sell them goods and services.

17
3.1.2 A typology of food market situations
As we will see, taking into account the situation of food markets is critical for designing an adequate response to
food crisis (and determining the role for FR in this response). Table 2 below provides a typology of possible
situations of food markets during food crises.
Table 2 Possible situations of food markets during food crisis
Situation 1: No sharp increase in food prices
Situation 2: Food prices sharply increased and stabilised at a higher level (the supply can be increased at a
constant cost)
Situation 3: Food prices are sharply increasing
Situation 3a: the supply can be increased but at an increasing cost
Situation 3b: the supply cannot be increased (or cannot be increased enough)
Situation 4: No food products available on the markets of the considered area
Source: Authors.
Situation 1 refers to food crises without any tensions on food markets. As already mentioned, Amartya Sen
highlighted the theoretical possibility of such type crises (only due to income collapses), although they seem to be
rather infrequent (even the examples provided by Sen have been challenged, see for instance Devereux 1988).
Situation 2 refers to situations where the shock that initially provoked an increase in food prices is absorbed.
Therefore prices are higher but stable. This is typically the situation of (importing or exporting) countries hit by an
increase in international prices. This is also the situation of countries that, because of a bad harvest, have to
import food at a higher (but stable) price.
Situation 3 refers to situations where food price are sharply raising because the supply on the domestic market i)
can be increased only at an increasing cost (Situation 3a) or ii) cannot be increased or only to some extent
(Situation 3b). These situations are typical of food products non-traded on international markets: they can be
found on regional markets but only to some extent and often at an increasing cost, because increasing imports
means attracting the supply from more remote producing areas. An example is provided by the 2012 food crisis in
Sahel countries (see Box 7): millet and sorghum were in Situation 3b (the bad harvest hit all the West African
producing area impeding recourse to imports), whereas maize was in Situation 3a (importing was possible at an
increasing cost until the price level in the Sahel was enough to attract the maize from West Africa coastal area).
Situations 3a and 3b are also typical of the situation of big importing countries (countries whose imports account
for a significant share of the quantity traded on international markets). These countries may face difficulties to
found on international markets the quantity they need and, of course, the higher this quantity, the more they have
to pay for it. Situation 3b is typical of importing countries facing long timelines to get imports either because they
are landlocked or big countries. Or because international markets are in crisis, as happened in 2008 in
Bangladesh because of the crisis on the international rice market (see Box 4).
Situation 4 refers to situations where some food products are completely absent of the markets of the considered
area. This usually corresponds to situations where natural disaster or political conflicts generate isolated areas or
a disruption in supply chains.
Situations 2, 3a and 3b represent a problem of economic access to food for the poorest households. Situations 3b
and 4 encompass a problem of physical access to food. Note that the physical access to food implies not only that
stocks are enough to cover the needs, but also that a significant share of these stocks is supplied on markets.
Situation 4 for instance does not mean that nobody in the considered area hold the food products missing on
markets. It rather means that nobody is willing to sell them: people hoard stocks because they want to speculate
or because they fear for their own future consumption. Similarly, in Situation 3b, prices can increase more than
would be justified by the level of availability because in a situation of uncertainty, people hoard their stocks (this is
probably what happened for rice in Bangladesh in 2008, see Box 4). This is something important to note because,

18
in these situations, having enough food stored in FR is likely to discourage stock hoarding, thereby exerting a
leverage effect on the release of private stocks.
Among food markets, a specific attention should be given to staples (cereals, roots and tubers that provide a
significant part of the dietary calories). This is because, in developing countries, staples often account for an
important share of households’ total expenditures (Table 3). Therefore, sharp increases in staple prices endanger
not only the consumption of staples (and thereby the caloric intake) but also the consumption of other foods:
many households have to reduce the diversity of their consumption in order to maintain their staple consumption
level. Some households may also reduce their health expenditures or their capital and savings (thereby becoming
less resilient to face future crises). As most food insecure households are net staple buyers (including in rural
areas), sharp increases in staple prices are very damaging for food and nutrition security.
Table 3 Proportion of grain in the diet and household expenditures in Mali
Proportion of grain in dietary calories
Proportion of grain in food expenditures
Proportion of grain in total expenditures
Average for rural households
86.0% 51.1% 34.9%
Average for the poorest 20% of rural households
88.6% 57.6% 44.3%
Average for the richest 20% of rural households
82.0% 44.1% 26.5%
Average for urban households
73.1% 31.9% 18.4%
Average for the poorest 20% of urban households
78.6% 38.5% 27.3%
Average for the richest 20% of urban households
68.0% 27.4% 13.6%
Source: Bocoum (2011).
Of course, among staples, the attention should be paid to the market situation of the staples most consumed by
the poor.
3.2 Possible interventions for managing food crises
Managing food crises means implementing interventions to protect the food insecure households affected. For
individuals with severe acute malnutrition, actions of nutritional rehabilitation (therapeutic feeding programmes)
have to be implemented. FR do not have a decisive role to play in this area, although having stocks of highly
nutritional food products may in some occasion be useful (it is for instance planned that 5% of ECOWAS Regional
Food Security Reserve should be made of enriched flours). But, of course, it is better to manage food crises
through earlier interventions aiming to maintain the access to food of poor and vulnerable households. Two types
of interventions can be used for that: emergency transfers targeted to food insecure households and measures to
mitigate food price increases.
Emergency transfers. Contrary to permanent transfers used to fight against chronic malnutrition (analysed in
Chapter 2), emergency transfers are activated only in a period of crisis (or even during peaks in a prolonged food
crisis). Like permanent transfers, emergency transfers can be provided in food or cash, the choice between these
two options depending on their comparative cost-effectiveness for improving recipient food consumption and
nutritional status. If permanent transfers (safety nets) are already in place, they may be used as a basis for
emergency transfers (although they need some adaptation: the amount transferred to the recipients hit by the
crisis should be increased and new recipients should be included). Emergency transfers are necessary to support
the food insecure households whose income collapsed (they often belong to specific categories such as farmers,
agricultural workers or pastoralists). They can also be useful to support the food insecure households hit by
increased food prices (because they are net buyers of the considered food products).
Interventions to treat shortages or mitigate food price increases. Countries can mitigate shortages and price
surges on food markets by increasing the quantity available on the domestic market. Three types of interventions
can be implemented: measures to restrict exports, measures to stimulate imports and FR releases. Table 4 below
summarises the different types of interventions that can be implemented to manage food crises.

19
Table 4 Possible interventions to manage food crises
Emergency transfers
Cash or voucher transfers
Food transfers
Market interventions to increase availability and mitigate price increases
Measures to restrict exports
Measures to stimulate imports
FR releases
Source: Authors.
Potential inflationary effect of emergency transfers. Note that, when implemented in a context of raising
prices, emergency transfers may result in exacerbating the price increases. This is especially the case
when transfers are provided in cash or vouchers: these transfers increase recipients’ purchasing power,
thereby generating an additional demand for food products (especially staples) that exert an upward pressure on
prices. This is also the case when food transfers are provided, if the food is purchased at the last minute on the
domestic market (as public purchases exert an upward pressure on prices). The inflationary effect of emergency
transfers is highly problematic because it generates detrimental effects for the households non-covered by the
transfers. As part of these households are food insecure (they were not covered by the transfers because of the
imperfectness of the targeting or because it is the inflationary effect of the transfers that render them food
insecure), this raises both food and nutrition security issues and ethical issues. The inflationary effect of transfers
is likely to be negligible in a context of stable prices, both when prices remained stable during the crisis (situation
1 described in Table 2) or when prices increased and then stabilised at a higher level (situation 2). However, in a
context of increasing prices (as is often the case during food crises, (situations 3a and 3b), it should be taken into
account, and managed.
Potential roles for FR in implementing interventions to manage food crisis. This brief overview of possible
interventions to manage food crises shows that the potential roles of FR are the following ones:
• Supply emergency food transfers;
• Back cash or voucher transfers with food sales (at the same moment, in the same localities) in order to
compensate for their inflationary effect;
• Increase food availability in periods of shortages;
• Mitigate food price increases.
3.3 Principles of intervention
Three general principles should guide the choice of interventions:
• Principle 1. The physical access to food should be guaranteed, meaning that i) the quantity of food
available in the considered area is sufficient to cover the needs of the population and ii) a significant share
of these stocks is supplied on markets (we will see that in some situations stock hoarding may occur, even
when stocks are enough to cover the needs).
• Principle 2. The problem of economic access to food generated by food price increases should be
managed. As explained above, this may mean i) providing food insecure households with emergency
transfers, ii) implementing market intervention to mitigate price increases or iii) combining both.
• Principle 3. When transfers are implemented, their potential inflationary effect should be managed (for the
reasons explained in Section 3.2). This implies that, when an inflationary effect is feared (because food
prices are increasing), either the transfers should be provided in food (and supplied through imports or FR)
or when, for some reasons, cash or voucher transfers are preferred, they should be backed by public
sales to increase availability in the considered area.

20
3.4 Which role for food reserves in managing food crises?
A preliminary remark is that when the crisis is due to income collapses, there is no need for FR: these
income collapses can be treated through emergency transfers in cash, voucher or food procured through
just-in-time purchases. The role for FR in managing crises is therefore related to the existence of tensions on
food markets (shortages or sharp price increases).
More precisely, the role of FR in managing food crises depends on:
• The trade status of the country for the considered food products: this status determines the available
options to manage the tensions on domestic food markets, as the country’s ability to release these
tensions by regulating exports or imports strongly depends on whether the considered food products are
exported, imported or not traded on international markets.
• The magnitude of the tensions on food markets: in case of shortages (situations S3b and S4) or sharp
price increases (situations S3a and S3b), it is necessary to increase availability in order to comply with
Principles 1 and 3. In some situations, this may require increased need for FR.
• The elected policy mix between emergency transfers and market interventions to comply with Principle 2:
generally speaking, market interventions require a higher quantity of food than transfers (cash and
voucher transfers do not require food and food transfers require a lower quantity of food because they are
targeted). This means that the need for FR may increase with the weight of market intervention measures
within the policy mix. Note that, although this policy mix is strongly constrained by the country trade status
and the tensions on food markets, it is not determined by them: there is therefore a space for a policy
choice. This choice is in fact a trade-off: less market interventions means higher food prices and results in
a higher number of food insecure households that should be covered by emergency transfers.
Correspondingly, emergency transfers covering only a low share of food insecure households render more
necessary the mitigation of food price increases.
We will consider successively the case of food products exported on international markets, imported from
international markets and not traded on international markets (non-tradable products such millet and cassava).
For each category of products, we will present the need for FR, depending on the situation of food markets and
the weight of market interventions within the country policy mix.
3.4.1 The case of exported food products
Possible market tensions. By definition, there is no shortages in the country for these products (no problems of
physical access to them) and transfers are unlikely to provoke inflationary effects. However, there may be
problems of economic access to these food products because their price may be high and increasing, depending
on the level and dynamics of international prices.
Possible policy responses. The country has a very powerful mean to stabilise or reduce the price of these
products: restricting exports. Export restriction measures (which are fully allowed by the WTO) usually allow for
mitigating staple price increases effectively, almost immediately and at a zero cost for the government. If for
instance the government wants to hold the price of product A below the level P*, the only thing it has to do is to
implement a tax on A exports in order to align A export parity price (A international price minus taxes on exports)
with P*. These kinds of policy may have some inconveniences: they may affect the country’s foreign currency
reserves; they may be circumnavigated (for the example of rice in India in 2008, see Timmer, 2010); they may
contribute to exacerbating the increase in international prices (as occurred with the rice market during the 2008
crisis, see Chapter 6). However, export restriction measures are the only way the country has to release tensions
on its domestic food market. The only alternative it has is accepting high domestic prices, which means
substituting part of its free price stabilisation policy by costly emergency transfers.
Role for FR. Whatever the policy mix elected by the country, FR are useless: the only way to stop price increases
is implementing export restriction measures (FR releases would just result in increasing exports); if the country
chooses to implement food transfers, it can supply them through just-in-time purchases.
21
3.4.2 The case of imported food products
Possible market tensions. Two situations should be distinguished because they require a different policy response
(and a different role for FR). Let us call them A and B. In both situations, food prices sharply increase on the
domestic market but in situation A the domestic price PD is equal to the import price cost PM, whereas in situation
B, it is higher.
Situation A (where PD = PM) describes the case where food prices are increasing on the domestic market because
international prices are increasing (or because the country’s exchange rate is decreasing). In this case, there is
no shortage on the domestic market and emergency transfers are unlikely to generate inflationary effects.
Situation B (where PD > PM) describes the case where food prices are increasing on the domestic market because
of a bad connection with international markets. This bad connection may stem from quantitative restrictions on
imports or longer than usual import timelines: there may be a crisis on international markets (as occurred in 2008
on the rice and wheat markets), the country import needs may be higher than usual (because of a very bad
harvest) or the country or concerned area may be isolated by conflicts or natural disasters. In situation B, private
stocks may be insufficient (or believed to be insufficient) to cover the needs of the population, which may lead to
panic purchases and stock hoarding behaviours (by traders but also farmers and consumers). These behaviours
are motivated either by speculation or by the fear of not being able to satisfy the food consumption of the family.
They may provoke or exacerbate shortages.
Possible policy responses. When the domestic food market is in situation A, there is no shortages and transfers
are unlikely to generate inflationary effects. Therefore there is no issue related to Principles 1 and 3. A policy
response is nevertheless necessary to comply with Principle 2 (guarantee the economic access to food to
vulnerable households). This can be done either by providing them transfers or by reducing the level of the
domestic price (or by a mix of these two options). The best way to reduce the domestic price PD is to reduce
import taxes (or even subsidise imports). If for instance the government wants to hold the price of an imported
product Y below the level P*, the only thing it has to do is adjusting the Y import tax rate tM: reducing tM (possibly
until it becomes negative, which means subsidising imports) in order to align Y import parity price PM (Y
international price plus import taxes or minus import subsidies) with P*. In some occasions, these measures are
ineffective: importers may not pass on the tax reduction in their selling price (especially when the grain import
sector is not competitive as is often the case in developing countries) or the product imported with subsidies may
be re-exported to other countries (especially when the country is unable to secure its borders). Even when
effective, these measures are costly: imports are less taxed or even subsidised. In some occasions, this may
justify a lower reduction in the domestic price and more reliance on emergency transfers. Whatever the elected
policy mix, FR are generally useless in situation A: varying import taxes and/or providing transfers is enough and,
if food transfers are provided, they can be supplied through just-in-time purchases. The only case where FR can
be useful in situation A is for big importing countries (countries whose imports account for a significant share of
the quantity traded on international markets). For these countries, it may be relevant to rely more on FR and less
on imports because when they increase their imports, this is likely to increase the international price, thereby
rendering imports more costly.
When the domestic food market is in situation B, shortages may occur and transfers are likely to generate
inflationary effects. It is therefore necessary to increase the quantity available on the domestic market to comply
with Principles 1 and 3. This means removing quantitative restrictions to import if any (see Box 4 for the
experience of Bangladesh in 1998). The problem is that importing takes time (this is for instance the challenge
faced by MENA wheat-importing countries, see World Bank and FAO, 2012). Meanwhile, the only way to cover
shortages, prevent any inflationary effect of transfers and maintain domestic prices at reasonable levels is
recourse to FR.
Note that situations may occur where the problems of situation A and situation B coexist: the domestic price is
higher than the import parity price (PD > PM) and PM is too high. This is especially the case when there is a crisis
on international markets: PM sharply increases and import timelines may become longer and uncertain, which
may lead to PD > PM (as happened in some countries during the 2008 crisis). In these situations, the policy
responses of situations A and B should be mixed: imports taxes should be removed, while FR are used to
manage import timelines.
22
Role for FR: managing import timelines. In situation A, there is no need for FR: reducing import taxes and/or
providing transfers is enough (except perhaps in the case of big importing countries for which relying on FR may
be a relevant option because, for these countries, increasing imports may result in increasing the international
price and thereby the cost of imports). In situation B, the role of FR is supplying transfers and markets during
import timelines to end shortages, to prevent any inflationary effect of transfers and, if possible, to
reduce the domestic price (ideally to its parity price level). This can be illustrated by the following example. Let
us assume that the domestic price is 140 whereas the import parity price (in line with the international price) is
100. This means that i) imports are impossible or delayed and ii) local supply is not sufficient to cover import
timelines (either because private stocks are not enough or because there is stock hoarding). When imports will
arrive in some months, the domestic price will be reduced to 100. But meanwhile shortages are likely to occur,
transfers are likely to generate inflationary effects, and the domestic price is likely to remain at a high level (or
even to increase more). In this situation, there is a need for FR to supply markets during import timelines. The
quantity released by the FR should at least be enough to remove shortages and prevent any inflationary effect of
transfers (by supplying food transfers or accompanying cash or voucher transfers) but it can be higher in order to
reduce the domestic price. The price target can for instance be 130 or 110 or 100 but it should remain superior or
equal to 100 (reducing it below 100 would mean that the traders that previously imported food would lose money).
The choice of the level of the target price has of course strong implications for the required size for FR (the lower
the target price, the higher the need for FR). Note also that aligning a domestic price with its parity price level
does not imply that FR should cover 100% of the needs during import timelines: private stocks are usually not nil
and FR interventions are likely to have a leverage effect on private supply by discouraging stock hoarding. The
experience of Bangladesh in 2008 illustrates the need for significant FR when import timelines become longer and
uncertain (see Box 4).
3.4.3 The case of food products non-traded on international markets
Possible market tensions. This is the situation where products essential for the food and nutrition security of poor
households are not traded on international markets (e.g. millet, sorghum, cassava, specific variety of maize). For
these products, shortages and sharp price increases are more likely to occur. This is because their prices are not
capped by an import parity price (because they are not traded on international markets). Sometimes, they may be
capped by the parity price of substitutes traded on international markets, but often at a very high level: in 2005, in
Sahel countries, the price of millet and sorghum stabilised when it reached the price level of imported rice, but it
was after a 150% price increase (see Box 7). Of course, in this context, emergency transfers are likely to
generate inflationary effects.
Possible policy responses. There is a need to increase availability to end shortages, to compensate for the
inflationary effect of transfers and, if possible, to mitigate sharp price increases. As these products are usually
traded on regional markets, there is some room for manoeuvre to increase their availability by regulating imports
and exports. However, the stabilising effect of regional markets is often quite limited. First, export restriction
measures are likely to be circumnavigated (for an example, see Staatz et al., 2008). Second, the quantities
available for import may not be sufficient, especially since neighbouring countries are likely to be hit at the same
time by the same natural hazards (as illustrated by the case of millet and sorghum in Sahel countries during the
2005 and 2012 crises, see Box 7 and ECOWAS Regional Reserve case study). Third, transport cost and delays
are often high: increasing imports often requires attracting the supply of more remote producing areas, meaning
that increased imports result in higher prices (as illustrated by the case of maize in Sahel countries during the
2012 crisis, see Box 7). Therefore there is a need for FR.
Role for FR. FR should at least compensate for shortages and manage the inflationary effect of transfers. FR
should also, if possible, mitigate food price increases. Therefore the role of FR is the same as for imported
products except that the period where FR are needed is likely to be much longer (the entire crisis period
instead of import timelines). This implies that the required size for FR is likely to be higher for these products.
3.4.4 Synthesis on the role for food reserves in managing shortages and price surges on food markets
The role of FR in managing shortages and price surges on food markets is summarised on Table 5 below.

23
Table 5 Role of food reserves in managing shortages and price surges on food markets
Role for FR depending on the situation of food markets
Exported No need for FR: no shortages, no inflationary effect of transfers, no
effectiveness of FR for mitigating price increases (the only way to do so is
restricting exports)
Trade status of
the considered
food products
Imported Need for FR to manage import timelines in situations where private
stocks are not sufficient to meet the population needs during these
timelines (shortages on markets, price higher than the import price cost).
In these situations, FR should be used to:
➔ Supply markets (in case of shortages)
➔ Supply food transfers or back cash or voucher transfers with sales in the concerned localities
While the domestic price is higher than the import price cost, FR can also
be used to:
➔ Supply sales aiming to reduce the domestic price (if possible until it reaches the level of the import price cost)
For big importing countries, the need for FR can go beyond managing
import timelines: it may be relevant to substitute part of the required
imports by FR releases
Non-traded on
international
markets
Need for FR during the entire crisis period in situations where food prices
go on increasing. In these situations, FR should be used to:
➔ Supply markets (in case of shortages)
➔ Supply food transfers or back cash or voucher transfers with sales in the concerned localities
FR can also be used to:
➔ Supply sales aiming to reduce the domestic price
Source: Authors.
Therefore, the need for FR depends on:
• The trade status of the considered food products: no need of FR for exported products, possible need of
FR during import timelines for imported products, possible need of FR during the entire crisis period for
non-tradable products;
• The situation of food markets: existence of shortages (situations S3b, S4), probable inflationary effect of
emergency transfers (situations S3a, S3b), magnitude of price increases;
• The respective weights of market interventions and emergency transfers within the policy mix to manage
the food and nutrition security issues generated by sharp price increases: market interventions usually
require greater quantities and therefore potentially higher FR.
Note that, whereas the first two parameters are exogenous variables for the country government (at least in the
short run, during the crisis), the third one is a matter of policy decision. Indeed, the government can choose to rely
more on mitigating price increases (which results in less food insecure households and allow reducing the
coverage of emergency transfers) or on the contrary invest more in emergency transfers which allows affording
higher food prices. Here below are the main criteria for determining the weight of market interventions within the
policy mix:
• The weight of food insecure households within the total population: the lower this weight, the higher
should be the weight of emergency transfers. When food insecure households account for a small share of
the population, transfers are likely to be more relevant because market interventions (that are non-
targeted) generate a high level of what can be considered as “leakages” from the point of view of food and
nutrition security.
24
• The cost-effectiveness of emergency transfers (in the considered country). It depends on several
parameters (including the form, value and timing/frequency of the transfers) but one of its main
determinants is related to the cost-effectiveness of targeting. From a general point of view, targeting tends
to be very costly (in terms of surveys) and have a limited effectiveness (see for instance Brown et al.
2016). In fact, there is a trade-off between the inclusion error rate, the exclusion error rate and the cost:
reducing one of them often implies increasing at least one of the two others. This is why the “targeting
obsession” (aiming to reduce the error of including non-food insecure households among the recipients)
has been criticised by many experts. Note that the difficulties related to targeting are not only (sometimes
not mainly) technical: targeting is also likely to generate political economy issues as decision-makers are
likely to receive pressure to provide transfers to specific social groups. Whatever the reasons may be,
many cases have been reported where the targeting is very poor, particularly in emergency situations.
Last but not least, targeting can generate social costs. These costs can be expressed through social
resistance to targeting, due to its potential damaging effects on local communities. In the Sahel for
instance, many cases have been reported where, in order to release tensions, when the persons in charge
of implementing the transfers have left the village, all the transfers are bulked and allocated equally
between all the members of the community (see Annex 2). In other situations, the fact of being classified
as ‘poor’ or ‘food insecure’ may generate stigmatisation issues. Therefore, depending on the social
context, emergency transfers may be more or less difficult to implement, and generate more or less social
costs. And, of course, these dimensions should be taken into account when determining the weight of
emergency transfers with the policy mix to manage the food and nutrition security issues generated by
increased food prices.
• The length of the period during which FR sales are necessary: as mitigating food price increases requires
higher quantities of food than emergency transfers, it is obviously more feasible when the period is limited
to import timelines than when it covers the entire crisis period (as is often the case for non-tradable food
products).
3.5 Designing food reserves to manage food crises
In the previous sections, we analysed the role of FR in managing crises. We showed that this role is limited in
time depending on the trade status of the considered food products: no role for exported products, potential role
during import timelines for imported products and potential role during the entire crisis period for non-tradable
products. We showed that the role of FR depends on the situation of food markets: in case of shortages, FR have
a decisive role to play in supplying markets; in case of tensions on the market price (price higher than the import
price cost for imported products, continuously increasing prices for non-tradable products), FR have a role to play
to manage the probable inflationary effect of emergency transfers. This applies both to the transfers to food
insecure households whose income collapsed and to food insecure households hit by sharp food price increases.
FR can be used to manage the inflationary effect of transfers either by supplying food transfers or by supplying
food sales in the localities where cash or voucher transfers are implemented. Finally FR can also be used to
supply market interventions aiming to further reduce food prices.
Some experts recently argued that every time FR seem to be useful or necessary to manage food crises, an
alternative option is increasing the level of private stocks by subsidising private storage. This option has been
recently debated by experts and international organisations (see for instance OECD 2015a). It therefore deserves
to be discussed, although it appears that it is not really convincing (for more details on this issue, see Annex 1).
The only case where relying on supporting private storage may work is the case of very small importing countries
where strategies to guarantee a minimum level of private stocks may be implemented (see Box 6).
Until now, all the considerations of this chapter have been about how existing FR can be used to manage crises.
However, the problem is not only how to use for FR when a crisis occurs but also which FR should be built in
anticipation of crises. Apart from technical issues such as the physical management of the FR (not dealt with in
this report) and governance issues (dealt with in chapter 5), designing FR encompasses three main dimensions:
the choice of the products to be included in the FR (Section 3.5.1), the determination of the quantities that should
be stored (Section 3.5.2) and the determination of the rules to trigger the use of the FR (Section 3.5.3). We will
consider successively these three dimensions.

25
3.5.1 Choosing the products to be included in the food reserves
From the previous sections, it appears clearly that the products to be included in FR should satisfy three
criteria: i) be important for the food and nutrition security in the considered country, ii) be imported or
non-tradable and iii) be vulnerable to shortages or sharp price increases. The first two criteria are quite clear
but the third one deserves some comments: what does it mean for a food product to be “vulnerable to shortages
or sharp price increases”?
Imported products are vulnerable to shortages or sharp price increases if, in some occasions, private stocks may
become unable to cover the needs and the demand during import timelines. This situation occurs when import
timelines become longer and uncertain. A possible situation is when the country or specific areas within the
country become isolated because of conflicts or natural disasters. In this situation, FR should cover the main food
products that are usually imported and important for their food and nutrition security. However, this situation is
likely to be rather exceptional.
For most countries, the risk of private stocks being unable to cover the needs during import timelines exists only
for specific food products. This is in particular the case of:
• The products for which the country’s import volume accounts for a significant share of the quantity traded
on international markets. For these products, the country may have difficulties to get the quantity it needs
on international markets: it may fail or, at a minimum, face long import timelines. When it succeeds, it often
has to pay a high price because when it increases its imports it pushes up international prices. For these
products, the country’s interest is to rely less on imports and more on FR (doing so is also a good thing for
the stability of international markets, see Chapter 6).
• The products whose international markets are vulnerable to shortages. In practice, the products
concerned are mainly cereals. This is because shortages on international markets are often provoked by
trade policies such as export restrictions and panic imports (see Chapter 6 for the example of the 2008
crisis on international rice and wheat markets), and because these policies are often motivated by the high
importance given to cereals in many countries (for food security and political stability purposes).
• The products whose production is highly sensitive to natural hazard in the considered country (rendering
the harvest volume highly unstable).
Non-tradable products “vulnerable to shortages or sharp price increases” have the same characteristics as
vulnerable imported products but on the regional – instead of international – market. However, the probability of
having these characteristics is much higher for non-tradable products: it is much more frequent for a country to be
a big country on its regional market than on international markets. And the risk of disruption in supplying sources
is higher on regional markets than on international markets because bad harvests are more likely to be correlated
in neighbouring countries. This is the situation experienced by Niger in 2005: during many years, Niger used to
compensate for its structural deficit in millet and sorghum by importing from Northern Nigeria. As Niger needs are
small compared to the production in Northern Nigeria, there was a high confidence in the stability of this supplying
source. However, in 2005, the harvest was really bad both in Niger and in Northern Nigeria, resulting in this region
importing sorghum from Niger, thereby exacerbating the crisis in Niger (for more details, see ECOWAS regional
Reserve case study).
The problem is more complex however than suggested by this “product by product” analysis. Indeed, in some
occasions, it is possible for the country to solve food and nutrition security issues generated by market
tensions on a food product by acting on another food product. Two cases should be considered:
• Release the tensions on the market of a food product by acting on the price of a substitutable food
product. In Section 3.4, we saw that it is easier to release market tensions for exported products than
imported products, and for imported product than for non-tradable products. It may therefore be interesting
for countries to reduce the price of an imported food product by acting on a substitutable exported product.
This is exactly what India did in 2008 when it decided to tax (and then to ban) its non-basmati rice exports
in order to stop the increase in the price of imported wheat (this proved to be effective but it seriously
destabilised the international rice market, see Chapter 6). It may also be interesting for a country to reduce
the price of a non-tradable product by acting on a substitutable imported food product. This is what Mali
tried to do several times when it removed taxes on rice imports with the aim of stopping the increase in
millet and sorghum prices (the staples most consumed by the poor, especially in rural areas). However,

26
this policy was not really effective, partly because the tax removal was not (fully) passed on by importers
in their selling price and partly because the correlation between the price of rice and the price of millet and
sorghum is quite low (for more details, see Box 7 and Galtier et al., 2009).
• Maintain the purchasing power of food insecure households in several food products whose price is
increasing by acting on the price of a food product that accounts for a high share of their expenditures.
This is typically the case of cereals and other staples (such as cassava) that provides a high share of the
caloric intake, while accounting for a high share of poor households’ expenditures. If policies are
implemented to stop the increase in staple prices, the price of the other food products may go on
increasing but their consumption is nevertheless supported: as less money is spent in buying staples, it is
saved for other uses.
Note that, whereas the first option is relevant both for solving problems of shortages and price increases, the
second one is only relevant for price increases. It cannot solve the problems of shortages because they are not
only related to economic access to food but also to physical access: compensating for shortages requires to
provide the missing product or a substitute with an equivalent nutritional content. However, as shortages are
rather infrequent and as the first option often has a limited effectiveness (because imperfect substitutability
between products), the second option is much more used. This is the reason why, in practice, FR are often mainly
or exclusively made of cereals or other staples (such as milled cassava).
The practical implication is the following:
• It is necessary to guarantee the supply of all food products essential for food security and for which
shortages are feared. When it is not possible to guarantee this supply by regulating imports or exports of
the considered products (or of their substitutes), these products should be included in FR. In practice,
apart from the specific case of countries or areas at risk of becoming isolated, the range of relevant
product is limited to products vulnerable to supply chain disruption or for which the country’s imports are
high (compared to their supplying sources) and/or unstable (because of the sensitivity of the country
production to natural hazards).
• Conversely, when sharp food price increases are feared, it is possible to restore food insecure
households’ purchasing power by acting only on the cost of the staples much consumed by the poor (by
reducing their price or providing staple transfers). As these staples account for a high share of food
insecure households’ expenditures, reducing their cost increases their purchasing power, thereby allowing
them to maintain their consumption of other foods (even if their price go on increasing).
3.5.2 Determining the quantities to be stored
The quantities to be stored depend on the length during which FR may be necessary (import timelines for
imported food products and the entire crisis period for non tradable-products). This is why, for non-tradable
product, the quantity to be stored is usually higher than for imported food products. This also explains why for
imported products, the required quantity to be put in FR is usually higher for landlocked countries (which have
longer import timelines).
Things are more complicated anyway because it is sometimes possible to supply interventions with substitutable
food products instead of using non-tradables provided by FR. If, for instance, the government of a Sahel country
(or an NGO) wants to provide cereal transfers to food insecure households, it can either distribute millet and
sorghum (supplied by FR) or imported rice. Therefore, recourse to rice imports is a way to reduce the required
size for FR. However, the effect on food prices is likely to be different in both cases. Contrary to transfers made of
millet and sorghum, rice transfers have an uncertain effect on the price of millet and sorghum (the staples most
consumed by the poor) because of the low substitutability between these two groups of cereals. If the rice
received is resold by recipient households to buy much less expensive millet, the rice transfers may even have an
inflationary effect on the millet price. Therefore, interventions (transfers or sales) made of the staples most
consumed by the poor are likely to be much more effective for mitigating the price increases of these staples. But
on the other hand, supplying all the transfers with non-tradable staples (during the entire crisis period) may on
some occasions requires huge FR (and therefore be a too expensive solution). This is the reason why countries
may limit the size of their non-tradable FR to the quantity necessary to manage import timelines and then supply
their interventions with imported food products (see Box 2 below for an example).
27
Apart from the characteristics of the considered country (landlocked or not) and the considered good (imported or
non-tradable) the quantity required in FR depends on its objectives (which are related to the situation of
food markets): supplying markets in case of shortages; supplying food transfers or backing cash or
voucher transfers with food sales; mitigating food price increases. The quantity stored should at least be
enough to cover the supply-needs gaps and manage the inflationary effect of transfers. It can also be higher in
order to allow interventions aiming to further mitigate price increases.
The quantity required to compensate for shortages on markets is difficult to estimate in advance: in practice, the
FR is used to supply markets until shortages disappear and the necessary quantity is therefore only known ex
post. The best way to estimate the required quantity is therefore to build on past experiences of shortages.
The quantity required to manage the inflationary effect of transfers is also difficult to estimate. The inflationary
effect of transfers depends on the increase in the demand for different food products. These demand increases
can be estimated (with high margins of errors) by using data on households’ consumption (assuming that, after
their income being increased by the transfers, recipient households will have the same consumption than non-
recipient households with the same income level). It is complicated, data-consuming and not very accurate. But
even when these data are available, they are not very useful for interventions: compensating the effect of
transfers on the price of many food products would require providing transfers made of many different food
products or backing transfers with sales of many different food products. A simple solution to this problem is
based on focusing food transfers (or sales that back cash or voucher transfers) on the staples most consumed by
the poor. As these staples usually account for a high share in food insecure households’ expenditures, mitigating
the increase in their price is likely to support not only staple consumption but also the consumption of other food
products (the vast majority of food insecure households are net buyers of the staples most consumed by the poor,
including in rural areas). A simple rule is that, in a context of increasing food prices, emergency transfers should
be provided in staples and that 100% of these transfers should be supplied with FR or imports (no purchases on
the local market in periods of increasing prices). This rule implies that FR should be enough to cover 100% of the
staple transfers at least during import timelines and possibly during a longer period when the staples most
consumed by the poor are non-tradable in order to have a stronger mitigating effect on the price of these staples.
If, for some reasons, cash or voucher transfers are preferred, in a context of increasing food prices, their
inflationary effect should be mitigated by staples sales (ideally sales of the staples most consumed by the poor). A
possible rule is that staples sales should account for the quantity equivalent to 50% to 100% of the amount
transferred through cash and voucher transfers.
The quantity required to manage food price increases. As explained in section 3.4, it may be relevant to adopt a
more ambitious price increase mitigation policy (going beyond covering shortages and the inflationary effect of
transfers). As already explained, the right weights of price mitigation measures and emergency transfers depends
on factors such as the percentage of food insecure households, the cost-effectiveness of transfers (including the
social costs of targeting) and the feasibility of price mitigation (which is higher for imported than for non-tradable
food products). It may therefore be justified to build bigger FR than the quantity required to covering shortages
and the inflationary effect of transfers.
The practical implication of these considerations is the following simple rule:
• For the imported food products included in the FR, the quantity stored should be sufficient to cover a given
percentage of the needs during import timelines. This percentage should be estimated on the basis of past
experiences where private stocks were not enough to cover import timelines, generating shortages and/or
sharp price increases. The quantity stored should at least be enough to cover 100% of the transfers that
may be necessary during import timelines.
• For the non-tradable food products included in the FR, the quantity stored should be sufficient to cover a
given percentage of the inter-annual variability of production in the country (which can be measured for
instance by the standard deviation of the production). This percentage should be estimated on the basis of
past experiences where bad harvests provoked shortages and/or sharp price increases. The quantity
stored should at least be enough to cover 100% of the transfers that may be necessary during the import
timelines of substitutable staples traded on international markets.
Box 2 shows how the needs of FR have been estimated for each ECOWAS country by the feasibility study of the
ECOWAS Regional Reserve.

28
Box 2 Estimating the needs for food reserves: the case of ECOWAS countries
The feasibility study of ECOWAS Regional Reserve estimated the need for FR of each ECOWAS country.
The underlying assumptions were the following:
• FR are used exclusively for supplying staple transfers
• During rice import timelines, 100% of the emergency transfers should be covered by FR (no just-in-time
purchases in periods of crisis).
The resulting method for estimating country needs for FR has been the following: i) taking the percentage of
population affected by the major crisis experienced by this country between 2000 and 2012; ii) multiplying this
percentage to the estimated population for 2020; iii) applying the WFP norm (needs = 15 kg per head per
month); iv) assuming that 3 months of these annual needs should be met regionally for landlocked countries
and 1.5 months for coastal countries (in order to manage the timelines for mobilising international aid).
This provides the estimated needs for staple FR, country by country.
Table 6 Estimating the needs of FR of ECOWAS countries
Source: adapted from ECOWAS (2012).
Note that the total estimated need for FR at ECOWAS level (around 1 250 000 tons) accounts for around 3%
of ECOWAS production of millet, sorghum and maize.
Source: ECOWAS Regional Reserve Case study.
3.5.3 Rules for triggering the use of food reserves
When they are evidences of shortages on the markets of the considered area, FR should be used to supply
markets (while the evidences of shortages persist).
When food prices are increasing and transfers are implemented, FR should be used to supply the food transfers
(made of the staples most consumed by the poor). If, for some reasons, cash or voucher transfers are preferred,
FR should be used to back them with sales of the staples most consumed by the poor (in the localities where the
transfers are provided).
When food prices are too high, FR can be used to supply sales of the staples most consumed by the poor in order
to reduce their price. For imported food products, these sales can be implemented if the domestic price is higher
than the import parity price (price cost of imported staples). They should be stopped when the domestic price falls
ECOWAS
Country
Population in
2020 (000s)
Population Affected following
Most Serious Crisis (%)
Quantity required to supply
emergency transfers (tons)
Import
timelines
Country needs
for FR (tons)
Benin 11 523 4% 82 966 1.5 months 10 371
Burkina Faso 22 150 18% 717 660 3 months 179 415
Cape Verde 544 7% 6 482 3 months 1 621
Côte d’Ivoire 24 503 4% 176 422 1.5 months 22 053
Gambia 2 242 36% 145 282 1.5 months 18 160
Ghana 30 325 4% 218 340 1.5 months 27 293
Guinea 12 765 4% 91 908 1.5 months 11 489
Guinea-Bissau 1 863 8% 25 989 1.5 months 3 249
Liberia 5 166 13% 120 884 1.5 months 15 111
Mali 20 537 23% 850 232 3 months 212 558
Niger 22 071 53% 2 118 286 3 months 529 572
Nigeria 203 869 4% 1 467 857 1.5 months 183 482
Senegal 15 998 7% 201 575 1.5 months 25 197
Sierra Leone 7 178 4% 51 682 1.5 months 6 460
Togo 7 343 4% 52 870 1.5 months 6 609
ECOWAS 388 077 6 328 433 1 252 637

29
to the level of the import parity price. For non-tradable staples, market interventions can be implemented when
the price of the staple most consumed by the poor is at a too high level (a level considered to be damaging for
food and nutrition security). They should be stopped when there are evidences of an increase in exports to the
neighbouring countries (as in this case, the quantities provided by FR to the domestic market flow abroad).
Recommendation Box 2
Building and using food reserves to manage food crises
The role of FR strongly depends on:
• whether some of the food products important for the food and nutrition security of the considered country are vulnerable to shortages or sharp price increases (when this is not the case, there is no need for FR to manage crises);
• the trade status of the considered food products: for exported products, no role for FR; for imported products, potential role during import timelines and, for non-tradable products, potential role during the entire crisis period;
• the situation of food markets: in case of shortages, FR have a decisive role to play in supplying markets; in case of tensions on the market price (price higher than the import price cost for imported products, continuously increasing prices for non-tradable products) FR also have a role to play in mitigating food price increases (at least to manage the probable inflationary effect of emergency transfers).
Two practical simplifications allow reducing the need for FR:
First, shortages of essential food products can be treated through imports: even when the missing food
products are non-traded on international markets, it is always possible to import substitutes. Therefore, the
need for FR to manage shortages is always limited to import timelines.
Second, mitigating the price increase of the staples most consumed by food insecure households is often an
effective way to support not only their staple consumption, but also their consumption of other food products.
This is because these staples usually account for a high share in their expenditures: therefore, allowing them to
save money on staples results in giving them the means to maintain their consumption of other foods. This
argument also holds for the objective of mitigating the inflationary effect of emergency transfers. It leads to the
simple rule is that, in a context of increasing food prices, emergency transfers should be provided in staples
and that 100% of these transfers should be supplied with FR or imports (no purchases on the local market in
periods of increasing prices). This rule implies that FR should be enough to cover 100% of the staple transfers
at least during import timelines, and possibly during a longer period when the staples most consumed by the
poor are non-tradable (in order to have a stronger mitigating effect on the price of these staples: distributing
imported staples will always have a weaker effect). If, for some reasons, cash or voucher transfers are
preferred, in a context of increasing food prices, their inflationary effect should be mitigated by staples sales in
the localities where cash or voucher transfers are implemented (ideally it should be sales of the staples most
consumed by the poor).
Therefore, it is necessary to build FR made of all food products essential for food and nutrition security
for which shortages may occur. In practice, it may concern many products only in the very specific situations
where the country (or specific areas within the country) may become isolated (for instance by conflicts or
natural disasters). But, most of the time, the list of the products vulnerable to shortages is quite limited
(products whose production is highly sensitive to natural hazard, products for which the country’s import needs
may become high compared to its supplying sources, products vulnerable to a disruption in supplying sources).
The quantity stored should be sufficient to cover a given percentage of the needs during import timelines. This
percentage should be estimated based on past experiences where private stocks were not enough to cover
import timelines, generating shortages.
It is also necessary to build FR made of the staples most consumed by the poor in case the price of
these staples may increase sharply (when the concerned staples are imported, the criterion is that their price
may go above the import price cost, thereby revealing that private stocks are not sufficient to manage import
timelines). These FR will not only be used to compensate for shortages (if any) but also to manage the
inflationary effect of transfers (by supplying food transfers or backing cash or voucher transfers with staples
sales). And possibly to supply additional sales aiming to further reduce the price of these staples. When the
staples most consumed by the poor are traded on international markets, the quantity stored should be sufficient
30
to cover a given percentage of the needs during import timelines. This percentage should be estimated based
on past experiences where private stocks were not enough to cover import timelines generating domestic
prices above import price costs. When the staples most consumed by the poor are not traded on international
markets, the quantity stored should be sufficient to cover a given percentage of the inter-annual variability of
production in the country. This percentage should be estimated on the basis of past experiences where bad
harvests provoked sharp price increases. The quantity stored should at least be enough to cover 100% of the
transfers that may be necessary during the import timelines of substitutable staples traded on international
markets.
When a crisis occurs, FR:
• should be used to supply markets when there are evidences of shortages on the markets of the
considered area;
• should be used to supply staple transfers when staple prices are increasing. If, for some
reasons, cash or voucher transfers are preferred, FR should be used to back them with staples sales
(in the localities where the transfers are provided). This applies both to the transfers provided to i) the
food insecure households whose income collapsed and to ii) the food insecure households hit by
sharp food price increases;
• can be used to supply sales of the staples most consumed by the poor in order to reduce their
price when it is too high. For imported food products, these sales can be implemented while the
domestic price is higher than the import parity price (price cost of imported staples). For non-tradable
staples, they can be implemented when the price of the staple most consumed by the poor is at a
level considered to be damaging for food and nutrition security.
3.6 Illustrations
The boxes presented below aim to illustrate some of these recommendations.
The first four boxes are on the use of FR by importing countries to manage food crises. Box 3 presents the
Indonesian success story in stabilising the domestic price of rice between 1973 and 1997. This policy was based
on regulating imports and using FR. Box 4 illustrates the needs for FR to manage import timelines: for many years
Bangladesh succeeded in mitigating staple price increases only by allowing more imports. However, in 2008, the
crisis on international markets resulted in longer and uncertain import timelines which seems to have provoked
speculation (stock hoarding) and panic purchases, which resulted in exacerbating the increase in the rice
domestic price. The government of Bangladesh understood the lesson: it nearly tripled the size of its FR. Box 5 is
about the dilemma of using FR to supply targeted transfers or to mitigate staple price increases. It deals with
Ethiopia policy during the 2008 crisis. Finally Box 6 shows how (for very small importing countries), contracts with
private traders can be an alternative to FR for managing import timelines. This Box is on Hong Kong and
Singapore experiences.
Box 3 Indonesia success story in stabilising the domestic price of rice by regulating imports and using
food reserves (1973-1997)
In Indonesia, the food logistics agency (BULOG) was established the end of the 1960s to control rice prices,
with a head who reported directly to the president, and with a line of credit at subsidised interest rates from the
Central Bank. BULOG implemented a publicly announced floor and ceiling price for rice, with the margin
between the two wide enough for the private sector to carry out most rice marketing activities. A rice buffer
stock absorbed purchases at the floor price and provided rice to inject into urban markets to defend the ceiling
price, with rice imports being an important balance wheel in the process.
The world food crisis in 1972/73 caught the Indonesian government, and BULOG, unprepared. After several
years of price stability, rice prices spiralled out of control and the government quickly tried to arrange
emergency imports from a world rice market that had completely disappeared for nearly a year. However,
BULOG was quite successful in stabilising rice prices from late in 1973, when it regained control of domestic
prices after a good rice harvest, until the Asian Financial Crisis in late 1997 (see Figure 9). After 1998, the
objective of the Indonesian government appears to have shifted from stabilising the domestic price of rice to
maintaining it permanently at a high level (see Box 10 for more details on that).

31
Figure 9 Real Rice Prices in Indonesia, Domestic (Rp) (blue), Imported from World (Rp) (red), and
Imported from World (USD) (green)
Source: Data and graphics provided by David Dawe, FAO Bangkok.
Source: Indonesia case study report.
Box 4 The need for food reserves to manage import timelines: the experience of Bangladesh in 2008
In the first few years after its independence in 1971, Bangladesh was faced with massive food and nutrition
security problems. Rice production fell sharply in 1971/72 and 1972/73 and rice imports were severely limited
by a shortage of foreign exchange and very high international prices. Availability of cereals fell, resulting in the
death of at least 30,000 people, though unofficial reports put the figure as high as 100,000. Liberalisation of
wheat and then rice imports in the early 1990s provided substantial stability to cereal prices. In mid-1998,
domestic rice prices rose along with floodwaters that ultimately covered two-thirds of the country. As domestic
prices reached import parity levels, private sector rice imports flowed across the border from India, quickly
adding to total market supplies, which resulted in keeping the domestic market price from rising above the
import price cost. This illustrates the decisive role of imports for mitigating staple price increases. However, the
2008 crisis showed that allowing imports is not enough. In spite of significant rice imports (1.7 million tons in
2007/08), average wholesale rice prices in Bangladesh rose by 45 % in real terms between November 2007
and April 2008. Model simulations of the changes in net rice supply and consumption demand account for only
9 % of the actual 45 % increase in real rice prices actually observed. However, simulations of an increase in
private stockholding of about 900,000 tons (equivalent to about two weeks of consumption) result in a
simulated real price increase approximating the historically observed increase. These simulations suggest that
an increase in private stockholding could have been a major factor in explaining the price increases of 2007-08.
They also suggest that ready availability of approximately 1 million tons of rice through drawdown of food
reserves or imports would enable Bangladesh to handle similar disruptions in the future. The government of
Bangladesh understood the lesson: in the aftermath of the 2007/08 price shock, it again built up rice stocks:
public rice stocks, which averaged 531,000 tons over the 2002/04 – 2006-07 period, were increased rapidly to
an average of 1.032 million tons in the July 2008 to December 2009 period. Overall, public foodgrain stocks
(including rice and wheat) nearly tripled from 617,000 tons in 2007/08 to 1.69 million in the July 2012 –
February 2016 period.
Source: Bangladesh case study report.

32
Box 5 How to best use food reserves for managing food price crisis? To mitigate staple price increases or
to provide targeted aids? Ethiopia’s experience during the 2008 crisis
“In mid-2008, in an effort to lower domestic wheat prices, the government [of Ethiopia] intervened in domestic
markets by importing wheat on a commercial basis and then selling 283 thousand tons of the wheat at fixed
subsidised prices (generally 300 Birr/quintal, only about half of the wholesale price of wheat in Addis Ababa
market). Most of this wheat (55 per cent) was sold to flour mills; 23 per cent of the subsidised wheat was sold
to consumers through selected urban shops and 18 per cent of the wheat was sold to rural village-level
consumer cooperatives. Overall, less than 2 per cent of the wheat (8,100 tons) was sold to wholesale traders,
and none after September 2008, due to concerns that traders did not pass on the huge implicit subsidy to
consumers.
Sales of government imported wheat reduced real wheat prices in domestic markets from July through
October. […] October 2008 real prices were 26 per cent below a projected real price without the import
intervention (the June price plus an estimated 2 per cent per month real seasonal price rise). These reductions
in food prices are somewhat less than a simulated 34 per cent decrease using an elasticity of wheat demand
with respect to wheat price of -0.8 (a level approximately equal to econometric estimates using cross-section
household level data). […] These sales at the low official price also implied huge rents (excess profits) for
traders and millers who were able to purchase wheat at 300 Birr/quintal and sizeable income transfer to poor
households who were able to purchase government wheat directly. The total value of these rents and subsidies
(which accrued to various actors according to their share in total subsidised wheat distribution) reached about
900 million Birr (about US$90 million).
[…] One alternative to this policy would have been to auction government wheat imports in domestic markets.
Such a policy would eliminate rents accruing to recipients of subsidised wheat. It would also have generated
additional government revenue (through sales at a higher price), while having essentially the same effect on
market prices as government subsidised sales, since the volume of wheat injections into the Ethiopian wheat
market would have been the same. […]”
Source: Dorosh and Ahmed (2009).
Box 6 Contracting with private importers to manage import timelines: Hong Kong and Singapore
experiences
A great reliance on the private sector is followed in Singapore and Hong Kong, where rice production is zero. In
these economies, the role of the government is simply to stipulate minimum levels of stocks that must be held
by various private sector agents such as importers and supermarkets.
In Hong Kong, the government has moved away from a system of import quotas and somewhat restrictive
licensing to a completely open system where anyone can import in any amount. The only stipulation is that
licensed importers, as a group, must hold stocks equal to 15 days of consumption, which is equivalent to a ratio
of stocks to consumption of about 4%.
In Singapore, there is a similar system (known as the Rice Stockpile Scheme) in which private sector importers
are obliged to hold stocks in a government-owned warehouse. The stocks are the property of the importer, but
must be rotated (rice cannot be held more than one year) and can be bought by the government if deemed
necessary. The mandated level of stocks is much higher in Singapore than in Hong Kong, at approximately
17% of annual consumption.
Source: Dawe (2016).
The last two boxes deal with countries weakly connected with international markets. Box 7 is on the case of Sahel
countries. It illustrates the fact that, when the staples most consumed by the poor are not traded on international
markets, trade is not helpful in mitigating staple price increases. This means that the burden rests on the
shoulders of FR. An implication of this is that maintaining staple domestic prices below a predefined ceiling is
likely to be difficult, meaning that food crises should mainly be managed through emergency transfers. However,
if food transfers are implemented and 100% supplied by FR they are likely to have a mitigating effect on staple
prices. This is illustrated by Box 8 for the case of Ethiopia (assumed to be weakly connected with international
markets, which is often the case as imports are often restricted by the lack of foreign currencies or other reasons).

33
It is shown that the effect of FR-supplied transfers on staple prices can be very significant if the size of the FR is
large enough.
Box 7 The need for food reserves when the staple most consumed by the poor are not traded on
international markets: the experience of Sahel countries
In Sahel countries, coarse grains (millet, sorghum and maize) are the main staples consumed by the poor: as
their price is usually much lower than the price of rice, they provide the cheapest source of calories. However,
their price is highly unstable provoking frequent food crises: in Mali millet price increased by +150% in 2005
and by +100% in 2012. The increase in the price of coarse grains can hardly be mitigated through imports from
international markets: millet and sorghum are not traded on international markets; imported maize is only used
to feed animals; rice is much more expensive than coarse grains rendering it ineffective to keep the prices of
millet and sorghum at reasonable levels: in 2005, the increase in the price of millet and sorghum was stopped
when it almost reached the price of imported rice... after having increased by 150%! Imports of coarse grain on
the regional market can sometimes be an option: in Niger, in 2010, the deficit in coarse grain has been
compensated by massive imports from northern Nigeria, allowing grain prices to remain stable in Niger.
However, most of the time, droughts affect all Sahel countries at the same time (as happened in 2005 and
2012). Therefore, it is not possible to rely on the regional market to compensate for the country deficit in millet
and sorghum. To some extent, the regional trade of maize can contribute to regulating grain prices in the Sahel
(contrary to millet and sorghum that are only produced in Sahel countries and in the northern regions of coastal
countries, maize is also produced in coastal areas that are much less exposed to droughts). However, as
observed during the 2012 crisis, maize imports from coastal countries are likely to mitigate only the raise in
maize price, without being able to stabilise the price of millet and sorghum, as can be shown of Figure 10.
Figure 10 Grain prices in Bamako, Mali
Source: OMA.
In this context, the only effective way to mitigate the increase in coarse grain price is using FR. However,
maintaining staple prices below a predefined ceiling is likely to be very difficult and expensive (it would require
huge FR). Emergency transfers are therefore necessary to protect food insecure households and, if they are
made of coarse grains, they are likely to contribute to mitigating the price increase of these products. The on-
going ECOWAS Regional Reserve project is following this rationale: it aims to increase national FR and create
a mutualised Regional Reserve (mainly made of coarse grain) in order to supply emergency food transfers
when a country is hit by a crisis. It will benefit from a favourable context as grains can be easily stored in the
Sahel region (millet and sorghum can be kept 2 or 3 years without any quality deterioration).
Source: ECOWAS Regional Reserve case study report.

34
Box 8 Effect of food reserve-supplied transfers on staple prices: simulations for Ethiopia
It has been estimated for Ethiopia that grain distributions are likely to decrease significantly grain prices,
providing that the quantity of food distributed is high enough. The comparison was between the current level of
the FR (407,000 tons) and its potential future level (there was a project to raise the level of the FR to 1,500,000
tons). Whatever the value of the price elasticity of demand and the increase in consumption resulting from
being recipient of food transfers (that is, the marginal propensity to consume or MPC), the effect on grain prices
is always significant when 1,500,000 tons are distributed: between 12% and 27% when the food is distributed
every month; and between 25% and 55% when distributions are concentrated on the six months of the lean
season (see Table 7 below).
Table 7 Effect of grain transfers on domestic grain prices: simulations for Ethiopia
Source: Rashid and Lemma (2011).
Source: Rashid and Lemma (2011).
When equal
amounts are
dis tributed every
month
When equal
amounts are
dis tributed in s ix
lean months
When equal
amounts are
dis tributed every
month
When equal
amounts are
dis tributed in s ix
lean months
407,000 -2.18% -4.36% -3.27% -6.55%
1,500,000 -18.42% -36.84% -27.69% -55.26%
407,000 -1.48% -2.97% -2.23% -4.45%
1,500,000 -12.53% -25.05% -18.79% -37.58%MPC = 0.32
Marginal
propens ity to
consume (MPC)
FR level
(tons)
Price effect i f the demand is relatively
elastic (ep = - 0.6)
Price effect i f the demand is relatively
inelastic (ep = - 0.6)
MPC = 0

35
WHICH ROLE FOR FOOD RESERVES IN PROVIDING INCENTIVES
AND INCOME TO FOOD PRODUCERS?
4.1 Food reserves procurement as a way to provide incentives to producers
FR procurement is a way to send incentives to orient farmers’ decisions towards production choice that contribute
to improving food and nutrition security. The incentives are mainly provided through procurement prices (PPROC).
Incentives can be i) non-targeted (provided to all suppliers) through the standard procurement price or ii) targeted
to specific categories of suppliers (e.g. small-scale farmers), production methods (e.g. organic products) or
market tools (e.g. warehouse receipt system). In the second case, a specific procurement price (higher than the
standard procurement price) is provided. By crossing the two types of incentives, we get the four options
represented on Table 8.
Table 8 Types of incentives that can be provided to producers through food reserve procurement
Source: Authors.
To keep it simple, only price incentives have been indicated on Table 8. But, of course, many other types of
incentives can be provided. They can be for instance related to more favourable conditions of delivery and
payment. The existence of a regular demand for their products can sometimes be a sufficient incentive for
producers, as illustrated by Brazil’s experience of procuring food from small-scale farmers to supply social
transfers and school feeding (see Box 12).
4.2 Rationale for providing non-targeted incentives to producers
When proposing a standard procurement price higher than the market price, a FR agency is providing a non-
targeted incentive whose aim is almost always to generate a floor for the domestic market price.
However, for FR procurement to succeed in holding the domestic price above a floor, specific conditions should
be satisfied. First, the quantity procured should account for a significant share of the quantity traded on
the domestic market. Meaning that this kind of policy can only be implemented when a high quantity of food is
required either to supply permanent food transfers (see Chapter 2) or to manage food crises (see Chapter 3).
Second, the quantity removed from the market thanks to FR procurement should not be compensated by a
reduction in exports or an increase in imports. This means that it can only work for non-tradable staples or
when accompanied by trade measures to restrict imports or boost exports. Except for big exporting
countries that can try to use public procurement to support the international price… but they are likely to fail (as
illustrated by the attempts of Thailand for rice and, in another context, of Côte d’Ivoire for cocoa, see
Poapongsakorn and Pantakua, 2015 and Gombeaud et al. 1990). Third, FR purchases should be timely,
predictable and transparent (the procedures used for FR procurement should allow a fair competition between
market players, see Chapter 5).
No Yes
Standard PPROC = Market price Standard PPROC > Market price
No incentive provided Incentives provided to all the
producers of the considered good
Specific PPROC > Standard PPROC
= Market price
Specific PPROC > Standard PPROC
> Market price
Incentives provided to specific
categories of suppliers, production
methods or market tools
Incentives provided to all the
producers of the considered good
+ stronger incentives provided to
specific categories of suppliers,
production methods or market
tools
DO FR PROCUREMENT PROVIDE NON-TARGETED INCENTIVES?
DO FR PROCUREMENT
PROVIDE TARGETED
INCENTIVES?
No
Yes
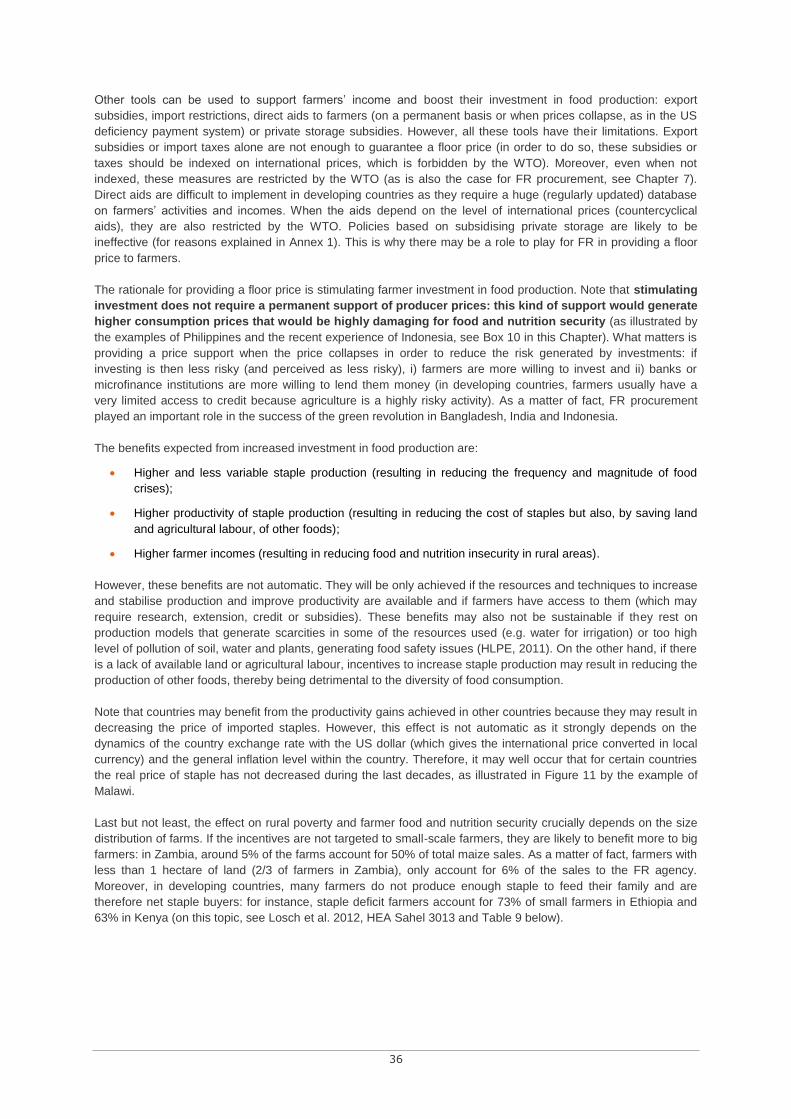
36
Other tools can be used to support farmers’ income and boost their investment in food production: export
subsidies, import restrictions, direct aids to farmers (on a permanent basis or when prices collapse, as in the US
deficiency payment system) or private storage subsidies. However, all these tools have their limitations. Export
subsidies or import taxes alone are not enough to guarantee a floor price (in order to do so, these subsidies or
taxes should be indexed on international prices, which is forbidden by the WTO). Moreover, even when not
indexed, these measures are restricted by the WTO (as is also the case for FR procurement, see Chapter 7).
Direct aids are difficult to implement in developing countries as they require a huge (regularly updated) database
on farmers’ activities and incomes. When the aids depend on the level of international prices (countercyclical
aids), they are also restricted by the WTO. Policies based on subsidising private storage are likely to be
ineffective (for reasons explained in Annex 1). This is why there may be a role to play for FR in providing a floor
price to farmers.
The rationale for providing a floor price is stimulating farmer investment in food production. Note that stimulating
investment does not require a permanent support of producer prices: this kind of support would generate
higher consumption prices that would be highly damaging for food and nutrition security (as illustrated by
the examples of Philippines and the recent experience of Indonesia, see Box 10 in this Chapter). What matters is
providing a price support when the price collapses in order to reduce the risk generated by investments: if
investing is then less risky (and perceived as less risky), i) farmers are more willing to invest and ii) banks or
microfinance institutions are more willing to lend them money (in developing countries, farmers usually have a
very limited access to credit because agriculture is a highly risky activity). As a matter of fact, FR procurement
played an important role in the success of the green revolution in Bangladesh, India and Indonesia.
The benefits expected from increased investment in food production are:
• Higher and less variable staple production (resulting in reducing the frequency and magnitude of food
crises);
• Higher productivity of staple production (resulting in reducing the cost of staples but also, by saving land
and agricultural labour, of other foods);
• Higher farmer incomes (resulting in reducing food and nutrition insecurity in rural areas).
However, these benefits are not automatic. They will be only achieved if the resources and techniques to increase
and stabilise production and improve productivity are available and if farmers have access to them (which may
require research, extension, credit or subsidies). These benefits may also not be sustainable if they rest on
production models that generate scarcities in some of the resources used (e.g. water for irrigation) or too high
level of pollution of soil, water and plants, generating food safety issues (HLPE, 2011). On the other hand, if there
is a lack of available land or agricultural labour, incentives to increase staple production may result in reducing the
production of other foods, thereby being detrimental to the diversity of food consumption.
Note that countries may benefit from the productivity gains achieved in other countries because they may result in
decreasing the price of imported staples. However, this effect is not automatic as it strongly depends on the
dynamics of the country exchange rate with the US dollar (which gives the international price converted in local
currency) and the general inflation level within the country. Therefore, it may well occur that for certain countries
the real price of staple has not decreased during the last decades, as illustrated in Figure 11 by the example of
Malawi.
Last but not least, the effect on rural poverty and farmer food and nutrition security crucially depends on the size
distribution of farms. If the incentives are not targeted to small-scale farmers, they are likely to benefit more to big
farmers: in Zambia, around 5% of the farms account for 50% of total maize sales. As a matter of fact, farmers with
less than 1 hectare of land (2/3 of farmers in Zambia), only account for 6% of the sales to the FR agency.
Moreover, in developing countries, many farmers do not produce enough staple to feed their family and are
therefore net staple buyers: for instance, staple deficit farmers account for 73% of small farmers in Ethiopia and
63% in Kenya (on this topic, see Losch et al. 2012, HEA Sahel 3013 and Table 9 below).
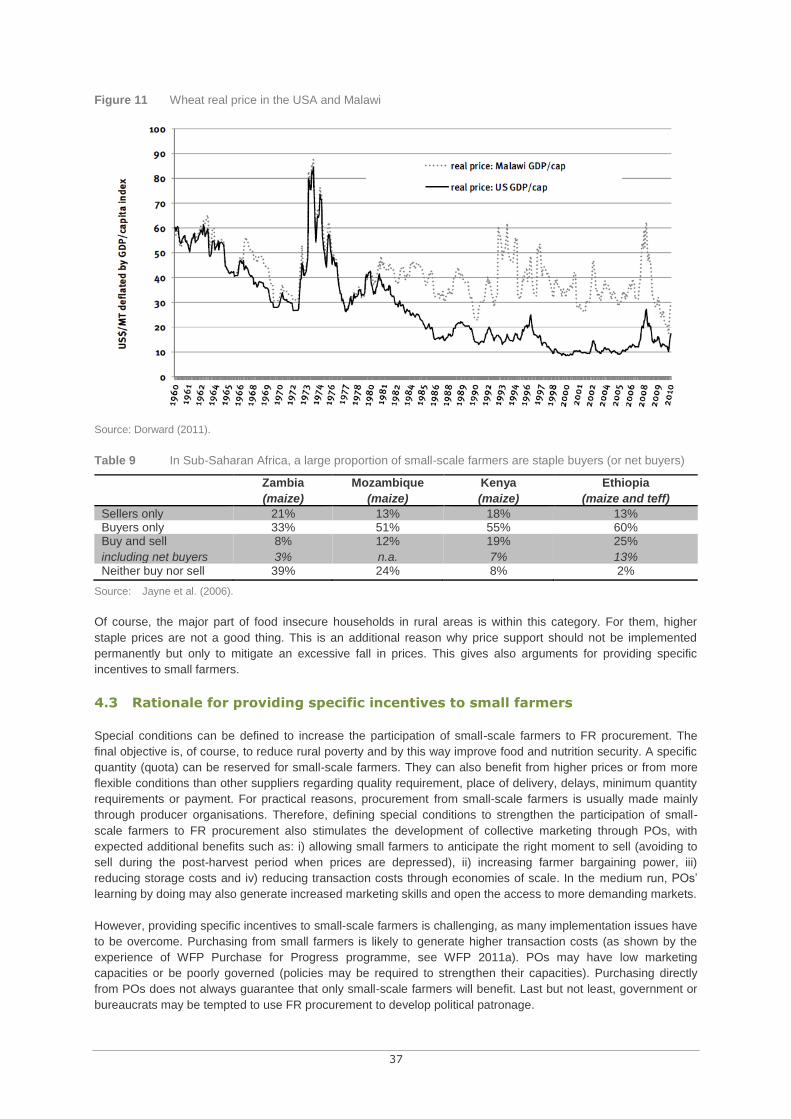
37
Figure 11 Wheat real price in the USA and Malawi
Source: Dorward (2011).
Table 9 In Sub-Saharan Africa, a large proportion of small-scale farmers are staple buyers (or net buyers)
Zambia
(maize)
Mozambique
(maize)
Kenya
(maize)
Ethiopia
(maize and teff)
Sellers only 21% 13% 18% 13% Buyers only 33% 51% 55% 60% Buy and sell
including net buyers
8%
3%
12%
n.a.
19%
7%
25%
13% Neither buy nor sell 39% 24% 8% 2%
Source: Jayne et al. (2006).
Of course, the major part of food insecure households in rural areas is within this category. For them, higher
staple prices are not a good thing. This is an additional reason why price support should not be implemented
permanently but only to mitigate an excessive fall in prices. This gives also arguments for providing specific
incentives to small farmers.
4.3 Rationale for providing specific incentives to small farmers
Special conditions can be defined to increase the participation of small-scale farmers to FR procurement. The
final objective is, of course, to reduce rural poverty and by this way improve food and nutrition security. A specific
quantity (quota) can be reserved for small-scale farmers. They can also benefit from higher prices or from more
flexible conditions than other suppliers regarding quality requirement, place of delivery, delays, minimum quantity
requirements or payment. For practical reasons, procurement from small-scale farmers is usually made mainly
through producer organisations. Therefore, defining special conditions to strengthen the participation of small-
scale farmers to FR procurement also stimulates the development of collective marketing through POs, with
expected additional benefits such as: i) allowing small farmers to anticipate the right moment to sell (avoiding to
sell during the post-harvest period when prices are depressed), ii) increasing farmer bargaining power, iii)
reducing storage costs and iv) reducing transaction costs through economies of scale. In the medium run, POs’
learning by doing may also generate increased marketing skills and open the access to more demanding markets.
However, providing specific incentives to small-scale farmers is challenging, as many implementation issues have
to be overcome. Purchasing from small farmers is likely to generate higher transaction costs (as shown by the
experience of WFP Purchase for Progress programme, see WFP 2011a). POs may have low marketing
capacities or be poorly governed (policies may be required to strengthen their capacities). Purchasing directly
from POs does not always guarantee that only small-scale farmers will benefit. Last but not least, government or
bureaucrats may be tempted to use FR procurement to develop political patronage.

38
Many national FR agencies procure part of their purchases with small-scale farmers (usually through POs), the
most famous example being Brazil’s Food Acquisition Programme (see Box 12 below). The WFP is doing the
same through its Purchase for Progress (P4P) programme (WFP 2011a; WFP 2014a). Although these
programmes are not perfect (many cases have been reported where POs were unable to deliver the right
quantity), they are likely to produce many benefits in the long run (farmer empowerment, reduction in rural
poverty).
4.4 Rationale for providing specific incentives to environmental-friendly
production models
The shift to more environmental-friendly production models is likely to contribute to food and nutrition security
both in the short run (by improving health) and in the medium run (by increasing the sustainability of food
production). In the short run, the main effect is through food safety and water quality (pesticides and other inputs
used by conventional agriculture are dangerous for human health). Health is crucial for nutrition as it conditions
the ability of the body to absorb the nutrients consumed. In the long run, pollution of soils and water tables, the
reduction in soil fertility and the scarcity of water for irrigation and some components of fertilisers (such as
phosphates) may compromise the sustainability of food production in different regions of the world.
Many municipalities around the world developed programmes to supply school canteens with organic food
products. The objective is both to provide children with safe food and incentivise farmers to convert to organic
production, in order to preserve the quality of soils and water. Up to now, these programmes are not very
common in developing countries, but they may develop in a close future. In 2011, a programme of this kind was
developed by the Municipality of Seoul and it proved to be very successful: almost all the farmers of the valley
that supplies the major part of the water used in Seoul converted to organic production. These experiences are
not focused on FR (the considered products are usually not stored for a long time), but they show how public
procurement can play an effective role in improving food security by promoting environmental-friendly production
models.
4.5 Rationale for providing incentives to specific market tools
The development of specific markets tools such as warehouse receipt systems (WRS) and commodity exchanges
can contribute to improving food and nutrition security by leading to more transparency (on stocks and prices),
thereby improving market efficiency. WRS are based on using stocks as collateral to obtain credit from a bank or
a microfinance institution. This implies that stocks are located in an accredited warehouse. In some countries,
warehouse receipts can be sold, meaning that several transactions (transfer of property rights) may occur without
moving the product. A commodity exchange is based on selling warehouse receipts on organised markets (where
all the supply and all the demand are centralised). Apart from their expected effect on market transparency and
efficiency, WRS may also increase the level and the length of farmer storage and, through this way, contribute to
improving farmer food and nutrition security during the lean period.
Part of FR procurement can be channelled through these specific market tools. The simple fact to address a
regular demand on significant volumes to specific market tools is a way to support them, as it is likely to generate
economies of scale and learning processes. The support to specific market tools may also contemplate a price
support in order to help them attract more quantities (in many cases, a price slightly higher than the market price
is likely to be enough). A good example of this is provided by the modalities implemented by the WFP for
procuring grain in Eastern and Southern African countries, as it procures significant quantities on commodity
exchanges or Warehouse Receipt Systems (for instance ECX in Ethiopia and ZAMACE in Zambia, see WFP
2011a). However, until now, the involvement of national FR agencies in this area seems quite limited.
Recommendation Box 3
FR procurement is a way to send incentives to orient farmers’ decisions towards production and marketing
choices that contribute to improving food and nutrition security. The idea is to stimulate farmer investment and
orient their decisions toward specific products, production models (e.g. organic agriculture) or market tools. The
expected benefits are: increased, less variable and safer food production, lower production costs, increased
availability of land and agricultural labour for other foods (thanks to productivity gains) and higher incomes for

39
poor farmers (resulting in reducing food and nutrition insecurity in rural areas).
FR procurement can sometimes be used for providing a floor for the domestic market price. The rationale
behind this idea is that such a floor price boost investment by rendering farmers more willing to invest and
banks or microfinance institutions more willing to lend them money. As a matter of fact, FR procurement played
an important role in the success of the green revolution in some Asian countries. It is worth noting that
stimulating farmer investment in food production does not require a high floor price: what matters is
preventing price collapses. The floor can therefore be fixed at the mid-term average level of international prices
or even at a slightly lower level (a high floor price generates a high consumption price that is highly damaging
for food and nutrition security, as illustrated by the examples of Philippines, Zambia and the recent experience
of Indonesia).
Floor price policies are not relevant for all countries: they can generate poor consequences such as
scarcities in some of the resources used (e.g. water for irrigation) or too high level of pollution of soil, water and
plants, generating food safety issues. In addition, if there is a lack of available land or agricultural labour,
incentives to increase staple production may result in reducing the production of other foods, thereby being
detrimental to the diversity of food consumption. The effect on rural poverty and food and nutrition security is
also context-dependent because floor price policies may benefit mainly big farmers and be detrimental for
deficit farmers.
When floor price policies are relevant there is not always a role to play for FR, as other tools can be used for
the same purpose. In fact, FR procurement can be useful to guarantee minimum prices to farmers only for non-
tradable staples or importing countries where imports are restricted. In all cases, the quantity procured should
account for a significant share of the quantity traded on the domestic market. This means that FR procurement
can be used to provide a floor price only if a high quantity of food is required to supply permanent food
transfers (see Chapter 2) or to manage food crises (see Chapter 3).
FR procurement can also be used to provide targeted incentives. The objective is then to support specific
farmers (e.g. small-scale farmers), production models (e.g. organic agriculture) or market tools (collective
marketing through producer organisations, warehouse receipt systems or commodity exchanges). There are
several ways to provide such targeted incentives: a quantity quota can be reserved for specific categories of
suppliers and they can also benefit from higher prices or for more flexible conditions regarding quality
requirement, place of delivery, delays, minimum quantity requirements or payment.
The expected benefits are numerous. Supporting collective marketing through production organisations may
allow farmers to receive higher prices (increased bargaining power, increased ability to expect the right
moment to sell), to reduce their costs (storage and transaction costs) and to increase their marketing skills.
Supporting warehouse receipt systems may result in more transparency (on stocks and prices) and increase
farmer storage, this way contributing to improve farmer food and nutrition security during the lean period.
Supporting more environmental-friendly production models is likely to contribute to food and nutrition security
both in the short run (by improving health) and in the medium run (by increasing the sustainability of food
production). In all these cases, what is allowed through the targeted incentives provided by FR procurement is
learning by doing and increased skills.
However, providing targeted incentives through FR procurement is challenging because many implementation
issues have to be overcome, the main one being the risk that policy-makers or bureaucrats may be tempted to
use FR procurement to develop political patronage.
4.6 Illustrations
The boxes presented below aim to illustrate some of these recommendations. The first three boxes show what
happens when FR and other complementary tools are used to maintain permanently domestic prices at high
levels (i.e. when the floor price is fixed above the word price mid-term average level). Box 9 presents the
consequences for (poor) Indonesian farmers of the high price policy implemented by Indonesia since 1998 and
shows that they did not really benefit from it. Box 10 presents the consequences for consumer food and nutrition
security of high price policies implemented in Indonesia (since 1998) and the Philippines. In both cases, the
effects have been damaging in spite of the fact that targeted transfers (safety nets) have been put in place to

40
protect food insecure households. Box 11 presents the budgetary consequences of high price policies coupled
with targeted transfers (or consumer subsidies). The cost for the budget proved to be extremely high.
More positive experiences are presented in Box 3 (in Chapter 3) and Box 12 (below). Box 3 describes a
successful example (Indonesia from 1973 to 1997) of using FR procurement to protect farmers during price
collapses. Box 12 provides an illustration of public procurement focused on small farmers: Brazil’s Food
Acquisition Programme (PAA) and National School Feeding Plan (PNAE).
Box 9 Which Indonesian farmers benefit from high rice prices?
In Java, 45 percent of all rural households do not own any land other than perhaps a house plot. While not all
of these households are poor, the great majority of them are in the lower rungs of the income distribution.
Another 20 percent own less than one-quarter hectare of land, which is just enough to provide the average per
capita consumption of rice for a family of five (if the land in its entirety is planted to rice and not to other crops).
Together, these two groups account for nearly two-thirds of rural households on Java. By and large, they are
much poorer than farmers with larger amounts of land, and they are not likely to be net sellers of rice. For
these households, lower rice prices mean higher real incomes and less poverty.
Indonesia’s larger landowning rice farmers are not wealthy in absolute terms, but in relative terms most of
these households fall in the middle (third) quintile of the overall income distribution. In Java, only one-third of
rural households own enough land to produce a surplus of rice for a family of five. These are clearly not the
poorest of the poor, although poor farmers can rent rice land and be just as dependent on the harvest price as
larger land-owning farmers. Permanently higher rice prices, however, just drive up the rental price of land,
leaving renters no better off than before.
Source: Indonesia case study report.
Box 10 The damaging effects on food and nutrition security of maintaining permanently high staple prices:
lessons from Indonesia and the Philippines
In Indonesia, the Food Logistics Agency (BULOG) has been successful in stabilising the domestic price of rice
from 1973 to 1997 (see Box 3). Since 1998 (and the establishment of democracy), BULOG has not been very
successful at stabilising rice prices, but high rice prices seem to be the political objective rather than stable or
efficient prices. This has led the government to restrict imports, resulting in sharp increases in the price of rice
on the domestic market (see Figure 9 in Box 3).
For instance, by February 2006 domestic rice prices in real terms had risen by 25 percent, whereas equivalent
rice on the world market had fallen in price by 11 percent. In March 2007, the SUSENAS report on poverty in
Indonesia reported a significant increase in the poverty headcount, despite fairly rapid economic growth
nationwide. A vigorous debate developed in Indonesia in 2006 over the causes of the increase in poverty (the
fuel subsidy was also reduced in 2005 and cash transfers were arranged for poor households in
compensation). The role of high rice prices, and the import ban, was heavily contested. Regardless, the
vigorous and open debate late in 2006 over the impact of the rice import ban led to discussions of how to
arrange imports in a timely fashion to prevent further price increases and harm to the poor. Options for
managing the impending rice crisis by arranging emergency rice imports were prepared for the Minister of
Trade, who immediately requested Presidential permission to start the import process. An INPRES was issued
on December 9, 2006, authorising imports. Unfortunately, there was enough political and bureaucratic
opposition to prevent rice imports from arriving until late February, which was far too late to prevent a sharp
spike in rice prices in December, 2006 and January/February, 2007. By March 2007, domestic rice prices were
57 % higher than world prices. Poverty rates stayed high, and the number of “near poor” increased
significantly.
The food transfer programme (Raskin) is of course not sufficient to fully compensate the effects of high rice
prices on poor consumers—all the more that Raskin’s targeting is very bad (see Banerjee 2016 and Indonesia
case study). Note also that high prices do not really benefit poor farmers (see Box 9).
In the Philippines, the FR agency (NFA) has a monopoly on rice imports and it manages them in order to
maintain the domestic price at a high level (see Figure 12). NFA also procures rice mainly with local farmers, at

41
a price usually higher that the market price, thereby providing an additional support to farmers. The record
indicates that the NFA has been able to buy only up to 5% of paddy production on an annual basis in the last
10 years while its support price has been within 0.98% to 1.25% of average farm-gate prices.
At the same time, NFA releases rice on the domestic market at a subsidised price in order to protect the
consumers. The NFA releases rice to its market outlets to keep consumer prices at affordable level. Records
show that, in proportion to total rice consumption, the intervention ranges from a low of 3% of rice consumption
to a high of 22%. The NFA’s release price is set lower than the prevailing wholesale rice price. Outlets sell NFA
rice to consumers at a price set by NFA, which is on average 13% lower than average prices for regularly
milled rice at the wholesale level. In some periods, the price discount reached 32%. The release price has
been less than the average market price even after controlling for the quality, which reflects the fact that NFA
may not have the volume of stocks to stabilise the market price of rice around its target price. Another possible
explanation is that retailers may not have released 100% of the subsidy received in their selling price.
Figure 12 Rice wholesale prices in the Philippines, Vietnam and Thailand
Source: Philippines case study report.
This policy finally resulted in the rice domestic price being around twice the level of the import parity price (see
Figure 12). Aligning the domestic price with the import parity price would allow poor consumer to save 10% of
their income (see Figure 13), which could allow them to diversify their food consumption.
Figure 13 Aligning the domestic price with the import parity price would allow poor consumer saving 10% of
their current expenditures
Source: Philippines case study report.

42
The lessons from Indonesia and Philippines experiences are the same: maintaining high domestic prices
(much above the level of international prices) while trying to mitigate the consequences through transfers
targeted to poor consumers is unlikely to be an effective policy. The transfers are not able to protect poor
consumers, while high prices benefit mainly the biggest farmers.
Source: Indonesia and Philippines case study reports.
Box 11 Supporting permanently the producer price and the consumer price is likely to generate huge
budgetary costs
The Philippines experience. As explained in Box 10, the Philippines FR agency (NFA) maintains high
domestic prices (by restricting imports) and releases rice on the domestic market at a subsidised price. As
already mentioned, this policy proves to be rather ineffective in protecting poor consumers: only about 25 % of
the poor have availed of the NFA rice subsidies, while nearly half of those who were able to purchase NFA rice
at its official prices are non-poor. But this policy also proved to be costly (for every dollar that NFA provided as
rice consumption subsidy, it spent $2.21 assuming there is no leakage of benefits of the programme in 2008,
see Table 10). Jah and Mehta estimated that the operational cost of the NFA rice subsidy programme (i.e.
price support and targeted rice distribution) is 2.5 % of the Philippine GDP. “In 2009, NFA was estimated to
have lost $785 million even with the subsidy included. It had the greatest level of borrowings of any state
corporation and was the largest loss-making government corporation and the largest recipient of a government
subsidy in the Philippines (Jha and Mehta 2008).” (World Bank, 2012, p. 17)
Table 10 Philippine rice subsidy: cost-benefit calculations
Measure Unit 2006 2007 2008
Effective NFA programme cost billion pesos 16.4 18.6 68.6
Maintenance and other operating expenses billion pesos 6.4 1.6 4.2
Less: Net Profit (loss) from sales billion pesos -10 -17 -64.4
Consumer price subsidy = retail price of rice – NFA rice retail price
pesos/kg 5.6 6.5 12.4
Imputed volume of NFA sales million metric tons
1.6 1.9 2.5
Total consumer subsidy billion pesos 8.7 12.4 31
Cost-benefit ratio = NFA cost/consumer subsidy 1.89 1.5 2.21
Cost-benefit ratio, assuming 50% leakage 3.77 3.01 4.42
Source: Jha and Mehta (2008) cited in the Philippines case study report.
Relying more on imports to supply NFA would be a way to strongly reduce the cost of consumer rice subsidy
(as the international price accounts for only half of the domestic price) and to have a stronger decreasing effect
of the domestic consumer price. But it would also reduce the level of the domestic producer price and it seems
that maintaining this price at a high level is the priority of the government.
The Zambia experience. The Zambia stockholding programme proved to be extremely expensive. Its cost has
been estimated at 352.8 million USD, accounting for 8.2% of total budget expenditures and 1.9% of the GDP.
One of the main reasons for its high cost was the difference between the procurement price and the release
price (maize is purchased from the farmers by the FR Agency at a high price and sold to millers at a subsidised
price). This price gap generated a cost of 150 million USD, accounting for 42.5% of the total cost of the FR
programme. This measure is not even effective, as it appears that millers do not really pass on the subsidy in
their selling price (World Bank, 2012 and Zambia case study).
Synthesis. The results presented above for the Philippines and Zambia are convergent with the result
obtained for India and Indonesia after 1998. It appears that when countries aim to support both producer price
and consumer price permanently, the overall cost of FR can be substantial compared to the cost of other public
spending. Table 11 below compares the cost of FR (expressed as a percentage of GDP) with the cost of
spending on agriculture and with the cost of agricultural research and development. It appears that the cost of
FR may account for a large share of spending in agriculture and may be much higher than spending in
agricultural research and development. Meaning the opportunity cost of FR is huge, as expensive FR result in
crowding out public spending on other public goods.
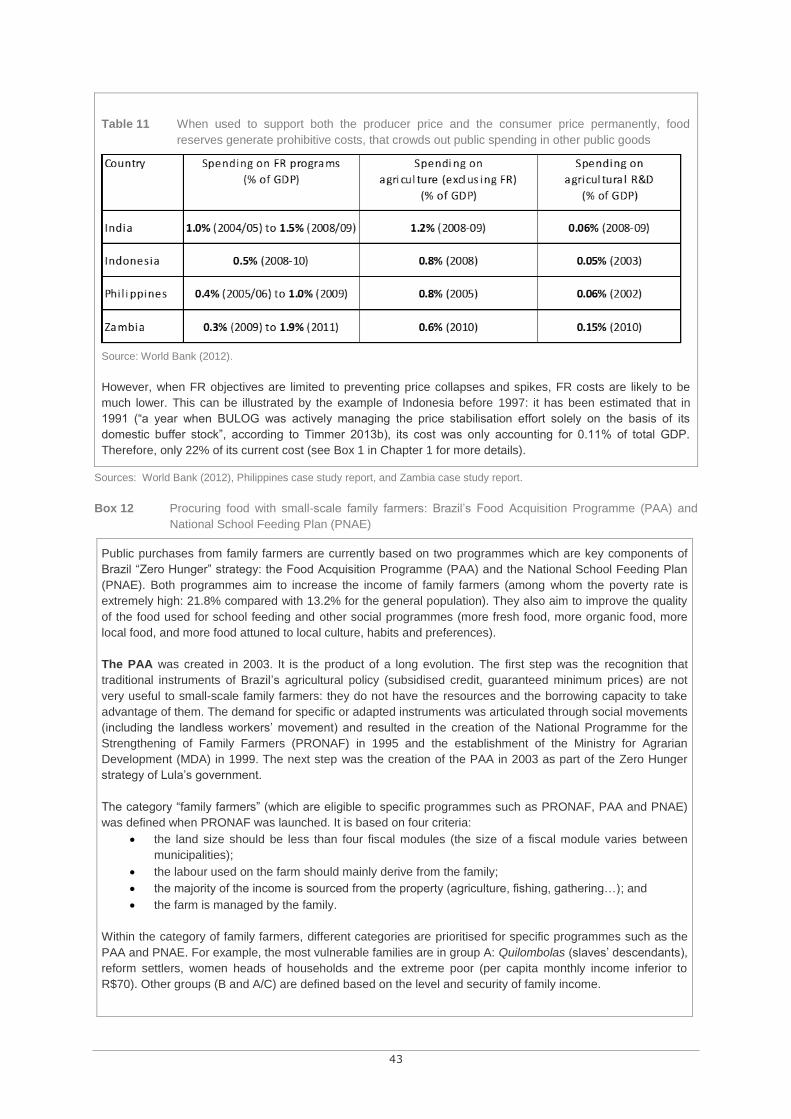
43
Table 11 When used to support both the producer price and the consumer price permanently, food
reserves generate prohibitive costs, that crowds out public spending in other public goods
Source: World Bank (2012).
However, when FR objectives are limited to preventing price collapses and spikes, FR costs are likely to be
much lower. This can be illustrated by the example of Indonesia before 1997: it has been estimated that in
1991 (“a year when BULOG was actively managing the price stabilisation effort solely on the basis of its
domestic buffer stock”, according to Timmer 2013b), its cost was only accounting for 0.11% of total GDP.
Therefore, only 22% of its current cost (see Box 1 in Chapter 1 for more details).
Sources: World Bank (2012), Philippines case study report, and Zambia case study report.
Box 12 Procuring food with small-scale family farmers: Brazil’s Food Acquisition Programme (PAA) and
National School Feeding Plan (PNAE)
Public purchases from family farmers are currently based on two programmes which are key components of
Brazil “Zero Hunger” strategy: the Food Acquisition Programme (PAA) and the National School Feeding Plan
(PNAE). Both programmes aim to increase the income of family farmers (among whom the poverty rate is
extremely high: 21.8% compared with 13.2% for the general population). They also aim to improve the quality
of the food used for school feeding and other social programmes (more fresh food, more organic food, more
local food, and more food attuned to local culture, habits and preferences).
The PAA was created in 2003. It is the product of a long evolution. The first step was the recognition that
traditional instruments of Brazil’s agricultural policy (subsidised credit, guaranteed minimum prices) are not
very useful to small-scale family farmers: they do not have the resources and the borrowing capacity to take
advantage of them. The demand for specific or adapted instruments was articulated through social movements
(including the landless workers’ movement) and resulted in the creation of the National Programme for the
Strengthening of Family Farmers (PRONAF) in 1995 and the establishment of the Ministry for Agrarian
Development (MDA) in 1999. The next step was the creation of the PAA in 2003 as part of the Zero Hunger
strategy of Lula’s government.
The category “family farmers” (which are eligible to specific programmes such as PRONAF, PAA and PNAE)
was defined when PRONAF was launched. It is based on four criteria:
• the land size should be less than four fiscal modules (the size of a fiscal module varies between
municipalities);
• the labour used on the farm should mainly derive from the family;
• the majority of the income is sourced from the property (agriculture, fishing, gathering…); and
• the farm is managed by the family.
Within the category of family farmers, different categories are prioritised for specific programmes such as the
PAA and PNAE. For example, the most vulnerable families are in group A: Quilombolas (slaves’ descendants),
reform settlers, women heads of households and the extreme poor (per capita monthly income inferior to
R$70). Other groups (B and A/C) are defined based on the level and security of family income.

44
The PAA’s objectives were defined as follows:
• incentivise family farm production;
• incentivise the consumption of family farm production;
• promote access (in quantity, quality and regularity) to food for populations in situations of food and
nutritional insecurity;
• build FR;
• assist the creation of food stocks by farmer organisations; and
• strengthen local and regional networks for food marketing.
The PAA is mainly focused on organising public purchases from family farmers. It is based on simplified
procurement procedures which bypass the bidding legislation that, for different reasons, makes it almost
impossible for small-scale family farmers to compete with larger producers and companies. The PAA benefited
from the previous experience of Brazil’s FR agency (Conab): many of the PAA modalities were adapted from
the existing instruments operated by Conab to guarantee minimum prices or build FR. However, new
modalities were introduced. A very innovative one is the Direct Purchase for Simultaneous Donation (CDDS)
where farmers or farmer organisations make a proposal to directly deliver their produce to food-insecure
populations they have identified in nurseries, public hospitals, schools, community restaurants etc.. Six
modalities coexist today (see Table 12).
Table 12 Modalities of the Food Acquisition Programme (PAA)
Sources: MDA website, IPC-IG and WFP (2013), and Brazil case study report.
Depending on the modality, the resources are provided by the MDA and/or the Ministry of Social Development
and Fight against Hunger (MDS) and the implementing agencies may differ. Conab is managing more than
50% of PAA’s overall purchases, states around 33% and municipalities around 15%. Each modality has its
own specificities. The second one is not strictly speaking for public purchases as, in this case, the PAA does
not procure food: it rather provides resources to farmer organisations in order to help them purchase food to
build stocks. In the fifth modality (implemented since 2016), family farmers are the suppliers of the seeds and
young plants that will benefit other family farmers. The last modality (launched in 2012) is a way to expand the
coverage of the PAA without increasing its budget: the right has been given to administrations (at the federal,
state or municipal level) to use PAA’s procurement procedures to purchase food (with their own resources).
The use of the food procured varies depending on the modality. CDDS and PAA Leite are used for donation to
vulnerable or food insecure populations. Institutional Purchases are used to meet the regular demand of
administrations (hospitals, army, universities, day nurseries etc.). The CDAF modality is activated when prices
are decreasing too much (in which case the food purchased is stored in FR) or when there is the need to
provide support to food insecure populations.
For each modality, the quantity a family can sell to the PAA is capped, the level of the ceiling depending on the
modality (see Table 12). Note that, for CDDS, the ceiling is higher when the farmer applies through a farmer
organisation: this is a way to incentivise them to be part of FOs (and thereby to strengthen them). A given
family can apply under several modalities, thereby increasing the quantity it can sell to the PAA during a year.

45
The procurement prices applied by the PAA are generally not much higher than the prices prevailing on
regional markets: the theory of change is that a guaranteed demand may be enough to boost and improve the
production of small-scale farmers. However, since 2011, the procurement price is 30% higher for organically
certified or agro-ecologically produced products.
The dynamics of PAA’s resources (by modality) is displayed in Figure 14 below. The last two modalities are
not represented: the “acquisition of seeds” modality was only launched in 2016 and no data on institutional
purchases are available at the country level.
Figure 14 PAA’s resources (by modality)
Source: PAA database.
Since the launching of the PAA in 2003, its resources have strongly increased, and stabilised in 2013 around
R$ 500 million (equivalent to 121 million euros at September 2018 exchange rates). Note that the weight of the
modalities used to supply free distributions (CDDS and PPA-Leite) increased considerably.
The products purchased are highly diversified with a high percentage of fresh products (Figure 15).
Figure 15 Weight of food product categories in PAA’s quantity purchased (in 2016)
Source: PAA database.

46
Note that grains and beans are not a significant component of PAA’s purchases. As a consequence, the PAA’s
contribution to the building of grain reserves has been limited: according to Conab’s data, over the period
2003-2015, it has been around 1.4% for the rice reserve, 0.3% for the maize reserve and 2.4% for the wheat
reserve. The situation is different for beans: the PAA’s contribution was 19.2% over 2003-2015 but this is only
because the level of the bean reserve is small (around 47 000 tons on average compared to 1 900 000 tons
for maize, 755 000 tons for rice and 400 000 tons for wheat).
Figure 16 Quantity of food purchased by the PAA (in tons)
Source: PAA database.
Figure 17 Number of family farmers supplying the PAA
Source: PAA database.

47
The quantity purchased by the PAA regularly increased (see Figure 16), following the increase in the PAA’s
financial resources displayed on Figure 14. Note that the quantity procured under the “institutional purchases”
modality is not included in Figure 16. This is because no data on institutional purchases are available at the
country level. This quantity is likely to be significant, especially since 2016: a decree from June 2015 specified
that, from 1st January 2016, all public federal administrations (direct and indirect) should use at least 30% of
their resources dedicated to the purchase of food products to buy products from family agriculture. And PAA’s
“institutional purchases” modality is often the best-suited way to do that. Note also that for “institutional
purchases” the purchase limit is higher than for other PAA modalities (R$ 20 000 / year / family / purchasing
administration).
The number of participating family farmers (displayed in Figure 17) increased regularly but less than the
resources and quantity purchased, reflecting the fact that the purchase limit by family has been regularly
increased since the launching of the PAA in 2003. After reaching 190 000 in 2012, the number of family
farmers supplying the PAA is now stabilised around 100 000, around 2-3% of Brazil total number of family
farmers. Note however that this figure is underestimated, as the “institutional purchases” modality is not
included.
PAA’s impacts. No quantitative study has yet been performed to assess the PAA’s impacts at the national
level. However, several studies have been implemented, often in specific regions. These studies (reviewed by
IPC-IG and WFP, 2013) identify some impacts of the PAA, including the following:
Prices. Although the PAA purchase prices are in line with the prices available on regional markets, they
nonetheless often result in higher prices for farmers. The reason for this is imperfect competition: a study in
three municipalities of Bahia state showed that, before the PAA was implemented, all farmers that are now
supplying the PAA were at the mercy of a single trader. In a municipality of Saõ Paulo, the PAA prices were
more than 45% higher than the average offered by intermediaries. Sometimes, the PAA purchase price played
the role of a reference price. For instance, it has been observed in Rio Grande del Norte state, that the PAA
had the effect of increasing not only the price received by its suppliers but also the price received by farmers
who sold to private traders.
Production. A 2007 study showed that one-third of PAA beneficiaries increased their cultivated area and two-
thirds increased the level of technology in crop production. The same study showed that the PAA has reignited
the production of many crops that were no longer produced in many regions of Brazil. This increase in the
diversity of production is confirmed by other studies: according to a 2013 review of 29 evaluation studies of the
PAA (cited in IPC-IG, 2013), 72% of the studies reported an increase in the diversity of production; and 52%
also reported an improvement in the quality of the products.
Farmer organisation and marketing channels. Several studies showed that the PAA resulted in the revival of
local farmers’ markets and the development of new marketing channels, as well as the strengthening of farmer
organisations.
Income. A study in three municipalities of the state of Panará showed that the income of PAA suppliers
increased by 25% for producers that had accessed family farm credit and by 43% for those who did not
receive credit (smaller in income and land area). Also, the PAA generated a steady flow of income throughout
the year, as opposed to one or two payments per year at harvest time when the production was sold to private
traders. However, the poorest farmers (those who consume most of their production), can hardly participate in
the PAA.
The PNAE is also the product of a long history. The first government programmes related to school feeding
were launched in 1945. They were initially based on food aid received from the international community and
driven through partnerships, especially with UNICEF and USAID. At that time, the focus was clearly on food
and nutrition, meaning that no attention was paid to the cultural adequacy of the food provided. The results
were not really satisfactory: the coverage was not national (as it was supposed to be) and the frequency of
supply of food to schools was very irregular. In the 1970s, the school feeding programme switched towards
substituting national food for imported food. In 1976 it was integrated into the Second Food and Nutrition
National Programme (II PRONAN) and renamed PNAE in 1979. Note that PRONAN II encompassed a
broader set of interventions not only focused on school-age children but also on workers, mothers and young
48
children, especially those living in the poorest areas of the country. The intention to support “local farmers”
was explicitly mentioned. This programme was not fully successful and its limitations were explained by the
centralised procurement process: logistical bottlenecks related to transportation and storage (resulting in
delayed deliveries), the same menu for all regions in the country (disregarding regional habits and
preferences), public purchases mainly benefiting large companies specialised in processed food that can be
stored easily (according to Fialho 2009 cited by IPC-IG and WFP 2013, in 1993 only two companies were
supplying 48% of the food purchased by the PNAE). The next switch in Brazil school feeding policy was the
decentralisation of the process in 1994 (in the spirit of the 1988 Brazilian Constitution that stated the right to
universal school feeding in public schools and that promoted a high level of decentralisation in the provision of
social services, in particular education).
This decentralisation has been a decisive step in increasing family farmers’ access to PNAE’s public
purchases. Since then, the Federal government has been transferring to states and municipalities resources
earmarked to school meals (since 1998, the management of the programme is under the National Fund for the
Development of Education or FNDE). The next step came in 1998 when a decree established the reduction in
the number of processed or easy-to-prepare food items on the list of products that can be purchased with
federal resources. It was supplemented in 2001 by another decree stipulating that 70% of the FNDE’s
resources for school feeding should be used to purchase foods that meet the regional/local eating habits and
the availability of local crops. This vision was strengthened in 2003 with the launch of the Zero Hunger strategy
where the concepts of ‘food culture’ and ‘local solutions’ were highlighted. In 2007, a survey showed that
municipalities and states were actually purchasing locally but not always from small-scale family farmers. At
that time, the idea of expanding the legal framework developed by the PAA was already being pushed by civil
society and debated in the federal government.
This led in 2009 to a law stating that at least 30% of the products purchased for school meals with federal
resources should be bought from smallholder farmers or their organisations. The previous experience of PAA
played a decisive role in demonstrating that it was feasible to procure food from small-scale family farmers
providing that the procurement laws were revised. Criteria of eligibility and priority to supply the PNAE under
the 30% modality were also copied from PAA (including the priority given to organic food and food produced
via agroecological practices).
The rules and procedures of PNAE define the following steps:
1. The federal government transfers resources for school meals to states and municipalities;
2. Dietitians prepare menus taking into account nutritional requirements and products produced locally
by smallholder farmers, which determines the amount of each product to be purchased;
3. A purchase price is determined taking into account the prices prevailing on local markets and
transportation costs;
4. An open call details the products, prices and quantities required;
5. Family farmers respond to this call by sending a sale proposal (the limit being R$ 20 000 per year);
6. Proposals are evaluated and selected (including quality control);
7. Contracts are signed (which specify the dates for delivery and payment); and
8. The products are delivered.
PNAE’s budget has increased regularly over the years (see Figure 18) both because its coverage has
increased (for instance, secondary school students were included from 2009) and because the amount
transferred for each school meal has also increased. In 2015, the PNAE budget reached R$3750 million of
which R$858 million is dedicated to purchases from family farmers (equivalent to 208 million euros at
September 2018 exchange rates), more than the budget of the PAA (around R$500 million).
PNAE data shows that, for now, the minimum requirement of 30% of food purchases made with family farmers
is not fully enforced in all municipalities. In fact, there is a great heterogeneity among regions, with the
percentage of food procured from family farmers varying from 22% in the North to 37% in the South (see
Figure 19 below).
On average, at the national level, the percentage of PNAE’s resources used to purchase food from family
farmers increased regularly over time: from 7.8% in 2011 to 22.8% in 2015 (see Figure 20). The percentage of
municipalities complying with the 30% rule also increased regularly: from 26.6% in 2011 to 44.4% in 2015.

49
This means that the percentage of food purchased from family farmers is likely not only to reach but to surpass
30%: the 30% rule should be implemented by all municipalities and, since many of them already go beyond,
the average percentage will be higher than 30%. The practical implication is that the quantity of food
purchased from family farmers under the PNAE should increase in the next years, even if the PNAE overall
budget does not increase (and even more if, as probable, the budget goes on increasing).
Figure 18 PNAE’s resources and purchases from family farmers (in million R$)
Source: PNAE database.
Figure 19 Share of the resources transferred by the federal government for school meals used for
purchases from family agriculture (by municipality)
Source: MEC – FNDE cited in Brazil case study report.
More than 0and less than 30%
From 30% to 100%
More than 100%
Proportion of food purchased from family agriculture in relation to the total support granted by Federal Government to school meals.
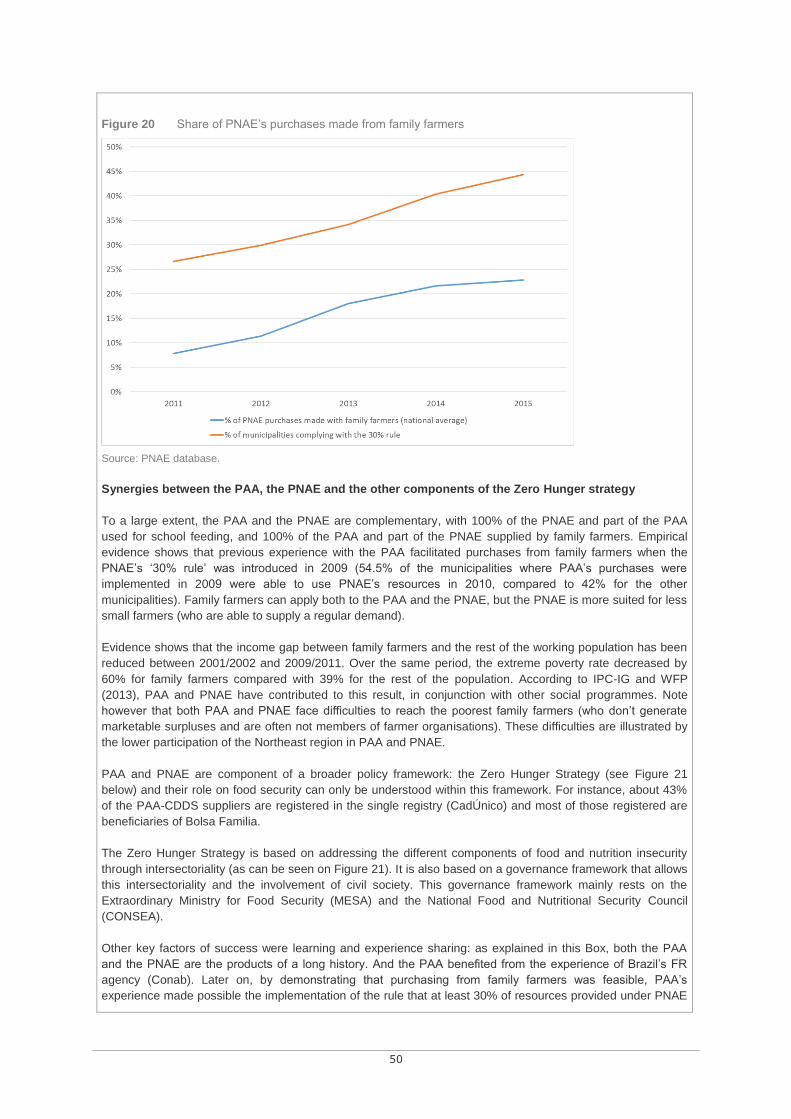
50
Figure 20 Share of PNAE’s purchases made from family farmers
Source: PNAE database.
Synergies between the PAA, the PNAE and the other components of the Zero Hunger strategy
To a large extent, the PAA and the PNAE are complementary, with 100% of the PNAE and part of the PAA
used for school feeding, and 100% of the PAA and part of the PNAE supplied by family farmers. Empirical
evidence shows that previous experience with the PAA facilitated purchases from family farmers when the
PNAE’s ‘30% rule’ was introduced in 2009 (54.5% of the municipalities where PAA’s purchases were
implemented in 2009 were able to use PNAE’s resources in 2010, compared to 42% for the other
municipalities). Family farmers can apply both to the PAA and the PNAE, but the PNAE is more suited for less
small farmers (who are able to supply a regular demand).
Evidence shows that the income gap between family farmers and the rest of the working population has been
reduced between 2001/2002 and 2009/2011. Over the same period, the extreme poverty rate decreased by
60% for family farmers compared with 39% for the rest of the population. According to IPC-IG and WFP
(2013), PAA and PNAE have contributed to this result, in conjunction with other social programmes. Note
however that both PAA and PNAE face difficulties to reach the poorest family farmers (who don’t generate
marketable surpluses and are often not members of farmer organisations). These difficulties are illustrated by
the lower participation of the Northeast region in PAA and PNAE.
PAA and PNAE are component of a broader policy framework: the Zero Hunger Strategy (see Figure 21
below) and their role on food security can only be understood within this framework. For instance, about 43%
of the PAA-CDDS suppliers are registered in the single registry (CadÚnico) and most of those registered are
beneficiaries of Bolsa Familia.
The Zero Hunger Strategy is based on addressing the different components of food and nutrition insecurity
through intersectoriality (as can be seen on Figure 21). It is also based on a governance framework that allows
this intersectoriality and the involvement of civil society. This governance framework mainly rests on the
Extraordinary Ministry for Food Security (MESA) and the National Food and Nutritional Security Council
(CONSEA).
Other key factors of success were learning and experience sharing: as explained in this Box, both the PAA
and the PNAE are the products of a long history. And the PAA benefited from the experience of Brazil’s FR
agency (Conab). Later on, by demonstrating that purchasing from family farmers was feasible, PAA’s
experience made possible the implementation of the rule that at least 30% of resources provided under PNAE

51
should be used to purchase food from family farmers. And this ‘30% rule’ was recently extended to the food
purchases of all public federal administrations (thereby boosting the ‘institutional purchases’ modality of the
PAA).
Figure 21 PAA and PNAE within the Zero Hunger Strategy
The Zero Hunger Strategy is based on the following components:
1. Access to food
Bolsa Familia (conditional cash transfers)
School Feeding programme (PNAE)
Vitamin A and iron supplementation
Food assistance for vulnerable groups
Food and nutrition education
Food and nutrition system (SIVAN)
Workers’ food programme (PAT)
Local and regional networks (popular restaurants; community kitchens; fairs; food banks)
Cisterns for water
2. Strengthening family farmers
Subsidised credit (PRONAF)
Rural insurance and crop insurance
Food Acquisition Programme (PAA)
3. Income generation
Training (PLANSEC)
Solidarity and productive economy
Inclusion microcredit
Regional structures for food and nutrition security
4. Social mobilisation and social accountability
Centre for social assistance (CRAS)
Programme for family care (PAIF)
Other social programmes
Source: Aranha (2013), cited in IPC-IG and WFP (2013).
Sources: IPC-IG and WFP (2013), and Brazil case study report.

52
HOW TO GOVERN FOOD RESERVES?
5.1 Defining clear, relevant and realistic objectives
FR can be used to provide support to consumers and producers. In both cases, this support can be i) permanent
or activated only in periods of crisis and ii) non-targeted or targeted. A simple rule is that all permanent supports
should be targeted. This implies that prices should not be maintained permanently at low or high levels:
domestic prices should follow the mid-term trend of international prices. In other words, interventions on
staple prices should be implemented only to prevent price collapses or surges. Maintaining permanently prices at
a low level is costly and discourages production (it is the “urban bias” issue experienced by many African
countries during the 1960s and 1970s). Similarly, maintaining permanently prices at a high level is likely to be
very damaging for food and nutrition security, even if subsidies are implemented to support (poor) consumers (as
illustrated by the current experiences of the Philippines, Zambia and, since 1998, Indonesia, see Box 10 in
Chapter 4). It is also likely to be extremely costly (see Box 1 in Chapter 1 and Box 11 in Chapter 4), thereby
generating high opportunity costs in terms of healthcare and education.
FR can therefore be used for several objectives such as i) providing permanent transfers to food insecure
households (Chapter 2), ii) supplying or backing emergency interventions in periods of crisis (Chapter 3), iii)
stimulating farmer investment in food production by protecting them against price collapses and by providing
specific incentives related to the way to produce or market food products (Chapter 4). Of course, as seen in the
previous Chapters, the relevance of the objectives (and the usefulness of FR to reach them) strongly
depends on the situation of the considered country. Whatever the elected objectives, they should be clearly
specified.
5.2 Rules for a good governance of food reserves
Good governance is crucial in order to allow FR to reach their food and nutrition security objectives, while
minimising their budgetary cost and the distortions they may provoke on food markets.
1. The composition, size and location for the FR should be chosen carefully in order to meet the FR
objectives and the specificities of the context. For instance, as seen in the previous Chapter, the right size for the
FR strongly depends on whether the considered food products are traded on international markets, whether the
considered country is an exporter or an importer, and on import timelines.
2. The physical management of the stock (treatments, rotation etc.) should avoid losses, quality
deterioration and diversions
3. FR interventions should be rules-based and the rules should be publicly known (transparency of the rules).
This allows rendering interventions predictable by market players, thereby reducing the crowding out effect on
private storage and private trade. This also allows a more rapid response in situation of emergency (many
countries have designed “contingency plans” defining the actions that should be implemented when specific
conditions are met). These rules should specify i) the triggers and ii) the modalities of FR interventions. These
aspects are detailed in points 4 and 5 below.
4. FR interventions should be triggered by relevant criteria. For interventions to mitigate price increases, the
simplest rule is to trigger FR interventions when the domestic price reaches a predefined ceiling. This ceiling price
should not be set at a level which is too low in order to avoid crowding out private storage. For interventions in the
form of food transfers, specific triggers have to be defined. They are usually based on food and nutrition security
indicators (provided by early warning systems in the case of emergency transfers). These indicators usually
aggregate data on the causes of food crises (pluviometry, production forecasts, lack of pasture, price surges,
income collapses…), on malnutrition and on the coping strategies implemented by households when they began
to be in difficulty (migration…). FR procurement can be triggered when the price reaches a minimum predefined
level (when the aim is to hold the price above a floor) or when there is a need to replenish the reserve. The period
of procurement should be announced in advance, as well as the quantity desired and the procurement price. For
all types of FR interventions, the triggers should be defined carefully and regularly updated. A good way to do this
is to adopt an approach based on i) data and empirical evidences and ii) discussion forum with the participation of
53
representatives of different categories of market players (such as the plateforme riz successfully implemented in
Madagascar, see David-Benz, 2013).
5. FR purchases, sales and distributions should guarantee fairness among market players and potential
recipients. When FR are used for transfers, the nature and quantity of the food products transferred should be
clearly defined, as well as the targeting rules. When the FR agency purchases or sells on the domestic market,
the modalities of these market operations should be open and transparent. For instance, tenders can be
organised to guarantee a fair competition between market players, which does not prevent defining specific
conditions for specific categories of market players (such as farmer organisations), providing that these conditions
are the same for all market players within a category. The interventions of national FR should also take into
account the existence of local FR (such as Sahel banques de céréales which are managed by municipalities or
local communities): as a matter of fact, FR procurement or distribution can generate huge problems for local
reserves. On the contrary however, a good articulation with local reserves can increase the cost-effectiveness of
national FR. This articulation can for instance take the form of contract allowing the national FR to procure or
distribute grains through local reserves (for more details, see the Burkina Faso case study).
6. The conditions for an effective implementation of the planned interventions should be created:
• Information on the triggering indicators should be available, not only for the FR agency but for all market
players (this transparency of the indicators is complementary to the transparency of the rules highlighted
in point 3).
• The FR agency should have the means to react quickly when it appears that an intervention is useful or
necessary (in terms of staff, infrastructures, equipment and budget). Timely interventions condition the
cost-effectiveness of FR. For instance, early procurement (during the post-harvest period) often allows for
reducing the cost of food purchased (see Chapter 2) but they are possible only if appropriate rules and
procedures do exist and if the FR agency has a working capital. Above all, emergency interventions
should be implemented very quickly, which implies that the size, composition and location of physical
reserves are adequate to manage the shocks that are likely to occur in the considered country.
• Conditions should be created to guarantee that the subsidised food provided to consumers actually reach
them. This may mean providing the subsidised food products to consumers directly (through a public
distribution system) or designing institutions to lead traders to pass on the subsidies in their selling price.
These institutions may take the form of contracts between the government and the market players who
receive the subsidies, accompanied by monitoring system to guarantee their enforcement.
• The management of its staff by the FR agency should create the conditions for a good enforcement of the
rules (monitoring and evaluation system, incentives).
7. FR activities and interventions should be monitored and evaluated
• Data on FR interventions and their effects should be regularly produced and disseminated in order to
guarantee the transparency on FR interventions and to allow for regular improvement in the management
of interventions.
• Monitoring the costs of FR. All the costs generated by FR activities (storage and operations such as
purchases, sales and distributions) should be registered. These costs should include monetary cost but
also an estimation of opportunity costs (if the FR agency purchases with its own money, the resulting loss
in financial interest should be estimated using the current interest rate; if the FR agency uses its own
warehouses, the loss resulting for not renting the warehouses should be estimated). The cost should be
expressed not only in the categories used in accountability (wages, energy, transport…) but also by
activities (procurement, storage, distribution etc.). This is necessary if the monitoring aims to improve the
management and reduce the costs.
5.3 Articulating food reserves with private stocks
An important dimension of the governance of FR is to guarantee their good articulation with private storage. FR
should not discourage private storage, as may occur when poorly managed FR implement unpredictable and
untimely interventions. And private storage cannot substitute FR, even when subsidized (see Annex 1 for more
details). To strengthen the synergies between private and public storage, FR should be well managed (see
Recommendation Box 4).

54
Recommendation Box 4
Policies based on subsidising private storage would be difficult to implement and may generate unfair
competition between market players. Their effects on price stability are rather uncertain and can even be
negative. Policy-makers should therefore be very cautious before implementing this kind of policies.
However, private stocks play an important role for food and nutrition security and policies should rely on them
when possible and create an enabling environment for private storage. It is for instance possible to rely on
private stocks to supply food transfers: this is the case every time just-in-time purchases are implemented.
Private storage can also be supported indirectly by providing support to warehouse receipt systems (through
projects or public purchases as is already done by the WFP in some countries, see Chapter 4). And an
enabling environment for private storage may be created if policy interventions are rules-based: this especially
applies to interventions to mitigate food price increases that should be triggered by a predefined, publicly
known and not to low ceiling price (see Chapter 5).

55
II. INTERNATIONAL DIMENSIONS: THE
EFFECT OF NATIONAL FOOD RESERVES
ON GLOBAL FOOD AND NUTRITION
SECURITY AND RELATED ISSUES

56
EFFECT OF NATIONAL FOOD RESERVES ON GLOBAL FOOD AND
NUTRITION SECURITY
From the point of view of the EU, other donors or international organisations the (positive or negative) effects of
policies implemented by a given country on other countries should be taken into account. These effects are
usually mediated through international markets for tradable goods and regional markets for non-tradable goods.
First, we will consider the need for stocks to guarantee the stability of international markets. We will then consider
the different options for stimulating storage and show the decisive role of grain FR in importing countries
(especially big importing countries).
6.1 The need for stocks to guarantee the stability of international prices
6.1.1 Theoretical stabilising effect of stocks on international prices
To figure out the effect of stocks on international prices, let us imagine a world without stocks. When hit by a
production shock, countries would immediately increase their imports or decrease their exports, thereby exporting
the instability on international markets. This would happen even without any measure to regulate external trade:
the increase in the domestic price would automatically make it more profitable to import or less profitable to
export. Moreover, policies aiming to help vulnerable households to cope with increased food prices would likely
exacerbate the transfer of instability to international markets. For instance, emergency cash transfers would result
in maintaining the demand for (basic) food products which, in a situation of low stocks and reduced production,
would lead either to increase even more the domestic price, to increase imports, or to decrease exports.
Therefore, regarding the impact on international markets, providing emergency transfers in a context of low stocks
is not very different from implementing policies to restrict exports or stimulate imports (HLPE, 2011; Do,
Levchenko, and Ravallion 2013).
Holding stocks changes everything. Affected countries can absorb shocks by their internal means instead of
exporting the instability on international markets (by reducing their exports or increasing their imports). For
instance, an importing country hit by a bad harvest can use its stocks to compensate for part of its internal deficit,
thereby exerting a lower pressure on international markets. This country will probably increase its imports later on
to rebuild its stocks but it will try to do so when international prices are low. The stocks held by not affected
countries may play the role of a buffer for affected countries (they can help in absorbing the shocks exported on
international markets, as illustrated by the role played by the Japanese stock in 2008, see Box 13 below).
Conversely, when importing countries do not hold stocks, they have to rely exclusively and immediately on
imports when hit by a shock, which results in exporting the instability on international markets. For big importing
countries, this effect can be significant and may increase international prices. The situation can even be worse, as
importing countries that do not hold enough stocks may panic if the food products they need become scarce on
international markets: they then increase their imports, thereby exacerbating the increase in international prices.
This is exactly what happened in 2008 on the rice market.
6.1.2 Lessons from the 2008 crisis
During the 2008 crisis, several big countries restricted their exports (for instance, India export ban on non-basmati
rice resulted in India rice exports falling from 6.45 to 2.48 million tons), whereas some big importing countries
panicked and increased their imports (for instance, Philippines rice imports jumped from 1.8 in 2007 to 2.43
million tons in 2008). As the international rice market is rather thin (around 30 million tons compared to 100 for
maize and 120 for wheat), the 2008 decrease in India exports accounted for more than 13% of the quantity traded
on the international rice market and the increase in Philippines imports for around 5% of it. As the first policies
implemented exacerbated the increase in international prices, they led other countries to implement the same
kind of policies. According to Headey (2011), around 50% of the bubble was due to export bans and 50% to panic
imports. The chronology of the crisis is displayed on Figure 22 below.

57
Figure 22 Chronology of the 2008 crisis on the international rice market
Source: Headey (2011).
The fact that the 2008 crisis was allowed by the low level of global stocks appears clearly from a prediction made
in 2005 regarding the high probability of a crisis on international grain markets. This prediction was based on the
observation of the decreasing trend in Chinese, European and US grain stocks:
[…] China, the European Union (15) and the United States accounted for a combined 48 percent of world grain production, 69 percent of world grain stocks, and 56 percent of world grain exports during 1990-99. All three have had major grain stock policy changes in the past two decades. China has only recently changed its stockholding policy, but it has reduced stocks quickly from very high levels. The United States changed its policy in 1985 and reduced government stockholding significantly in the following years. The European Union changed its grain policy starting in 1992 and has reduced total and intervention stocks. The combined impact of policy change in these countries has been to reduce their stocks by more than half since the recent highs in 1999. World grain stocks have also been affected, with the level of stocks falling from 31 percent of total use in 1999 to 18 percent in 2003—the lowest level since the mid-1970s. These reductions in stocks in the United States and the European Union have not yet had an apparent impact on price variability, at least in part, because of the relative stagnation in world grain trade since 1980. However, this is likely to change because the stagnation was caused in large part by the increase and subsequent decline of imports by transition countries (the former Soviet Union and Eastern Europe) which accounted for nearly one quarter of world imports at their peak in 1981, and now account for about 3 percent. When excluded, imports by the rest of the world have grown at double the world rate of 0.8 percent per annum since 1980. If these trends continue, and China no longer has large stocks to buffer changes in demand and supply, then world grain imports could become more variable and grow more rapidly than in the past. […] It seems […] likely that lower grain stocks and more rapid and variable import growth will lead to greater grain price variability. (Mitchell and Levallée, 2005, p. 2)
The prediction of Mitchell and Levallée became reality in 2008: whatever the direct (controversial) triggers of this
crisis, it is rather consensual that it would not have occurred if global grain stocks would have been significantly
higher (Wright, 2009; Wiggins and Keats, 2010; Bobenrieth et al. 2012). As a matter of fact, global grain stocks
(expressed as a percentage of annual uses) strongly decreased until 2007 and then began to increase again (see
Figure 23), which can be interpreted as countries’ reaction to the 2008 crisis.

58
Figure 23 Global grain stocks since 1985 (as a percentage of annual uses)
Source: USDA PSD.
Last but not least, it seems that, in 2008, the Japanese stock played an important role in ending the bubble and
provoking a reversal of the increasing trend in rice prices. We are referring here to Japan “minimum access rice
reserve”. Under the minimum access quota system, Japan is committed with the WTO to importing every year a
given quantity of rice (in 2007, this quantity was equal to 770,000 tons of unmilled rice). This imported rice is
usually not consumed by the Japanese people: it is stored and then donated to other countries in the form of food
aid, sold to food processors or used to feed animals. Japan is of course not allowed to reexport this rice.
However, in 2008, because of the international rice crisis, Japan was exceptionally allowed to do so. The most
interesting part of the story is that the mere fact of Japan being allowed to re-export its imported rice stock was
enough to stop the crisis, even though these re-exports were never actually made (see Box 13).
Box 13 The role of Japanese stocks in ending the 2008 crisis on the international rice market
In May 2008, the Philippines secretly approached Japan for 200,000 tons of its imported rice, but Manila
initially felt that Tokyo might not be forthcoming because of expected objections from the U.S. government. On
May 9, a cloud formed over the fire with the Center for Global Development (CGD) publishing a paper
“Unwanted Rice in Japan Can Solve the Rice Crisis – If Washington and Tokyo Act” which argued that world
prices could be cut to $500-600/ton by the end of June if existing stocks in Thailand, China, and Japan were to
be exported. (Tokyo was holding over 1.5 million tons of imported rice and the paper pointed out that Beijing
had inventories which were equivalent to four months of consumption so it could easily double its 2007 export
level of 1.4 million tons). That same day, the Philippines publicly disclosed that it was negotiating with Japan for
60,000 tons of its domestic rice. The proposal gathered momentum in Washington with questions raised in
back-to-back congressional hearings on May 12 in both the U.S. Senate and House of Representatives. The
next day, the U.S. publicly indicated that it would not oppose Japan's re-export of rice; privately Washington
also told Tokyo that it would not press Japan to fulfil the balance of its 2007 buying commitments and those
agreed upon for 2008 until after the crisis abated.
Suddenly the world market began to realise that Japan’s stocks of imported rice might come into play. While
market fundamentals had not changed significantly, market sentiment was clearly beginning to shift.

59
Japanese Firefighters Fail To Respond To Alarms. While policymakers in the U.S. quickly responded to
political and public pressure ignited by the CGD paper, giving Japan the green light to release its excess
imported rice stocks, Tokyo’s response was disappointing. At high level international meetings held in Rome in
early June, Japan’s P.M. Fukuda committed "to release in the near future over 300,000 tons of imported rice”
to the world market. The public commitment, while more cautious than what was hoped for by the U.S.
government and the CGD authors, was welcomed. Once the public spotlight faded and the political leadership
changed in Tokyo, this pledge by Japan failed to be honoured. Unofficial trade data shows that Japan’s food
aid shipments of rice declined in 2008 to less than 117,000 tons – more than 5,000 tons below that shipped
one year earlier. While releasing its stocks would have relieved its exchequer significant costs for storing
unwanted inventory, Japan’s rice aid exports in 2008 were 91,000 tons below that averaged in the preceding
five-year period and were the lowest level shipped since 1997.
Source: Slayton (2009).
6.1.3 Long-term evidences of the stabilising effect of stocks on international prices
The stabilising effect of stocks (private stocks + public stocks) can be evidenced by plotting the global stock-to-
use ratio (STUR) of a given grain against its international price. As illustrated on Figures 24, 25 and 26 below for
the case of wheat, maize and rice, it clearly appears that price spikes only occur when the level of global stocks is
low.
However, the price-stock relationship seems to be much less confirmed in the case of rice (see Figure 26). In
1981, 1995 and 2008 the international price of rice spiked in spite of rather high levels of stocks. According to
Bobenrieth et al. (2012), this can be easily explained by the fact that wheat, maize and rice are substitutable to
some extent: the price of rice may spike because the stocks of maize or wheat are low. As we have seen, this is
what happened in 2008, when India banned rice exports to manage the spike in the price of wheat.
Figure 24 Wheat global stock and international price
Source: USDA PSD for stock-to-use ratios and World Bank GEM for international prices.

60
Figure 25 Maize global stock and international price
Source: USDA PSD for stock-to-use ratios and World Bank GEM for international prices.
Figure 26 Rice global stock and international price
Source: USDA PSD for stock-to-use ratios and World Bank GEM for international prices.

61
Following the methodology proposed by Bobenrieth et al. (2012), it is possible to analyse the relation price-stock
at the aggregate level of the three major grains (wheat, maize and rice). An aggregate stock-to-use ratio (in grain
calories) can be estimated by using data on calorie content provided by USDA National Nutrient Database: 333.8
kcal per 100 g of wheat, 365.0 kcal per 100 g of maize and 362.2 kcal per 100 g of rice. Similarly, an aggregate
price for grain calories can be estimated as average of wheat, maize and rice prices, weighted by their annual
production level by calorie content. Aggregate stock-to-use ratio and price for grain calories are represented on
Figure 27 below.
Figure 27 Grain calories global stock and international price
Source: USDA PSD for stock-to-use ratios and World Bank GEM for international prices.
The link between global stocks and international prices is so strong that it led FAO’s Agricultural market
Information System (AMIS)1 to commission a study to investigate if it was possible to build an early warning
indicator based on the level of global stocks (Bobenrieth et al., 2012).
The practical implication is that a policy that would succeed in holding stocks above a minimum level would
theoretically be sufficient to avoid price hikes on international markets, even if the situation is in fact more
complex as the localisation of stocks may matter, as well as their nature (private stocks vs. FR) and the way they
are used. This raises the question of what can be done to increase the level of stocks.
6.2 The decisive role of food reserves in importing countries
The previous section shows the decisive role of stocks for the stability of international grain markets. However, we
have two good reasons to think that, spontaneously, private storage is not sufficient to reach the level of stocks
that would be optimum from the point of view of the stability of international grain markets and global food and
nutrition security. First, storage generates positive externalities: it benefits not only those who hold the stock but
all market players because it contributes to stabilise prices, thereby benefiting both sellers and buyers. As traders’
storage behaviour is only driven by their own profit, the level of private stocks is likely to be lower than what would
be optimum from a collective point of view. For grains, the gap is likely to be wide because grain price spikes
generate huge food and nutrition security problems. There is a second reason why private storage is likely to be
insufficient: storing is a highly risky activity and hedging tools are costly and often inexistent, or unable to offer an
1 International information system on grain stocks and markets, hosted at the FAO.

62
effective protection to developing countries’ farmers and traders (because of the “basis risk” linked to the weak
correlation between local prices and prices on distant futures markets).
Three options are therefore available to increase the level of stocks: subsidising production, subsidising private
storage and developing FR. The first option may be justified for some countries in some situations (see Chapter
4), but it may generate many negative effects such as pollution and structural overproduction leading to export
subsidies (as illustrated for instance by the former EU Common Agricultural Policy). The second option is not
highly convincing: subsidising private storage would be difficult to implement and may generate unfair competition
between market players. Their effects on price stability are rather uncertain and can even be negative (in some
occasions -speculative bubble or panics-, more private storage may even result in exacerbating price increases).
For a detailed analysis of policies based on subsidising private storage, see Annex 1.
Building FR therefore appears to be the best option for maintaining global stocks at a satisfying level from the
point of view of global food and nutrition security. Which countries can develop these FR? As shown in Chapters
3 and 4, exporting countries do not need FR (except for trying to regulate international prices, which is only
feasible for very big exporters, see Chapter 4). FR are useful in importing countries (mainly to manage import
timelines) and in countries that have weak connections with international markets because the staple they
produce and consume are non-tradable. In the case of the latter, FR are likely to have a weak effect on
international prices. Therefore, from the point of view of stability of international prices, what matters is importing
countries’ FR. Remembering that in 2008, 50% of the price crisis on the rice market was due to panic imports (the
remaining 50% were stemming from exports bans, see Headey, 2011).
The stability of international grain markets therefore strongly depends on the FR held by importing countries (we
refer here not only to structural importers but also to the countries that become importers when they face a bad
harvest or that would become importers if they were not holding FR). Note that the FR held in a given country
generate a positive externality: they benefit international market stability and thereby global food and nutrition
security. Therefore, in the absence of specific incentives, national FR are likely to be under the level that
would be optimum from the point of view of global food and nutrition security. There is therefore a need for
specific incentives. These incentives can take the form of financial support provided by donors to FR (in particular
in big importing countries).
Recommendation Box 5
Because grain stocks contribute to the stability of international grain markets, there is a rationale for donors
in supporting FR (in particular in big importing countries). Note that here the category ‘importing countries’
covers not only structurally importing countries but also countries that import occasionally when facing a bad
harvest.
However, this is likely to be insufficient. There is therefore a need for some kind of international governance of
FR. Unfortunately, as we will see in Chapter 7, the current international framework is not adequate: WTO rules
are providing wrong incentives, whereas there is a lack of transparency on stocks and a lack of coordination
between national storage policies.

63
THE NEED TO RESHAPE THE INTERNATIONAL GOVERNANCE OF
FOOD RESERVES
As seen in Chapter 6, FR developed in a given country are likely to generate beneficial effects for global food and
nutrition security by reducing the frequency and magnitude of price spikes on international markets. As the
building of national FR is mainly driven by national policy objectives, national FR are likely to be undersized
compared to what would be optimum from a global perspective. Moreover, some countries may be tempted to let
the other countries share the burden of storage (free riding). Note also that poorly managed FR may generate
negative effects such as depressed international prices. These are the reasons why some form of international
governance of FR is necessary.
The current international governance of FR is mainly based on WTO disciplines, on a few mechanisms created
after the 2008 crisis and hosted at the FAO (in particular the Agricultural Market Information System or AMIS) and
on regional reserves.
However, this international governance is neither adequate nor sufficient. Current WTO rules are not providing the
right incentives: they allow trade policies that may have a very destabilising effect on international prices (such as
export restriction measures), whereas they put strong restrictions on FR (that are likely to have a stabilising
effect). AMIS and regional reserves can be useful in some circumstances (and may deserve some support) but
are not enough: there is a need to build international agreements to coordinate the building and the use of
national FR.
We will consider successively the need to modify WTO disciplines (section 7.1), the need to improve the
information on stocks (section 7.2), the usefulness of regional FR (section 7.3) and the need for international
agreements to coordinate the building and the use of national FR (section 7.4).
7.1 The need to modify WTO disciplines
7.1.1 Issues related to WTO disciplines
In chapter 6, we saw that the 2008 crisis has been exacerbated by export bans and other export restriction
measures. These measures resulted in a poor efficiency in the use of global stocks. However, export restriction
measures are currently fully allowed by the WTO. After the 2008 crisis, the idea logically emerged to modify WTO
rules in order to forbid export bans.
At the same time, the 2008 crisis highlighted the lack of stocks, particularly in big importing countries (see chapter
6). Remember that, according to Headey (2011), 50% of the price crisis that occurred in 2008 on the international
rice market was due to export bans whereas 50% was due to panic imports. Therefore, it is worth analysing the
potential contribution of increased storage policies in importing countries in avoiding panic imports and increasing
the stability of international markets. As WTO disciplines on public stockholding programmes are very
constraining for the building of FR, the idea logically emerged to relax them.
Therefore, it seems that two approaches could be followed to improve the contribution of WTO rules to more
stable international food markets. The stability of food supply could be increased by forbidding or restricting the
use of export restriction measures. And the stability of food demand could be improved by modifying WTO
disciplines on FR. These two approaches are presented in sections 7.1.2 and 7.1.3.
7.1.2 Develop disciplines on export bans?
The proposal to develop disciplines on export bans has been made by 10 international organisations in a report
that played the role as input for the G202 negotiation on managing the volatility of agricultural price (FAO et al.,
2011). However, from the initial proposal to forbid export bans, the G20 action plan only kept the proposal to
forbid export bans on exports for WFP food aid (G20, 2011). Finally, even this ‘light’ proposal (discussed during
the 2011 Ministerial Conference) was not endorsed by the WTO.
2 The Group of Twenty (G20) is an international forum for the governments from 19 of the world's largest
economies and the European Union.

64
Apart from these feasibility issues, the effect of such WTO disciplines on global food and nutrition security is
rather uncertain: it would contribute to reduce the instability of international prices but it would impede exporting
countries from protecting themselves from the instability of international markets. For instance, the export ban on
non-basmati rice implemented in India during the 2008 crisis allowed to maintain the stability of the Indian
domestic price of wheat, in spite of the sharp increase in the international wheat price. This is not negligible as
25% of undernourished people in the World are living in India (Daviron and Douillet, 2013, p. 36). But this
contributed to severely destabilising the international rice market. What was the net effect on global food and
nutrition security? According to Anderson, Ivanic and Martin (2012), the balance between the benefits and the
costs generated by the export restriction policies implemented in 2008 is slightly negative, meaning that WTO
rules forbidding export restrictions (if enforced) would have only slightly improved global food and nutrition
security.
7.1.3 Modify WTO disciplines on food reserves?
The proposal to modify WTO rules on “public stockholding programmes for food security purposes” (as FR are
called in WTO terminology) has been under negotiation at the WTO since the Bali Ministerial Conference
(December 2013).
To understand the stakes of these negotiations, the first step is to consider what is wrong with current WTO rules.
These rules consider that, when a FR agency is procuring food at administered prices, a price support is provided
to farmers. This support should be accounted for in the estimation of the domestic support provided by the
country to its agriculture (which is bounded). In fact, these rules rest on a wrong assumption: many FR agencies
procure food at administered prices for practical reasons (not to provide a subsidy to farmers): purchasing at the
current market price would imply using many different procurement prices (depending on the locality) and
updating them very frequently (every week or at least every month), which would considerably complicate the
governance of purchases. In fact, purchasing at the market price is only manageable when the quantity procured
is rather small. But using administered prices does not imply providing subsidies to farmers: for instance, in India,
rice and wheat are most of the time procured at an administered price that is below international prices (see
Figure 28 below).
Figure 28 FR procurement price compared to world price (average 2000-2015)
Source: ICTSD (2016).

65
But the main problem is related to the way the subsidy provided through FR procurement at administered prices is
calculated. The price support is calculated by using as a reference not the current international price but the
international price during a past ‘reference period’ (1986-88 for most countries, a period where grain prices were
at 40% of their current level). Moreover, this price support is applied to the entire national production, even to the
share self-consumed by farmers and to the share sold on the domestic market. The resulting biases in the
estimation of the subsidy provided by FR are illustrated in Box 14 below. For grains, the support calculated
according to WTO rules usually accounts for several times the support actually provided. The practical implication
of WTO rules is therefore restricting drastically the right of countries to build FR.
Box 14 Illustration of biases in the WTO rules that specify how the subsidy provided by food reserves (or
other types of public stocks) should be calculated
The following numerical example illustrates these biases. We consider the case of a country where the FR
agency purchases at 125 whereas the international current price is 100. From the quantity produced (equal to
100), 50 is self-consumed by farmers, 10 is sold to the FR agency and 40 is sold on the domestic market. Let us
assume that FR procurement, by reducing the quantity available on the domestic market, results in increasing
the domestic price from 100 to 110. The real subsidy provided is equal to 650: 250 provided to the farmers who
supply the FR ([125 -100] x 10) plus 400 provided to the farmers who sell their production on the domestic
market ([110 – 100] x 40). However, the subsidy calculated according to WTO rules is much higher because the
price support is calculated by using a fixed external reference price (FERP) – that is, a reference price used by
the WTO to calculate the price support provided through FR procurement – equal to the international price
during a past reference period (when it was equal to 40) instead of using the current international price (equal to
100). Moreover, this price support is applied to all national production, implicitly ignoring the share self-
consumed by farmers and assuming that the share sold on the domestic market benefit from the FR
procurement price. The resulting estimated subsidy is therefore equal to 8500 ([125 – 40] X 100), more than 13
times the real amount of subsidy provided.
Figure 29 Numerical illustration of the biases in WTO rules that specify how the subsidy provided by food
reserves should be calculated
Source: Galtier (2017).
Three approaches are possible to give a country more flexibility in building FR. The first is correcting the biases in
the rules that specify how the subsidy provided by FR should be calculated. The second is increasing the
maximum allowed level of domestic support (at least for some categories of countries and products). The third is
allowing countries to go above their maximum allowed level in specific circumstances (safeguard clauses).
These three approaches have been part of the international debates and negotiations since the first proposal
made in November 2012 by a group of 33 WTO Member Countries led by India (the G33) to reshape WTO rules
in order to allow developing countries using more FR to enhance their food and nutrition security. The Bali
conference (December 2013) failed to produce an agreement on this issue: Members simply agreed on a peace

66
clause exempting the already existing public stockholding programmes from legal challenges until a “permanent
solution” is found (WTO, 2013; Diaz-Bonilla, 2014). The need to find a permanent solution to the issue of public
stockholding for food and nutrition security purposes was reaffirmed in December 2015 during the Nairobi
Ministerial Conference (WTO, 2015). The topic was debated again during the Buenos Aires Ministerial
Conference in December 2017, in a context marked by the US-China grains dispute (WTO, 2016; Yu, 2017). But
no agreement has been reached yet.
7.2 Improve the information on stocks
After the 2008 crisis, the idea emerged that more transparency on stocks may be helpful in avoiding panics. In
2011, the G20 negotiations on managing agricultural price volatility proposed creating a global agricultural market
information system (G20, 2011). This system (named AMIS for agricultural market information system) has been
created and is hosted at the FAO. Its task is very challenging, as in many countries reliable data on private stocks
do not exist and in some cases governments are reluctant to provide information on FR. EU delegations may help
governments to monitor private stocks in their country and advocate for more transparency on FR. Countries and
international or regional organisations can also provide some financial or technical support to AMIS.
7.3 Support the development of regional reserves
Theoretically, building international reserves (managed by the international community) may be a way to provide
a cost-effective governance of FR. However, although supported by some NGOs, this idea does not currently
benefit from a political support at the global level. After the 2008 crisis, two reports have been commissioned to
study its relevance and both are quite sceptical with the idea, although they acknowledge the decisive role of
global stocks for international markets stability (Wright, 2009; OECD, 2011). The main reasons for scepticism are
related to governance issues and the controversial experience of International Commodity Agreements (ICAs)
which tried to stabilise the price of coffee, cocoa, sugar and natural rubber during few decades in the second half
of the 20th century (although this experience is not entirely relevant as the objective of these agreements was to
support the producer price not to avoid price spikes, see Gilbert, 1996).
The same rationale may however be applied on a regional scale where governance issues are likely to be better
managed than at the international level. Regional FR are mutualised reserves built collectively by a group of
countries from the same region. Their goals are: i) to be a grain custodian, usable by Member countries if hit by
natural disasters or food crises; and ii) to promote regional solidarity, with the cost of the grains provided to a
country covered by the other countries.
Three regional grain reserves are currently functioning. Two of them are based in Asia: the SAARC Food Bank
(SFB) and the ASEAN Plus Three Rice Reserve (APTERR). The target stock levels are 787,000 tons of rice for
APTERR and 486,000 tons for SFB (comprising 60% rice and 40% wheat). Note that together these two reserves
only account for about 3% of the annual international rice trade, 1% of world rice stocks and 0.25% of annual
world rice consumption. They have never, however, been used as a grain custodian in the case of an emergency.
The reason for this seems to be that they are not really competitive compared to international markets:
commercial imports can often be arranged more quickly and at a similar or even lower cost (preferential prices
have been discussed for the two reserves but are still not agreed upon). The only aspect that seems to be
successful is the one based on regional solidarity (Tier 3 of APTERR). But the quantities involved are very small:
for instance, in 2016, 240 tons of rice were distributed in the Philippines and 210 tons in Cambodia, while in 2017,
267 were distributed in Myanmar.
The third regional reserve (ECOWAS Regional Food Security Reserve) seems to be more apposite. It is focused
on grains that are crucial for food and nutrition security, scarcely traded on international markets (millet, sorghum
and specific varieties of maize) and whose local production is highly unstable, which renders a grain custodian
extremely useful. It also benefits from a favourable context as grains can be easily stored in the Sahel region:
millet and sorghum can be kept for two or three years without any quality deterioration. Finally, it is mainly based
on regional solidarity: when a Member Country is hit by a crisis, it can receive for free a specific quantity of grains
from the reserve. When surplus grains are available, Member Countries or NGO can also buy grains from the
reserve.
The ECOWAS Regional Reserve is already operational. Its establishment has been delayed, but now the
infrastructure is almost completely in place (FR agency, rules and procedures, contracts with national FR for

67
storage services, etc.). About 25,000 tons have been purchased and about 5,000 tons will be purchased in the
coming months. 1,820 tons were provided to Nigeria and distributed in the North-East of the country during the
2016-2017 famine. Additional benefits have been an improvement in information systems on food crises (based
on the Cadre Harmonisé Bonifié, a local version of international Integrated Phase Classification) and the provision
of technical support to national and local FR. However, the Reserve is still facing many challenges. Up to now, all
procurement has been covered thanks to EU funding. This will allow the physical reserve to reach 30,000 tons in
few months, which is still a long way from its target level of 140,000 tons. The financial reserve is still zero,
whereas its target level is equivalent to 260,000 tons of grain. To date, no financial contribution from ECOWAS
has been provided and no sustainable source of funding has been created (a 0.5% “zero-hunger tax” on
ECOWAS non-food imports has been discussed but never implemented).
7.4 Develop international agreements to coordinate the building and/or the
use of national food reserves
Since the 2008 crisis, different proposals have been formulated in this area. In October 2008, Justin Lin (who was
at that time vice-president and chief economist of the World Bank) proposed that “under the auspices of the
United Nations, each country will hold a certain amount of public grain reserve […] not too large as a percentage
of its domestic grain demand annually” and that “there should be a mechanism for releasing individual countries’
public reserves onto the global market when a shock in supply and/or demand causes the global grain price to
increase more than a certain limit.”
In 2009, Wright made the proposal to provide governments with a pre-emption right (in case of sharp increase in
food prices) on grains or oilseeds contracted by biofuels producers.
In 2011, in a policy brief disseminated during the G20 negotiation process on managing agricultural price volatility,
Galtier built on Lin’s proposal and on the Kyoto protocol to propose an international mechanism aiming to
guarantee a minimum level of stocks at the global level, while sharing the burden of storage in a fair way. The
basic idea is “to establish a minimum stock target by country and let countries choose the policy they consider
most appropriate to reach it” (similar to the Kyoto protocol for greenhouse gas emissions). Some countries may
choose to increase public storage while other may prefer support private storage (or a mix of both). The
mechanism is the following:
Global minimum stocks (in terms of months of consumption) would need to be established for each grain
(wheat, corn and rice) by an expert committee on the basis of past movements in the markets for these
products. Country stock goals would then be set by sharing the effort between countries in a
redistributive manner: the effort requested would increase with the country's income (it could be imagined
that DCs would not be asked to make an effort whereas emerging countries would be asked to make a
moderate effort and developed countries a greater effort). This system would also have the advantage of
obliging countries to be more transparent about their stocks. The governance of this mechanism (control
system and sanctions) remains to be specified. (Galtier, 2011)
7.5 Concluding remarks on the international governance of food reserves
The proposals presented in this chapter aim to establish an international framework for the governance of FR.
This framework could be very useful:
• To optimise the use of existing stocks (especially in periods of crisis) by improving the transparency on
food stocks, developing WTO disciplines on export restrictions and building an international agreement for
the coordinated use of FR in periods of crisis;
• To maintain a minimum level of stocks at the global level by rendering less restrictive WTO rules on FR
and building an international agreement by which countries commit themselves to hold a minimum level of
grain stock.
These proposals have been debated and, for some of them, negotiated at a high-level but, up to now, the only
one that has been adopted is the creation of an international agricultural market information system (AMIS) to
improve the information on stocks. A Rapid Response Forum has been created jointly with AMIS to coordinate
countries’ response to international food crises but, up to now, it has never met.
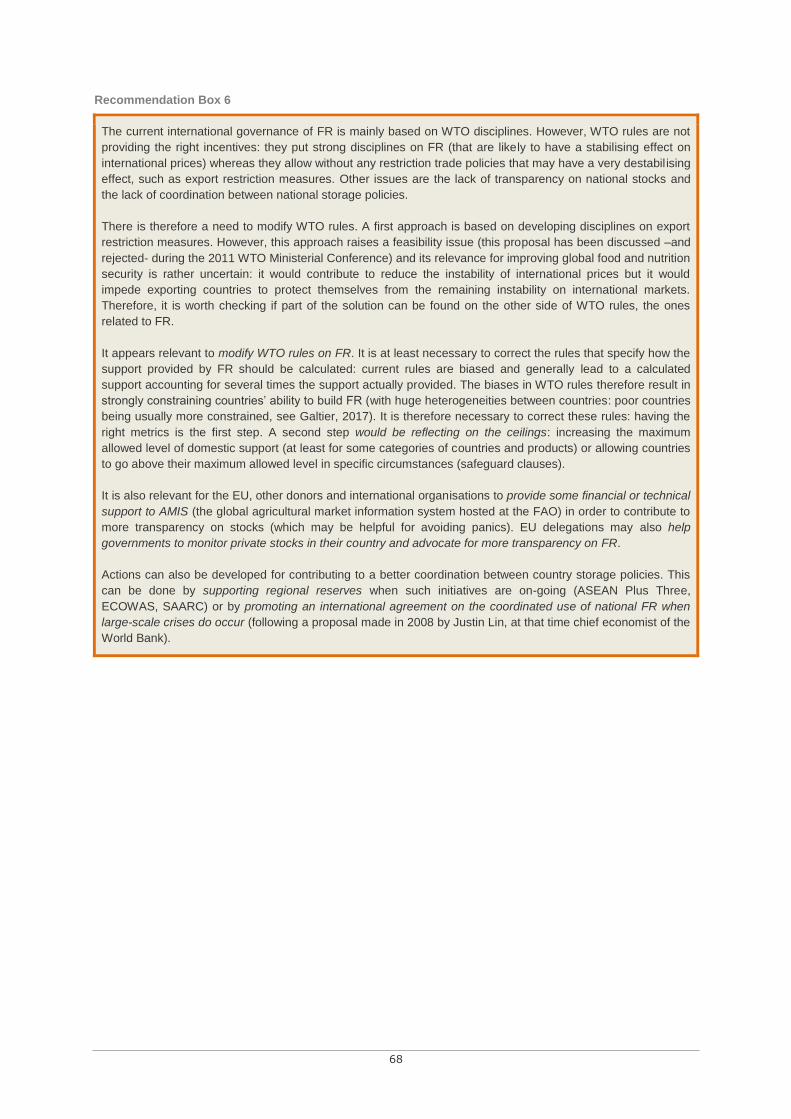
68
Recommendation Box 6
The current international governance of FR is mainly based on WTO disciplines. However, WTO rules are not
providing the right incentives: they put strong disciplines on FR (that are likely to have a stabilising effect on
international prices) whereas they allow without any restriction trade policies that may have a very destabil ising
effect, such as export restriction measures. Other issues are the lack of transparency on national stocks and
the lack of coordination between national storage policies.
There is therefore a need to modify WTO rules. A first approach is based on developing disciplines on export
restriction measures. However, this approach raises a feasibility issue (this proposal has been discussed –and
rejected- during the 2011 WTO Ministerial Conference) and its relevance for improving global food and nutrition
security is rather uncertain: it would contribute to reduce the instability of international prices but it would
impede exporting countries to protect themselves from the remaining instability on international markets.
Therefore, it is worth checking if part of the solution can be found on the other side of WTO rules, the ones
related to FR.
It appears relevant to modify WTO rules on FR. It is at least necessary to correct the rules that specify how the
support provided by FR should be calculated: current rules are biased and generally lead to a calculated
support accounting for several times the support actually provided. The biases in WTO rules therefore result in
strongly constraining countries’ ability to build FR (with huge heterogeneities between countries: poor countries
being usually more constrained, see Galtier, 2017). It is therefore necessary to correct these rules: having the
right metrics is the first step. A second step would be reflecting on the ceilings: increasing the maximum
allowed level of domestic support (at least for some categories of countries and products) or allowing countries
to go above their maximum allowed level in specific circumstances (safeguard clauses).
It is also relevant for the EU, other donors and international organisations to provide some financial or technical
support to AMIS (the global agricultural market information system hosted at the FAO) in order to contribute to
more transparency on stocks (which may be helpful for avoiding panics). EU delegations may also help
governments to monitor private stocks in their country and advocate for more transparency on FR.
Actions can also be developed for contributing to a better coordination between country storage policies. This
can be done by supporting regional reserves when such initiatives are on-going (ASEAN Plus Three,
ECOWAS, SAARC) or by promoting an international agreement on the coordinated use of national FR when
large-scale crises do occur (following a proposal made in 2008 by Justin Lin, at that time chief economist of the
World Bank).

69
CONCLUSION: THE DECISIVE ROLE OF GOVERNANCE
As seen in this report, governments can use FR to activate three different pathways in order to improve national
food and nutrition security. FR can be used:
• To fight against chronic food and nutrition insecurity by providing poor households with permanent food
transfers (Chapter 2);
• To manage food crises either by providing emergency transfers to food insecure households or by
mitigating food price increases (Chapter 3);
• To provide incentives to food producers, thereby contributing to long-run food and nutrition security
(Chapter 4).
The relevance of using FR for these different purposes is highly context-dependent. Chapters 2, 3 and 4 provide
detailed explanations on what to consider in determining whether or not to rely on FR. Ultimately, the right ways to
use FR to reach these different purposes strongly depend on context. For instance, when a crisis occurs, deciding
whether FR should be used to provide emergency transfers, to mitigate food price increases or for both purposes
depends on the characteristic of the country and of the crisis. Chapter 3 provides information and details what
variables should be considered to make such a decision. Similarly, Chapter 4 provides information on the
relevance of targeting or not the incentives provided to food producers.
These three impact pathways are not automatic: they can only be achieved through well-designed and well-
governed food reserves. The rules for a good governance of food reserves are presented in detail in Chapter 5.
The main ones are summarised below:
• The objectives of a food reserve should be relevant, realistic and clearly specified. For instance, if a food
reserve aims to act on food prices, its objective should be limited to prevent price surges or collapses but
domestic food prices should still follow the mid-term trend of international prices (permanently high prices
are highly damaging for food security whereas permanently low prices discourage production).
• The composition, size and location for the food reserve should be chosen carefully in order to meet the
specific objectives of the food reserve and the specificities of the context.
• The physical management of the stock (treatments, rotation, etc.) should avoid losses, quality
deterioration and diversions.
• Food reserve interventions should be rules-based and predictable. Discretionary and unpredictable
interventions would crowd out private storage and private trade: traders would store less because they
would fear public interventions might curb prices down. On the contrary, interventions triggered by clearly
defined and publicly known rules do not disturb the market. This also implies that information on the
triggering indicators should be available to all market players.
• The procedures used by the food reserve agency for purchases, sales and distribution should guarantee
fairness among market players or potential recipients. For instance, when the food reserve agency
purchases or sells on the domestic market, tenders can be organised to guarantee a fair competition
between market players, which does not preclude defining specific conditions for specific categories of
market players (such as farmer organisations), providing that these conditions are the same for all market
players within a category.
• The food reserve agency should have the means to react quickly when it appears that an intervention is
useful or necessary (in terms of staff, infrastructures, equipment and budget).
• Data on food reserve interventions, their cost and their effects should be regularly produced and
disseminated in order to guarantee the transparency on interventions and to allow for regular improvement
in the management of interventions.
An important dimension of the governance of FR is to guarantee their good articulation with private storage. FR
should not discourage private storage, as may occur when poorly managed FR implement unpredictable and
untimely interventions. Conversely, private storage cannot substitute for FR, even when subsidized (see Annex 1
for details). A good governance of FR is likely to boost synergies between private and public storage (Chapter 5).

70
Chapters 2, 3, 4 and 5 are related to how national governments can purposely activate the three above-presented
impact pathways to improve national food and nutrition security. But the use of food reserves in a given country is
likely to benefit other countries as well (especially importing countries) through a stabilising effect on regional or
international markets. By avoiding or smoothing price surges on these markets, food reserves can contribute to
improving food and nutrition security at the global level (Chapter 6).
This fourth impact pathway is not automatic. It can be strengthened thanks to external support to FR, or through
the establishment or supranational reserves (such as ECOWAS or ASEAN+3 regional reserves). Establishing an
international institutional environment for food reserves could also be very useful in two respects (Chapter 7):
• To optimise the use of existing stocks (especially in periods of crisis). Three main lines of action have
been proposed: the creation of an international agricultural market information system (AMIS) to improve
the transparency on stocks (this AMIS has actually been created and is hosted at FAO); developing WTO
disciplines on export restrictions (such disciplines have been debated, and rejected, in 2011); and building
an international agreement for the coordinated use of food reserves in periods of crisis (such an
agreement was proposed in 2008 by Justin Lin, then chief economist of the World Bank, but has never
been developed).
• To maintain a minimum level of stocks at the global level. Two main lines of action have been proposed:
the modification of WTO rules on food reserves to make them less restrictive (negotiations on this topic
have been on-going since 2013); and building an international agreement by which countries commit
themselves to hold a minimum level of grain stock (an agreement of this kind, to share the burden of
storage between countries – inspired by the Kyoto protocol – was proposed in 2011, but has never been
developed).

71
ANNEXES

72
Annex 1 Can subsidising private storage be an alternative to food reserves?
We have seen that, in many situations, storage policies are necessary to mitigate staple price increases (Chapter
3) or collapses (Chapter 4). This is particularly the case for non-tradable staples because in this case it is not
possible to use external trade to compensate for deficits or absorb surpluses. This is the reason why storage
policies also appear to be necessary to regulate global staple availability and thereby contribute to the stability of
international markets (Chapter 5).
But which storage policies? Policies based on FR? Policies based on subsidising private storage have been
recently presented as an alternative to FR. This idea is clearly stemming from academic works based on
‘competitive storage models’ (see Box 15 below). However, the proposal to subsidise private storage is now
circulating between policy-makers, especially through international organisations (see for instance OECD 2015a).
Rationale for subsidising private storage. We have two good reasons to think that private storage is usually
not sufficient compared to what would be optimum from a collective point of view. First, storage activity generates
positive externalities because it benefits not only to the one who holds the stock but to all market players: by
removing quantities from the market when prices are low and releasing quantities on the market when prices are
high, they contribute to stabilising prices benefiting both sellers and buyers. As traders’ storage behaviour is only
driven by their own profit, the level of private stocks is likely to be lower than the level that would be optimum from
a collective point of view. The gap is likely to be wide for staples as staple price spikes generate huge food and
nutrition security problems. There is a second reason why private storage is likely to be insufficient: storing is a
highly risky activity and hedging tools are either inexistent, or costly and not able to offer an effective protection to
developing countries’ farmers and traders.
The classical answer to this problem is building FR to compensate for the lack of private stocks. However, FR are
suspected to crowd out private storage as, when the government holds FR, traders may fear a public intervention
on the market that pushes prices down and thereby may make them lose a lot of money. If building FR results in
decreasing private stocks, it is not a very effective way to increase the total amount of stocks. Moreover, it is said
that the costs of FR agencies are higher than the costs of private storers. The rationale for subsidising private
storage is therefore partly based on criticisms addressed to FR (that are supposed to crowd out private storage
and have a higher cost). However, as we will see now, these criticisms are not well established from an empirical
point of view, and the efficiency of subsidising private storage for stabilising prices is rather uncertain.
Do FR crowd out private storage? Private storage drivers are not well-known (lack of reliable theory, lack of
survey data on storage behaviours) and the lack of reliable data on private stocks results in the impossibility to
estimate empirically the crowding out effect of FR on private stocks (if any), except in the very rare occasions
where such data are available. In the case of the Philippines (the only developing country where such reliable
data on private stocks do exist, see Abbott, 2013), the dynamics of private stocks and FR for rice and maize do
not exhibit a clear crowding out effect (see Figures 30 and 31 below).
It is rather probable that a crowding out effect exists in many countries but its magnitude can strongly be reduced
if the interventions of the FR are predictable, i.e. triggered by a ceiling price which is well-defined, not too low and
publicly known in advance (Jayne, 2012; Poulton et al., 2006 and Chapter 5).
Is public storage costlier than private storage? The idea that the cost of public storage is much higher than
the cost of private storage is mainly based on the (often cited) Indian case where the annual cost of public storage
has been estimated around US$ 87 per ton whereas the cost of private storage is between US$ 16 and 20 per ton
(Gouel et al. 2014). However, the case of India appears to be rather exceptional. Many FR are well-managed and
are likely to have storage costs in line with the costs of private stocks (see AFD 2014, Rashid and Lemma 2011,
World Bank and FAO 2012 and Figure 3 in Chapter 1).
Is it possible to subsidise private storage without generating huge distortions? Policies based on
subsidising private storage are facing huge implementation issues. The main difficulty is in determining what
exactly should be subsidised. Interest rate? But if a government implements credit programmes targeted to grain
marketing, it would be difficult to control that the credit is actually used to store grains (we had a lot of bad
experiences in this area, for instance in Sahel countries). Moreover, simulations made with competitive storage
models suggest that subsidising the interest rate would be ineffective in stabilising prices (it may even increase
price instability, see Box 15 below). Storage facilities? It is surely possible when the State owns (unused) storage

73
facilities. But it is not always possible and is likely to generate unfair competition. Hedging tools? They are almost
not used for grain in developing countries. Phytosanitary products? But they always account for a very small
share of the storage cost. Warehouse receipt systems (WRS)? But, for now, WRS have not succeeded in
attracting a significant share of the grain traded, in spite of the external support they received in many developing
countries (for instance in Eastern and southern African countries). Therefore, it seems extremely difficult to
transfer subsidies to grain storers, and even more to guarantee that the money received will result in increasing
the quantities stored. In addition to this, these kind of subsidies are likely to reach only some market players (big
traders, big farmer organisations), thereby generating distortions within the domestic market.
The uncertain effect on staple price stability of subsidising private storage. Even if it was possible to
overcome the implementation issues, the effect of subsidising private storage on mitigating staple price increases
is uncertain. We have little empirical evidence and what exists is not entirely relevant. The main attempts in that
direction have been through interest rate subsidies (for instance in the USA and Brazil, more recently in Vietnam)
and public support to warehouse receipt systems (WRS). In all cases, the policy was more focused on farmers,
the objective being the reduction of the seasonal collapse in prices that usually occurs in the post-harvest period.
In all cases, the results of these policies were not clear. In fact, the main arguments in favour of subsidising
private storage stem from the results of competitive storage models. However, as these models rest on several
heroic assumptions on private storers’ behaviours, their results are likely to be misleading (see Box 15).
In addition, the situations where private storage dysfunctions (stock hoarding, bubbles and panics) should be
taken into account: in these situations, private storage contributes to exacerbating price increases. An implicit
assumption behind the rationale for subsidising private storage is that the total level of stocks (private stocks plus
FR) is what matters. Therefore, private stocks and FR are assumed to be equivalent. This idea is misleading:
although in normal times both types of stocks follow a similar dynamic (purchases are made when prices are low
and releases are triggered when prices increase, thereby contributing to stabilising prices), specific situations
occur where private stocks follow a different dynamic. These situations are generally provoked by the shared
belief that prices will continue increasing. In this case, farmers and traders are likely to hoard their stocks (in spite
of the fact that immediate sales would be highly profitable) and their hoarding behaviours exacerbate the price
increase (which seems to confirm the initial belief that prices will continue to increase). Similarly, consumers are
likely to panic and therefore increase their staple purchases, thereby contributing to exacerbating the price
increase. Even if the initial belief that prices should continue increasing was ill-founded (not grounded in the
reality of supply and demand dynamics), it is sufficient to trigger a self-sustained dynamic of price increases. In
these situations, private stocks and FR are not equivalent at all: while private storers exacerbate the increase in
food prices, the FR agency can contribute to push them down by selling part of its stocks. If the quantity released
from the FR is sufficient, this may exert a leverage effect on the availability of private stocks by ending stock
hoarding (see Box 4 in Chapter 3 for the Bangladeshi experience in 2008).
To conclude, subsidising private storage seems to be an attractive alternative to FR because it seems it would
allow avoiding some of their drawbacks (crowding out effects on private storage, higher storage cost). However,
this option would have to face huge implementation issues and is likely to generate unfair competition between
market players. Moreover, its effects on price stability are highly uncertain (in some occasions—such as,
speculative bubble, panics—more private storage may even result in exacerbating price increases).
Box 15 Which lessons can be drawn from competitive storage models?
Proponents of competitive storage models are enthusiastic about the idea of subsidising private storage and in
fact, these models are the only tangible element in favour of this kind of policies. These models have been
created by Bruce Gardner (1979) and then developed by Williams and Wrights (1991). They aim to simulate
the dynamics of the price of a storable commodity. They succeeded in mimicking some of the characteristics of
real price series (Cafiero et al., 2011). The standard version of the model shows that markets spontaneously
generate the optimum level of price instability. More elaborated versions relaxed some of their (very unrealistic)
assumptions and found that the instability of prices is excessive, thereby showing that stabilisation policies may
contribute to improve the collective welfare. Competitive storage models have been used to simulate and
compare the cost-effectiveness of different stabilisation tools: trade policies, FR and subsidising private
storage. The new version of the model developed by Christophe Gouel (2011) is able to calculate the optimum
design for each stabilisation tools (the amount of import subsidy that should be provided, the level of the FR
floor price and ceiling price and the amount of the subsidy that should be provided to private storage). Then the
optimum versions of each stabilisation tools can be compared (or even optimum mixes of these tools).

74
However, in spite of their fascinating attributes, competitive storage models suffer from certain limitations,
mainly because they rest on very unrealistic assumptions. As these assumptions lead to eliminate the major
part of the problems generated by food price instability, these models strongly underestimate the costs of price
instability, and therefore the benefits of stabilising prices (Galtier, 2013b). More problematic for our current
discussion is the fact that these unrealistic assumptions affect the results on the comparative cost-
effectiveness of the tools.
For instance, competitive storage models usually find that the optimum price band for a FR is a price peg
where the floor price is equal to the ceiling price. This result is contrary to a common sense idea that allowing
the price to move within a band is much better than a total stabilisation because it let the market functions (and
produce signals on scarcity) since the price remains within the floor and the ceiling. But competitive storage
models find that a total stabilisation is better. The reason for that is rather technical: the method used to
estimate the effect of price instability on consumers’ welfare (Turnovsky’s measure) is based on the idea that
what is problematic is price instability, not extreme price values. Therefore, reducing small oscillations around
the mean price value is perceived as welfare improving. And when the (latest version of) the model compares
FR with other stabilisation tools (such as subsidising private storage), what it analyses in fact is a FR trying to
provide a total stabilisation of prices.
The problem becomes tricky when one considers the cost-effectiveness of subsidising private storage. As a
matter of fact, the core of competitive storage models is the standard assumptions regarding private storers.
They are assumed i) to be risk-neutral ii) to have a perfect knowledge of the level of all private stocks (heroic
assumption, even the States don’t know – see Abbott, 2013) and iii) to be able to compute all these data in
order to calculate the long run market equilibrium (which requires a top level in computer programming: less
than 10 persons in the world are able to solve competitive storage models). Last but not least, by construction,
competitive storage models exclude the possibility of panics and bubbles (stock hoarding). Therefore, what can
be expected from private storage (and from subsidising private storage) is strongly overestimated by
competitive storage models.
What is said by proponents of competitive storage on the ‘FR vs. subsidising private stocks debate’ should
therefore be taken very cautiously. Particularly as interactions between private stocks and FR are not well
represented in these models: usually any intervention by the FR is found to crowd out all private storage (it is
therefore not surprising if FR are found to be highly ineffective).
Another point that should be emphasised is that competitive storage models usually analyse private storage
subsidies in the abstract form of a unitary subsidy per bag stored during a given period of time (a decrease in
the variable ‘storage cost’ of the model). The only time competitive storage models tried to estimate the cost-
effectiveness of more realistic modalities of subsidising private storage, they found that it is an inefficient way to
stabilise prices:
The literature on competitive storage and on optimal public policy for price stabilisation has found that
public buffer-stock and related inventory management programmes tend to be inefficient, and that
subsidising private storage is a more promising approach. We find, however, that it makes a difference
whether such a subsidy is directly paid on storage costs or takes the form of subsidised interest rates
for inventory holders (as it has in the United States and other countries). We find that, for purposes of
stabilising market prices, not only is an interest-rate subsidy less efficient, but it can even destabilise
prices. (Gardner and Lopez, 1996, pp. 515-516)

75
Figure 30 September rice stocks in the Philippines (food reserves and private stocks)
Source: FAO Countrystat database.
Figure 31 August maize stocks in the Philippines (food reserves and private stocks)
Source: FAO Countrystat database.

76
Annex 2 On the social costs of targeting – Resisting to targeting in Niger: de-targeting,
‘babies of luck’ and other stories
“Transfers solve problems at the household level and create problems at the village level!”
A Niger village mayor cited in Olivier de Sardan et al. (2014).
According to Jean-Pierre Olivier de Sardan, in Niger, the targeting rules used by NGOs and other organisations
that implement cash transfers are “incomprehensible” for local populations. They often “contradict local norms,
keep their distance with municipal authorities, raise suspicions and exacerbate conflicts” (Olivier de Sardan et al.,
2014, p. 107).
For instance, during the 2005 crisis, “the ‘humanitarian rent’ linked to the famine has been ‘treated’ by farmers as
a form of the usual ‘development rent’ [provided by the numerous development projects that intervene in Niger],
and with the same criteria: everyone should try to ‘get his share’. The charitable criteria or values, which are so
important for NGOs and other actors of external aid, are not relevant for local populations. […] The targeting
criteria used by donors (such as acute child malnutrition) were therefore most of the time perceived as unfair, just
as imposed conditionalities that should be circumnavigated” (Olivier de Sardan et al., 2007, p. 21).
A striking example of the gap between targeting rules and local norms is provided by the way households reacted
to the food transfers implemented by the WFP and the CCA [Niger public body in charge of managing food crises]
during the 2005 crisis. As social targeting was too complicated to implement in this situation of emergency, the
choice was made to rely only on a geographical targeting and to distribute food to all households of the selected
villages. The amount distributed was supposed to be based on the size of the family: the presentation of the
family record book was therefore required to receive the transfers. However, the need to present the family record
book generated several problems. In Niger, some taxes depend on the size of the family leading many family
heads to declare only part of their family members. Therefore, some of them received food corresponding to six
persons whereas they have 20 persons in their family. Moreover, the need for the family record book gave rise to
the idea that food transfers were a consequence of having paid the taxes (and therefore a right for all tax-payers).
Therefore, many people living in villages not covered did not understand why they did not receive the transfers in
spite of having paid their taxes (Olivier de Sardan, 2007, pp. 29-30).
In some localities such Tirmini, an additional condition was added to presenting the family record book: the
presence of women was supposed to guarantee that the food would benefit to the family consumption. Therefore,
many men were in trouble because they did not have a wife (they were dead or divorced) or because their wife
was not available (ill or travelling), or simply because they were not aware of this condition and living far from the
delivery place of food transfers. Therefore, women from Tirmini offered them the possibility of a marriage of
convenience, with the agreement of their husband (Olivier de Sardan, 2007, p. 30).
Another striking example is provided by the episode of the “babies of luck” that also occurred during the 2005
crisis. Due to the high level of child malnutrition (malnutrition rates have been the triggered of the mobilisation of
the international community by Médecins Sans Frontières or MSF), many nutrition recovery centres have been
set up. Following MSF, almost all NGOs that provided this kind of aid provided food transfers to the families of
undernourished children. Having children considered as undernourished therefore became an entry ticket to get
grains and other food products (beans, oil, sugar). As the amount of the food transfer was quite high (with MSF,
50 kg of millet, 25 kg of beans and 10 litres of oil when the child leaves the nutritional recovery centre), it was
attractive for rural households. Women who came back in their village with the food from the nutritional recovery
centre were congratulated and having a child classified as undernourished was perceived as a chance and the
considered children were called the “babies of luck”. The criterion of selection (a strap to measure the mid-arm
circumference) was completely incomprehensible for the local populations, all the more that for them being thin is
not perceived to be a disease. As a result, the women who went far to reach a nutritional recovery centre and
came back with nothing did not understand why they “make selections whereas everybody is hungry”. Of course,
many strategies were developed including going to the recovery centre with a child from another family or
provoking diarrhoea in children to make them lose weight (Olivier de Sardan, 2007, pp. 31-33).
In order to avoid destabilising effects on social structures and institutions, the transfers received are often
reallocated, which sometimes results in nullifying the targeting. Transfers are often reallocated within the
household: the most frequent situation is that wives have to give the money received to their husbands and they
did it most of the time. But transfers are also sometimes reallocated within the community: the cash received is

77
bulked and distributed equally to all the households of the village either directly or in the form of food purchased
with the cash gathered. In some occasion, part of the money is used to pay the taxes of the village (Olivier de
Sardan et al., 2014, pp. 120-121).

78
REFERENCES
Abbott P (2010). Stabilization Policies in Developing Countries after the 2007-2008 Crisis. Global Forum on Agriculture Policies
for Agricultural Development, Poverty Reduction and Food Security, 29-30 November, OECD, Paris.
Abbott P (2012). Export Restrictions as Stabilization Responses to Food Crisis. American Journal of Agricultural Economics 94
(2): 428–434.
Abbott P (2013). Improved methodology for estimation of food stocks. AMIS, FAO, Gates Foundation, November, 60 p.
ACF (2012). Meta-Evaluation of ACF Fresh Food Voucher Programmes. Paris.
Action Aid. 2011. No More Food Crises: The Indispensable Role of Food Reserves. June.
ADE (2016). Evaluation of the Use of Different Transfer Modalities in ECHO Humanitarian Aid Actions 2011-2014. Study
commissioned by the Evaluation Sector of the Directorate General Humanitarian Aid and Civil Protection – ECHO
(European Commission)
Adelman S, Gilligan D, and Lehrer K (2008). How Effective are Food for Education Programs? A Critical Assessment of the
Evidence from Developing Countries. Food Policy Review 9, IFPRI, Washington DC.
AFD (2014). Food Reserves and Regulating Market Volatility in Africa. A Savoir n.23.
Ahmed A, Quisumbing A, Nasreen M, Hoddinott J, Bryan E (2010). Comparing Food and Cash Transfers to the Ultra Poor in
Bangladesh. IFPRI.Washington, DC.
Aker J (2013). Cash or Coupons? Testing the impacts of Cash versus Vouchers in the Democratic Republic of Congo. Center
for Global Development, Working Paper 320.Washington DC.
Alderman H (1986). The effect of food price and income changes on the acquisition of food by low income households
(International Food Policy Research Institute, Washington, DC).
Alderman H (2014) Can Transfer Programs Be Made More Nutrition Sensitive? Discussion Paper 1342. IFPRI, Washington,
DC.
Alderman H, Bundy D (2012). School Feeding Programs and Development: Are We Framing the Question Correctly? World
Bank Research Observer 27 (2) : 204–21.
Alderman H, Haque T (2006). Countercyclical Safety Nets for the Poor and Vulnerable. Food Policy 31 (4) (August): 372–383.
AMIS website. Web site of the Agricultural Market Information System hosted at the FAO. (http://www.amis-outlook.org/)
Anderson K (2012). Government trade restrictions and international price volatility, Global Food Security, 1(2), pp. 157–66.
Anderson K, Ivanic M, Martin W (2012). Food Price Spikes, Price Insulation and Poverty. In The Economics of Food Price
Volatility, Jean-Paul Chavas, David Hummels, and Brian Wright , University of Chicago Press.
Angelucci M, De Giorgi G (2009). Indirect Effects of an Aid Program: How do Cash Transfers Affect Ineligibles’ Consumption?
American Economic Review, 99(1), 486–508.
Aranha A V (2013). Fome Zero: a experiência brasileira de combate a fome. Pontes 9(7).
Arezki R, Brückner M (2011). Food Prices and Political Instability. IMF Working Paper 11/62 (March).
Arimond M, Ruel MT (2004). Dietary diversity is associated with child nutritional status: evidence from 11 demographic and
health surveys. The Journal of nutrition, 134(10), 2579-2585.
Asian Development Bank (2008). Soaring Food Prices. Response to the Crisis.
Asian Development Bank (2011). Regional Cooperation for Food Security: The Case of Emergency Rice Reserve in the ASEAN
Plus Three.
Attanasio O, Battistin E, Mesnard A (2012). Food and Cash Transfers: Evidence from Colombia. The Economic Journal 122
(559): 92–124.
Baird S, McIntosh C, Özler B (2011). Cash or condition? Evidence from a cash transfer experiment. The Quarterly Journal of
Economics 126 (4): 1709–53.
Banerjee A (2016). Policies for a better-fed world. Rev World Econ 152: 3–17
Banerjee A, Duflo E (2007). Economic lives of the poor. Journal of Economic Perspectives, 21(1), 141–167.
Banerjee A, Duflo E (2011). Poor economics: A radical rethinking of the way to fight global poverty. New York: Public Affairs.
Barker M, Filmer D, Rigolini J (2014). Evaluating Food versus Cash Assistance in Rural Cambodia. World Bank, Washington,
DC.
Barrett C (1996). On Price Risk and the Inverse Farm Size-productivity Relationship. Journal of Development Economics 51 (2)
(December): 193–215.
Barrett C (2002). Food Security and Food Assistance Programs. In B. Gardner, and G. Rausser, eds., Handbook of Agricultural
Economics. Amsterdam: Elsevier.
Barrett C (2010). Measuring Food Security. Science 327 (5967) : 825–8.
Barrett C, Carter M, Timmer P (2010). A Century-Long Perspective on Agricultural Development. American Journal of
Agricultural Economics. 92(2), 447-468.
Barrett C, Clay D (2003). Self-Targeting Accuracy in the Presence of Imperfect Factor Markets: Evidence from Food for-Work in
Ethiopia, Journal of Development Studies 39(5), pp. 152–180.
Barrett C, Maxwell D (2005). Food aid after fifty years: Recasting its role. New York: Routledge.
Barrett C, Maxwell D (2006). Towards a global food aid compact. Food Policy 31 (2): 105–18.
Basu K (1996). Relief Programs: When It May Be Better to Give Food Instead of Cash. World Development 24 (1): 91–6.
Basu K (2010). The Economics of Foodgrain Management in India. Chief Economic Advisor, Ministry of Finance of India.
Behrman J, Deolalikar A (1988). Health and nutrition. In H. Chenery & T. N. Srinivasan (Eds.), Handbook of development
economics, Chap. 14 (1st ed., Vol. I, pp. 631–711). Amsterdam: Elsevier.
Behrman J, Deolalikar A, Wolfe B (1988). Nutrients: impacts and determinants, The World Bank Economic Review 2(3), 299-
320.
79
Bellemare MF (2011). Rising Food Prices, Food Price Volatility, and Political Unrest. University Library of Munich, Germany,
MPRA Paper 31888 (June).
Bellemare MF, Barrett CB, Just DR (2013). The welfare impacts of commodity price volatility: evidence from rural Ethiopia,
American Journal of Agricultural Economics, 95(4), pp. 877–99.
Bellmann C, Hepburn J, Krivonos E, Morrison J (2013). G-33 proposal: early agreement on elements of the draft Doha accord to
address food security. ICTSD, Geneva, Switzerland.
Berhane G, Gilligan DO, Hoddinott J, Kumar N, Taffesse AS (2014). Can Social Protection Work in Africa? The Impact of
Ethiopia’s Productive Safety Net Programme, Economic Development and Cultural Change, Vol. 63, No. 1, pp. 1-26,
The University of Chicago Press
Bibi S, Cockburn J, et al. (2009). The Impact of the Increase in Food Prices on the Child Poverty and the Policy Response in
Mali. New York, UNICEF.
Blackorby C, Donaldson D (1988). Cash versus kind, self-selection, and efficient transfers. American Economic Review 78:691–
700.
Blein R (2009). Les stocks de proximité : enjeux, opportunités et limites : le cas des pays du Sahel, Note de travail ECART –
CIRAD – IRAM.
Bobenrieth E, Wright B, Zeng D (2012). Stock-to-use ratios as indicators of vulnerability to spikes in global cereal markets.
AMIS, FAO. October.
Bocoum I (2011). Sécurité alimentaire et pauvreté, Analyse économique des déterminants de la consommation des ménages,
application au Mali, Thèse de Doctorat de l'université Montpellier 1 242 p. + Annexes.
Bouis H, Boy-Gallego E, Meenakshi J (2002). Micronutrient Malnutrition: Causes, Prevalence, Consequences, and
Interventions. In: Bruulsema, T.; Heffer, P.; Welch, R.; Cakmak, I.; Moran, K. (Eds). Fertilizing Crops to Improve Human
Health: a Scientific Review. Volume 1. Food and Nutrition Security. IFA, Paris, France (2012) 29-64.
Boussard JM (1996). When Risk Generates Chaos, Journal of Economic Behavior and Organization 29, pp. 433-446.
Bowbrick P (1986). The Causes of Famine: a Refutation of Professor Sen’s Theory. Food Policy. May, 105-124.
Braido L, Olinto P, Perrone H (2012). Gender bias in intrahousehold allocation: Evidence from an unintentional experiment.
Review of Economics and Statistics 94 (2): 552–65.
Braverman A, Kanbur R, Brandao A, Hammer J, de Rezende Lopes M, Tan A (1990). The Costs and Benefits of Agricultural
Price Stabilization in Brazil. Washington: The World Bank.
Brennan D (2003), Price Dynamics in the Bangladesh Rice Market: Implications for Public Intervention, Agricultural Economics,
29: 15-25.
Brennan D, Williams J, Wright B (1997). Convenience Yield without the Convenience: A Spatial-Temporal Interpretation of
Storage Under Backwardation, The Economic Journal, 107, pp. 1009-1022.
Brennan M (1958). The supply of storage. The American Economic Review, 48(1) : 50-72.
Brinkman H, de Pee S, Sanogo I, Subran L, Bloem M (2010). High Food Prices and the Global Financial Crisis Have Reduced
Access to Nutritious Food and Worsened Nutritional Status and Health. Journal of Nutrition. Supplement: The Impact of
Climate Change, the Economic Crisis, and the Increase in Food Prices on Malnutrition. January 2010, 140: 153S‐161S.
Briones R (2011). Regional Cooperation for Food Security: The Case of Emergency Rice Reserves in ASEAN Plus Three.
Philippine Institute for Development Studies, Manila.
Briones R, Parel D (2011). Putting Rice on the Table: Rice Policy, the WTO, and Food Security. Policy Notes 2011-11,
Philippine Institute for Development Studies.
Brown C, Ravallion M, van de Walle D (2016). A Poor Means Test? Econometric Targeting in Africa. World Bank Policy
Research Working Paper 7915. Development Research Group. Human Development and Public Services Team,
December. The World Bank, Washington DC.
Brown L, Gentilini U (2006). On the Edge: The Role of Food-Based Safety Nets in Managing Food Insecurity, UNU/WIDER,
Research Paper No111, Helsinki.
Brown O, Gibson J, Crawford A (2008). Boom or Bust: How Commodity Price Volatility Impedes Poverty Reduction, and what to
do about it? International Institute for Sustainable Development, Winnipeg.
Buccola S, Sukume C (1988). Optimal Grain Pricing and Storage Policy in Controlled Agricultural Economies: Application to
Zimbabwe, World Development, 16(3), pp. 361–371.
Byerlee D, Jayne T, Myers R (2006). Managing Food Price Risks and Instability in a Liberalizing Market Environment: Overview
and Policy Options, Food Policy, 31:275-287.
Byerlee D, Sain G (1986). Food Pricing Policy in Developing Countries: Bias against Agriculture or for Urban Consumers?
American Journal of Agricultural Economics 68(4), pp. 961-969.
Cafiero C, Bobenrieth E, Bobenrieth J, Wright B (2011). The empirical relevance of the competitive storage model. Journal of
econometrics. 162(1), 44-54
Cafiero C, Schmidhuber J (2011). Stock and Price Data: Does Practice Match with Theory? Presented at the AMIS Meeting in
Rome, December 19.
Catholic Relief Services (1998). Community-Level Grain Storage Projects (Cereal Banks): Why Do They Rarely Work and What
Are the Alternatives? Workshop in Dakar, Senegal, sponsored by CRS with funding from USAID/OFDA.
Chand R (2002). Government intervention in foodgrain markets in the new context. Report to the Ministry of Consumers Affairs,
Food and Public Distribution, government of India. New Delhi: National Centre for Agricultural Economics and Policy
Research.
Chapoto A, Jayne TS (2009). The Impacts of Trade Barriers and Market Interventions on Maize Price Predictability: Evidence
from Eastern and Southern Africa, International Development Working Paper No. 102, Michigan State University.
Chavas JP (2000). On information and market dynamics: the case of the U.S. beef market. Journal of Economic Dynamics and
Control, 24: 833–853.

80
Chavas JP (2008). On Storage Behavior under Imperfect Competition, with Application to the American Cheese Market. Review
of Industrial Organization, 33:325–339
Chavas JP, Kwansoo K (2002). The Effects of Stocks and Price Floors on Price Dynamics and Volatility: An Application to the
U.S. Non-fat Dry Milk Market, Working Papers 201558, University of Wisconsin-Madison, Department of Agricultural and
Applied Economics, Food System Research Group.
Christiaensen L (2009). Revisiting the Global Food Architecture: Lessons from the 2008 Food Crisis, Review of Business and
Economics 54, pp. 345-361.
Clay E (2006). Food Aid Tying is the Real Problem: A Response to the Barrett and Maxwell Proposal. Food Policy 31:119–22.
Clément A (1999). Nourrir le peuple, entre État et marché XVIe-XIXe siècles, Paris, l’Harmattan.
Club du Sahel et de l’Afrique de l’Ouest (2010). Etude régionale sur les stocks d’urgence en Afrique de l’Ouest et au Sahel,
OCDE, Paris.
Coate S (1989). Cash versus Direct Food Relief. Journal of Development Economics 30 (2): 199–224.
Coleman A (2009). Storage, Slow Transport, and the Law of One Price: Theory with Evidence from Nineteenth-Century U.S.
Corn Markets, Review of Economics and Statistics, 91(2): 332–350
Compton J, Wiggins S, Keats S (2010). Impact of the Global Food Crisis on the Poor: What is the Evidence? London: Overseas
Development Institute.
Coulter J (2013). The use of B-instruments [hedging tools] by governments: Malawi’s experience. In: Galtier, F. Managing Food
Price Instability in Developing Countries. A Critical Analysis of Strategies and Instruments. Paris: AFD.
Coulter J, Onumah G (2002). The Role of Warehouse Receipt Systems in Enhanced Commodity Marketing and Rural
Livelihoods in Africa, Food Policy 27 (2002) 319–337.
Coulter J, Onumah G (2013). African commodity exchanges still show little development for grains. In: Galtier, F. Managing
Food Price Instability in Developing Countries. A Critical Analysis of Strategies and Instruments. Paris: AFD.
CRMG (2008). The International Task Force on Commodity Risk Management in Developing Countries: Activities, Findings and
the Way Forward, Commodity Risk Management Group, October, The World Bank, Washington DC.
Cummings R, Rashid S, Ashok G (2006). Grain Price Stabilization Experience in Asia: What Have We Learned? Food Policy
31: 302–12.
Cunha J (2014). Testing Paternalism: Cash versus In-kind Transfers. American Economic Journal: Applied Economics 6 (2):
195–230.
Cunha J, De Giorgi G, Jayachandran S (2014). The price effects of cash versus in-kind transfers.
Currie J, Gahvari F (2008). Transfers in Cash and In-Kind: Theory Meets the Data. Journal of Economic Literature 46 (2): 333–
83.
D’Souza A, Joliffe D (2011). Rising Food Prices and Coping Strategies Household‐level Evidence from Afghanistan. Policy
Research Working Paper 5466. World Bank. Washington DC.
Dana J, Gilbert C, Shim E (2006). Hedging Grain Price Risk in the SADC: Case Studies of Malawi and Zambia. Food Policy. 31,
357–371.
Dana J, Rohrbach D, Syroka J (2007). Risk Management for Malawi Food Security, Internal Note for Discussion Purposes, The
World Bank, July 16, Working Draft for Discussion Purposes.
David-Benz (2013). Improving the governance of stabilization policies by setting up forums with private actors: the case of rice
in Madagascar. In: Galtier F, Managing Food Price Instability in Developing Countries: A Critical Analysis of Strategies
and Instruments. Paris: AFD.
Davies M, Bene C, Arnall A, Tanner T, Newsham AJ, Coirolo C (2013). Promoting Resilient Livelihoods through Adaptive Social
Protection: Lessons from 124 Programmes in South Asia. Development Policy Review 31 (1): 27–58.
Daviron B (1993). Conflit et coopération sur le marché international du café, une analyse de longue période. Thèse de doctorat,
ENSA Montpellier.
Daviron B, Douillet M (2013). Major players of the international food trade and the world food security. FOODSECURE, Working
Paper n°12. September.
Dawe D (2001). How far down the path to free trade? The importance of rice price stabilization in developing Asia. Food Policy.
26 (2), 163–175.
Dawe D (2008). Have recent increases in international cereal prices been transmitted to domestic economies? The experience
in seven large Asia Countries. ESA Working Paper. Rome: 12.
Dawe D (2009). The Unimportance of Low World Grain Stocks for Recent World Price Increases. FAO, ESA Working Paper No.
09-01. February
Dawe D (2016). Government and private rice stocks in Asia.
Dawe D (ed.) (2010). The Rice Crisis: Markets, Policies and Food Security. London & Washington, DC: Food and Agriculture
Organization of the United Nations (FAO) & Earthscan.
Dawe D, Timmer P (2012). Why stable food prices are a good thing: lessons from stabilizing rice prices in Asia, Global Food
Security, 1(2), pp. 127–33.
De Brauw A, Gilligan D, Hoddinott J, Moreira V, Roy S (2012). The impact of Bolsa Familia on child, maternal, and household
welfare. IFPRI. Washington, DC.
Deaton A, Dreze J (2009). Nutrition in India: Facts and interpretations. Economic and Political Weekly, 44(7), 42–65.
Deaton A, Laroque G (1992). On the behaviour of commodity prices, Review of Economic Studies, 59 : 1-23.
Deaton A, Laroque G (1996). Competitive Storage and Commodity Price Dynamics, The Journal of Political Economy, 104(5):
896–923.
Deaton A, Subramanian S (1996). The demand for food and calories. The Journal of Political Economy, 104(1), 133–162.
Del Ninno C, Dorosh P (2003). Impacts of in-kind transfers on household food consumption: Evidence from targeted food
programmes in Bangladesh. Journal of Development Studies 40 (1): 48–78.

81
Del Ninno C, Dorosh P, Subbarao K (2007). Food aid, domestic policy and food security: Contrasting experiences from South
Asia and sub-Saharan Africa. Food Policy 32 (4): 413–35.
Demeke M, Dawe D, Teft J, Ferede T, Bell W (2012). Stabilizing price incentives for staple grain producers in the context of
broader agricultural policies. Debates and country experiences. FAO, ESA Working Paper 12-05.
Demeke M, Pangrazio G, Maetz M (2008). Country Responses to the Food Security Crisis: Nature and Preliminary Implications
of the Policies Pursued. Agricultural Support Service, FAO, Rome.
Dercon S, Hoddinott J, Woldehanna T (2005). Shocks and Consumption in 15 Ethiopian Villages, 1999-2004, Journal of African
Economies. 14(4), pp. 559-585.
Dercon S, Park A, Singh A (2012). School Meals as a Safety Net: An Evaluation of the Midday Meal Scheme in India. Economic
Development and Cultural Change 62 (2): 275–306.
Devaney B, Moffitt R (1991). Dietary effects of the food stamp program. American Journal of Agricultural Economics 73 (1):
202–11.
Devereux S (1988). Entitlements, Availability and Famine, Food Policy 13(3), pp. 270-282.
Devereux S (2002). Can Social Safety Nets Reduce Chronic Poverty? Development Policy Review. 20(5), 657–675.
Devereux S (2003). Policy Options for Increasing the Contribution of Social Protection to Food Security IDS, Brighton.
Devereux S (2008). Innovations in the Design and Delivery of Social Transfers: Lessons Learned from Malawi. Brighton, UK:
Institute of Development Studies.
Devereux S (2012). Social Protection for Enhanced Food Security in Sub-Saharan Africa. Working Paper 2012-010, UNDOP,
New York.
Devereux S, Jere P (2008). Choice, Dignity and Empowerment? Cash and Food Transfers in Swaziland. An evaluation of Save
the Children’s Emergency Drought Response, 2007/08. Institute of Development Studies and Save the Children.
Brighton and Mbabane.
Diarra S, Dembélé N (2008). Reconnaissance rapide sur l’impact des restrictions à l’exportation des céréales en 2008 au Mali,
Août 2008.
Diaz-Bonilla E (2014). On Food Security Stocks, Peace Clauses, and Permanent Solutions After Bali. IFPRI Working Paper,
June.
Dimand RW, Dimand MA (1990). J.M. Keynes on buffer stocks and commodity price stabilization. History of political economics
22(2): 113-123.
Do QT, Levchenko A, Ravallion M (2013). Coping with Food Price Volatility: Trade Insulation as Social Protection. In The
Economics of Food Price Volatility, ed. Jean-Paul Chavas, David Hummels, and Brian D Wright. University of Chicago
Press.
Dorin B, Hourcade J-C, Benoit-Cattin M (2013). A World Without Farmers? The Lewis Path Revisited. CIRED Working Paper No
47-2013.
Dorin B, Landy F (2009). Agriculture and Food in India. A Half-century Review, from Independence to Globalization, Centre de
sciences humaines (New Delhi), Institut Français de Pondichéry (Pondéchéry) and QUAE, Montpellier, France.
Dorosh P (2009). Price stabilisation, international trade and national cereal stocks: world price shocks and policy response in
South Asia. Food Security 1:137-149.
Dorosh P (2016). International rice trade and security stocks: prospects for an expanded Asian international rice reserve.
Dorosh P, Ahmed H (2009). Foreign Exchange Rationing, Wheat Markets and Food Security in Ethiopia. Ethiopia Strategy
Support Program 2 (ESSP2) Discussion Paper No. ESSP2 004. International Food Policy Research Institute,
Washington, DC.
Dorosh P, Rashid S (2012). Bangladesh Rice Trade and Price Stabilization. Implications of the 2007/08 Experience for Public
Stocks. IFPRI Discussion Paper, July.
Dorosh P, Rashid S (2013). Trade subsidies, export bans and price stabilization: lessons of Bangladesh–India rice trade in the
2000s, Food Policy 41(C): 103–11.
Dorward A (2011). Getting Real About Food Prices. Development Policy Review, 29 (6): 647-664
Dorward A, Kydd J, Morrison J, Urey I (2004). A Policy Agenda for Pro-Poor Agricultural Growth, World Development, 32(1):
73–89.
Doss C (2013). Intrahousehold Bargaining and Resource Allocation in Developing Countries. World Bank Research Observer
28 (1): 52–78.
Dreze J, Sen A (1989). Hunger and Public Action. Clarendon Press. Oxford.
Duflo E (2003). Grandmothers and granddaughters: Old age pension and intra-household allocation in South Africa. World Bank
Economic Review, 17(1), 1–25.
ECOWAS (2012). Regional Food Security Reserve. ECOWAS, WAEMU, CILSS, RESOGEST. July, 108 p. + Annexes.
Egg J (2009). Les stocks nationaux de réserve : la longue expérience des pays du Sahel. Entre dépendance au sentier et
changement de paradigme, Note de travail, ECART –CIRAD – IRAM.
Egg J, Michiels D, Blein R, Alby Flores V (2006). Evaluation du dispositif de prévention et de gestion des crises alimentaires du
Niger durant la crise de 2004-2005. Avec les contributions de F. Delpeuch, M. Kone, O. Touré, M. Diarra and T.
Voituriez. République du Niger, Cabinet du Premier Ministre, Cellules Crises Alimentaires.
Ellis F, Manda E (2012). Seasonal Food Crises and Policy Responses: A Narrative Account of Three Food Security Crises in
Malawi. Food Policy 40 (7): 1407–17.
European Commission (2012). Social transfers in the fight against hunger. Tools and Methods Series. Reference Document 14.
Directorate General for Development and Cooperation – EuropeAid. April, 126 p.
European Commission (2015). 10 Common principles for multi-purpose cash-based assistance to respond to humanitarian
needs. March, 20 p.
Faminow MD (1995). Issues in valuing food aid: The cash or in-kind controversy. Food Policy 20 (1): 3–10.

82
FAO (1997). Strategic grain reserves - Guidelines for their establishment, management and operation. FAO Agricultural
Services Bulletin. Rome.
FAO (2006). Food Security. Policy brief, June.
FAO-MAFAP (2016a). Améliorer l'efficacité et l'efficience de la stratégie de stockage public au Mali, Rapport technique. H.
Gourichon et G. Pierre 2016. Série d'analyses, MAFAP (Programme de Suivi et Analyse des Politiques Agricoles et
Alimentaire). FAO, Rome.
FAO-MAFAP (2016b). Anticiper les achats du SNS pour améliorer l’efficacité et réduire les coûts de la politique de sécurité
alimentaire du Mali. Note technique pour le CSA et l’OPAM.
FAO-MAFAP (2016c). Anticiper les achats du SIE pour améliorer l’efficacité et réduire les coûts de la politique de sécurité
alimentaire du Mali. Note technique pour le CSA et l’OPAM.
FAO, IFAD, IMF, OECD, UNCTAD, WFP, the World Bank, the WTO, IFPRI, UN HLTF (2011). Price Volatility in Food and
Agricultural Markets: Policy Responses. Policy Report for the G20. June, 42 pages + Annexes.
Faruqee R (2009). Government Policy and Program for Strategic Grain Reserve in Malawi: Issues and Options. Report
prepared for the World Bank, Washington, DC.
Fiszbein A, Schady N (2009). Conditional Cash Transfers: Reducing Present and Future Poverty. Washington, DC:World Bank.
foodreserves.org web site. Web site on food reserves managed by Oxfam and IATP (http://www.foodreserves.org/).
Fraker, T., A. Martini, and J. Ohls. 1995. The effect of food stamp cashout on food expenditures: An assessment of the findings
from four demonstrations. Journal of Human Resources 30 (4) : 633–649.
G20 (2011). Action plan on food price volatility and agriculture. Ministerial Declaration, Meeting of G20 Agriculture Ministers,
Paris, 22 and 23 June 2011.
Galiani F (1770). Dialogues sur le commerce des bleds. Réédition 1984, Paris: Fayard.
Galtier F (2011). What can the international community do to help developing countries manage food price instability? Policy
brief.
Galtier F (2013a). Managing Food Price Instability in Developing Countries. A Critical Analysis of Strategies and Instruments.
With the collaboration of B. Vindel. Paris: AFD.
Galtier F (2013b). Managing food price instability: Critical assessment of the dominant doctrine. Global Food Security 2(2), 72-
81, July.
Galtier F (2017). Looking for a Permanent Solution on Public Stockholding Programmes at the WTO: Getting the Right Metrics
on the Support Provided. E15 Initiative. Geneva: International Centre for Trade and Sustainable Development (ICTSD)
and World Economic Forum. www.e15initiative.org/
Galtier F, Clément A (2014). Réguler le marché par l’information: histoire d’une idée, des Mercantilistes aux systèmes
d’information de marché de dernière génération. Cahiers Agricultures 23(4-5): 259-269.
Galtier F, Diakité L, Diarra S (2009), Efficacité des politiques de stabilisation des prix alimentaires en Afrique subsaharienne.
L’expérience du Mali sur la période 2004 -2009, CIRAD – Fondation FARM, 74 p. + Annexes.
Galtier F, Subervie J, David-Benz H, Egg J (2014). Agricultural market information systems in developing countries. New
models, new impacts. Editorial introduction to a special issue, Cahiers Agricultures 23(4-5): 232-244.
Ganesh-Kumar A, Gulati A, Cummings R (2008). Reforming Foodgrains Management: Achieving Food Security with Cost-
Effectiveness. Working Paper 27, Indira Gandhi Institute of Development Research, Mumbai.
Gardner BL (1979). Optimal Stockpiling of Grain, Lexington Books, Boston, MA, 175 pp.
Gardner BL, López R (1996). The Inefficiency of Interest-Rate Subsidies in Commodity Price Stabilization, American Journal of
Agricultural Economics, Vol. 78, No. 3, pp. 508-516.
Gelli A, Kretschmer A, Molinas L (2012). A comparison of supply chains for school food exploring operational trade-offs across
implementation. London: PCD.
Gentilini U (2007). Cash and Food Transfers: A Primer. The World Food Programme, Rome.
Gentilini U (2015). Revisiting the Cash versus Food Debate: New Evidence for an Old Puzzle? The World Bank Research
Observer Advance Access published September 22, 2015
Gérard F, Boussard JM, Piketty T (2012). Les coûts et bénéfices du stockage public des céréales, Ministère de l’Agriculture, de
l’Agroalimentaire et de la Forêt, Paris.
Gilbert C (1996). International Commodity Agreements: An Obituary Notice. World Development 24(1), 1-19.
Gilbert C (2012). International agreements to manage food price volatility. Global Food Security 1, 134–142.
Gilligan D, Hoddinott J (2007). Is there Persistence in the Impact of Emergency Food Aid? Evidence on Consumption, Food
Security and Assets in Rural Ethiopia, American Journal of Agricultural Economics 89(2), pp. 225-242.
Glauber J, Helmberger P, Miranda M (1989), Four Approaches to Commodity Market Stabilization: A Comparative Analysis,
American Journal of Agricultural Economics 71(2), pp. 326-337.
Glewwe P, Jacoby H, King E (2001). Early childhood nutrition and academic achievement: a longitudinal analysis. Journal of
Public Economics 81 (3), 345-368
GMR (2012). Food Prices, Nutrition, and the Millennium Development Goals. Global Monitoring Report, World Bank,
Washington, DC.
Gombeaud J-L, Moutout C, Smith S (1990). La guerre du cacao. Histoire secrète d’un embargo, Paris: Calmann-Lévy, 218 p.
Gouel C (2011). Agricultural Price Instability and Optimal Stabilisation Policies. PhD Thesis. Ecole Polytechnique, April, Paris.
Gouel C (2013). Rules versus discretion in food storage policies, American Journal of Agricultural Economics, 95(4), pp. 1029–
44.
Gouel C (2014). Food Price Volatility and Domestic Stabilization Policies in Developing Countries. In The Economics of Food
Price Volatility, edited by J.-P. Chavas, D. Hummels, and B. D.Wright. Chicago: University of Chicago Press.
Gouel C, Gautam M, Martin W (2014). Managing Food Price Volatility in a Large Open Country, The Case of Wheat in India,
World Bank, Washington, DC.

83
Gouel C, Jean S (2012). Optimal Food Price Stabilization in a Small Open Developing Country, Policy Research, Working
Paper 5943, World Bank, Washington, DC.
Government of India (2005). Performance Evaluation of Targeted Public Distribution System (TPDS). Planning Commission,
New Delhi.
Grosh M, Andrews C, Quintana R, Rodriguez-Alas C (2011). Assessing Safety Net Readiness in Response to Food Price
Volatility. The World Bank, Social Protection Discussion Paper 1118.
Gustafson RL (1958). Carryover Levels for Grains: A Method for Determining Amounts that are Optimal Under Specified
Conditions. Technical Bulletin 1178, US Dept. of Agriculture.
Haijing Z (2012). Feasibility and Impact Analysis of an International Grain Reserve. Master of Science Thesis. The University of
Tennessee, Knoxville
Hanush D (2010). A Possible Contribution of Food Reserves to Food Security in Djibouti. World Food Programme, Draft Report,
October.
Haushofer J, Shapiro J (2013). Household response to income changes: Evidence from an unconditional cash transfer program
in Kenya.
Hazell P, Poulton C, Wiggins S, Dorward A (2010). The Future of Small Farms: Trajectories and Policy Priorities, World
Development 38 (10), 1349–1361.
He X-Z, Westerhoff FH (2005). Commodity markets, price limiters and speculative price dynamics. Journal of Economic
Dynamics and Control, 29: 1577-1596.
HEA-Sahel (2013). Atlas Préliminaire de l’Information AEM au Sahel. Julius Holt & Mark Lawrence, The Food Economy Group.
UE, Save the Children, Oxfam, Action Contre la faim, PAM. Juillet, 69 p. + Annexes.
Headey D (2011). Rethinking the Global Food Crisis: The Role of Trade Shocks. Food Policy 36, 136-146.
Headey D (2014). Food Prices and Poverty Reduction in the Long Run. IFPRI, Discussion Paper 1331.Washington, DC.
Headey D, Fan S (2008). Anatomy of a Crisis: The Causes and Consequences of Surging Food Prices, Agricultural Economics,
39: 375–391.
Headey D, Fan S (2010). Global Food Crisis: How did it Happen? How has it Hurt? And how Can we Prevent the Next One?
Washington, IFPRI, 122 p.
Hidrobo M, Hoddinott J, Peterman A, Margolies A, Moeira V (2014). Cash, Food, or Vouchers? Evidence from a Randomized
Experiment in Northern Ecuador. Journal of Development Economics 107:144–56.
HLPE (2011). Price volatility and food security. A report by The High Level Panel of Experts on Food Security and Nutrition.
Committee on World Food Security. July, 79 p.
HLPE (2012). Social protection for food security. A report by The High Level Panel of Experts on Food Security and Nutrition.
Committee on World Food Security. June, 85 p.
Hoddinott J (2013). Cash, Food, or Vouchers? Evidence from a Four-Country Experimental Study. Presentation at IFPRI-WFP
event, Washington, DC.
Hoddinott J, Behrman J (2005). Programme Evaluation with Unobserved Heterogeneity and Selective Implementation: The
Mexican PROGRESA Impact on Child Nutrition, Oxford Bulletin of Economics and Statistics, 67, 4, (2005) 0305-9049.
Hoddinott J, Gilligan D, Hidrobo M, Margolies A, Roy S, Sandström S, Schwab B, Upton J (2013). Enhancing WFP’s capacity
and experience to design, implement, monitor and evaluate vouchers and cash transfer programmes. International Food
Policy Research Institute.
Hoddinott J, Maluccio J, Behrman J, Flores R, Martorell R (2008). Effect of a Nutrition Intervention During Early Childhood on
Economic Productivity in Guatemalan Adults. The Lancet 371 (9610) (February): 411–416.
Hoddinott J, Sandstrom S, Upton J (2014). The impact of cash and food transfers: Evidence from a randomized intervention in
Niger. Discussion Paper 1341, IFPRI,Washington, DC.
Hoddinott J, Skoufias E (2004). The Impact of PROGRESA on Food Consumption, The University of Chicago.
Holden, S.T., B.L. Debela and G. Shively (2014), Does Ethiopia’s Productive Safety Net Program Improve Child Nutrition?,
Centre for Land Tenure Studies Working Paper 01/14, Norwegian University of Life Sciences.
Hommes CH (1994). Dynamics of the cobweb model with adaptive expectations and nonlinear supply and demand. J. Econ.
Behav. Org., 24 : 315-335.
IATP (2012). Grain reserves and the food price crisis. Selected writings from 2008-2012.
ICTSD (2016). Public Stockholding for Food Security Purposes: Options for a Permanent Solution. Geneva: International Centre
for Trade and Sustainable Development (ICTSD), 28 p.
IEG (2011). Social Safety Nets: An Evaluation of World Bank Support, 2000–2010. Independent Evaluation Group, World Bank,
Washington, DC.
IPC (2009). Agricultural Export Restrictions. Policy Focus, International Food and Agricultural Trade Policy Council, January, 4
p.
IPC Global Partners (2012). Integrated Food Security Phase Classification Technical Manual Version 2.0. Evidence and Standards for Better Food Security Decisions. FAO. Rome.
IPC-IG, WFP (2013). Structured Demand and Smallholder Farmers in Brazil: the Case of PAA and PNAE. International Policy
Centre for Inclusive Growth, WFP Centre of Excellence against Hunger. Brasilia, October. 35 p.
Islam N, Thomas S (1996). Foodgrain Price Stabilization in Developing Countries. Food Policy Review 3, IFPRI, Washington,
DC.
Jayne T (2012). Managing food price instability in East and Southern Africa. Global Food Security, 1(2): 143–149.
Jayne T, Jones S (1997). Food marketing and pricing policy in eastern and southern Africa: A survey. World Development,
25(9): 1505–1527.
Jayne T, Myers R, Nyoro J (2008). The Effects of NCPB Marketing Policies on Maize Market Prices in Kenya. Agricultural
Economics 38: 313–25.

84
Jayne T, Yamano T, Weber M, Tschirley D, Benfica R, Chapoto A, Zulu B (2003). Smallholder income and land distribution in
Africa: implications for poverty reduction strategies. Food Policy 28(3): 253–275.
Jayne T, Zulu B, Nijhoff J (2006). Stabilizing Food Markets in Eastern and Southern Africa. Food Policy. 31, 328-341.
Jha S, Mehta A (2008). Effectiveness of Public Spending: The Case of Rice Subsidies in the Philippines. ADB Economic
Working Paper Series, 138, Asian Development Bank, Manila.
Jha S, Ramaswami B (2010). How Can Food Subsidies Work Better? Answers from India and the Philippines. Asian
Development Bank Economics Working Paper Series 221, Manila.
Jha S, Srinivasan PV (1997). Foodgrain Price Stabilization: Implications of Private Storage and Subsidized Food Distribution,
Journal of Policy Modeling, 19(6): 587-604.
Jha S, Srinivasan PV (1999). Grain Price Stabilization in India: Evaluation of Policy Alternatives. Agricultural economics, 21: 93-
108.
Kajisa K, Akiyama T (2005). The Evolution of Rice Price Policies over Four Decades: Thailand, Indonesia and the Philippines.
Oxford Development Studies, 33:2, 305-329
Kanbur SMR (1984). How to Analyse Commodity Price Stabilisation? A Review Article. Oxford Economic Papers 36:3, 336-358.
Kazianga H, de Walque D, Alderman H (2014). School Feeding Programs, Intrahousehold Allocation and the Nutrition of
Siblings: Evidence from a Randomized Trial in Rural Burkina Faso. Journal of Development Economics 106:15–34.
Kennedy J (1979). Optimal Buffer Stock Policies for Wheat at the World Level, The Australian Journal of Agricultural Economics
23(3), pp. 163-175.
Keynes JM (1938). The policy of government storage of foodstuffs and raw material. The Economic Journal, 48(4): 449-460.
Keynes JM (1942). The International Regulation of Primary Products, London: Treasury Chambers, Draft, 26 p. + Annexes.
Khara T, Dolan C (2014). The relationship between wasting and stunting, policy, programming and research implications.
Washington DC: USAID Technical Brief Paper.
Khera R (2011). India’s Public Distribution System: Utilization and Impact. Journal of Development Studies 47(7), pp. 1–23.
Koester U (1986). Regional Cooperation to Improve Food Security in Southern and Eastern African Countries. IFPRI Research
Report 53, Washington, DC.
Krandker S, Khaleque A, Samad H (2011). Can Social Safety Nets Alleviate Seasonal Deprivation? Evidence from Northwest
Bangladesh. Policy Research Working Paper 5865, World Bank, Washington, DC.
Larson D, Lampietti J, Gouel C, Cafiero C, Roberts J (2012). Food Security and Storage in the Middle East and North Africa.
Policy Research Working Paper 6031, the World Bank, Washington, DC.
Lentz E, Barrett C, Gomez M, Maxwell D (2013). On The Choice and Impacts of Innovative International Food Assistance
Instruments. World Development 49 (C): 1–8.
Lepeshko N (2011). Global Food Price Crisis and Safety Nets Response: Experience of IDA Countries in ECA. World Bank.
Washington, DC.
Leroy J, Gadsden P, Rodriguez-Ramirez S, Gonzales de Cossio T (2010). Cash and In-kind Transfers in Poor Rural
Communities and Mexico Increase Household Fruit, Vegetable and Micronutrient Consumption but also Lead to Excess
Energy Consumption. American Society for Nutrition 140 (3): 612–7.
Levedahl JW (1991). The Effect of Food Stamps on Household Food Expenditures. Washington, DC: U.S. Department of
Agriculture.
Lewis WA (1954). Economic Development with Unlimited Supplies of Labour. The Manchester School, 22, 139-191.
Lin J (2008). Prepared Remarks presented at the Roundtable on Preparing for the Next Global Food Price Crisis. Center for
Global Development, October 17, Washington DC.
Lopez-Rodriguez D (2011). The Political Economy of In-Kind Redistribution. MPRA, Paper 44152, Munich.
Losch B, Fréguin-Gresh S, White E (2012). Structural Transformation and Rural Change Revisited. Challenges for Late
Developing Countries in a Globalizing World. The World Bank, AFD.
Lowry M, Glauber JW, Mireta MJ, Helmberger PG (1987). Pricing and Storage of Field Crops: A Quarterly Model Applied to
Soybeans, American Journal of Agricultural Economics, 69(4): 740–749.
Lynton-Evans J (1997). Strategic Grain Reserves. Guidelines for their Establishment, Management and Operation. Agricultural
Services Bulletin 126, Rome.
MacAuslan I., Riemenschneider N (2011). Richer but resented: What do cash transfers do to social relations? IDS Bulletin 42
(6): 60–6.
Maître d’Hôtel E, David-Benz H, Gérard F (2012). Les politiques de gestion de l’instabilité des prix agricoles : Leçons des
expériences menées à Madagascar, au Mali et en Zambie, Revue Tiers-Monde, 2012/2013 No. 211: 71-89.
Makki SS, Tweeten LG, Miranda M (2001). Storage Trade Interactions Under Uncertainty: Implication for Food Security, Journal
of Policy Modeling, 23: 127-140.
Manley J, Gitter S, Slavchevska V (2012). How effective are cash transfer programmes at improving nutritional status? London:
EPPI-Centre, Social Science Research Unit, Institute of Education, University of London.
Margolies A, Hoddinott J (2014). Costing Alternative Transfer Modalities. IFPRI, Working Paper 1375,Washington DC.
Martin W, Anderson K (2012). Export restrictions and price insulation during commodity price booms, American Journal of
Agricultural Economics, 94(2), pp. 422–27.
Mason NM, Myers RJ (2013). The effects of the Food Reserve Agency on maize market prices in Zambia. Agricultural
Economics, 44(2): 203–216.
McCreary I (2012). Food Reserves in India. Canadian Foodgrains Bank Occasional Paper. Canadian Foodgrains Bank,
Winnipeg, MB.
Meyer J (2007). The use of cash/vouchers in response to vulnerability and food insecurity. WFP. Maseru and Rome.
Miao et al. (2011). Reviving the competitive storage model: A holistic approach to food commodity prices. IMF Working Paper,
march, 48 p.

85
Michiels D, Blein R, Egg J (2011). Evaluation des systèmes de réponses à la crise de 2010 au Niger. Délégation de l’Union
européenne au Niger, COWI/IRAM. Tome 1 : Synthèse du diagnostic et recommendations. Tome 2 : Analyse de la
gestion de la crise.
Michiels D, Egg J, (2008). Les politiques de prévention et gestion des crises alimentaires : enseignements de la crise du Niger
de 2005. Avec la collaboration de R. Blein et F. Delpeuch. Paris : MAEE, DGCID, série Etudes, 90 p.
Michiels D, Egg J, Blein R (2012). La répétition des crises alimentaires et nutritionnelles au Niger : la rénovation urgente des
politiques de sécurité alimentaire. Cahiers Agricultures 21(5): 302-310.
Minot N (2010). Transmission of World Food Changes to African Markets and its Effects on Household Welfare. Washington,
IFRPI.
Minot N (2011). Food Price Volatility and the Management of Public Grain Stocks in Eastern and Southern Africa. Prepared for
ARD, World Bank, Washington, DC.
Mitchell D (2008). A Note on rising food prices. Policy research working paper n°4682, The World Bank, Washington.
Mitchell D, Le Vallee J-C (2005). International food price variability: the implications of recent policy changes. Paper presented
to the Workshop Managing Food Price Instability in Low-Income Countries, 28 February to 1 March 2005, Washington,
DC.
Mitchell D, Mielke M (2005). Wheat: The Global Market, Policies, and Priorities. In M.A. Aksoy and J.C. Beghin, eds. Global
Agricultural Trade and Developing Countries. Washington DC: The World Bank, pp. 195–214.
Mitra S, Boussard JM (2011). Les stocks et la volatilité des prix agricoles : un modèle de fluctuations endogènes. Economie
Rurale, 321: 17-28.
Mude A, Kumar P (2006). Estimating the Welfare Impacts of Maize Price Policy in Kenya, study presented at the World Bank
Workshop on Poverty and Economic Growth, Washington, D.C.
Murgai R, Ravallion M, van de Walle D (2013). Is workfare cost-effective against poverty in a poor labor-surplus economy?
(World Bank Policy Research Working Paper 6673).
Murphy S (2009). Strategic Grain Reserves in an Era of Volatility. Institute for Agriculture and Trade Policy, October.
Murphy S (2010). Trade and Food Reserves. What Role does the WTO play? Institute for Agriculture and Trade Policy,
September, 16 p.
Myers R (2006). On the Costs of Food Price Fluctuations in Low-Income Countries. Food Policy 31(4): 288–301.
NEPAD (2004). NEPAD Study to Explore Further Options for Food Security Reserve Systems in Africa. New Economic
Partnership for Africa’s Development with the technical support from the World Food Program, Rome.
Nerlove M (1979). The dynamics of agricultural supply: retrospect and prospect. American Journal of Agricultural Economics.
61, 874-888.
Newbery D (1984). Commodity Price Stabilization in Imperfect or Cartelized Markets. Econometrica. 52(3), 563-578.
Newbery D (1989). The Theory of Food Price Stabilisation. Economic Journal. 89, 1065-1082.
Newbery D, Stiglitz J (1981). The Theory of Commodity Price Stabilization. A Study in the Economics of Risk. Oxford:
Clarendon Press.
Ng S (1996). Looking for evidence of speculative stockholding in commodity markets. Journal of Economic Dynamics and
Control, 20(1–3): 123–143.
Nkonde C, Mason N, Sitko N, Jayne T (2011). Who Gained and Who Lost from Zambia’s 2010 Maize Marketing Policies? Food
Security Research Project Working Paper 49, Lusaka, Zambia.
OECD (2005). The Development Effectiveness of Food Aid: Does Tying Matter? Paris: OECD Publishing.
OECD (2009). Agricultural Policies in Emerging Economies: Monitoring and Evaluation, OECD, Paris.
OECD (2011). An Assessment of International Commodity Agreements for Commodity Price Stabilisation, May, 42 p.
OECD (2014). Review of stockholding policies. A. Deuss, background document for the OECD Global Forum on Agriculture:
Issues in Agricultural Trade Policy 2 December 2014, Paris.
OECD (2015a). Alternative policies to buffer stocks for food security. October.
OECD (2015b). Managing Food Insecurity Risk. Analytical framework and application to Indonesia.
Olivier de Sardan J-P (2007). Analyse rétrospective de la crise alimentaire au Niger en 2005. Avec la participation de M. Ali
Bako, E. Guillermet, O. Hamani, Y. Issa, M. Koné et M. Moha. LASDEL. Document de travail AFD 45.
Olivier de Sardan J-P, Hamani O, Issaley N, Issa Y, Adamou H, Oumarou I (2014). Les transferts monétaires au Niger : le grand
malentendu. Revue Tiers Monde 218: 107-130.
Omano SW, Gentilini U, Sandström S (2010). Revolution: From Food Aid to Food Assistance. Innovations in Overcoming
Hunger. (Eds) WFP, Rome.
Ortiz I, Cummins M, Chai J (2011). Escalating Food Prices. The threat to poor households and policies to safeguard a Recovery
for All. UNICEF. New York.
Osborne T (2004). Market News in Commodity Price Theory: Application to the Ethiopian Grain Market, The Review of
Economic Studies, 71(1): 133–164.
Oxfam (2011). Preparing for Thin Cows: Why the G20 Should Keep Buffer Stocks on the Agenda. Briefing Note.
PAA database. http://www.mda.gov.br/sitemda/secretaria/saf-paa/modalidades-do-paa. Consulted on 23 February 2018.
Pelcovits M (1979). The Equivalence of Quotas and Buffer Stocks as Alternative Stabilization Policies, Journal of International
Economics 9(2), pp. 303-307.
Peterson H, Tomek W (2005). How much of commodity price behavior can a rational expectations storage model explain?
Agricultural Economics. 33(3), 289–303
Peterson W (1979). International farm prices and the social cost of cheap food, American Journal of Agricultural Economics
61(1), pp. 12–21.
Piesse J, Thirtle C (2009). Three Bubbles and a Panic: An Explanatory Review of Recent Food Commodity Price Events, Food
Policy 34: 119-129.

86
Pinckney TC (1993). Is Market Liberalization Compatible with Food Security? Storage, Trade and Price Policies for Maize in
Southern Africa, Food Policy 18: 325-333.
Pinckney TC, Valdes A (1988). Short-Run Supply Management and Food Security: Results from Pakistan and Kenya. World
Development. 16(9), 1025–1034.
Pinstrup-Andersen P, Ruiz de Londono N, Hoover E (1976). The impact of increasing food supply on human nutrition:
implications for commodity priorities in agricultural research and policy. American Journal of Agricultural Economics
58(2), 131-142.
PNAE database. http://www.fnde.gov.br/programas/pnae. Consulted on 9 March 2018.
Poapongsakorn N, Pantakua K (2015). Assessing the Thai Paddy Pledging Policy: Its Performance and Social Costs. World
Food Policy Journal.Porteous, Obie C. 2012. Empirical Effects of Short-Term Export Bans: The Case of African Maize.
Poulton C, Kydd J, Wiggins S, Dorward A (2006). State Intervention for Food Price Stabilisation in Africa: Can it Work? Food
Policy. 31, 342-356.
Prakash A (ed.) (2001). Safeguarding Food Security in Volatile Global Market. FAO, Rome.
Pritchett L (2005). A Lecture on the Political Economy of Targeted Safety Nets. World Bank, Social Protection Discussion Paper
0501,Washington DC.
Quisumbing AR (2003). Food aid and child nutrition in rural Ethiopia. World Development 31 (7): 1309–24.
Rashid S, Cummings R, Gulati A (2007). Grain Marketing Parastatals in Asia: Results from Six Case Studies. World
Development 35 (11): 1872–1888.
Rashid S, Gulati A, Cummings R (eds) (2008). From Parastatals to Private Trade: Lessons from Asian Agriculture, Johns
Hopkins University Press for the International Food Policy Research Institute, Baltimore MD.
Rashid S, Lemma S (2011). Strategic Grain Reserves in Ethiopia: Institutional Design and Operational Performance. IFPRI
Discussion Paper 01054, Washington, DC.
Rashid S, Taffesse A (2009). Grain markets and large social transfer: An analysis of Productive Safety Net Program (PSNP) in
Ethiopia. Selected paper for presentation at the XXVII International Association of Agricultural Economists (IAAE)
conference (August 16–22) in Beijing, China.
Ravallion M (1987). Markets and Famines. Oxford University Press, Oxford.
Ravallion M (2009). How relevant is targeting to the success of an antipoverty program? World Bank Research Observer, 24(2),
205–231.
Reinhart U (2013). On the Economics of Benefits In-Kind. Princeton University.
Robles M, Cuesta J, et al. (2008). Rising Food Prices and Poverty in Latin America: Effects of the 2006-2008 Price Surge.
Washington, Inter-American Development Bank.
Rodrigo MF (2013). Public Works in Ethiopia. Crowding Out On-Farm Labor?, Selected Paper prepared for presentation at the
Agricultural & Applied Economics Association's, 2013 AAEA & CAES Joint Meeting, Washington, DC.
Rogers B, Coates J (2002). Food-Based Safety Nets and Related Programs. Social Safety Net Primer Series, The World Bank,
Washington DC.
Rohrbach D, Faruqee R, Sadler M, Baker C (2010). Optimal Grain Reserve Strategies for Malawi. Discussion Paper, World
Bank, Washington, DC.
Ruiz-Arranz M, Davis B, Handa S, Stampini M, Winters P (2006). Program Conditionality and Food Security: The Impact of
PROGRESA and PROCAMPO Transfers in Rural Mexico, Economia, Brasilia (DF), v.7, n.2, p.249–278.
Ryckembusch D, Frega R, Da Silva MB, Sanogo I, Gentilini U, Grede N, Brown L (2013). Enhancing nutrition: A new tool for ex-
ante comparison of commodity-based vouchers and food transfers. World Development 49 (C): 58–67.
Sabates-Wheeler R, Devereux S (2012). Cash transfers and high food prices: Explaining outcomes on Ethiopia’s Productive
Safety Net Programme. Food Policy 35 (4): 274–85.
Saini S, Kozicka M (2014). Evolution and Critique of Buffer Stocking Policy of India. ICRIER Working Paper No. 283, Indian
Council for Research on International Economic Relations, New Delhi, India.
Salant S (1983). The Vulnerability of Price Stabilization Schemes to Speculative Attack. Journal of Political Economy. 91(1), 1-
38.
Sarris A (2009). Hedging Cereal Import Price Risks and Institutions to Assure Import Supplies, FAO Commodity and Trade
Policy Research, Working Paper No 30, December, 45 p.
Sarris A, Conforti P, Prakash A (2011). The use of organized commodity markets to manage food import price instability and
risk. Agricultural Economics. 42, 47–64
Schady N, Rosero J (2008). Are cash transfers made to women spent like other sources of income? Economics Letters, 101(3),
246–248.
Schwab B (2013). In the form of bread? A randomized comparison of cash and food transfers in Yemen. Paper presented at the
Agricultural & Applied Economics Association’s 2013 AAEA & CAES Joint Annual Meeting, August 4-6,Washington, DC.
Seale J, Regmi A, Bernstein J (2003). International Evidence on Food Consumption Patterns. USDA Technical Bulletin Number
1904, October.
Sen A (1980). Famines. World Development 8(9), 613-621.
Sen A (1981). Poverty and Famines, Oxford: Oxford University Press.
Senauer B, Young N (1986). The impact of food stamps on food expenditures: Rejection of the traditional model. American
Journal of Agricultural Economics 68 (1): 37–43.
Serra T, Gil JM (2012). Price Volatility in Food Markets: Can Stock Building Mitigate Price Fluctuations?, European Review of
Agricultural Economics, Vol. 40 (3) (2013) pp. 507–528.
Sharma R (2011). Food Export Restrictions: Review of the 2007 - 2010 Experience and Considerations for Disciplining
Restrictive Measures. Rome, FAO.
87
Skoufias E, Tiwari S, Zaman H (2011). Can we rely on cash transfers to protect dietary diversity during food crises? Estimates
from Indonesia. Policy Research Working Paper 5548, World Bank. Washington, DC.
Skoufias E, Unar M, Gonzalez-Cossio T (2008). The Impacts of Cash and In-Kind Transfers on Consumption and Labor Supply:
Experimental Evidence from Rural Mexico. World Bank, Policy Research Working Paper 4778,Washington, DC.
Slater R, Holmes R, Mathers N (2014). Food and Nutrition (in-)Security and Social Protection, OECD Development Co-
operation Working Papers, No. 15, OECD Publishing.
Slater R, McCord A (2009). Social Protection, Rural Development and Food Security: Issues Paper on the Role of Social
Protection in Rural Development, Overseas Development Institute.
Slayton T (2009). Rice crisis forensics: how Asian governments carelessly set the world rice market on fire, Working Paper No.
163, Center for Global Development, Washington, DC.
Slayton T, Timmer CP (2008). Japan, China and Thailand can solve the rice crisis—but US leadership is needed, CGD Notes
(May), Washington, DC: Center for Global Development.
Soulé B, Blein R, Bellora C (2008). Hausse des prix alimentaires en Afrique de l’Ouest. Revue et analyse des mesures
engagées à court et moyen terme. Contribution à la conférence « Prix agricoles : perspectives à moyen terme et
implications pour les producteurs et les politiques publiques », Paris, 16 décembre 2008. Lares, Bureau Issala,
Fondation Farm, 65 pages.
Southworth H (1945). The Economics of Public Measures to Subsidize Food Consumption. Journal of Farm Economics 27 pp. 28-36.
Srinivasan P, Jha S (2001). Liberalized Trade and Domestic Price Stability: The Case of Rice and Wheat in India. Journal of
Development Economics 65(2): 2–24.
Staatz J, Dembélé N, Kelly V, Adjao R (2008). Agricultural Globalization in Reverse: the Impact of the Food Crisis in West
Africa. Background Paper for the Geneva Trade and Development Forum, Crans-Montana, Switzerland 17-20 Sept.,
2008.
Stephens EC, Barrett CB (2011). Incomplete Credit Markets and Commodity Marketing Behaviour, Journal of Agricultural
Economics 62 (1), 1-24.
Stigler M, Prakash A (2011). The Role of Low Stocks in Generating Volatility and Panic, in A. Prakash (ed.), Safeguarding Food
Security in Volatile Global Markets, Rome: FAO, 314-328.
Subbarao K (1997). Public Works as an Anti-Poverty Program: An Overview of Cross-Country Experience, American Journal of
Agricultural Economics 79, pp. 678-683.
Subbarao K, del Ninno C, Andrews C, Rodríguez-Alas C (2013). Public Works as a Safety Net: Design, Evidence, and
Implementation. Directions in development; human development. Washington, DC: World Bank.
Swinnen J, Squicciarini P (2012). Mixed Messages on Prices and Food Security. Science 335 (6067): 405–406.
Tangermann S (2011). Price Volatility and Policy Options, Issue Paper No. 34, ICTSD, Geneva.
Timmer P (1986). Getting Prices Right: The Scope and Limits of Agricultural Price Policy. Ithaca: Cornell University Press.
Timmer P (1988). The Agricultural Transformation, in: Chenery, H., Srinivasan, T.N. (Eds), Handbook of Development
Economics, Vol. 1, Amsterdam, North-Holland, pp. 275-331.
Timmer P (1989). Food price policy: the rationale for government intervention. Food Policy 14(1), 17-42
Timmer P (1996). Does BULOG Stabilize Rice Prices in Indonesia? Should It Try? Bulletin of Indonesian Economic Studies
32(2), pp. 45-74.
Timmer P (2000). The Macro Dimensions of Food Security: Economic Growth, Equitable Distribution, and Food Price Stability,
Food Policy, 25: 283-295.
Timmer P (2009a). Management of rice reserve stocks in Asia: analytical issues and country experiences, paper presented to
the experts’ meeting on ‘Institutions and Policies to Manage Global Market Risks and Price Spikes in Basic Food
Commodities’ by the FAO Trade and Markets Division, October 26–27, Food and Agriculture Organization of the United
Nations (FAO), Rome.
Timmer P (2009b). A World Without Agriculture: The Structural Transformation in Historical Perspective. Wendt Memorial
Lecture, American Enterprise Institute, Washington DC.
Timmer P (2010). Reflections on food crises past. Food Policy 35: 1-11.
Timmer P (2012). Behavioral dimensions of food security, Proceedings of the National Academy of Sciences (PNAS) 109(31),
pp. 12315–20.
Timmer P (2013a). Preface of the book Galtier, F. Managing Food Price Instability in Developing Countries. A Critical Analysis
of Strategies and Instruments. Paris: AFD.
Timmer P (2013b). Price stabilization, self-sufficiency and food security: some lessons from the Indonesian experience. In:
Galtier, F. Managing Food Price Instability in Developing Countries. A Critical Analysis of Strategies and Instruments.
Paris: AFD.
Timmer P (2016a). What are grain reserves worth? A generalized political economy framework. Prepared for a workshop on the
role of food reserves in coping with price volatility, held at FAO Headquarters in Rome, Italy, January 30-31, 2014.
Timmer P (2016b). The Historical Evolution of RASKIN: An essay on the political economy of food-based social safety nets.
World Bank
Townsend R (1977). The Eventual Failure of Price Fixing Schemes. Journal of Economic Theory. 14, 190-199.
Tschirley D, Jayne T (2010). Exploring the Logic behind Southern Africa’s Food Crises. World Development. 38(1), 76-87.
Turnovsky SJ, Shalit H, Schmitz A (1980). Consumer’s Surplus, Price Instability, and Consumer Welfare. Econometrica 48 (1):
135–152.
UEMOA (2011). Etude sur la mise en place d’un dispositif régional de renforcement et de coordination des stocks nationaux de
sécurité alimentaire dans l’espace UEMOA. Commission. 67 p. + Annexes.
88
UNCTAD (2009). Review of Warehouse Receipt System and Inventory Credit Initiatives in Eastern & Southern Africa, All ACP
Agricultural Commodities Programme (AAACP).
Valdes A, Foster W (2003). Special safeguards for developing country agriculture: a proposal for WTO negotiations. World
Trade Review 2(1), 5-31.
Valluis B (2013). Sécurité alimentaire : pour des stocks de réserve. Fondation FARM, avril.
Varangis P, Larson D, Anderson J (2002). Agricultural Markets and Risks: Management of the Latter, not the Former. Policy
Research Working Paper 2793. The World Bank, Washington DC.
Von Braun J, Lin J, Torero M (2009). Eliminating Drastic Food Price Spikes – a three pronged approach for reserves. Note for
discussion.
Von Braun J, Torero M (2008). Physical and Virtual Global Food Reserves to Protect the Poor and Prevent Market Failure.
June, IFPRI, Policy Brief 4.
WDR (2007). World Development Report 2008: Agriculture for Development. World Bank, Washington, DC.
Webb P, Coates J, Frongillo E, Rogers B, Swindale A, Bilinsky P (2006). Measuring Household Food Security: Why It’s So
Important and Yet So Difficult to Do. Journal of Nutrition 136 (5):1404S–8S.
WFP (2011a). WFP 2008-2013 Purchase for Progress (P4P) Initiative: a Strategic Evaluation (mid –term), 111 p.
WFP (2011b). Emergency Humanitarian Food Reserves.
WFP (2014a). Strategic Evaluation of WFP 2008-2013 Purchase for Progress Initiative. Evaluation Report. Volume I, 86 p.
WFP (2014b). Cash and Vouchers Manual. Second edition.
White P, Hodges A, Greenslade M (2013). Guidance on measuring and maximising value for money in social transfer
programmes: Toolkit and explanatory text. London: DFID.
Wiggins S, Keats S (2009). Volatile World Food Prices and Their Implications: Grain Stocks and Price Spikes. Overseas
Development Institute, London.
Williams J, Wright B (1991). Storage and Commodity Markets. Cambridge: Cambridge University Press.
Wisemann D, Bassett L, Benson T, Hoddinott J (2009). Validation of the World Food Programme’s Food Consumption Score
and Alternative Indicators of Household Food Security. IFPRI, Discussion Paper 870. Washington, DC.
Wodon Q, Zaman H (2010). Higher Food Prices in Africa and Policy Response, The World Bank Research Observer. 25(1):
157–176. Washington, DC.
Working H (1949). ‘The theory of the price of storage’, American Economic Review 31 (December), pp. 1254–62.
World Bank (1986). Poverty and Hunger: Issues and Options for Food Security in Developing Countries. Washington DC.
World Bank (2005). Managing Food Price Risks and Instability in an Environment of Market Liberalization. Washington: The
World Bank.
World Bank (2008). Regional Trade in Food Staples: Prospects for Stimulating Agricultural Growth and Moderating Food
Security Crises in Eastern and Southern Africa. Agriculture and Rural Development, World Bank Africa Region, Report
46929-AFR, Washington, DC.
World Bank (2010). Food Price Increases in South Asia: National Responses and Regional Dimensions. Washington, DC: The
World Bank.
World Bank (2011). Responding to Global Food Price Volatility and Its Impact on Food Security. Development Committee.
Washington, DC.
World Bank (2012). Using public foodgrain stocks to enhance food security. September.
World Bank, FAO (2012). The Grain Chain: Food Security and Managing Wheat Imports in Arab Countries. Washington, DC,
and Rome.
Wright B (2009). International Grain Reserves and Other Instruments to Address Volatility in Grain Markets. Policy Research
Working Paper 5028, World Bank, Washington, DC.
Wright B, Cafiero C (2011). Grain reserves and food security in the Middle East and North Africa. Food Security 3: 61-76
Wright B, Williams J (1984). The Welfare Effects of the Introduction of Storage, Quarterly Journal of Economics, 99: 169-192.
Wright B, Williams J (1988). Measurement of Consumer Gains from Market Stabilization. American Journal of Agricultural
Economics 70 (3): 616–627.
WTO (1994). Agreement on Agriculture. In The Legal Texts – The Results of the Uruguay Round of Multilateral Trade
Negotiations. First published in 1994 by the GATT Secretariat; thirteenth printing 2007. Cambridge: Cambridge
University Press.
WTO (2013). Bali Ministerial Declaration adopted on 7 December 2013. Ministerial Conference Ninth Session, Bali, 3-6
December 2013. WT/MIN(13)/DEC. Published on 11 December 2013.
WTO (2015). Nairobi Ministerial Decision of 19 December 2015. Ministerial Conference Tenth Session, Nairobi, 15-18
December 2015. WT/MIN(15)/44. Published on 21 December 2015.
WTO (2016). China – Domestic Support for Agricultural Producers. Request for the Establishment of a Panel by the United
States. WT/DS511/8. 6 December 2016.
Yamano T, Alderman H, Christiaensen L (2005). Child growth, shocks, and food aid in rural Ethiopia. American Journal of
Agricultural Economics 87 (2): 273–88.
Yang J, Qiu H, Huang J, Roelle S (2008). Fighting global food price rises in the developing world: the response of China and Its
effect on domestic and world markets. Agricultural Economics 39: 453-464.
Yu W (2017). How China’s Farm Policy Reforms Could Affect Trade and Markets: A Focus on Grains and Cotton. Geneva:
International Centre for Trade and Sustainable Development (ICTSD).