Food Processing October 2012
69
Industry Comment Food Processing www.imacs.in Page 1 ICRA Management Consulting Services Limited Industry Comment IMaCS Research & Analytics THE INDIAN FOOD PROCESSING INDUSTRY October 2012 www.imacs.in
-
Upload
mathan-kumaran -
Category
Documents
-
view
7 -
download
1
description
Food processing related description
Transcript of Food Processing October 2012

Industry Comment Food Processing
www.imacs.in Page 1
ICRA Management Consulting Services Limited
Ind
us
try C
om
men
t
IMaC
S R
ese
arc
h &
An
aly
tics
THE INDIAN FOOD PROCESSING INDUSTRY
October 2012
www.imacs.in
Industry Comment Food Processing
www.imacs.in Page 2
Contacts:
Swati Jain Senior Research Officer
Vineet Nigam Principal (Research & Analytics)
0120-4515831
Disclaimer
All information contained in this document has been obtained by IMaCS from sources believed
by it to be accurate and reliable. Although reasonable care has been taken to ensure that the
information herein is true, such information is provided ‘as is’ without any warranty of any kind,
and IMaCS in particular, makes no representation or warranty, express or implied, as to the
accuracy, timeliness or completeness of any such information. All information contained herein
must be construed solely as statements of opinion, and IMaCS shall not be liable for any losses
incurred by users from any use of this document or its contents in any manner. Opinions
expressed in this document are not the opinions of our holding company, ICRA Limited (ICRA),
and should not be construed as any indication of credit rating or grading of ICRA for any
instruments that have been issued or are to be issued by any entity.
Industry Comment Food Processing
www.imacs.in Page 3
TABLE OF CONTENTS
SCOPE OF REPORT ..................................................................................................................4
OVERVIEW AND OUTLOOK .....................................................................................................4
EXECUTIVE SUMMARY ...........................................................................................................5
INDUSTRY OVERVIEW ............................................................................................................7
INDUSTRY CHARACTERISTICS................................................................................................ 12 IMPORTANCE TO ECONOMY ............................................................................................................. 12 CYCLICALITY .................................................................................................................................. 14 SENSITIVITY OF INDUSTRY TO GOVERNMENT POLICIES .......................................................................... 16
SUB-SECTORS IN THE FOOD PROCESSING INDUSTRY ............................................................. 21 FRUITS AND VEGETABLES ................................................................................................................. 21 MEAT AND POULTRY ...................................................................................................................... 27 GRAINS AND CEREALS ..................................................................................................................... 29 DAIRY .......................................................................................................................................... 35 FISHERIES...................................................................................................................................... 38 AERATED SOFT DRINKS ................................................................................................................... 42
DEMAND ............................................................................................................................. 44 GROWTH FACTORS ......................................................................................................................... 44 FACTORS CONSTRAINING DEMAND ................................................................................................... 45
COMPETITIVE FORCES .......................................................................................................... 46 EXTENT OF COMPETITION ................................................................................................................ 46 INTERNATIONAL COMPETITIVENESS ................................................................................................... 50 BARRIERS TO ENTRY FOR NEW PLAYERS ............................................................................................. 52 FLUCTUATIONS IN DEMAND-SUPPLY GAP ........................................................................................... 52
GOVERNMENT POLICY GUIDELINES ...................................................................................... 52 FOOD SAFETY AND STANDARD BILL 2005 - FSS ACT, 2006 .................................................................. 52 FOREIGN DIRECT INVESTMENT POLICY ............................................................................................... 53 STATE INITIATIVES .......................................................................................................................... 54 INFRASTRUCTURE DEVELOPMENT IN THE FOOD PROCESSING INDUSTRY ................................................... 55 NATIONAL MISSION ON FOOD PROCESSING (NMFP) ........................................................................... 58
CRITICAL SUCCESS FACTORS ................................................................................................. 59
FINANCIAL PERFORMANCE ................................................................................................... 60 ROCE AND OPERATING MARGINS .................................................................................................... 60 KEY RATIOS ................................................................................................................................... 60 REVIEW OF LATEST FINANCIALS ........................................................................................................ 61
KEY ISSUES IN THE FOOD PROCESSING SECTOR ..................................................................... 62 ISSUES AGAINST ............................................................................................................................. 62 FAVOURABLE FACTORS .................................................................................................................... 63
GROWTH POTENTIAL/OUTLOOK ........................................................................................... 64
ANNEXURE .......................................................................................................................... 67
Industry Comment Food Processing
www.imacs.in 4
SCOPE OF REPORT
This report analyses the various segments of the Indian food processing industry, like fruits and
vegetables, meat and poultry, grains and cereals, dairy, fisheries and aerated soft drinks. It
covers the government policy guidelines governing the sector and the demand and supply
situation at present.
OVERVIEW AND OUTLOOK
At present the Indian food processing industry is considered to be the fifth largest industry in
the country in terms of production, consumption, exports and growth. The industry has been
valued at around USD 156 billion and is expected to increase to USD 250-280 billion by the
year 2016.
The sector is expected to generate an additional employment for about 8.2 million people.
Consumption of food in India is estimated to grow at a CAGR of 5.3% by 2013.
In order to increase the level of processing and to promote the food processing industry in
India and to exploit both the domestic and international market potential for processed food
products, Vision 2015 document has been prepared by the Ministry of Food Processing
Industries, which envisages tripling the size of the processed food sector by increasing the
level of processing of perishables from 6% to 20%, value addition from 20% to 35% and the
share in global food trade from 1.5% to 3% by 2015.
The growth of the Indian food processing industry will be mainly in the States of Andhra
Pradesh, Gujarat, Karnataka, Maharashtra, Uttar Pradesh and Madhya Pradesh.
Twelfth Five Year Plan: The total budgetary requirement for the Twelfth Five Year Plan has
been estimated at Rs. 150.7 billion. This includes Rs. 52.2 billion for the Infrastructure
Development Scheme, Rs. 65 billion for the National Mission on Food Processing (NMFP), Rs.
14.2 billion for the Strengthening of Institutions including Skill Development Programme, Rs.
7.9 billion for the Food Safety, R&D and Promotional Activities, Rs. 1.9 billion for Innovation
Fund Scheme, Rs. 5 billion for the Venture Capital Fund and Rs. 4 billion for the Eleventh Five
Year Plan Commitments. The total financial outlay of Rs. 150.7 billion will have an aggregate
component of around Rs. 103 billion towards providing capital assistance to projects such as
food parks, cold chains, abattoirs, on-farm infrastructure and other food processing units.
Based on the design of the schemes for supporting these projects, the proposed capital
assistance of Rs. 103 billion during the Twelfth Plan, may be able to attract a total investment
of around Rs. 350 billion (as per the Planning Commission’s estimates) in the food processing
sector.
Industry Comment Food Processing
www.imacs.in 5
EXECUTIVE SUMMARY
On a global scale, India ranks first in the production of fresh fruits and pulses and second in rice
paddy and vegetables. Despite being a major food producer, India's share in world food trade is
less than 2%. At present, around 10% of the food items produced in India are processed in
contrast to the developed nations where 60% to 80% of the food items are processed. While the
sector has been growing at about 13%, it is expected that the National Food Processing Policy will
provide the necessary boost to the sector.
In October 2009, government delineated the path to enhancing the economic value of the sector
by methods such as simplifying the tax structure, formulating a National Food Processing Policy
and improving the rural infrastructure. Not only does the sector have potential for exploiting
emerging commercial opportunities, but also, to dramatically enhance rural livelihood
opportunities and employment, bridge the rural-urban divide and improve farming methods and
practices. The tax incidence on food items varies across the country because of the numerous
taxes levied at varying rates. While primary agricultural commodities are mostly exempt from tax,
processed commodities attract heavy taxes including a central sales tax of 3% and value added tax
of 12.5%. Additionally, these products are subject to other state and local level taxes like entry tax
and octroi. Also, the central excise duty is levied on all branded products.
The food processing industry employs about 13 million workers directly and about 35 million
people indirectly. However currently, a major hurdle for development of food processing sector is
prevention of loss due to poor post-harvest management and, inadequate infrastructure and
programmes for processing of agricultural produce.
The key government provisions for developing the industry are as follows:
Most of the processed food items have been exempted from the purview of licensing under the Industries (Development & Regulation) Act, 1951, except items reserved for small-scale sector and alcoholic beverages.
To ensure easy availability of credit, the government included the industry in the list of priority sector for bank lending in 1999.
The National Bank for Agriculture and Rural Development (NABARD) has created a refinancing window with a corpus of Rs. 10 billion, especially, for agro-processing infrastructure and market development.
Automatic approval for foreign equity up to 100% is available for most of the processed food items, excepting alcohol and beer and those reserved for small scale sector subject to certain conditions.
Excise duty on processed fruit and vegetables was brought down from 16% to zero level in the Union Budget, 2001-02.
In the Union Budget, 2004-05, income tax holiday and other concessions announced for certain categories of food processing industries.
In the Union Budget, 2006-07, excise duty has been waived on condensed milk, ice-cream, preparations of meat, fish and poultry, pectins, pasta and yeast. Excise duty on ready to eat packaged foods and instant food mixes, like dosa and idli mixes have been reduced from 16% to 8%. Excise duty on aerated drinks has been reduced from 24% to 16%. The fruit and vegetable processing units are exempt from payment of excise duty.

Industry Comment Food Processing
www.imacs.in 6
In the Union Budget, 2007-08, excise duty has been waived on all kinds of food mixes including instant mixes, soya bari (food supplement) and ready to eat packaged foods and biscuits.
Excise duty on reefer vans (refrigerated motor vehicles) has been reduced from 16% to 8%. Exemption limit on excise duty for small scale industry has been raised from Rs. 10 million to
Rs. 15 million. Customs duty on refrigerated motor vehicles has been waived, while customs duty on food
processing machinery reduced from 7.5% to 5%. Customs duty on sunflower oil (crude) reduced from 65% to 50% and on sunflower oil (refined) reduced from 75% to 60%.
Special additional duty of 4% has been waived in the case of refined edible oil. All services provided by Technology Business Incubators and their incubatees whose annual
business turnovers do not exceed Rs. 5 million have been exempt from the service tax for the first three years.
Under Income Tax Act, a deduction of 100% of profit for five years and 25% of profits for the next five years will be allowed in case of new agro-processing industries set up to process, preserve and package fruits and vegetables.
At present the food processing industry is growing at about 13%, against 6-7% growth rate in
2003-04. The industry received foreign direct investments (FDI) totalling Rs. 8,610 million in 2010-
11 against Rs. 9,537 million in the previous year. The food processing industry received FDI of
about Rs. 8,590 million in FY2012, and total FDI received from FY2001 up to June 2012 was Rs.
67,454 million.
India’s share in exports of processed food in global trade is only 1.5%, whereas the size of the
global processed-food market is estimated at USD 3.2 trillion and nearly 80% of agricultural
products in the developed countries get processed and packaged.
The government’s Vision-2015 action plan, under which specific targets have been set, was
formulated to help the industry achieve higher growth. This includes tripling the size of the food
processing industry, raising the level of processing of perishables from 6% to 20%, increasing value
addition from 20% to 35%, and enhancing India’s share in global food trade from 1.5% to 3%. The
ministry of food processing also plans to set up 350 new food processing units.
The food and grocery market in India is the sixth-largest in the world. Food and grocery retail
contributes to 70% of the total retail sales. According to industry estimates, the segment is
growing at a rate of 104% and is expected to grow to USD 482 billion by 2020. According to a
Business Monitor International (BMI) forecast, India is likely to see a significant 443% increase in
mass grocery retail sales in the period, 2007-12. 99% of this segment is unorganised, and
therefore, there is immense scope for growth for the organised sector. The organised food retail
sector is largely dominated by restaurants, fast food outlets and coffee shops.
Another critical objective for the industry is to achieve international standards of food safety and
quality. This calls for a sustained campaign to educate consumers and promote quality assurance
Industry Comment Food Processing
www.imacs.in 7
in industry, establish world-class food testing laboratories in both the public and private sectors
and harmonise Indian food standards with codex standards1.
Also, the high level of presence of fragmentation in the industry with most of the players are small
and unorganised, poses a special challenge to the development of the industry as a whole. The
small scale sector will require hand-holding to make them profitable and competitive in the world
market. The state governments have an important role to play as a catalyst between bankers,
financial institutions and, technical and management institutions. They could also help establish
industry clusters and identify those requiring up-gradation in terms of latest technology, new
packaging methods and adequate marketing support. While some states have devised specific
policies for the sector, there are many more who can formulate such policies to exploit their
agricultural and processing capabilities to the maximum.
The food processing ministry urges the state governments to implement the Amendments to the Agriculture Produce Marketing Committee (APMC) Act. Also, important would be to implement early, the Goods and Services Tax (GST) while removing subjectivity in treatment and classification of food products. Enforcement food laws by increasing the number of trained inspectors and lab facilities is another area where states can step up their activities. All the more important is for both the central and the state governments to work together.
INDUSTRY OVERVIEW
Food processing is a growing industry of the Indian economy and has been identified as a “sunrise
industry” for development due to its vital linkage between the urban and rural economies. India
has immense potential for production and export of various food items because of sufficient
resources, available markets and a favourable business environment. Moreover, with the
emergence of a market economy, the demand for food items has undergone significant changes
during the last two decades due to increase per-capita income, urbanisation, growing number of
nuclear families versus joint ones, higher employment levels, change in food habits, and
awareness about health and nutrition. The consumption pattern in both rural and urban
households has diversified, over time, towards high value and packaged food products.
Food processing involves any type of value addition to the agricultural produce starting the post
harvest level. The processed food industry provides safe convenience foods to consumers, and
promotes diversification and commercialisation of agriculture by providing effective linkages
between the farmer and consumers in both domestic as well as international markets.
The extent of processing can be categorised as follows:
Primary Processing: cleaning, grading, powdering and refining of agricultural produce,
1 The Codex Alimentarius Commission was created in 1963 by FAO and WHO to develop food standards, guidelines and related texts such as
codes of practice under the Joint FAO/WHO Food Standards Programme. Codex India, the National Codex Contact Point (NCCP) for India, is
located at the Directorate General Of Health Services, Ministry of Health and Family Welfare (MOH&FW), Government of India. It coordinates
and promotes Codex activities in India in association with the National Codex Committee.
Industry Comment Food Processing
www.imacs.in 8
e.g., grinding wheat into flour.
Secondary Processing: basic value addition, e.g., tomato-puree, ground coffee, cleaning
and processing of meat products.
Tertiary Processing: high value addition products like jams, sauces, biscuits and other
bakery products that are ready for consumption at the point of sale.
The industry employs over 13 million workers directly and has a wide scope covering activities
such as agriculture, horticulture, plantation, animal husbandry and fisheries. It also includes other
industries that use agriculture inputs for manufacturing of edible products. The Ministry of Food
Processing Industries (MoFPI), Government of India (GOI), classifies the following under processed
food industry:
Dairy, fruits and vegetables
Grains
Meat and poultry
Fisheries
Consumer foods including packaged foods, beverages and packaged drinking water
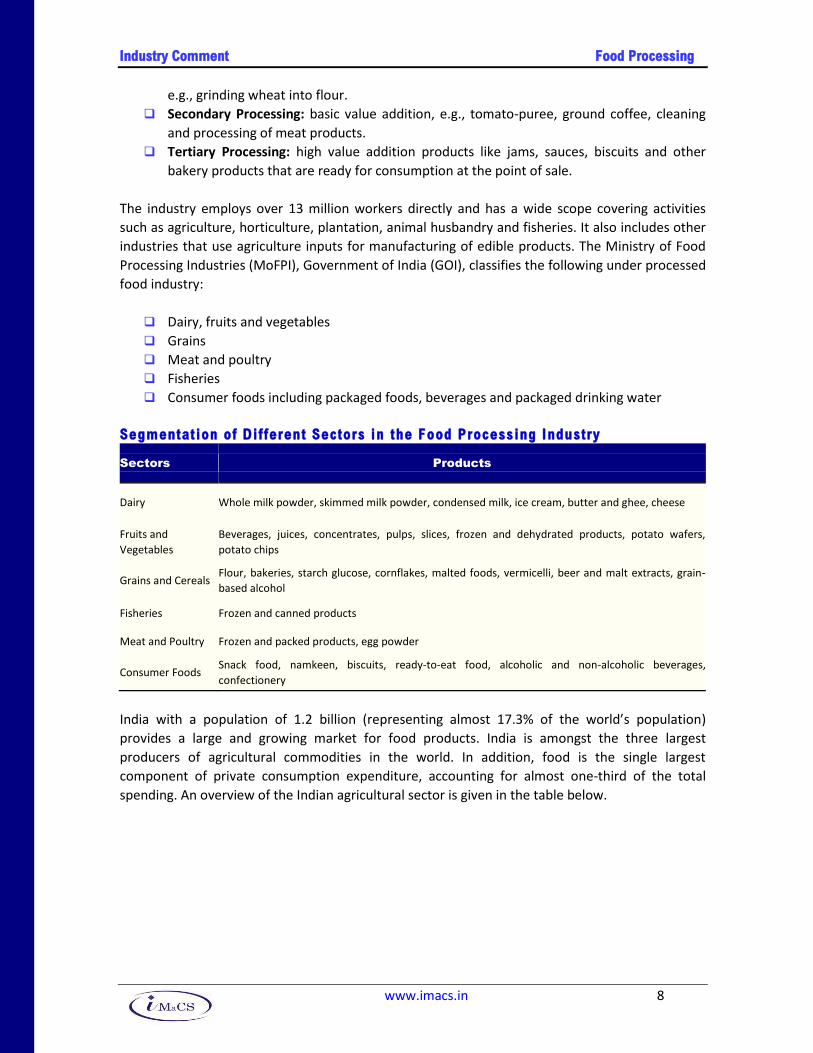
Segmentat ion of Different Sectors in the Food Processing Industry
Sectors Products
Dairy Whole milk powder, skimmed milk powder, condensed milk, ice cream, butter and ghee, cheese
Fruits and
Vegetables
Beverages, juices, concentrates, pulps, slices, frozen and dehydrated products, potato wafers,
potato chips
Grains and Cereals Flour, bakeries, starch glucose, cornflakes, malted foods, vermicelli, beer and malt extracts, grain-
based alcohol
Fisheries Frozen and canned products
Meat and Poultry Frozen and packed products, egg powder
Consumer Foods Snack food, namkeen, biscuits, ready-to-eat food, alcoholic and non-alcoholic beverages,
confectionery
India with a population of 1.2 billion (representing almost 17.3% of the world’s population)
provides a large and growing market for food products. India is amongst the three largest
producers of agricultural commodities in the world. In addition, food is the single largest
component of private consumption expenditure, accounting for almost one-third of the total
spending. An overview of the Indian agricultural sector is given in the table below.
Industry Comment Food Processing
www.imacs.in 9
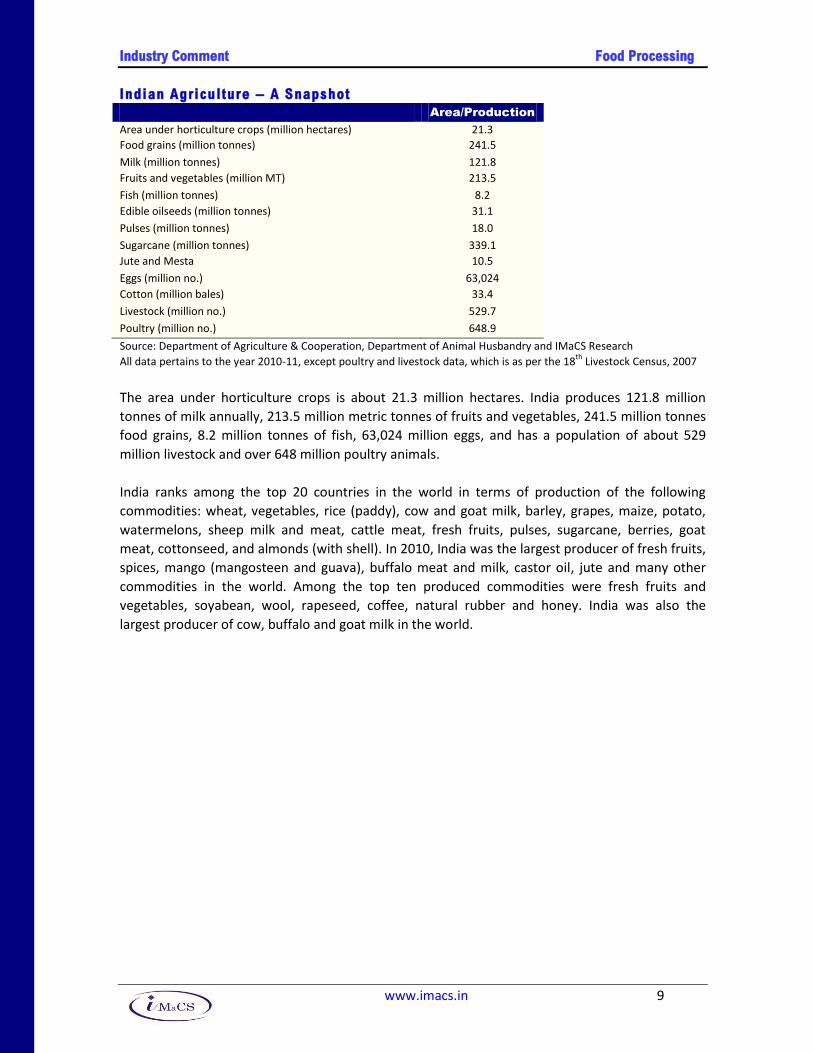
Indian Agriculture – A Snapshot
Area/Production
Area under horticulture crops (million hectares) 21.3
Food grains (million tonnes) 241.5
Milk (million tonnes) 121.8
Fruits and vegetables (million MT) 213.5
Fish (million tonnes) 8.2
Edible oilseeds (million tonnes) 31.1
Pulses (million tonnes) 18.0
Sugarcane (million tonnes) 339.1
Jute and Mesta 10.5
Eggs (million no.) 63,024
Cotton (million bales) 33.4
Livestock (million no.) 529.7
Poultry (million no.) 648.9
Source: Department of Agriculture & Cooperation, Department of Animal Husbandry and IMaCS Research
All data pertains to the year 2010-11, except poultry and livestock data, which is as per the 18th
Livestock Census, 2007
The area under horticulture crops is about 21.3 million hectares. India produces 121.8 million
tonnes of milk annually, 213.5 million metric tonnes of fruits and vegetables, 241.5 million tonnes
food grains, 8.2 million tonnes of fish, 63,024 million eggs, and has a population of about 529
million livestock and over 648 million poultry animals.
India ranks among the top 20 countries in the world in terms of production of the following
commodities: wheat, vegetables, rice (paddy), cow and goat milk, barley, grapes, maize, potato,
watermelons, sheep milk and meat, cattle meat, fresh fruits, pulses, sugarcane, berries, goat
meat, cottonseed, and almonds (with shell). In 2010, India was the largest producer of fresh fruits,
spices, mango (mangosteen and guava), buffalo meat and milk, castor oil, jute and many other
commodities in the world. Among the top ten produced commodities were fresh fruits and
vegetables, soyabean, wool, rapeseed, coffee, natural rubber and honey. India was also the
largest producer of cow, buffalo and goat milk in the world.
Industry Comment Food Processing
www.imacs.in 10
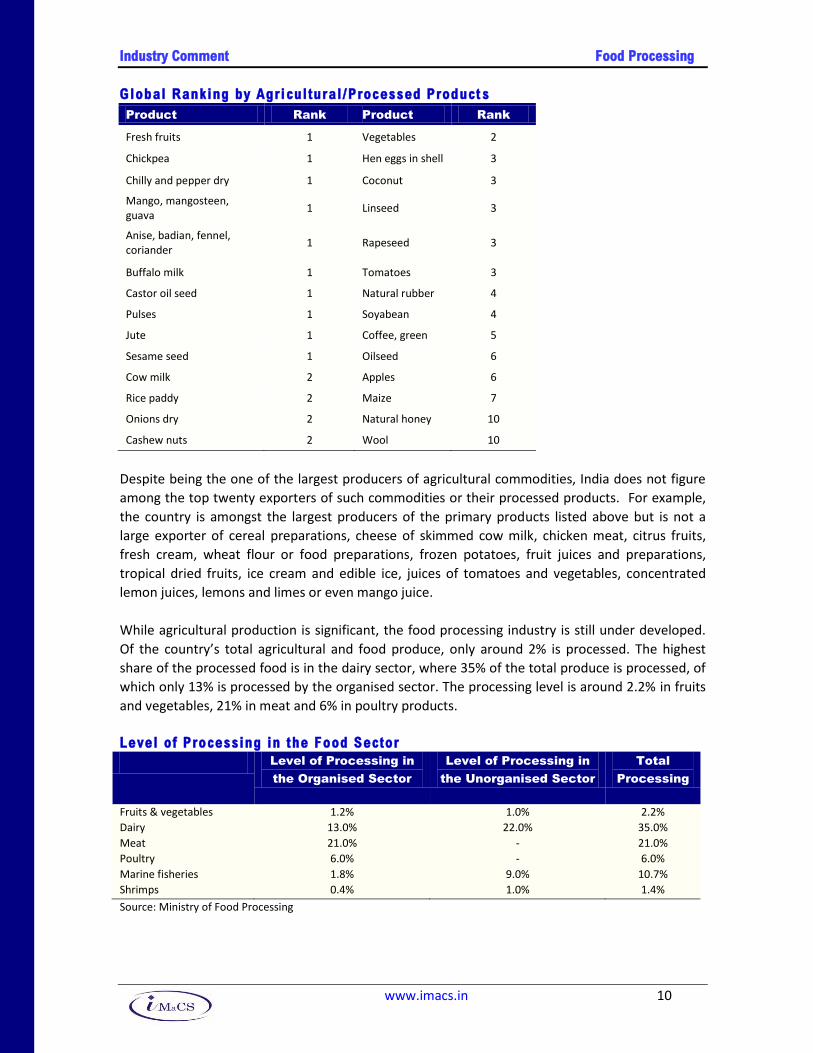
Global Ranking by Agricultural/Processed Product s
Product Rank Product Rank
Fresh fruits 1 Vegetables 2
Chickpea 1 Hen eggs in shell 3
Chilly and pepper dry 1 Coconut 3
Mango, mangosteen, guava
1 Linseed 3
Anise, badian, fennel, coriander
1 Rapeseed 3
Buffalo milk 1 Tomatoes 3
Castor oil seed 1 Natural rubber 4
Pulses 1 Soyabean 4
Jute 1 Coffee, green 5
Sesame seed 1 Oilseed 6
Cow milk 2 Apples 6
Rice paddy 2 Maize 7
Onions dry 2 Natural honey 10
Cashew nuts 2 Wool 10
Despite being the one of the largest producers of agricultural commodities, India does not figure
among the top twenty exporters of such commodities or their processed products. For example,
the country is amongst the largest producers of the primary products listed above but is not a
large exporter of cereal preparations, cheese of skimmed cow milk, chicken meat, citrus fruits,
fresh cream, wheat flour or food preparations, frozen potatoes, fruit juices and preparations,
tropical dried fruits, ice cream and edible ice, juices of tomatoes and vegetables, concentrated
lemon juices, lemons and limes or even mango juice.
While agricultural production is significant, the food processing industry is still under developed.
Of the country’s total agricultural and food produce, only around 2% is processed. The highest
share of the processed food is in the dairy sector, where 35% of the total produce is processed, of
which only 13% is processed by the organised sector. The processing level is around 2.2% in fruits
and vegetables, 21% in meat and 6% in poultry products.
Level of Processing in the Food Sector
Level of Processing in
the Organised Sector
Level of Processing in
the Unorganised Sector
Total
Processing
Fruits & vegetables 1.2% 1.0% 2.2%
Dairy 13.0% 22.0% 35.0%
Meat 21.0% - 21.0%
Poultry 6.0% - 6.0%
Marine fisheries 1.8% 9.0% 10.7%
Shrimps 0.4% 1.0% 1.4%
Source: Ministry of Food Processing

Industry Comment Food Processing
www.imacs.in 11
Processing Level in Frui ts and Vegetables Sector in Various Countries
Country Level of Processing
Malaysia 80%
Philippines 78%
Brazil 70%
USA 65%
Thailand 30%
China 23%
India 2.2%
The processing level in fruits and vegetable segment in India is low at 2.2%, as compared to 80% in
Malaysia and 78% in Philippines. China has about 23% processing in this segment, which is almost
ten times the level of processing in India.
A nation-wise study on quantitative assessment of harvest and post-harvest losses for 46
agricultural produces in 106 randomly selected districts was carried out by Central Institute of
Post-Harvest Engineering and Technology (CIPHET). As per the data and results majority of the
wastage is in the fruits and vegetables and pulses and cereals segment. With adequate processing
facilities, much of this waste can be reduced thus increasing remuneration to the producer as well
as ensuring greater supply to the consumer.
Percentage of Losses Estimated for Major Produces
Crop Cumulative Wastage (%)
Cereals 3.9-6.0%
Pulses 4.3-6.1%
Oil seeds 6.0%
Fruits and Vegetables 5.8-18.0%
Milk 0.8%
Fisheries 2.9%
Meat 2.3%
Poultry 3.7%
Industry Comment Food Processing
www.imacs.in 12
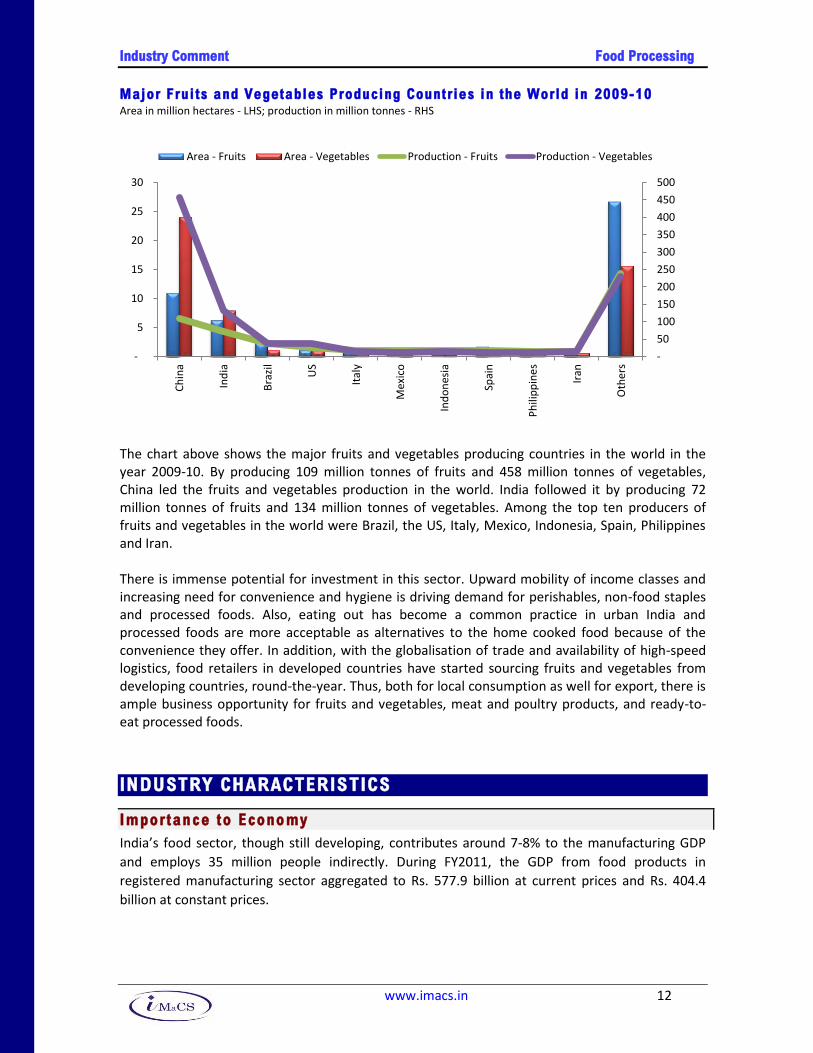
Major Frui ts and Vegetables Producing Countries in the World in 2009-10 Area in million hectares - LHS; production in million tonnes - RHS
The chart above shows the major fruits and vegetables producing countries in the world in the year 2009-10. By producing 109 million tonnes of fruits and 458 million tonnes of vegetables, China led the fruits and vegetables production in the world. India followed it by producing 72 million tonnes of fruits and 134 million tonnes of vegetables. Among the top ten producers of fruits and vegetables in the world were Brazil, the US, Italy, Mexico, Indonesia, Spain, Philippines and Iran. There is immense potential for investment in this sector. Upward mobility of income classes and increasing need for convenience and hygiene is driving demand for perishables, non-food staples and processed foods. Also, eating out has become a common practice in urban India and processed foods are more acceptable as alternatives to the home cooked food because of the convenience they offer. In addition, with the globalisation of trade and availability of high-speed logistics, food retailers in developed countries have started sourcing fruits and vegetables from developing countries, round-the-year. Thus, both for local consumption as well for export, there is ample business opportunity for fruits and vegetables, meat and poultry products, and ready-to-eat processed foods.
INDUSTRY CHARACTERISTICS
Impor tance to Economy
India’s food sector, though still developing, contributes around 7-8% to the manufacturing GDP
and employs 35 million people indirectly. During FY2011, the GDP from food products in
registered manufacturing sector aggregated to Rs. 577.9 billion at current prices and Rs. 404.4
billion at constant prices.
-
50
100
150
200
250
300
350
400
450
500
-
5
10
15
20
25
30C
hin
a
Ind
ia
Bra
zil
US
Ital
y
Mex
ico
Ind
on
esia
Spai
n
Ph
ilip
pin
es
Iran
Oth
ers
Area - Fruits Area - Vegetables Production - Fruits Production - Vegetables
Industry Comment Food Processing
www.imacs.in 13
Besides its contribution to GDP and employment, the food processing industry in India holds
considerable significance because of the linkages and synergies that it promotes between the two
key sectors of the economy – industry and agriculture. Fast growth in the food processing sector
and progressive improvement in the value addition chain are also important for achieving
favourable terms of trade for Indian agriculture both, in the domestic and international markets.
The Gross Bank Credit (GBC) to the food processing industry increased by 14.2% (on a y-o-y basis)
from Rs. 873.2 billon in July 2011 to Rs. 996.9 billion in July 2012. In FY2011 the Private Final
Consumption Expenditure (PFCE) on food and beverage products, aggregated to Rs. 8,683 billion,
accounting for around 28.1% of the total PFCE at constant prices.
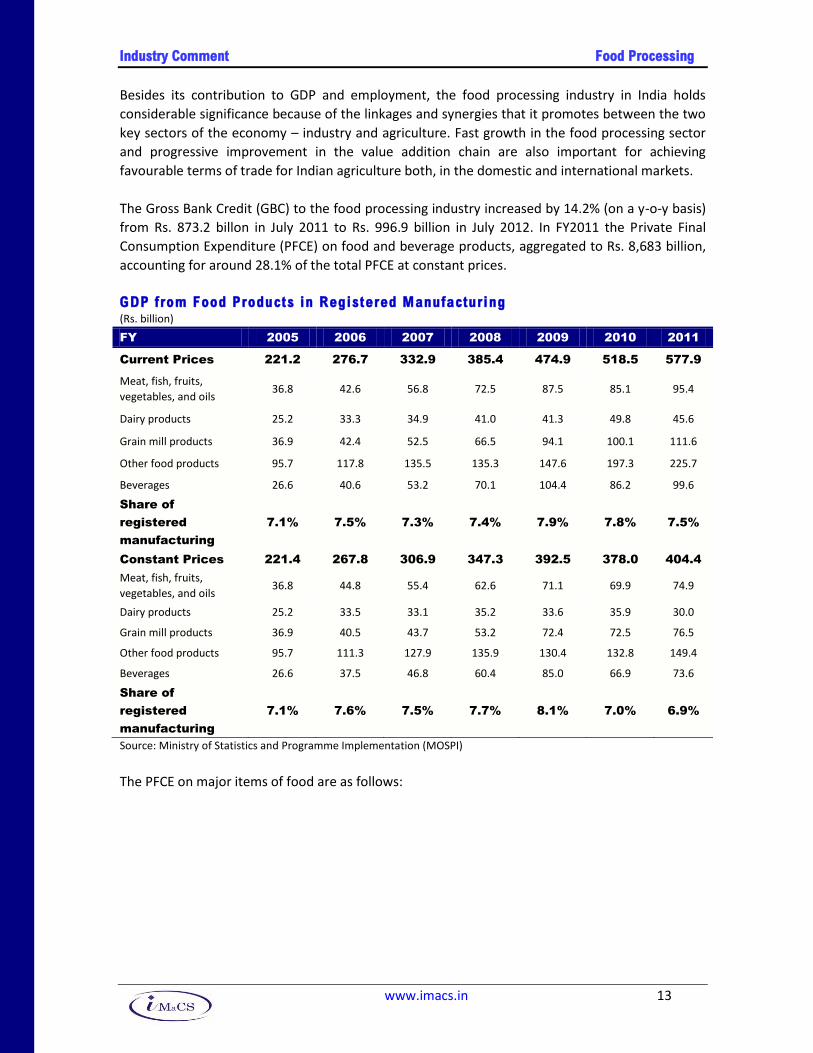
GDP from Food Products in Registered Manufacturing (Rs. billion)
FY 2005 2006 2007 2008 2009 2010 2011
Current Prices 221.2 276.7 332.9 385.4 474.9 518.5 577.9
Meat, fish, fruits,
vegetables, and oils 36.8 42.6 56.8 72.5 87.5 85.1 95.4
Dairy products 25.2 33.3 34.9 41.0 41.3 49.8 45.6
Grain mill products 36.9 42.4 52.5 66.5 94.1 100.1 111.6
Other food products 95.7 117.8 135.5 135.3 147.6 197.3 225.7
Beverages 26.6 40.6 53.2 70.1 104.4 86.2 99.6
Share of
registered
manufacturing
7.1% 7.5% 7.3% 7.4% 7.9% 7.8% 7.5%
Constant Prices 221.4 267.8 306.9 347.3 392.5 378.0 404.4
Meat, fish, fruits,
vegetables, and oils 36.8 44.8 55.4 62.6 71.1 69.9 74.9
Dairy products 25.2 33.5 33.1 35.2 33.6 35.9 30.0
Grain mill products 36.9 40.5 43.7 53.2 72.4 72.5 76.5
Other food products 95.7 111.3 127.9 135.9 130.4 132.8 149.4
Beverages 26.6 37.5 46.8 60.4 85.0 66.9 73.6
Share of
registered
manufacturing
7.1% 7.6% 7.5% 7.7% 8.1% 7.0% 6.9%
Source: Ministry of Statistics and Programme Implementation (MOSPI)
The PFCE on major items of food are as follows:

Industry Comment Food Processing
www.imacs.in 14
PFCE on Major Food Products (At constant prices, Rs. billion)
FY 2005 2006 2007 2008 2009 2010 2011
Cereals & bread 1,655 1,714 1,760 1,856 1,856 1,737 1,881
Pulses 159 163 167 179 181 179 212
Sugar & jaggery 333 335 357 398 396 380 422
Oils & oilseeds 378 364 338 359 368 366 433 Fruits &
vegetables 1,509 1,606 1,721 1,789 1,863 1,892 2,024
Potato & other
tubers 170 178 163 209 156 245 263
Milk & milk
products 1,341 1,421 1,440 1,552 1,689 1,682 1,624
Meat, egg & fish 624 653 694 726 758 788 823 Coffee, tea &
cocoa 62 64 65 64 65 70 64
Spices 182 211 160 168 174 158 154
Other food 91 113 135 131 137 163 180 Beverages, pan
and intoxicants 392 424 462 544 561 531 604
Total 6,896 7,246 7,461 7,975 8,202 8,191 8,683
Share in
Total PFCE
(%)
35.8% 34.7% 32.9% 32.2% 30.9% 28.7% 28.1%
Source: Ministry of Statistics and Programme Implementation (MOSPI)
Cycl ica l i ty
Although the industry is exposed to agricultural and livestock prices on the raw material front,
volume demand tends to be non-cyclical. It may be cyclical in value terms as consumers tend to
switch to lower priced brands during recessionary periods.
Globally, non-fuel commodity prices firmed up during 2007 led by metals and food prices but
declined after mid-2008. Food prices firmed up led by wheat and edible oils on reports of
shortfalls in production and increased demand for non-food uses. After peaking in June-July 2008,
food and beverage prices declined for about a year and showed signs of recovery since April 2010.
In FY2012, the prices declined (on a y-o-y basis) through the year, except in the last quarter where
the average annual increase was 2%.
Industry Comment Food Processing
www.imacs.in 15
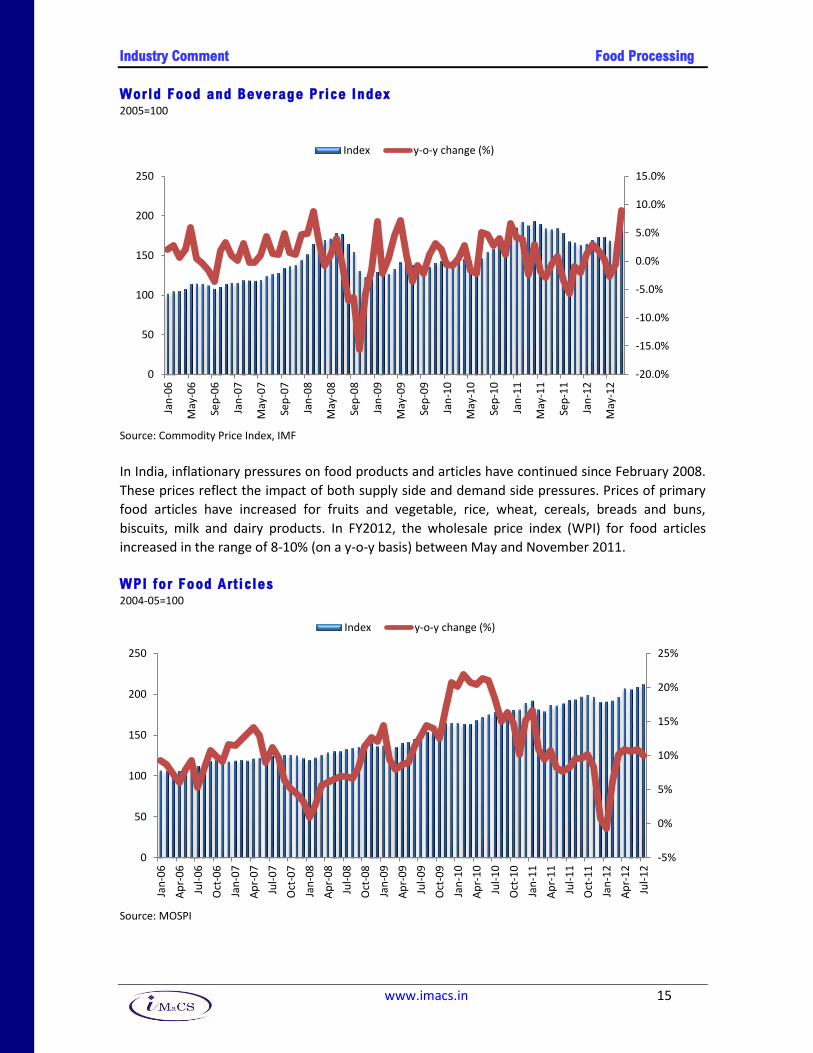
World Food and Beverage Price Index 2005=100
Source: Commodity Price Index, IMF
In India, inflationary pressures on food products and articles have continued since February 2008.
These prices reflect the impact of both supply side and demand side pressures. Prices of primary
food articles have increased for fruits and vegetable, rice, wheat, cereals, breads and buns,
biscuits, milk and dairy products. In FY2012, the wholesale price index (WPI) for food articles
increased in the range of 8-10% (on a y-o-y basis) between May and November 2011.
WPI for Food Articles 2004-05=100
Source: MOSPI
-5%
0%
5%
10%
15%
20%
25%
0
50
100
150
200
250
Jan
-06
Ap
r-0
6
Jul-
06
Oct
-06
Jan
-07
Ap
r-0
7
Jul-
07
Oct
-07
Jan
-08
Ap
r-0
8
Jul-
08
Oct
-08
Jan
-09
Ap
r-0
9
Jul-
09
Oct
-09
Jan
-10
Ap
r-1
0
Jul-
10
Oct
-10
Jan
-11
Ap
r-1
1
Jul-
11
Oct
-11
Jan
-12
Ap
r-1
2
Jul-
12
Index y-o-y change (%)
-20.0%
-15.0%
-10.0%
-5.0%
0.0%
5.0%
10.0%
15.0%
0
50
100
150
200
250Ja
n-0
6
May
-06
Sep
-06
Jan
-07
May
-07
Sep
-07
Jan
-08
May
-08
Sep
-08
Jan
-09
May
-09
Sep
-09
Jan
-10
May
-10
Sep
-10
Jan
-11
May
-11
Sep
-11
Jan
-12
May
-12
Index y-o-y change (%)

Industry Comment Food Processing
www.imacs.in 16
Sens it iv i ty o f Indust ry to Government Po l ic ies
Food processing has been declared a priority sector by the GOI. No industrial license is required
for food processing, except for alcoholic beverages and a few items reserved for the small scale
industries (SSI). Foreign direct investment of 100% is allowed except in alcoholic beverages and
items reserved for the SSI. Agro-based units established in special economic zones and 100% EOUs
are allowed (a) sales up to 50% in domestic tariff area, and (b) import of capital goods and raw
materials at 0% duty. The Government announced a new centrally sponsored scheme, ‘National
Mission on Food Processing’ which will be started in cooperation with the State governments.
Support Available to the Food Processing Industry
Investment linked deduction of capital expenditure incurred in the following businesses is
proposed to be provided at the enhanced rate of 150%, as against the current rate of
100%
• Cold chain facility
• Warehouses for storage of food grains
The following new sectors are proposed to be added for the purposes of investment linked
deduction:
• Bee keeping and production of honey and beeswax
• Container freight station and inland container depots
• Warehousing for storage of sugar
Basic customs duty on Soya protein concentrate and isolated Soya protein has been
reduced from 30% and 15% respectively to 10%. Simultaneously, excise duty on all
processed Soya food products has been reduced to the merit rate of 6%.
The basic customs duty on Probotics has been reduced from 10% to 5%.
National Mission for Protein Supplement - To improve productivity in the dairy sector, a
Rs. 22 billion project is being launched with World Bank assistance. To broaden the scope
of production of fish to coastal aquaculture, apart from fresh water aquaculture, the
outlay in 2012-13 is being stepped up to Rs. 5 billion. Suitable allocations are also being
made for poultry, piggery and goat rearing.
The food processing sector has been growing at an average rate of over 8% over the past
5 years. In order to have a better outreach and to provide more flexibility to suit local
needs, it has been decided that a new centrally sponsored scheme titled “National
Mission on Food Processing” would be started, in cooperation with the State
Governments in 2012-13.
The Government has taken steps to create additional food grain storage capacity in the
country. Creation of 2 million tonnes of storage capacity in the form of modern silos has
already been approved. Nearly 15 million tonnes capacity is being created under the
Private Entrepreneur’s Guarantee Scheme, of which 3 million tonnes of storage capacity
will be added by the end of 2011-12 and 5 million would be added next year.
Basic customs duty has been reduced from 7.5% to 2.5% on:
• Sugarcane planter, root or tuber crop harvesting machine and rotary tiller and weeder.
• Parts for the manufacture of these.
Basic customs duty has been reduced from 7.5% to 5% on:
• Specified coffee plantation and processing machinery.
It is proposed to extend project import benefit to green house and protected cultivation

Industry Comment Food Processing
www.imacs.in 17
for horticulture and floriculture at concessional basic customs duty of 5%.
It has been proposed to reduce basic customs duty on some water soluble fertilisers and
liquid fertilisers, other than urea, from 7.5% to 5% and from 5% to 2.5%.
It has been proposed to extend concessional import duty available for installation of
Mechanised Handling Systems and Pallet Racking Systems in Mandis or warehouses for
horticultural produce.
Food processing identified as an industry with employment potential.
Most of the processed food items exempted from under the Industries (Development & Regulation) Act, 1951, except items reserved for small-scale sector and alcoholic beverages.
Food processing industries with investment up to Rs. 100 million were included in the priority sector list for bank lending in the year 1999.
Automatic approval for foreign equity up to 100% available for most of the processed food items except alcohol and beer, and those reserved for the SSI, subject to certain conditions.
Excise duty on processed fruits and vegetables was brought down from 16% to 0%.
Income tax holiday and other concessions for certain categories of food processing industries.
Income tax deduction on 100% of profit for five years and 25% of profits for the next five years allowed in case of new agro-processing industries set up to process, preserve and package fruits and vegetables.
Exemption limit of excise duty for small scale Industry increased from Rs. 10 million to Rs. 15 million.
Excise duty on biscuits reduced from 8% to 0% whose retail price does not exceed Rs. 100 per kg.
Excise duty reduced from 8% to 0% on all kinds of food mixes including instant mixes.
Soya nuggets (food supplements) and ready to eat packaged foods fully exempt from excise duty.
Excise duty on reefer vans (refrigerated motor vehicles) reduced from 16% to 8%.
Custom duty on food processing machinery reduced from 7.5% to 5%.
Custom duty on sunflower oil (crude) reduced from 65% to 50%.
Duty on sunflower oil (refined) reduced from 75% to 60%.
Special additional duty of 4% waived off on refined edible oil.
Central sales tax reduced from 4% to 3%.
All services provided by Technology Business Incubators exempted from service tax.
Similarly their incubators whose annual business turnover does not exceed Rs. 5 million, exempted from service tax for the first three years.
Customs duty on bacto-fuges from 7.5% to 0%.
Customs duty on ‘mechanical harvester’ for coffee plantation reduced from 7.5% to 5%.
In the interim Union Budget 2009-10, the minimum support price (MSP) for common variety of paddy was increased from Rs. 550 per quintal in 2003-04 to Rs. 900 per quintal for the crop year 2008-09.
For wheat, the increase was from Rs. 630 per quintal in 2003-04 to Rs. 1,080 per quintal for the year 2009.
In the Union Budget, 2009-10, provisions, allocation for Market Development Assistance Scheme for exports was enhanced to Rs. 1,240 million in B.E. 2009-10.
Sun-set clauses for deduction in respect of export profits under sections 10A and 10B of the Income-tax Act was extended by one more year i.e. for the financial year 2010-11.
Businesses to be incentivised by providing investment linked tax exemptions rather than profit linked exemptions. Investment linked tax incentives to be provided, to begin with, to the businesses of setting up and operating ‘cold chain’, warehousing facilities for storing agricultural produce and the business of laying and operating cross country natural gas or crude or petroleum oil pipeline network for distribution on common carrier principle. Under this method, all capital expenditure, other than expenditure on land, goodwill and financial instruments to be fully allowable as deduction.
Excise duty rate on items attracting 4% to be raised to 8% with the exception of specified food items including biscuits, sharbats, cakes and pastries.
In the Union Budget, 2010-11, measures have been announced for improving investment environment by simplifying the FDI regime, clearly defining the methodology for calculation of indirect foreign investment in Indian companies and complete liberalisation of pricing and payment of technology transfer fee and trademark, brand name and royalty payments.
To facilitate reduction in wastage of agricultural produce the government has announced plans to address the
Industry Comment Food Processing
www.imacs.in 18
issue of opening up of retail trade to help bring down the considerable difference between farm gate, wholesale and retail prices.
Deficit in the storage capacity to be met through an ongoing scheme for private sector participation and the Food Corporation of India (FCI) to hire godowns from private parties for a guaranteed period of seven years.
External commercial borrowings (ECB) to be available for cold storage or cold room facility, including for farm level pre-cooling, for preservation or storage of agricultural and allied produce, marine products and meat.
For the micro, small and medium enterprises the allocation increased from Rs. 17.9 billion to Rs. 24 billion for the year 2010-11.
Surcharge of 10% on domestic companies reduced to 7.5%. However, the rate of Minimum Alternate Tax (MAT) increased from the current rate of 15% to 18% of book profits.
Project import status at a concessional customs duty of 5% with full exemption from service tax to the initial setting up and expansion of cold storage, cold room including farm pre-coolers for preservation or storage of agriculture and related sectors produce and processing units for such produce.
Full exemption from customs duty to refrigeration units required for the manufacture of refrigerated vans or trucks.
Concessional customs duty of 5% to specified agricultural machinery not manufactured in India.
Central excise exemption to specified equipment for preservation, storage and processing of agriculture and related sectors and exemption from service tax to the storage and warehousing of their produce and full exemption from excise duty to trailers and semi-trailers used in agriculture.
Exemption on testing and certification of agricultural seeds from service tax.
Transportation by road of cereals, and pulses to be exempted from service tax. Transportation by rail to remain exempt.
To ease the cash flow position for small-scale manufacturers, they would be permitted to take full credit of central excise duty paid on capital goods in a single instalment in the year of their receipt. Secondly, they would be permitted to pay central excise duty on a quarterly, rather than monthly, basis.
Recognising the enormous benefits that the food processing industry can bring to agriculture and
job creation, and to consumers, food processing industries were included in the list of priority
sector for bank lending in 1999. Excise duty on processed fruits and vegetables was brought down
from 16% to 0% in the Union Budget for 2001-02. The Union Budget for 2004-05 announced
income tax holiday and other concessions for certain categories of food processing industries. The
Union Budget, 2006-07, proposed to set up the National Institute of Food Technology
Entrepreneurship and Management (NIFTEM). The Budget also reduced customs duty on
packaging machines from 15% to 5%. Further, excise duty is now fully exempt on condensed milk,
ice cream, preparations of meat, fish and poultry, pectins, pasta and yeast. Excise duty on ready-
to-eat packaged foods and instant food mixes, like dosa and idli mixes, was reduced from 16% to
8%. While customs duty cut on packaging machines and priority sector financing is likely to ease
setting up of new projects and expansions, reduction in excise duty is likely to reduce costs and
increase competitiveness, especially of the organised sector.
The Union Budget, 2007-08, exempted additional duty of customs of 4% on all edible oils – crude
and refined; reduced customs duty on food processing machinery from 7.5% to 5%; provided for
concessional customs duty rate of 5% and zero countervailing duty(CVD)/excise duty presently
available to specified plantation machinery up to April 2007, to be extended up to April 2009;
reduced customs duty on crude sunflower oil from 65% to 50% and on refined sunflower oil from
75% to 60%; fully exempted excise duty on packed biscuits of maximum retail sale price (MRP),
not exceeding, Rs. 50 per kg; and increased excise exemption limit for SSI scheme from Rs. 10
million to Rs. 15 million.
Industry Comment Food Processing
www.imacs.in 19
The Union Budget, 2008-09, reduced customs duty on bacto-fuges from 7.5% to zero, helpful for
the dairy industry in increasing product shelf life. It also proposed the setting up of a special
purpose tea fund for re-plantation and rejuvenation of Rs. 400 million in 2008-09. Similar support
proposed for cardamom, rubber and coffee. It also proposed a crop insurance scheme for tea,
rubber, tobacco, chilli, ginger, turmeric, pepper and cardamom. The budget provided an outlay of
Rs. 11 billion in 2008-09, to the national horticulture mission, covering 340 districts in 18 states
and two union territories.
In the Union Budget, 2009-10, the concessional customs duty of 5% on specified machinery for
tea, coffee and rubber plantations was reintroduced for one year, i.e., up to July 2010. Customs
duty on ‘mechanical harvester’ for coffee plantation was reduced from 7.5% to 5%.
In the Union Budget, 2011-12, storage capacity of 2 million metric tonnes under the Public
Entrepreneurs Guarantee (PEG) Scheme will be created through modern silos. The government is
expecting to add 4 million metric tonnes by March 2012. During 2010-11, 2.4 million metric
tonnes of storage capacity has been created under the Rural Godown Scheme. The target of credit
flow to farmers has been raised from Rs. 3,750 billion in 2010-11 to Rs. 4,750 billion in 2011-12.
The National Mission for Protein Supplements has being launched in 2011-12 with an allocation of
Rs. 3 billion. It will take up activities to promote animal based protein production through
livestock development, dairy farming, piggery, goat rearing and fisheries in selected blocks.
During the Eleventh Five-Year Plan period (2007-12), the food processing ministry proposed to
launch a revamped infrastructure scheme to promote setting up of Mega Food Parks (MFP), cold
chains, value-added and packaging centres. A park would be a well-defined agri-horticulture
processing zone containing state of the art processing facilities with support infrastructure and
well established supply chain. The primary objective of the proposed scheme is to facilitate
establishment of an integrated value chain.
Investment in cold storage projects is now gaining momentum. In total 49 projects/units have
been approved. During 2011-12 (up to December 2011), the Ministry has released grants in aid of
Rs. 440 million to 14 integrated cold chain projects in the country. The 10 projects approved
during 2008-09, and 39 proposals approved during 2011-12 will add 232,628 MT of cold chain,
CA/MA, deep freezer capacity, 234 reefer carriers and 24 MT per hour of IQF capacity. So far a
capacity of 25,705 MT of cold chain, CA/MA, deep freezer, 29 reefer carriers and 1.5 MT per hour
of IQF capacity has already been created. To attract investment in this sector, henceforth, capital
investment in the creation of modern storage capacity will be eligible for viability gap funding
scheme of the Finance Ministry. It is also proposed to recognise cold chains and post-harvest
storage as an infrastructure sub-sector.
During FY2009, setting up of 9 new abattoirs had been approved and 1 new abattoir was
approved during the year FY2011. Grants-in-aid amounting to Rs. 372 million have been
disbursed. Till now two of the abattoirs have been completed which are located at Dimapur
(Nagaland) and Ahmednagar (Maharashtra).
In the Mega Food Park scheme, the emphasis would be on building strong linkages with
agriculture and horticulture, enhancing project implementation capabilities, increasing private

Industry Comment Food Processing
www.imacs.in 20
sector investment, and supporting the creation of rural infrastructure for steady supply of good
quality agri-horticulture produce. It would provide a mechanism to bring farmers, processors and
retailers together and link agricultural production to the market, ensure maximum value addition,
minimise wastage and improve farmers' income. Project implementation would be assisted by
professional project management agencies from concept to commissioning. During the financial
year 2011-12, Ministry released grant-in-aid of Rs.450 million (up to December 2011) to 10
ongoing Mega Food Park projects approved during the first phase.
The Ministry (MoFPI) has also prepared a Vision-2015, document for putting down a strategy and
action plan on giving boost to growth in the food processing sector for generation of income,
employment and foreign exchange. The Cabinet approved the integrated strategy in June 2007,
based on the recommendations made by a group of designated ministers. The objective is to
transition from a supply driven to a demand driven market by reducing costs, improving safety
standards, developing markets, creating efficient supply chains, introduce technology, and
promote synergies between the really big and relatively smaller players for generation of
employment and export revenues.
The targets are to increase processing of perishable items of food from 6% to 20%, value addition
from 20% to 35%, and share in global food trade from 1.6% to 3%. Specifically, the level of
processing for fruits and vegetables is targeted to increase, significantly, from 2.2% to 15% by
2015. To achieve these, the vision document proposes to provide a single window approach to all
stake-holders. Specific policy thrust is proposed for increase in cost effective raw materials,
greater infrastructure development, smoother credit availability, greater use of technology in
existing processing units, modern marketing and retail methods, rationalised taxation, modern
integrated food law for food safety and testing, market creation and intelligence, and special
attention to the SSI sector.
The Ministry’s scheme for Cold-chain, Value addition and Preservation Infrastructure aims to
provide integrated cold chain and preservation infrastructure facilities without a break from farm
gate to the consumer. The objective is to link the producers to the processors and market through
well-equipped cold chain infrastructure. The scheme will include:
Minimal Processing Centre at farm level for weighing, sorting, packing, pre-cooling,
Controlled Atmosphere (CA)/Modified Atmosphere (MA) cold storage, etc
Mobile pre cooling vans and reefer trucks
Irradiation facility
Distribution hubs with multi product and CA/MA chambers, packing facility etc.

Industry Comment Food Processing
www.imacs.in 21
Focus Sector In October 2009, the Prime Minister of India stressed on the need for developing the huge potential that the
country’s nascent food processing industry presents. He reiterated that the food processing ministry is in the process
of formulating a national policy on food processing, which will be comprehensive and adopt a number of legislative,
administrative, and promotional measures. He said that the policy should evolve through discussions with the states
and industry both in the public and private sector. It should promote the development of viable agri-business and
agro-industry models based on different agro-climates and regions of this vast country. Its aim must be institutional
strengthening and capacity building across the value chain.
The policy should seek to promote innovation and technological development. Improved technologies to prolong the
shelf life of vegetables and fruits, better packaging machinery and cold storage systems are just some of the areas
where more work is needed. The Central Food Technology Research Institute should play a more central and pro-
active role in promoting the knowledge base of the industry through greater public private partnerships in technology
development.
According to the Prime Minister, the research and development base of the industry also needs considerable
strengthening. While basic agricultural research has a very strong and large institutional network in the country, there
is inadequate focus on the food processing sector. He urged the agricultural universities, premier technological
institutes and the private sector to actively undertake collaborative strategic research in this important sector. He
also called for an initiative on international collaborations in this field.
SUB-SECTORS IN THE FOOD PROCESSING INDUSTRY
Fru i ts and Vegetables
The diverse agro-climatic zones make it possible to grow almost all varieties of fresh fruits and
green vegetables in India. The fruits and vegetables segment includes beverages, juices,
concentrates, pulps, and slices, frozen and dehydrated products, and potato wafers/chips among
others.
Fruits
India produced 75.8 million metric tonnes of fruits in 2010-11 and the five year Compound Annual
Growth Rate (CAGR) was 6.5%. India accounted for 12.3% of the total production of fruits in the
world in 2009-10. While there are almost 180 families of fruits that are grown all over the world,
citrus fruits constitute around 20% of total global fruit production. The fruits are processed into
various products such as fruit juices & concentrates, canned fruit, dehydrated fruit, jams and
jellies, etc. International trade in processed fruit products is around USD 9,200 million.
Although India is among the largest producers of fruits in the world, the production per capita is
only about 100 grams per day. However, it is estimated that around 20-22% of the total
production of fruits is lost due to spoilage at various post harvest stages. Thus the per capita
availability of fruits is further reduced to around 80 grams per day, which is almost half the
requirement for a balanced diet.
The fruit production in India has recorded a growth rate of 7%, whereas the fruit-processing
sector has grown at about 20% per annum. However, the growth rates have been extensively
higher for frozen fruits and vegetables and dehydrated fruits and vegetables. There exist over
4,000 fruit processing units in India with an aggregate capacity of more than 1.2 million MT (about

Industry Comment Food Processing
www.imacs.in 22
2% of total fruits produced). It is estimated that around 20% of the production of processed fruits
is meant for exports, the rest caters to the defence, institutional and household sectors.
Manual harvesting is widely practiced for fruits due to abundant supply of surplus agricultural
labour. Fresh fruits are mostly harvested by hand or hand tools, sorting and grading of fruits are
done on a very limited scale and that too are based on visual inspection only. Limited pre-cooling
facilities are available for grapes, strawberries, etc., only in the exports sector. Consequently,
Indian farmers are averse to growing fruits as it requires high initial investment and long gestation
period. Poor quality of seeds and other planting material available affect the yield of fruits and
thereby provide returns to the farmers. For low educational level coupled with poor technical
training/extension facilities available to the farmers, adoption of new technologies has always
been a problem area. These factors result in non-uniform quality of fruits processed in India.
The following table shows the major Tropical, Sub-Tropical, and Temperate fruits grown in India.
Major Frui ts Grown in India
Category Major Fruits
Tropical Mango, Banana, Pineapple, Citrus and Grapes
Sub-Tropical Papaya, Guava, Litchi, Pomegranate
Temperate Apple, Strawberry, Peach, Plum
Vegetables
India is the second largest producer of vegetables in the world after China. It accounted for 13.7%
of the world’s production of fresh vegetables in 2009-10. At a production level of over 137 million
metric tonnes and the total area under vegetable cultivation is around 8 million hectares which is
about 3.5% of the total area under cultivation in the country and around 38% of the area under
horticulture crops.
In India, less than 2% of the total vegetables produced in the country are commercially processed
as compared to 80% in Malaysia and 70% in Brazil. India exported 826 million kilograms of
processed fruits and vegetables at Rs. 34 billion in 2010-11. Exports of dried and preserved
vegetables were 110,173 metric tonnes, which were valued at Rs. 5,169 million in 2010-11. Onions
account for about 65% (in volume) of the total export of fresh fruits and vegetables from India.
The other major items of export are Potato, Tomato, Brinjal, Beans, Carrots, Chillies, Capsicum etc.
The major export markets are Gulf Countries, UK, Sri Lanka, Malaysia and Singapore. Though India
ranks second in the vegetable production in the world, the average yield for various vegetables
are low compared to those experienced in other countries of the world.
Land ceiling has been a major deterrent for large-scale cultivation of fruits and vegetables
especially in the organized sector. The small captive orchards are insufficient to meet the
requirements of the fruit processing industry. In case of vegetables, potato, tomato, onion,
cabbage and cauliflower account for around 60% of the total vegetable production in the country.
Vegetables are typically grown in India in field conditions as opposed to the cultivation of
vegetables in green houses as practiced in developed countries for high yields. The vegetables
sector also suffers from lack of availability of good quality planting material and low use of hybrid
Industry Comment Food Processing
www.imacs.in 23
seeds. Poor farm management and manual harvesting practices also apply to the vegetables
cultivation.
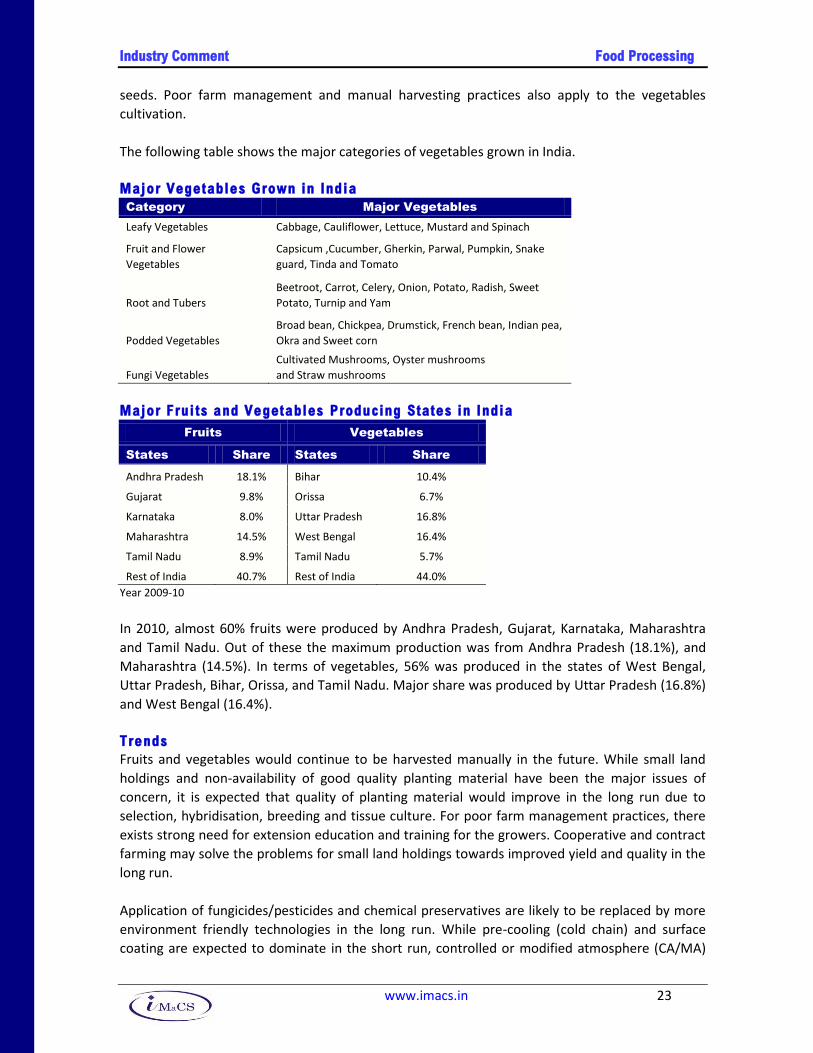
The following table shows the major categories of vegetables grown in India.
Major Vegetables Grown in India
Category Major Vegetables
Leafy Vegetables Cabbage, Cauliflower, Lettuce, Mustard and Spinach
Fruit and Flower
Vegetables
Capsicum ,Cucumber, Gherkin, Parwal, Pumpkin, Snake
guard, Tinda and Tomato
Root and Tubers
Beetroot, Carrot, Celery, Onion, Potato, Radish, Sweet
Potato, Turnip and Yam
Podded Vegetables
Broad bean, Chickpea, Drumstick, French bean, Indian pea,
Okra and Sweet corn
Fungi Vegetables
Cultivated Mushrooms, Oyster mushrooms
and Straw mushrooms
Major Frui ts and Vegetables Producing States in India
Fruits Vegetables
States Share States Share
Andhra Pradesh 18.1% Bihar 10.4%
Gujarat 9.8% Orissa 6.7%
Karnataka 8.0% Uttar Pradesh 16.8%
Maharashtra 14.5% West Bengal 16.4%
Tamil Nadu 8.9% Tamil Nadu 5.7%
Rest of India 40.7% Rest of India 44.0%
Year 2009-10
In 2010, almost 60% fruits were produced by Andhra Pradesh, Gujarat, Karnataka, Maharashtra
and Tamil Nadu. Out of these the maximum production was from Andhra Pradesh (18.1%), and
Maharashtra (14.5%). In terms of vegetables, 56% was produced in the states of West Bengal,
Uttar Pradesh, Bihar, Orissa, and Tamil Nadu. Major share was produced by Uttar Pradesh (16.8%)
and West Bengal (16.4%).
Trends
Fruits and vegetables would continue to be harvested manually in the future. While small land
holdings and non-availability of good quality planting material have been the major issues of
concern, it is expected that quality of planting material would improve in the long run due to
selection, hybridisation, breeding and tissue culture. For poor farm management practices, there
exists strong need for extension education and training for the growers. Cooperative and contract
farming may solve the problems for small land holdings towards improved yield and quality in the
long run.
Application of fungicides/pesticides and chemical preservatives are likely to be replaced by more
environment friendly technologies in the long run. While pre-cooling (cold chain) and surface
coating are expected to dominate in the short run, controlled or modified atmosphere (CA/MA)

Industry Comment Food Processing
www.imacs.in 24
packaging and irradiation technologies are expected to emerge in the long run for preservation
and extension of shelf life. Also, while marketing of fruits and vegetables is expected to be
dominated by cooperatives and middle men in short term, organised direct sourcing supermarkets
have also emerged and are likely to grow. Dehydrated products, fruit juices, pickles and other
forms of preserves are likely to emerge as popular processed products. Change in consumer taste,
food habits and life style, convenience, nutritional value and purchasing power are the likely
reasons for preference of processed products. While the level of processing is expected to be
around 5-10% in the next 10 years, the volume of processing is expected to increase by 15-20% of
fruits and vegetables in the long term. While the small scale processing units would dominate in
the short term, entry of more large/medium scale units is likely in the long term. The installed
licensed capacity of fruits and vegetables increased from 1.1 million tonnes in 1993 to 2.1 million
tonnes in 2006 and 3 million tonnes in 2009.
The share of sectoral consumption for processed fruits and vegetables in the long term is likely to
be as follows:
Domestic - 30%
Institutions - 40% (including defence)
Exports - 30%
Some of the key points regarding the fruits and vegetables segment are as follows:
There has been a positive growth in ready to serve beverages, fruit juices, pulps,
dehydrated and frozen fruits and vegetable products, tomato products, pickles,
convenience vegetable spice pastes, processed mushrooms and curried vegetables.
In order to promote the processing of fruits and vegetables, in 2004-05, the government
under the Income Tax Act allowed a deduction of 100% of profit for the first five years for
new upcoming fruits and vegetables processing units. As of December 2011 (April 2011-
December 2011), the Ministry has released a grant of Rs. 373.6 million to 220 applicants.
Organised segment accounts for 48% of the processing with major products like juices and
pulp concentrates. The unorganised segment accounting for the rest mainly processes
traditional products like pickles, sauces and squashes.
Growth areas are ready-to-serve beverages, fruit juices and pulps, dehydrated and frozen
fruits and vegetable products, pickles, processed mushrooms and curried vegetables.
Domestic consumption is low compared to the primary processed food in general and
fresh fruits and vegetables in particular due to higher incidence of tax and duties including
that on packaging material, lower capacity utilization, non-adoption of cost effective
technology, high cost of finance, infrastructural constraints and inadequate farmers-
processors linkage leading to dependence upon intermediaries.
About 35% of the total fruits and vegetables valued at Rs. 500 billion are wasted annually
due to poor post harvesting technology and inadequate storage and transportation.

Industry Comment Food Processing
www.imacs.in 25
Key Industry Players – Fruits and Vegetables Processing
Products Key Players in the Organised Sector
Jam HLL, Marico, Mapro, Malas
Pickles Priya Foods, Preveen, Desai Brothers, Cavin Kare, GD Foods
Sauce/ketchup HLL, Nestle, Heinz, GD Foods, Bector Food Specialties
Pulp/concentrate Foods and Inns, BEC, Claen Foods, Jain Irrigation, Usha
International
Juices/fruit drinks Pepsi, Dabur, Parle, Godrej, Mother Dairy
Squashes HLL, Haldiram, Mapro
Ready-to-eat vegetables ITC, MTR, Tasty Bite
Potato chips Pepsi, Haldiram
Cooking paste Dabur, HLL
Trends in Production of Fruits and Vegetables (‘000 MT)
Source: National Horticulture Board; Department of Agriculture & Cooperation, GOI
-10%
-5%
0%
5%
10%
15%
20%
-
20,000
40,000
60,000
80,000
100,000
120,000
140,000
160,000
19
99
-20
00
20
00
-01
20
01
-02
20
02
-03
20
03
-04
20
04
-05
20
05
-06
20
06
-07
20
07
-08
20
08
-09
20
09
-10
20
10
-11
Fruits Vegetables Growth in fruits (%) Growth in vegetables (%)
Industry Comment Food Processing
www.imacs.in 26
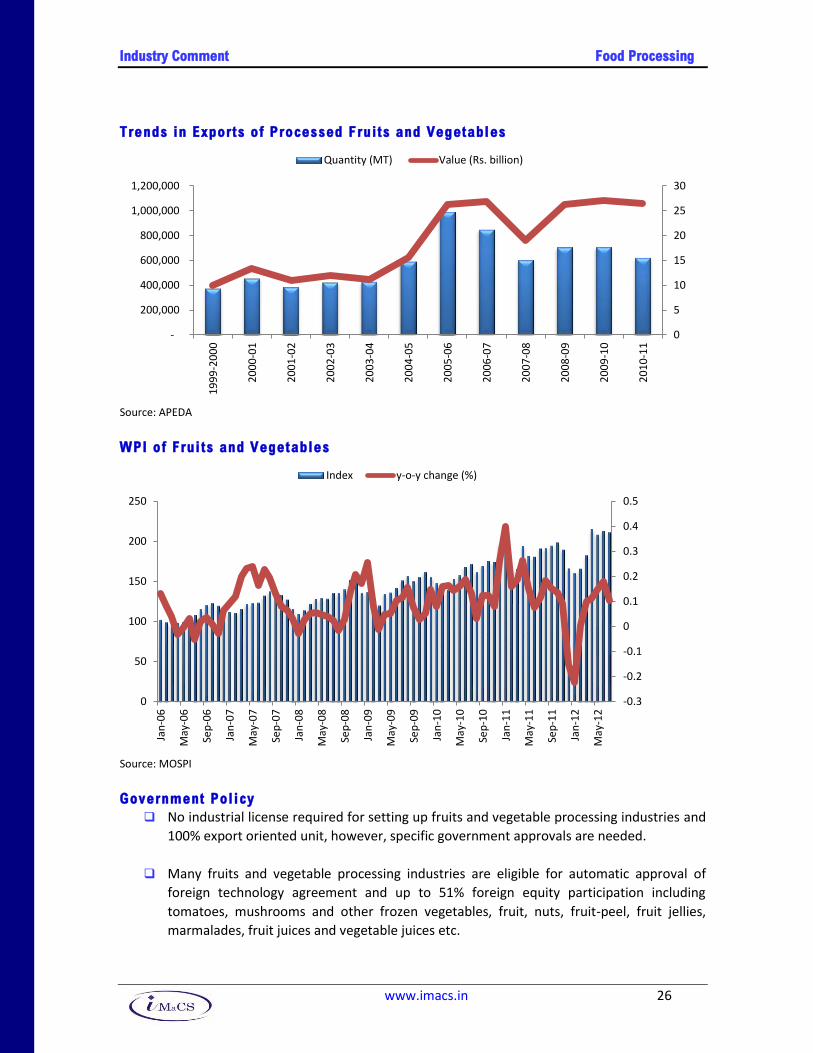
Trends in Exports of Processed Fruits and Vegetables
Source: APEDA
WPI of Frui ts and Vegetables
Source: MOSPI
Government Policy
No industrial license required for setting up fruits and vegetable processing industries and
100% export oriented unit, however, specific government approvals are needed.
Many fruits and vegetable processing industries are eligible for automatic approval of
foreign technology agreement and up to 51% foreign equity participation including
tomatoes, mushrooms and other frozen vegetables, fruit, nuts, fruit-peel, fruit jellies,
marmalades, fruit juices and vegetable juices etc.
0
5
10
15
20
25
30
-
200,000
400,000
600,000
800,000
1,000,000
1,200,000
19
99
-20
00
20
00
-01
20
01
-02
20
02
-03
20
03
-04
20
04
-05
20
05
-06
20
06
-07
20
07
-08
20
08
-09
20
09
-10
20
10
-11
Quantity (MT) Value (Rs. billion)
-0.3
-0.2
-0.1
0
0.1
0.2
0.3
0.4
0.5
0
50
100
150
200
250
Jan
-06
May
-06
Sep
-06
Jan
-07
May
-07
Sep
-07
Jan
-08
May
-08
Sep
-08
Jan
-09
May
-09
Sep
-09
Jan
-10
May
-10
Sep
-10
Jan
-11
May
-11
Sep
-11
Jan
-12
May
-12
Index y-o-y change (%)
Industry Comment Food Processing
www.imacs.in 27
This sector is regulated by the Fruit Products Order, 1955 (FPO), issued under the Essential
Commodities Act. All processing units are required to obtain a license under this order.
Some items like pickles and chutneys, tapioca sago and tapioca flour are reserved for
exclusive manufacture in the small scale sector.
Export of fruit and vegetable products is freely allowed.
Meat and Poult ry
The main features of meat and poultry industry are:
It includes frozen and packed meat mainly in fresh form and egg powder among others.
The total livestock population is 530 million. There are 2,531 registered slaughter houses,
131 government egg hatcheries and, 315 private hatcheries. About 6,038 poultry breeding
farms exist, of which 212 belong to the Animal Husbandry department.
Total milk production was 121.8 million tonnes in FY2011.
Meat production including poultry was 4.9 million tonnes in FY2011.
The level of processing is 21% for buffalo meat, 6% for poultry and 8% for marine
products.
Production was 63 billion eggs in 2010-11. The per capita availability of eggs has increased
from 42 eggs per annum in 2004-05 to 53 eggs per annum in 2010-11. During the year the
highest producer of eggs was Andhra Pradesh with 20.1 billion eggs, followed by Tamil
Nadu with 11.5 billion eggs production.
Most of the production of meat and meat products is in the unorganised sector.
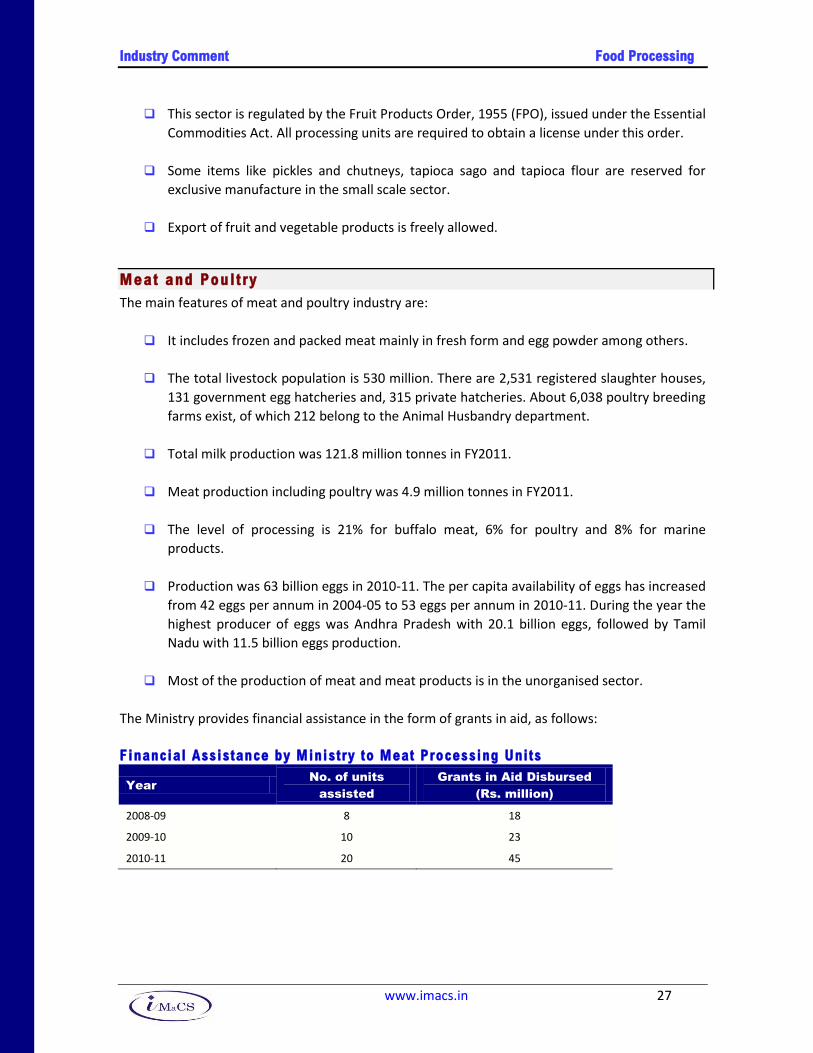
The Ministry provides financial assistance in the form of grants in aid, as follows:
Financial Assistance by Ministry to Meat Processing Units
Year
No. of units
assisted
Grants in Aid Disbursed
(Rs. million)
2008-09 8 18
2009-10 10 23
2010-11 20 45

Industry Comment Food Processing
www.imacs.in 28
WPI of Meat and Poultry
Source: MOSPI
In meat and meat processing sector, poultry meat is the fastest growing animal protein segment
in India. India produced about 2,193 thousand tonnes of poultry meat and 402 thousand tonnes of
pig meat in FY2011. Buffalo meat production during FY2011 was 805 thousand tonnes and cattle
meat was 211 thousand tonnes. Mutton and lamb was relatively small segment where demand
exceeded supply, which explains the high prices in domestic market. Total goat meat produced
during the year was 846 thousand tonnes. Per capita consumption has grown from 870 grams in
2000 to about 2 kg at present.
Exports of Processed Meat
Source: APEDA
-30%
-20%
-10%
0%
10%
20%
30%
40%
50%
60%
0
50
100
150
200
250
Jan
-06
Ap
r-0
6
Jul-
06
Oct
-06
Jan
-07
Ap
r-0
7
Jul-
07
Oct
-07
Jan
-08
Ap
r-0
8
Jul-
08
Oct
-08
Jan
-09
Ap
r-0
9
Jul-
09
Oct
-09
Jan
-10
Ap
r-1
0
Jul-
10
Oct
-10
Jan
-11
Ap
r-1
1
Jul-
11
Oct
-11
Jan
-12
Ap
r-1
2
Jul-
12
Mutton Beef & buffalo meat
Poultry chicken y-o-y change (%) in mutton
y-o-y change (%) in beef & buffalo meat y-o-y change (%) in poultry chicken
0
50
100
150
200
250
-
200
400
600
800
1,000
1,200
1,400
1,600
19
98
-99
19
99
-20
00
20
00
-01
20
01
-02
20
02
-03
20
03
-04
20
04
-05
20
05
-06
20
06
-07
20
07
-08
20
08
-09
20
09
-10
20
10
-11
Quantity (MT) Value (Rs. million)
Industry Comment Food Processing
www.imacs.in 29
Indian consumer prefers to buy freshly cut meat from the wet market, rather than processed or
frozen meat. A mere 6% of production of poultry meat is sold in processed form. Of this, only
about 1% undergoes processing into value added products (ready-to-eat/ready-to-cook).
Processing of large animals is largely for the purpose of exports. The total processing capacity in
India is over 1 million metric tonne (MT) per annum, of which 40-50% is utilised.
The exports of processed meat in FY2011, was Rs. 1,366 metric tonnes worth Rs. 210 million, and
it was 716 metric tonnes in FY2010, worth Rs. 95 million. The increase in FY2011 is more than 90%
in terms of quantity and more than 100% in terms of value.
India is one of the largest producers of buffalo meat in the world. Indian buffalo meat is
witnessing strong demand in international markets due to its lean character and near organic
nature. India is the 5th largest exporter of bovine meat in the world. Indian buffalo meat exports
have the potential to grow significantly. Due to emerging health threats of the diseases
communicable to human through meat, the meat consumers are more vigilant towards the
wholesomeness of the meat and demanding meat and poultry products processed in clean and
sanitary environment. In metros and urban areas there are upcoming demands for “convenience
items” such as semi cooked, ready-to-eat, ready-to-cook meat food products.
Government Policy
The Meat Products Control Order, 1973 under the Essential Commodities Act, 1954
regulates the manufacture, quality and sale of all meat products.
A license is required under this order to set up of a factory for producing/processing meat
products.
Permission from the civic bodies/state Government (Department of Animal Husbandry) is
also required before setting up a meat-processing unit integrated with a slaughterhouse.
Export of meat is subjected to pre-shipment inspection and a certificate is required from
State Animal Husbandry Department/Directorate of Marketing and Inspection.
A No Objection Certificate (NOC) has to be obtained from the district administration for
the slaughter of cattle, buffaloes etc. Slaughter of cows is banned in most of the states.
Export of beef is prohibited.
Grains and Cereals
India produces more than 241 million tonnes of food grains every year. All major grains – rice,
wheat, maize, barley and millets like jowar (great millet), bajra (pearl millet) and ragi (finger
millet) are produced in the country. About 15% of the annual production of wheat is converted
into wheat products. There are 10,000 pulse mills in the country with a milling capacity of 14
million tonnes, milling about 75% of annual pulse production of 14.6 million tonnes.

Industry Comment Food Processing
www.imacs.in 30
The country is self sufficient in grain production and is the second largest rice producer in the
world with a 20% global share. Primary milling of rice, wheat and pulses is the most important
activity in food grains processing. Branded rice is becoming popular in both the domestic as well
as the export market. Indian Basmati rice commands a premium in the international market. This
segment thus offers opportunities in marketing of branded grains, as well as grain processing.
Oil Milling Sector
Oil seeds and edible oils have become two essential commodities as India is among the largest
producers of oilseeds in the world. Due to climatic conditions a variety of oilseeds are produced in
the country, like, groundnut, mustard/rapeseed, sesame, safflower oil, linseed and
nigerseed/castor. Soyabean and sunflower have gained importance in recent years and coconut is
a major plantation crop.
India contributes about 6-7% of the world oilseeds production. Export of oil meals, oilseeds and
minor oils has increased from 5 million tonnes in FY2006 to 7.3 million tonnes in FY2007. In terms
of value, the realisation has gone up from Rs. 55.1 billion to Rs. 79.9 million. India accounted for
6.4% of the world oil meal export.
The Ministry of Food Processing Industries provides financial assistance to the edible oil milling
sector under the Scheme of Technology Upgradation/Modernisation/Expansion.
Financial Assistance by Ministry to the Oil Mill ing Sector
FY No. of units assisted
Grants in aid
disbursed (Rs.
million)
2009 8 18.0
2010 10 23.3
2011 20 45.5
2012 (up to December 2011) 89 133.9
Rice, Pulse and Flour Milling Sector
The Ministry provides financial assistance to the rice, pulse and flour milling units. The position of
grants released by MoFPI during FY2008-FY2012 (up to December, 2011) is as follows:
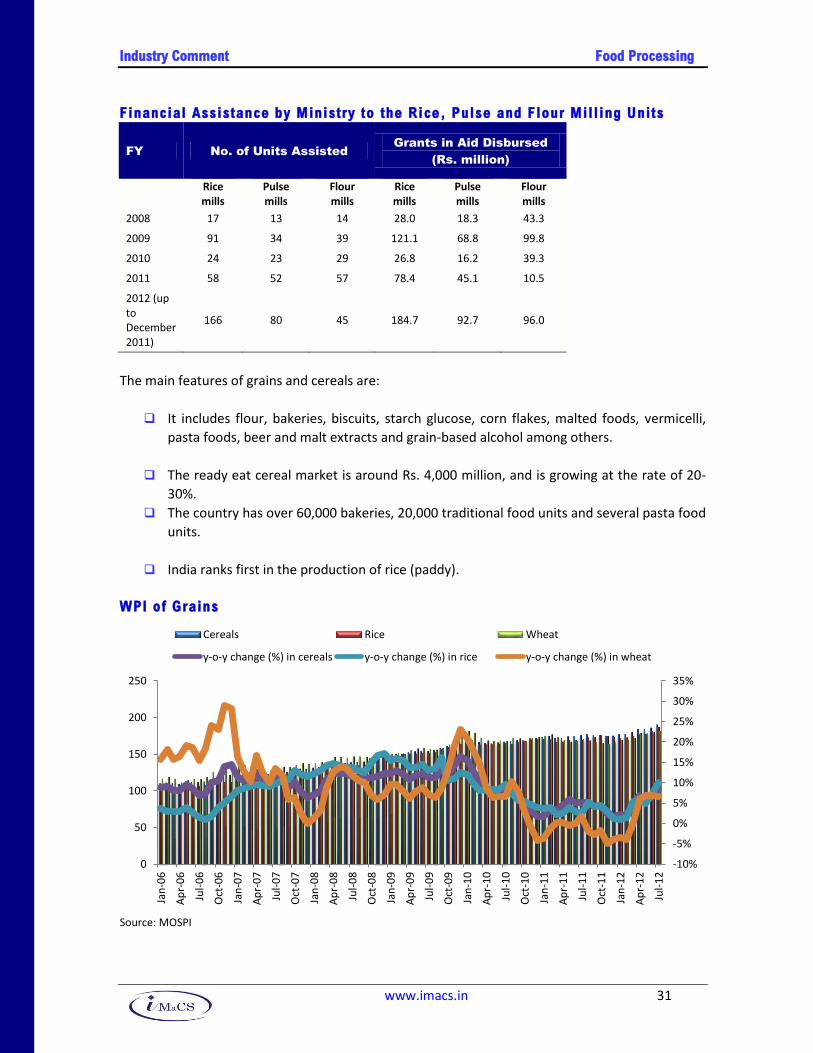
Industry Comment Food Processing
www.imacs.in 31
Financial Assistance by Ministry to the Rice, Pulse and Flour Milling Units
FY No. of Units Assisted
Grants in Aid Disbursed
(Rs. million)
Rice mills
Pulse mills
Flour mills
Rice mills
Pulse mills
Flour mills
2008 17 13 14 28.0 18.3 43.3
2009 91 34 39 121.1 68.8 99.8
2010 24 23 29 26.8 16.2 39.3
2011 58 52 57 78.4 45.1 10.5
2012 (up to December 2011)
166 80 45 184.7 92.7 96.0
The main features of grains and cereals are:
It includes flour, bakeries, biscuits, starch glucose, corn flakes, malted foods, vermicelli,
pasta foods, beer and malt extracts and grain-based alcohol among others.
The ready eat cereal market is around Rs. 4,000 million, and is growing at the rate of 20-
30%.
The country has over 60,000 bakeries, 20,000 traditional food units and several pasta food
units.
India ranks first in the production of rice (paddy).
WPI of Grains
Source: MOSPI
-10%
-5%
0%
5%
10%
15%
20%
25%
30%
35%
0
50
100
150
200
250
Jan
-06
Ap
r-0
6
Jul-
06
Oct
-06
Jan
-07
Ap
r-0
7
Jul-
07
Oct
-07
Jan
-08
Ap
r-0
8
Jul-
08
Oct
-08
Jan
-09
Ap
r-0
9
Jul-
09
Oct
-09
Jan
-10
Ap
r-1
0
Jul-
10
Oct
-10
Jan
-11
Ap
r-1
1
Jul-
11
Oct
-11
Jan
-12
Ap
r-1
2
Jul-
12
Cereals Rice Wheat
y-o-y change (%) in cereals y-o-y change (%) in rice y-o-y change (%) in wheat

Industry Comment Food Processing
www.imacs.in 32
Government Policy
The Rice Milling Industry (Regulation) Act 1958 and Rice Milling Industry (Regulation and
Licensing) Rules 1959 have been repealed from May 1997.
Rice milling and pulse milling sectors, which were earlier reserved for the small scale
sector, have now been de-reserved.
Since liberalization, there is no license requirement for setting up or capacity expansion of
roller flour-mills. The mills can obtain their wheat supply from any source.
There is no license requirement or price/distribution control on manufacture of wheat
products.
The setting up of 100 % export oriented units requires specific government approval.
The packaging laws and regulations affecting food products are mainly covered under the
Standards of Weights and Measures Act, 1976, and the Standards of Weights and
Measures (Packaged Commodities) Rules, 1977 (SWMA) specifying the quantity and
package labelling regulations for all products.
The Prevention of Food Adulteration Act, 1954, and the Prevention of Food Adulteration
rules, 1955 (PFA) specify food adulteration/contamination norms and permissible
ingredients from consumer health and safety point of view.
The Agmark Rules relate to the quality specifications and needs of certain agricultural
products to be eligible for Agmark certification.
Bakery and Biscuits
The main features of bakery sector are:
Bakery products include bread, biscuits, pastries, cakes, buns, rusks, etc.
Bread and biscuits are a major part of the bakery industry, covering around 80% of the
total bakery products in India.
Manufacture of bread is reserved for the small scale sector.
Out of the total production of bread, 40% is produced in the organised sector and 60% in
the unorganised sector.
India is the second largest manufacturer of biscuits after the US.
Around 70% of the biscuit industry is organised and the remaining 30% is unorganised.

Industry Comment Food Processing
www.imacs.in 33
Per capita consumption of biscuits at 1.8 kg per annum is very low as compared to other
countries.
Penetration of biscuits in urban market is between 75% and 85% and in rural markets is
between 50% and 65%.
The biscuit industry grew at 11% in the last two years.
MoFPI provided financial assistance to the bakery sector under the Scheme of Technology
Upgradation/Modernisation/Expansion. In FY2012 (up to December 2011), Rs. 227.9 million was
provided to 168 units.
Financial Assistance by Ministry to the Bakery Sector
FY No. of units assisted
Grants in aid
disbursed (Rs.
million)
2008 156 320.5
2009 112 183.7
2010 145 224.7
2011 (up to December 2010) 111 196.7
2012 (up to December 2011) 168 227.9
In FY2011, around 1,615 MT of biscuits were produced, which is a 6.1% increase from FY2010.
Trends in Biscuit Production (‘000 Tonnes)
Source: IMaCS Resources
652
673
621
608
704
780
883
920
945
969
1,071
1,143
1,236
1,252
1,416
1,522
1,615
- 200 400 600 800 1,000 1,200 1,400 1,600 1,800
1994-95
1995-96
1996-97
1997-98
1998-99
1999-2000
2000-01
2001-02
2002-03
2003-04
2004-05
2005-06
2006-07
2007-08
2008-09
2009-10
2010-11
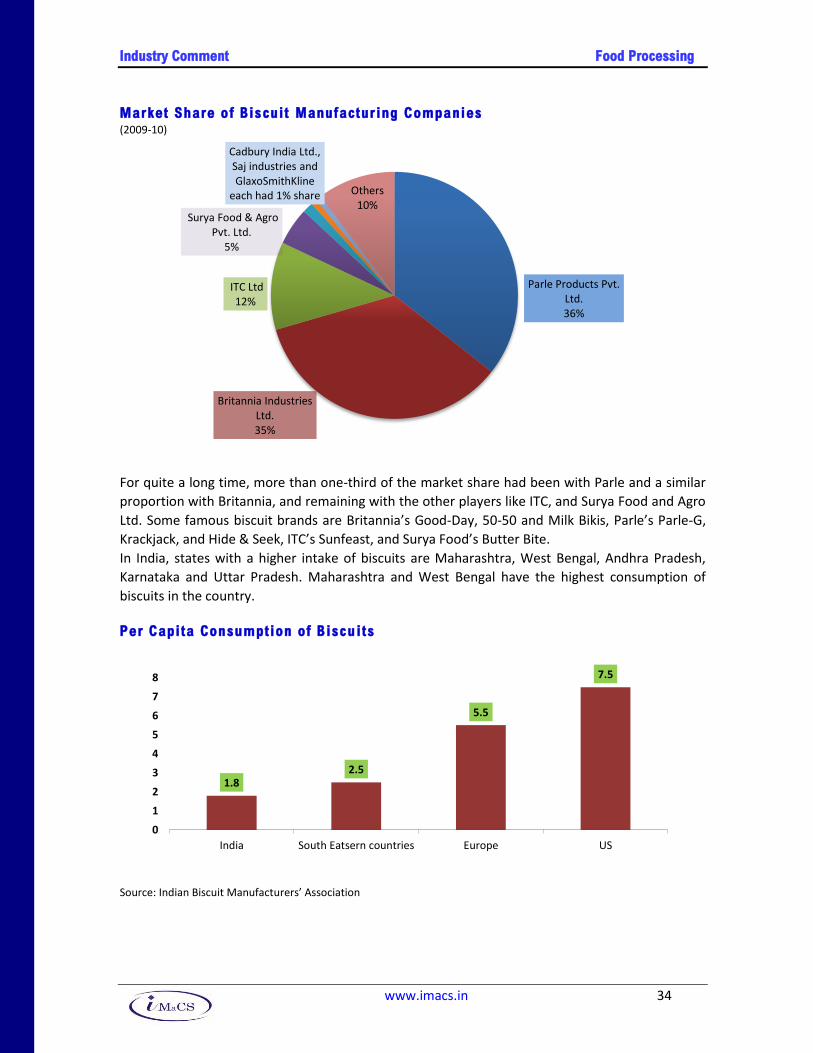
Industry Comment Food Processing
www.imacs.in 34
Market Share of Biscuit Manufactur ing Companies (2009-10)
For quite a long time, more than one-third of the market share had been with Parle and a similar
proportion with Britannia, and remaining with the other players like ITC, and Surya Food and Agro
Ltd. Some famous biscuit brands are Britannia’s Good-Day, 50-50 and Milk Bikis, Parle’s Parle-G,
Krackjack, and Hide & Seek, ITC’s Sunfeast, and Surya Food’s Butter Bite.
In India, states with a higher intake of biscuits are Maharashtra, West Bengal, Andhra Pradesh,
Karnataka and Uttar Pradesh. Maharashtra and West Bengal have the highest consumption of
biscuits in the country.
Per Capita Consumption of Biscu its
Source: Indian Biscuit Manufacturers’ Association
Parle Products Pvt. Ltd. 36%
Britannia Industries Ltd. 35%
ITC Ltd 12%
Surya Food & Agro Pvt. Ltd.
5%
Cadbury India Ltd., Saj industries and GlaxoSmithKline
each had 1% share Others 10%
1.8 2.5
5.5
7.5
0
1
2
3
4
5
6
7
8
India South Eatsern countries Europe US

Industry Comment Food Processing
www.imacs.in 35
WPI of Bakery and Related Products
Source: MOSPI
Dairy
India ranks first in the world in terms of milk production. Milk and milk products account for a
significant 15% of India’s total expenditure on food. World milk production is estimated at around
700 million tonnes. In FY2011, India produced 121.8 million tonnes, which is an increase of about
9% on a y-o-y basis. The per capita availability of milk has increased from 233 grams per day in
2004-05, to 281 grams per day in 2010-11. The share of milk production in 2010-11 by exotic/cross
bred cows, indigenous/non-descript cows and buffaloes and goats, was 29.5 million tonnes, 25.3
million tonnes, 62.3 million tonnes and 4.5 million tonnes respectively. Out of the total milk
produced in FY2011, majority, i.e., 51.2% was buffalo milk, 45.1% was cow milk and the remaining
was goat milk.
India has a unique pattern of production, processing and marketing/consumption of milk, which is
not comparable with any large milk producing country. Approximately 70 million rural households
(primarily, small and marginal farmers and landless labourers) in the country are engaged in milk
production. Over 14 million farmers are organised into about 0.1 million village Dairy Cooperative
Societies (DCS). There are about 110 farmers per DCS. The cumulative milk handled by DCS across
the country is about 18 million kg of milk per day. These cooperatives form part of a national milk
grid which links the milk producers throughout India with consumers in more than 700 towns and
cities bridging the gaps on account of seasonal and regional variations in the availability of milk.
In India current annual growth rate in milk production is pegged between 4-6%. This is primarily
due to the initiatives taken by the Operation flood programmes in the organizing milk producers
into cooperatives; building infrastructure for milk procurement, processing and marketing; and
providing financial, technical and management inputs by the Ministry of Agriculture & Ministry of
-10%
-5%
0%
5%
10%
15%
20%
0
20
40
60
80
100
120
140
160
Jan
-06
Ap
r-0
6
Jul-
06
Oct
-06
Jan
-07
Ap
r-0
7
Jul-
07
Oct
-07
Jan
-08
Ap
r-0
8
Jul-
08
Oct
-08
Jan
-09
Ap
r-0
9
Jul-
09
Oct
-09
Jan
-10
Ap
r-1
0
Jul-
10
Oct
-10
Jan
-11
Ap
r-1
1
Jul-
11
Oct
-11
Jan
-12
Ap
r-1
2
Jul-
12
Biscuit/Cookies Bread & buns
y-o-y change (%) in biscuit/cookies y-o-y change (%) in bread & buns
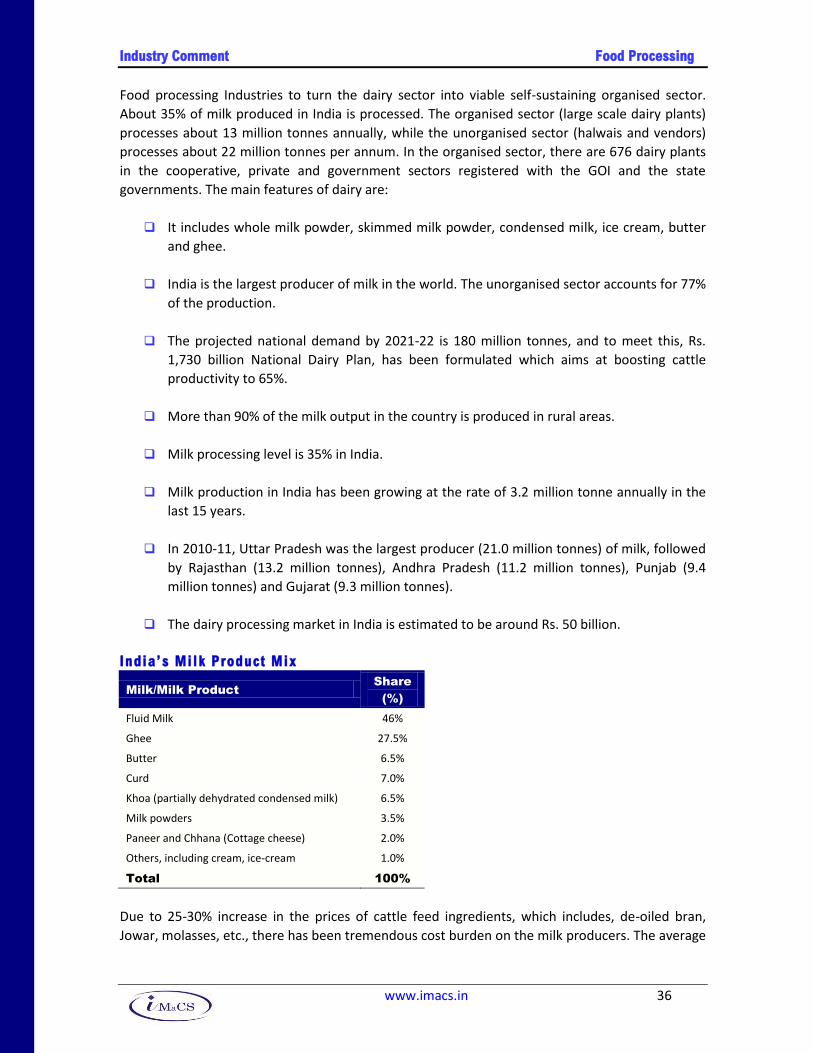
Industry Comment Food Processing
www.imacs.in 36
Food processing Industries to turn the dairy sector into viable self-sustaining organised sector.
About 35% of milk produced in India is processed. The organised sector (large scale dairy plants)
processes about 13 million tonnes annually, while the unorganised sector (halwais and vendors)
processes about 22 million tonnes per annum. In the organised sector, there are 676 dairy plants
in the cooperative, private and government sectors registered with the GOI and the state
governments. The main features of dairy are:
It includes whole milk powder, skimmed milk powder, condensed milk, ice cream, butter
and ghee.
India is the largest producer of milk in the world. The unorganised sector accounts for 77%
of the production.
The projected national demand by 2021-22 is 180 million tonnes, and to meet this, Rs.
1,730 billion National Dairy Plan, has been formulated which aims at boosting cattle
productivity to 65%.
More than 90% of the milk output in the country is produced in rural areas.
Milk processing level is 35% in India.
Milk production in India has been growing at the rate of 3.2 million tonne annually in the
last 15 years.
In 2010-11, Uttar Pradesh was the largest producer (21.0 million tonnes) of milk, followed
by Rajasthan (13.2 million tonnes), Andhra Pradesh (11.2 million tonnes), Punjab (9.4
million tonnes) and Gujarat (9.3 million tonnes).
The dairy processing market in India is estimated to be around Rs. 50 billion.
India’s Milk Product Mix
Milk/Milk Product
Share
(%)
Fluid Milk 46%
Ghee 27.5%
Butter 6.5%
Curd 7.0%
Khoa (partially dehydrated condensed milk) 6.5%
Milk powders 3.5%
Paneer and Chhana (Cottage cheese) 2.0%
Others, including cream, ice-cream 1.0%
Total 100%
Due to 25-30% increase in the prices of cattle feed ingredients, which includes, de-oiled bran,
Jowar, molasses, etc., there has been tremendous cost burden on the milk producers. The average

Industry Comment Food Processing
www.imacs.in 37
price of cattle-feed charged by dairy co-operatives has increased from Rs. 6,600 per metric tonne
(MT) in April 2008 to Rs. 10,000 per MT in March, 2010. This has led to increase in cost of
production of milk and milk products, because dairy farmers are also consumers of these
agricultural commodities.
Governments all across the world keep buffer stocks of milk powders, butter, etc. in order to
support milk producers and check price inflation. These systems are very well established in US
and European countries, but India has this set up only for agricultural commodities like wheat, rice
etc. but not for milk and milk products.
Industry Players – Dairy Products
Products Key Players in the Organised Sector
Packaged milk Mother Dairy, Amul, State cooperatives, Paras Dairy
Ethnic sweets Mother Dairy, Amul, State cooperatives, Haldiram, Bikanerwala
Yogurt Mother Dairy, Amul, Nestle
Cheese Amul, Vijaya, Britannia, Dynamaix Dairy
Ice Cream HLL, Mother Dairy, Vadilal
Butter Amul, Mother Dairy, Vijaya
Ghee Amul, Vijaya, State cooperatives, Paras
Milk powder Amul, Nestle
Trends in Milk Powder Production (‘000 tonnes)
Source: IMaCS Resources
82 86
98 94
133 166
144 129
155 147 147 148
151 162 163
143 134
- 20 40 60 80 100 120 140 160 180
1994-951995-961996-971997-981998-99
1999-20002000-012001-022002-032003-042004-052005-062006-072007-082008-092009-102010-11
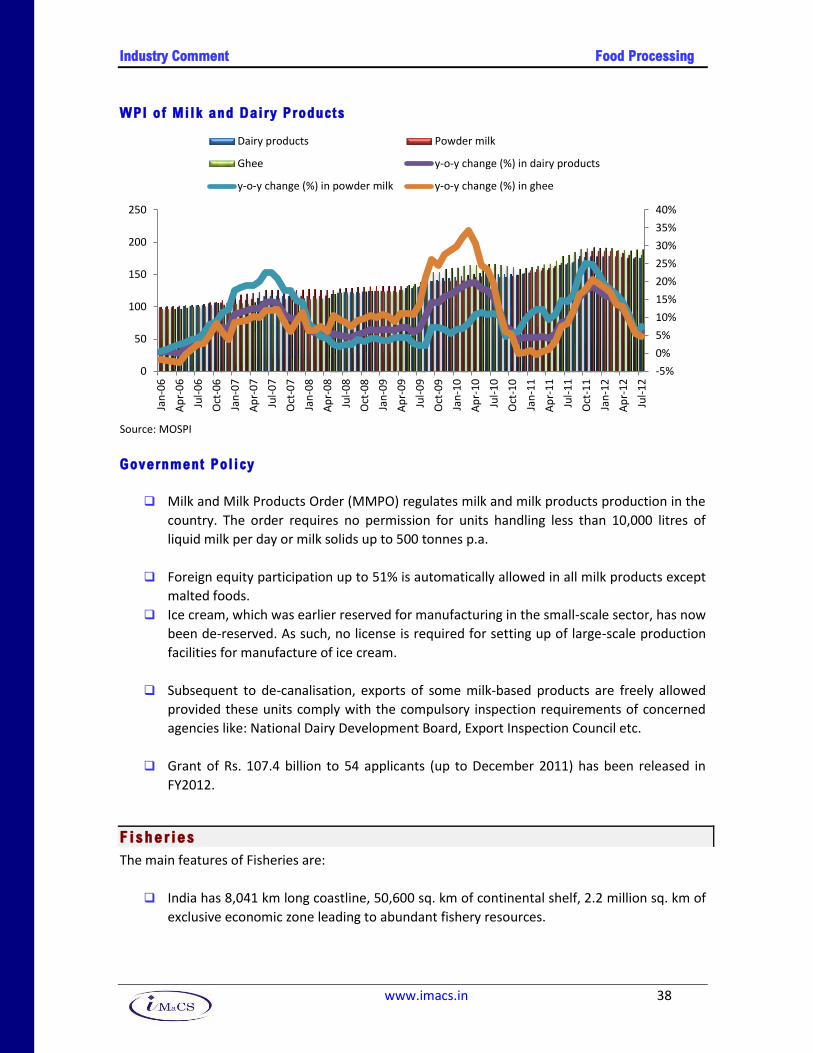
Industry Comment Food Processing
www.imacs.in 38
WPI of Milk and Dairy Products
Source: MOSPI
Government Policy
Milk and Milk Products Order (MMPO) regulates milk and milk products production in the
country. The order requires no permission for units handling less than 10,000 litres of
liquid milk per day or milk solids up to 500 tonnes p.a.
Foreign equity participation up to 51% is automatically allowed in all milk products except
malted foods.
Ice cream, which was earlier reserved for manufacturing in the small-scale sector, has now
been de-reserved. As such, no license is required for setting up of large-scale production
facilities for manufacture of ice cream.
Subsequent to de-canalisation, exports of some milk-based products are freely allowed
provided these units comply with the compulsory inspection requirements of concerned
agencies like: National Dairy Development Board, Export Inspection Council etc.
Grant of Rs. 107.4 billion to 54 applicants (up to December 2011) has been released in
FY2012.
F isher ies
The main features of Fisheries are:
India has 8,041 km long coastline, 50,600 sq. km of continental shelf, 2.2 million sq. km of
exclusive economic zone leading to abundant fishery resources.
-5%
0%
5%
10%
15%
20%
25%
30%
35%
40%
0
50
100
150
200
250
Jan
-06
Ap
r-0
6
Jul-
06
Oct
-06
Jan
-07
Ap
r-0
7
Jul-
07
Oct
-07
Jan
-08
Ap
r-0
8
Jul-
08
Oct
-08
Jan
-09
Ap
r-0
9
Jul-
09
Oct
-09
Jan
-10
Ap
r-1
0
Jul-
10
Oct
-10
Jan
-11
Ap
r-1
1
Jul-
11
Oct
-11
Jan
-12
Ap
r-1
2
Jul-
12
Dairy products Powder milk
Ghee y-o-y change (%) in dairy products
y-o-y change (%) in powder milk y-o-y change (%) in ghee

Industry Comment Food Processing
www.imacs.in 39
India is the 3rd largest fish producer (2nd largest for fresh fish) in the world.
Fisheries sector provides employment to over 9 lakh full time and 11 lakh part time
fishermen.
There are over 402 freezing units with a daily processing capacity of 10,266 tonnes and
499 frozen storages with a capacity of 134,767 tonnes. There are also 12 surimi units, 473
pre-processing centres and 236 other storages.
Processing of fish into canned and frozen forms is carried out almost entirely for the export market.
Trends in Fish Production (‘000 Tonnes)
Source: Department of Agriculture & Cooperation
WPI of Marine and Inland Fish
-
2,000
4,000
6,000
8,000
10,000
12,000
14,000
16,000
18,000
19
94
-95
19
95
-96
19
96
-97
19
97
-98
19
98
-99
19
99
-20
00
20
00
-01
20
01
-02
20
02
-03
20
03
-04
20
04
-05
20
05
-06
20
06
-07
20
07
-08
20
08
-09
20
09
-10
20
10
-11
(P
)
Marine Inland Total
-30%
-20%
-10%
0%
10%
20%
30%
40%
50%
60%
70%
80%
0
50
100
150
200
250
300
Jan
-06
Ap
r-0
6
Jul-
06
Oct
-06
Jan
-07
Ap
r-0
7
Jul-
07
Oct
-07
Jan
-08
Ap
r-0
8
Jul-
08
Oct
-08
Jan
-09
Ap
r-0
9
Jul-
09
Oct
-09
Jan
-10
Ap
r-1
0
Jul-
10
Oct
-10
Jan
-11
Ap
r-1
1
Jul-
11
Oct
-11
Jan
-12
Ap
r-1
2
Jul-
12
Inland Marine y-o-y change (%) in inland fish y-o-y change (%) in marine fish

Industry Comment Food Processing
www.imacs.in 40
Source: MOSPI
Considerable infrastructure facilities for processing of marine products have been developed over
a period of 50 years. Ministry of Food Processing Industries extends financial assistance for setting
up/technology up-gradation/modernization of fish processing units. During the year FY2012 (up to
December 2011), 27 fish processing units have been assisted with a grant of Rs. 57.5 million.
429 Fresh Farmer’s Development Agencies (FFDA) have been established to propagate freshwater
aquaculture in potential states and Union Territories. Due to improved technology of fish farming
and efforts of FFDA, the national average productivity of ponds and tanks covered under the
programme has reached 2,600 Kg per hectare annually.
The following table shows the export quantity and value of processed marine products. In FY2011,
around 813,091 tonnes of processed marine products were exported, which was worth Rs. 129
billion. The increase was 19.8% in quantity terms and 28.4% in terms of value.
Export Quantity and Value of Indian Marine Products
FY Quantity (tonnes)
y-o-y
change
Value
(Rs.
million)
y-o-y
change
2000-01 440,473 28.4% 64,438 25.9%
2001-02 424,470 -3.6% 59,570 -7.6%
2002-03 467,297 10.1% 68.813 15.5%
2003-04 412,017 -11.8% 60,919 -11.4%
2004-05 461,329 12.0% 66,466 9.1%
2005-06 512,164 11.0% 72,453 9.0%
2006-07 612,641 19.6% 83,635 15.4%
2007-08 541,701 -11.6% 76,209 -8.9%
2008-09 602,835 11.3% 86,079 13.0%
2009-10 678,436 12.5% 100,485 16.7%
2010-11 813,091 19.8% 129,014 28.4%
Source: MPEDA
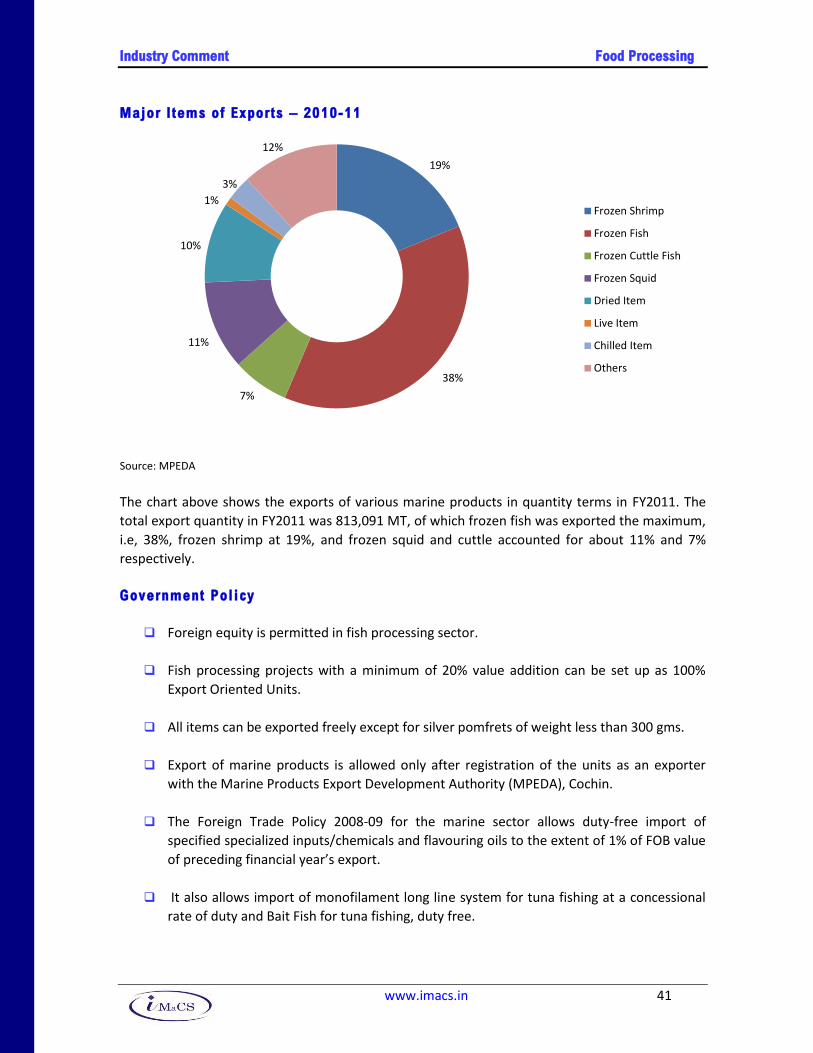
Industry Comment Food Processing
www.imacs.in 41
Major I tems of Exports – 2010-11
Source: MPEDA
The chart above shows the exports of various marine products in quantity terms in FY2011. The
total export quantity in FY2011 was 813,091 MT, of which frozen fish was exported the maximum,
i.e, 38%, frozen shrimp at 19%, and frozen squid and cuttle accounted for about 11% and 7%
respectively.
Government Policy
Foreign equity is permitted in fish processing sector.
Fish processing projects with a minimum of 20% value addition can be set up as 100%
Export Oriented Units.
All items can be exported freely except for silver pomfrets of weight less than 300 gms.
Export of marine products is allowed only after registration of the units as an exporter
with the Marine Products Export Development Authority (MPEDA), Cochin.
The Foreign Trade Policy 2008-09 for the marine sector allows duty-free import of
specified specialized inputs/chemicals and flavouring oils to the extent of 1% of FOB value
of preceding financial year’s export.
It also allows import of monofilament long line system for tuna fishing at a concessional
rate of duty and Bait Fish for tuna fishing, duty free.
19%
38%
7%
11%
10%
1%
3%
12%
Frozen Shrimp
Frozen Fish
Frozen Cuttle Fish
Frozen Squid
Dried Item
Live Item
Chilled Item
Others

Industry Comment Food Processing
www.imacs.in 42
Selected towns producing goods of Rs. 10 billion or more will be notified as towns of
export excellence (TEE) based on potential for growth in exports. For the handloom,
handicraft, agriculture and fisheries sectors, the TEE threshold limit would be Rs. 2.5
billion.
Aerated Sof t Dr inks
The main features of Aerated Soft Drinks are:
It is 3rd largest packaged food industry after tea and biscuits in India.
It provides direct or indirect employment to over 125,000 employees and contributes over
Rs. 12 billion annually to excise duty, sale tax and other related taxes.
It has attracted one of the highest foreign direct investments in the country.
Aerated drinks account for 28% of the non-alcoholic beverage market in India, which is
the second largest in this segment.
Coca Cola and Pepsi Co have been the market leaders and they constitute about 90-95%
of the market share of aerated drinks.
Functional drinks which include, energy, sport, and neutraceutical drinks are also gaining
momentum. The global market size was Rs. 1,815 billion (USD 40 billion) in 2009, and has grown at
9.7% from 2005 to 2009. Energy drinks have a market share of about 58%.
Production of Soft Drinks and Soda
Source: IMaCS Sources
1,500
1,573
1,627
1,406
-14%
5% 3%
-14%
-20%
-15%
-10%
-5%
0%
5%
10%
1,250
1,300
1,350
1,400
1,450
1,500
1,550
1,600
1,650
2007-08 2008-09 2009-10 2010-11
Million bottles y-o-y change (%)

Industry Comment Food Processing
www.imacs.in 43
Soft Drinks Sales – by Volume
Soft Drinks Sales – by Value
The Ministry of Food Processing Industries also supports the alcoholic beverages industry, which
includes alcoholic drinks from non-molasses base and beer including non-alcoholic beer. It
provided financial support for setting up/Modernisation/Expansion of wine and beer units, at 25%
of the total cost of plant and machinery and technical civil work subject to a limit of Rs. 5 million
for general areas and 33.3% of plant and machinery and technical civil work, subject to a limit of
Rs. 7.5 million for difficult areas. In FY2012 (up to December 2011), 12 units were provided Rs. 30
million as assistance.
Bottled water, 61.9%
Carbonated drinks, 29.9%
Concentrates, 0.2%
Fruit/Vegetable Juice, 7.7%
Ready to drink tea, 0.1% Sports and energy
drinks, 0.2%
Bottled water, 33.4%
Carbonated drinks, 48.6%
Concentrates, 1.1%
Fruit/Vegetable Juice, 14.7%
Ready to drink tea, 0.2%
Sports and energy drinks, 1.9%

Industry Comment Food Processing
www.imacs.in 44
Packaged Drinking Water
The main features of Packaged Drinking Water are:
The Indian market size is estimated at Rs. 10,000 million and is growing at 40% per
annum.
218 companies have been granted licence for manufacturing packaged drinking water and
packaged natural mineral water.
80% of the packaged water sale comes from the bulk containers (5 litres and above).
Factors like shortage of drinking water, changes in consumer lifestyles leading to demand
for convenience, and availability of various packaged sizes to suit different needs have led
to a spurt in growth.
The per capita consumption of mineral water in India is 0.5 litres compared to 45 litres in
USA, and 111 litres in Europe.
India has around 200 bottled water brands, 80% of which are local.
Bottled water business can be broadly divided into premium natural mineral water, natural
mineral water, and packaged drinking water. Parle was the first major Indian company to enter
the bottled water market in India with Bisleri, and then came brands like Pepsi, Coca Cola, and
Nestle, Manikchand, and Kingfisher. Premium products like the Qua+ by Narang Group and Vedica
by Parle Bisleri have been launched in this category.
DEMAND
Growth Fac tors
It is well-known that the Indian economy is driven by domestic consumption and growth across all
sectors, namely agriculture, industry and services. As a consequence of low per-capita income and
wide disparities in income distribution, India has had very low penetration of consumer goods and
services. However it is clear that the economy is changing, fundamentally, triggered by far
reaching changes in socio-economic variables. These variables will have a significant impact on
economic growth, savings rates, consumption patterns and product and services penetration.
In contrast to world trends, the mix of the Indian population is changing in favour of the working
age group. The United Nations Population Division (UNPD) estimates that India’s working age (15-
64 years) population proportion, which was lowest at 55.3% in 1965, has increased steadily to
reach 63% today. Going forward, the demographic transition is likely to be even sharper, with the
proportion of working age population likely to reach 69% by 2035 – an increase of 0.23% every
year. This demographic dividend will have a positive impact on India’s average income levels and

Industry Comment Food Processing
www.imacs.in 45
consumption patterns as allocation of incomes on staples will be supplemented by larger spends
on discretionary items.
It is estimated by the National Council of Applied Economic Research (NCAER) that the
proportions of the two lowest income category households i.e. low income households (USD 0-
3,000) and aspirants (USD 3,000-6,000) will drop from 14.6% and 41% to 6.4% and 25%
respectively. Effectively, by 2016, NCAER estimates that 68% of Indian households are likely to be
middle class or high-income households. This change in income distribution will appreciably boost
consumption of branded consumer goods.
Similarly the pace of India’s urbanisation is expected to be faster than that of the rest of the
world. The mix of urban population is expected to increase from about 29% currently to about
44% by 2035 as per estimates of the UNPD. This will lead to increased number of nuclear families
and the proportion of working women, which in turn will provide a fillip to the growth of branded
consumer goods. The industry is expected to capitalise on these opportunities especially, in the
business segments of branded packaged foods and retailing.
The foods business is to be supported with investments in manufacturing and distribution
infrastructure capable of handling larger scale to derive benefits of growing business volumes in
the future. Supply chain logistics for competitive freshness and cost efficiencies is critical to this
business. Till requisite scale is achieved, the companies in the sector would have to bear a high
cost base as the benefits of distributed product to service closer markets are yet to be fully
exploited. The businesses need to build competitiveness by scaling up whilst enhancing process
and supply chain efficiencies.
Brand building will assume importance in the coming years to drive sales and enhance consumer
recall. Innovative campaigns with high buzz factors, supported by focused consumer activation,
will be essential for building strong consumer franchise and trade loyalty. Well researched and
robust product development processes will be required for the launch of differentiated offerings
across segments.
The product platforms of taste, energy, health and wellness are expected to provide the next level momentum in sales growth. Affordability will be a key determinant of the growth of the branded foods business in India.
Factors Const ra in ing Demand
Most food products are sold to the end consumer in a basic, non value-added form. Value
addition is currently restricted mainly to household kitchens. The growth of the food processing
industry has been restricted in the past by demand as well as supply related constraints.
A vast majority of the population cannot afford processed/branded foods.
The flourishing of the processed foods industry is correlated to the proportion of working
women in the economy. This proportion remains low in India.
Industry Comment Food Processing
www.imacs.in 46
India being a labour surplus economy, middle and higher income consumers can
comfortably afford servants/cooks to prepare food. There is no particular incentive to buy
convenience foods.
Indians generally prefer fresh foods, and the concept of buying and freezing food in bulk is
relatively uncommon. As a result, the purchase cycle for a variety of food products such as
milk, dairy items, and vegetables, among others, tends to be small, with only small
quantities being bought each time. Packaged foods, because of the time involved in
shipping from factory to the retailers' shelves, are viewed as stale. Moreover given that
unorganized players have traditionally dominated the foods sector, there is a perception
that purchased foods may be detrimental to health, as several of these players are not
seen to invest adequately in maintaining quality/hygiene standards.
Like everything else in the country, Indian food habits are diverse. Not only does the cuisine differ, but the ingredients, the composition and the cooking style also tend to vary across States. This makes the country a fundamentally difficult market to address with a standardised product.
COMPETITIVE FORCES
Extent o f Compet i t ion
The food processing sector in India is multi-segmented, with each segment being highly
fragmented. Some multinational companies and a few local players enjoy nation-wide recognition
in specific product segments. The unorganised sector dominates each of the above segments,
although market leadership may be vested with large organised manufacturers. The high level of
fragmentation in the industry is reflected in the large number of food processing units in the
organised sector alone. The table below shows the number of food processing industries
functioning in the country. As per the competitiveness report of National Manufacturing
Competitiveness Council (NMCC) there are 25,367 registered food processing units in the country.

Industry Comment Food Processing
www.imacs.in 47
State-wise Details of Registered Food Processing Units
State
No. of Factories in
Operation
Capital
Invested
Total
Output
Rs. billion
Andhra Pradesh 6,402 97 273
Tamil Nadu 3,736 63 142
Maharashtra 2,238 161 287
Uttar Pradesh 1,719 140 245
Punjab 1,628 42 116
Karnataka 1,390 63 113
Gujarat 1,307 66 260
West Bengal 1,147 29 76
Kerala 1,059 20 68
Assam 897 16 42
Haryana 564 32 62
Chattisgarh 561 11 32
Orissa 535 10 22
Madhya Pradesh 517 30 133
Rajasthan 506 17 62
Uttaranchal 274 13 23
Bihar 191 9 12
Jharkhand 108 1 3
Delhi 103 6 34
Himachal Pradesh 97 4 7
Jammu & Kashmir 93 3 5
Goa 80 4 8
Puducherry 55 2 10
Tripura 50 0 1
Daman & Diu 28 1 2
Chandigarh (U.T.) 27 0 2
Nagaland 16 0 0
Meghalaya 13 0 1
Manipur 12 0 0
Dadra & Nagar Haveli 10 0 2
Andaman & Nicobar Islands 4 0 0
Total 25,367 840.9 2,042.6
Industry Comment Food Processing
www.imacs.in 48
Unorganised, small players are estimated to account for more than 70% percent of the industry’s
output in volume and 50% in value terms. Most of them operate locally, add little if any value to
products, and use outdated technologies. The government’s policy of reserving the food-
processing sector for small-scale units, effective until 1991 discouraged large-scale domestic and
foreign direct investment. However, following economic liberalisation in 1991, the food-
processing industry was opened, resulting in increased investment in this sector, both domestic
and foreign. Over the last few years, several large companies, both Indian and foreign, have
invested in the food-processing business in India, resulting in significant growth in this sector.
Low entry barriers and apparently attractive economics of industry continuously attract new
entrants. Significant variations in food habits and culinary traditions across the country translate
into a competitive advantage for small and medium local players, who are familiar with local food
habits and markets. Some Indian food-processing companies have increased market share by
decreasing product prices. Besides some product categories that enjoy country-wide
consumption, high variance in products profile, tastes and preferences has led to creation of
regional niche markets in some product categories which have been successfully addressed by
regional players and have led to a flourishing unorganised segment in the industry. Large number
of players and largely undifferentiated nature of most products leads to price competition, often
losses, because of which staying power gives competitive advantage.
The installed capacity and levels of processing in various industries is quite low:
Installed capacity of fruits and vegetables processing industry has increased from 1.1 mtpa
in 1993 to 2.5 mtpa in 2007 and 3 mtpa in 2009. The utilisation of fruits and vegetables
processing is estimated to be around 2.2% of the total production. Over the last few years,
there has been a positive growth in ready to serve beverages, fruit juices and pulps,
dehydrated and frozen fruits and vegetable products, tomato products, pickles,
convenience vegetarian spice pastes, processed mushrooms and curried vegetables. The
domestic consumption of value added fruits and vegetable products is also low compared
to the primary processed food in general and fresh fruits and vegetables in particular
which is attributed to higher incidence of tax and duties including that on packaging
material, lower capacity utilisation, non-adoption of cost effective technology, high cost of
finance, infrastructural constraints, inadequate farmers-processors linkage leading to
dependence upon intermediaries. The smallness of units and their inability for market
promotion is also other main reasons for inadequate expansion of the domestic market.
In meat and meat processing sector, poultry meat is the fastest growing animal protein in
India. Mutton and lamb is a relatively small segment where demand is outstripping supply,
which explains the high prices in domestic market. The production levels have been
almost constant, which has restricted large processing companies from developing
capacities in this sector. Indian consumer prefers to buy freshly cut meat from the market,
rather than processed or frozen meat. A mere 6% of production of poultry meat is sold in
processed form. Of this, only about 1% undergoes processing into value added products
(ready-to-eat/ready-to-cook). Processing of large animals is largely for the purpose of
exports.

Industry Comment Food Processing
www.imacs.in 49
For dairy products, around 70 million rural households (primarily, small and marginal
farmers and landless labourers) in the country are engaged in milk production. Over 11
million farmers are organised into about 0.1 million village Dairy Cooperative Societies,
handling around 18 million kg of milk per day. In India, current annual growth rate in milk
production is estimated at around 4-6%. About 35% of milk produced in India is
processed. The organised sector (large scale dairy plants) processes about 13 mtpa, while
the unorganised sector (halwaiis and vendors) process about 22 mtpa.
The grain processing industries include milling of rice, wheat and pulses. Considering that
rice/pulses/flour are consumed in the processed form only and primary processing in
these sectors add little to shelf life, wastage control and value addition, the government is
not accepting fresh proposals for these sectors viz., rice, flour and pulse milling from the
financial year 2004-05.
Consumer food industry includes pasta, breads, cakes, pastries, rusks, buns, rolls, noodles,
corn flakes, rice flakes, ready to eat and ready to cook products, biscuits etc. Bread and
biscuits constitute the largest segment of consumer foods, but biscuits stand at a higher
value and production level than bread. Manufacturing of bread is reserved for SSI sector.
Out of the total production of bread, 40% is produced in the organised sector and the
remaining 60% in the organised sector.
Leading Food Processing Companies
Company Products
Hindustan Lever Limited Ice creams, packaged wheat flour, salt, tea, bread, oils, fats and dairy products
Haldirams Snack food traditional Indian sweets
MTR Foods Convenience food, ice creams, snack food
Cadbury India Chocolates, sugar confectionery, malt drinks
Ruchi Group Soya products, palmolein oil, sunflower oil, hydrogenated vegetable fat and oil
Dabur Fruit juices, cooking paste and sauces
GlaxoSmithKline Malt drinks
Gujarat Co-operative Milk
Marketing Federation
Ice creams, butter, cheese, milk powder, traditional Indian sweets, chocolates
Godrej Foods Fruit juices, tomato puree, nuts, groundnut oil, refined palmolein oil and
hydrogenated oil
Pepsi Foods India Soft drinks but also large consumer of tomatoes and chillies for preparing pastes for
exports
Britannia Industries Biscuits, milk products like cheese and butter
Parle Foods Biscuits and other related products
Mother Dairy Ice creams, butter, cheese, milk powder, traditional Indian sweets, chocolates
Venkateshwara Hatcheries Frozen chicken
Nestle India Chocolates, sugar confectionery, malt drinks, milk powder
Vadilal Group Ice-creams, canned and frozen products
Gitz Food Products Snack foods, dairy products, namkeens, pure ghee, dairy whitner, milk powder
Agro Tech Foods Edible oils and branded foods (popcorn, dried peas)
Typically, margins are low, with profitability being volume driven. Market leaders have been able
to distinguish themselves primarily through brand promotion and distribution strengths. The large
size of the Indian market, along with gradual liberalization of the sector has prompted

Industry Comment Food Processing
www.imacs.in 50
investments of more than Rs. 600 billion by multinationals such as Kellogg's and Heinz. However,
given the deeply entrenched food habits and restricted affordability of the Indian consumer, such
forays are likely to be largely restricted to the top end of the market. The serious volumes in the
foods business are to be found at the lower end, and in traditional foods. This has prompted
companies to look with renewed interest at niches such as glucose biscuits and packaged wheat
flour respectively.
In ternat ional Compet i t iveness
India is one of the largest producers of fruits, vegetables, poultry, and livestock. Indian prices of
processed food are also substantially lower than world prices. However, India accounts for around
1.5% of world’s processed food exports. India’s exports of processed foods were Rs. 436 billion in
FY2011.
India’s Processed Food Exports (Rs. million)
2005-06 2006-07 2007-08 2008-09
2009-
10
2010-
11
5-yr
CAGR
Floriculture 3,015 6,527 3,401 3,688 2,945 2,865 -1.0%
Fruits & vegetable seeds 930 1,216 1,421 1,200 1,451 1,752 13.5%
Floriculture & seeds 3,944 7,743 4,823 4,888 4,395 4,616 3.2%
Fresh onions 7,082 11,633 10,358 18,275 23,194 17,416 19.7%
Other fresh vegetables 2,683 4,331 4,895 6,802 7,319 8,929 27.2%
Walnuts 1,145 1,180 1,621 1,412 1,979 1,565 6.5%
Fresh mangoes 1,281 1,419 1,274 1,707 2,005 1,629 4.9%
Fresh grapes 2,146 3,019 3,178 4,086 5,453 4,121 13.9%
Other fresh fruits 2,637 3,100 3,045 4,309 5,228 4,896 13.2%
Fresh fruits & vegetables 16,974 24,683 24,371 36,592 45,179 38,556 17.8%
Dried & preserved vegetables
3,970 4,275 4,299 4,964 5,321 5,170 5.4%
Mango pulp 3,642 5,058 5,097 7,530 7,446 8,140 17.4%
Pickle & chutney NA NA NA NA NA NA NA
Other processed fruits & vegetables
7,409 9,555 9,628 13,718 14,355 13,164 12.2%
Pulses 11,247 7,900 5,490 5,423 4,083 8,531 -5.4%
Processed fruits & vegetables
26,268 26,789 24,515 31,635 31,205 35,004 5.9%
Buffalo meat 26,339 32,138 35,498 48,397 54,806 84,127 26.1%
Sheep/goat meat 810 659 1,341 4,934 7,472 2,532 25.6%
Poultry products 3,165 3,182 4,411 4,221 3,721 3,013 -1.0%
Dairy products 6,767 4,346 8,666 9,809 4,027 5,339 -4.6%
Animal casings 175 95 68 88 315 351 14.9%
Processed meat 72 71 130 101 96 210 23.8%
Natural honey 1,162 609 933 1,490 1,467 2,496 16.5%
Swine meat 21 87 246 92 104 105 38.4%
Animal products 38,512 41,186 51,293 69,131 72,007 98,173 20.6%
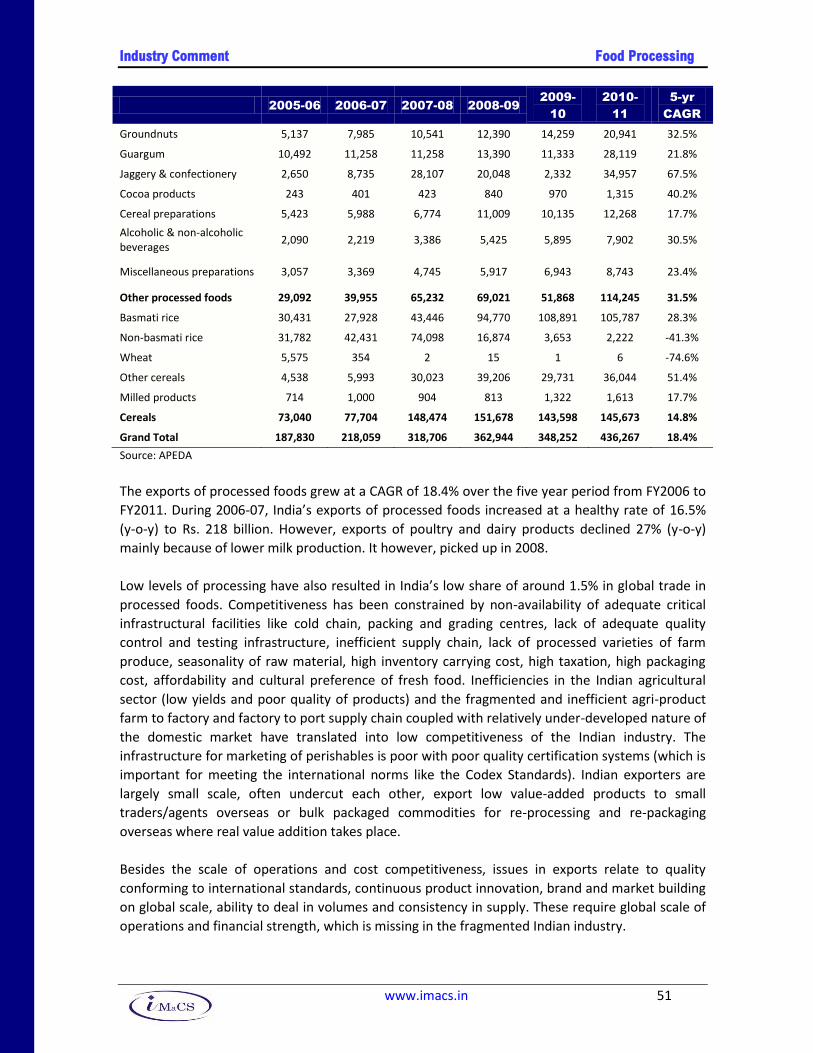
Industry Comment Food Processing
www.imacs.in 51
2005-06 2006-07 2007-08 2008-09
2009-
10
2010-
11
5-yr
CAGR
Groundnuts 5,137 7,985 10,541 12,390 14,259 20,941 32.5%
Guargum 10,492 11,258 11,258 13,390 11,333 28,119 21.8%
Jaggery & confectionery 2,650 8,735 28,107 20,048 2,332 34,957 67.5%
Cocoa products 243 401 423 840 970 1,315 40.2%
Cereal preparations 5,423 5,988 6,774 11,009 10,135 12,268 17.7%
Alcoholic & non-alcoholic beverages
2,090 2,219 3,386 5,425 5,895 7,902 30.5%
Miscellaneous preparations 3,057 3,369 4,745 5,917 6,943 8,743 23.4%
Other processed foods 29,092 39,955 65,232 69,021 51,868 114,245 31.5%
Basmati rice 30,431 27,928 43,446 94,770 108,891 105,787 28.3%
Non-basmati rice 31,782 42,431 74,098 16,874 3,653 2,222 -41.3%
Wheat 5,575 354 2 15 1 6 -74.6%
Other cereals 4,538 5,993 30,023 39,206 29,731 36,044 51.4%
Milled products 714 1,000 904 813 1,322 1,613 17.7%
Cereals 73,040 77,704 148,474 151,678 143,598 145,673 14.8%
Grand Total 187,830 218,059 318,706 362,944 348,252 436,267 18.4%
Source: APEDA
The exports of processed foods grew at a CAGR of 18.4% over the five year period from FY2006 to
FY2011. During 2006-07, India’s exports of processed foods increased at a healthy rate of 16.5%
(y-o-y) to Rs. 218 billion. However, exports of poultry and dairy products declined 27% (y-o-y)
mainly because of lower milk production. It however, picked up in 2008.
Low levels of processing have also resulted in India’s low share of around 1.5% in global trade in
processed foods. Competitiveness has been constrained by non-availability of adequate critical
infrastructural facilities like cold chain, packing and grading centres, lack of adequate quality
control and testing infrastructure, inefficient supply chain, lack of processed varieties of farm
produce, seasonality of raw material, high inventory carrying cost, high taxation, high packaging
cost, affordability and cultural preference of fresh food. Inefficiencies in the Indian agricultural
sector (low yields and poor quality of products) and the fragmented and inefficient agri-product
farm to factory and factory to port supply chain coupled with relatively under-developed nature of
the domestic market have translated into low competitiveness of the Indian industry. The
infrastructure for marketing of perishables is poor with poor quality certification systems (which is
important for meeting the international norms like the Codex Standards). Indian exporters are
largely small scale, often undercut each other, export low value-added products to small
traders/agents overseas or bulk packaged commodities for re-processing and re-packaging
overseas where real value addition takes place.
Besides the scale of operations and cost competitiveness, issues in exports relate to quality
conforming to international standards, continuous product innovation, brand and market building
on global scale, ability to deal in volumes and consistency in supply. These require global scale of
operations and financial strength, which is missing in the fragmented Indian industry.
Industry Comment Food Processing
www.imacs.in 52
Barr ie rs to Ent ry for New P layers
Easy availability of raw material, technology and processing equipment; and low capital intensive
nature of the industry attracts new entrants. Entry barriers can be medium to high in certain
categories, especially at higher price points, but such categories account for a small share of the
total processed food market.
F luc tuat ions in Demand -Supp ly Gap
Strongly positive outlook for the industry since the mid-1990s has attracted a lot of players in the
market causing over-supplies in most product categories. Demand, on the other hand, has
however grown at a moderate rate owing to the preference of Indian households for fresh-foods.
Processing of foods is also known to affect carbohydrate and micronutrient content and
bioavailability in different ways with either desirable or adverse effects on the nutritional value.
Increased consumption of processed highly-calorific and more energy-dense food could lead to
increased incidence of obesity and diet-related diseases, like diabetes, coronary heart disease and
certain types of cancer. Already changes in dietary patterns are contributing to a clear change in
the trends of chronic diseases and obesity, particularly in the urban areas. A diet that is
particularly unhealthy, for instance, because it includes a high proportion of processed food, could
result in a higher risk of illnesses especially cardiovascular diseases (CVD) and diabetes. The
worsening of health could result in a larger medicinal and health care expenditure, and lower
future consumption of processed foods.
GOVERNMENT POLICY GUIDELINES
The Government of India has been working to develop the food processing industry in India
through several policies.
Food Safe ty and Standard B i l l 2005 - FSS Ac t , 2006
The Food Safety and Standards Bill, 2005, aims to integrate the food safety laws in the country in
order to systematically and scientifically develop the food processing industry and shift from a
regulatory regime to self-compliance. As part of the process of consolidation, the bill proposes to
repeal eight existing laws related to food safety.
The salient features of the bill are:
Establishment of Food Safety and Standards Authority of India (FSSA), to lay down
scientific standards of food safety and ensure safe and wholesome food. The FSSA set up
in 2008 would be assisted by a central advisory committee, a scientific committee and a
number of scientific panels in specifying standards. These standards would be enforced by
the Commissioner of Food Safety of each state through designated officers and food
safety officers.
Prohibiting use of food additives, processing aid, contaminants, heavy metals, insecticides,

Industry Comment Food Processing
www.imacs.in 53
pesticides, veterinary drugs residue, antibiotic residues, or solvent residues unless they
are in accordance with specified regulations. Certain food items such as irradiated food,
genetically modified food, organic food, health supplements and proprietary food cannot
be manufactured, processed or sold without adhering to specific regulations.
It is mandatory for the distributor of a food article to identify the manufacturer and the
seller to identify either the manufacturer or the distributor of a food item.
Every packaged food product has to be labelled as per regulations in the bill. The
packaging and labelling of a food product should not mislead consumers about its quality,
quantity or usefulness.
In case a food business operator (i.e., anyone owning or carrying out a business relating to
food) considers that a food item is not in compliance with the specified standards, he has
to initiate procedures to withdraw the food in question and inform the competent
authorities.
Every food business operator is required to have a licence in order to operate his food
business. Petty manufacturers who make their own food, hawkers, vendors or temporary
stall holders do not require a licence. Instead, they need to get their businesses registered
with the local municipality or Panchayat.
The bill empowers the FSSA and State Food Safety Authorities to monitor and regulate the
food business operators. The Commissioner of Food Safety of each state appoints a
Designated Officer (DO), not below the level of sub-divisional officer, for a specific district
whose duties include issuing or cancelling licences, prohibiting sale of food articles that
violate specified standards, receiving report and samples of food articles from Food Safety
Officers and getting them analysed. The DO also has the power to serve an 'improvement
notice' on any food operator and suspend his license in case of failure in compliance with
such a notice. The DO also investigates any complaint made in writing against food safety
officers. These officers are appointed for a specified local area and their duties include
taking samples of food articles, seizing food articles that are of suspect quality or
inspecting any place where food articles are stored or manufactured.
The Ministry of Commerce has established Spice Parks in spice producing states, to provide
common infrastructure facilities at the growing centres. It would facilitate establishment of
processing centres close to the production centres, leading to better price realisation by farmers
and enhanced quality of spices.
Fore ign Direc t Inves tment Pol icy
Automatic investment approval (including foreign technology agreements within specified norms),
up to 100% foreign equity or 100% for NRI and Overseas Corporate Bodies (OCBs) investment, is
allowed for most of the food processing sector except malted food, alcoholic beverages and those
reserved for small scale industries. 24% foreign equity is permitted in the small-scale sector.

Industry Comment Food Processing
www.imacs.in 54
Temporary approvals for imports for test marketing can also be obtained from the Director
General of Foreign Trade.
State In i t ia t ives
Various states governments like Himachal Pradesh, Uttaranchal and Jammu and Kashmir have
encouraged companies to set up manufacturing facilities in their regions through a package of
fiscal incentives. Jammu & Kashmir offers incentives such as allotment of land at concessional
rates, 100% subsidy on project reports and 30% capital investment subsidy on fixed capital
investment up to USD 63,000. The Himachal Pradesh government offers sales tax and power
concessions, capital subsidies and other incentives for setting up a plant in its tax free zones.
The total inflow of FDI in food processing sector up to 2007-08 (up to November 2007) was Rs.
27.8 billion. Nearly 30% of FDI in this sector comes from EU countries such as Netherlands,
Germany, Italy and France. Some of the successful ventures from EU countries are Perfetti,
Cadbury, Godrej-Pilsbury, Nutricia International, Manjini Comaco, etc. The food processing
industry received FDI of about Rs. 8,590 million in FY2012, and total FDI received from FY2001 up
to June 2012 was Rs. 67,454 million. Major investments have come from Pepsi Co (which
constituted about 40% of the FDI in FY2010), and other companies engaged in dairy and meat
processing, and confectionaries.
FDI Inflows (Rs. million)
Source: DIPP
The Schemes under the Twelfth-Five Year Plan
The Planning Commission’s Working Group for the Twelfth Five Year Plan has proposed the
following budgetary requirements.
1,980
10,360
1,770
5,110
1,741 1,829
4,410
6,320
4,620
9,537 8,610 8,590
-
2,000
4,000
6,000
8,000
10,000
12,000
20
00
-01
20
01
-02
20
02
-03
20
03
-04
20
04
-05
20
05
-06
20
06
-07
20
07
-08
20
08
-09
20
09
-10
20
10
-11
20
11
-12

Industry Comment Food Processing
www.imacs.in 55
Budgetary Requirement for Schemes Under the Twelfth-Five Year Plan
Twelfth-Five Year Plan Schemes
Approved
Outlay (Rs.
billion)
Mega Scheme for Infrastructure Development
Food Park
52.2
Packaging Centre
Modernised Abattoirs
Integrated Cold Chain Facilities
Irradiation Facilities
Value Added Centres
National Mission on Food Processing 65.3
Strengthening of Institutions including Skill Development Programme 14.2
Food Safety, R&D and Promotional Activities 7.9
Innovation Fund Scheme 1.9
Venture Capital Fund 5.0
Financial Commitments for 11th Plan projects, now proposed to be implemented under NFPM*
4.1
Total 150.7
* These include Rs. 4 billion of grant funds committed under Scheme for Technology Upgradation/Setting
up/Modernisation/Expansion of Food Processing Industries and Rs. 120 million under HRD initiatives.
In f ras t ruc ture Development in the Food Process ing Indust ry
The major factor standing in the way of agro/food processing in the country is inadequate
Infrastructure. Thus, infrastructure development has been identified as a thrust area for
intervention. The Ministry of Food Processing Industries has implemented various schemes for
infrastructure development comprising the following components to address different aspects of
food related infrastructure.

Industry Comment Food Processing
www.imacs.in 56
Mega Food Parks
The Mega Food Parks Scheme, an initiative aimed at achieving the Vision 2015 of MoFPI to
increase, the processing of perishables, value addition and share in global food trade in the
country. The scheme aims at providing infrastructure facilities for food processing along the value
chain from farm to the market. This includes creation of infrastructure near the farm,
transportation, logistics and Centralised Processing Centres (CPC). Under the scheme the food
processing units will be located at the CPC with processing, packaging, environmental protection
systems, quality control labs, trade facilitation centres, etc. The ultimate objective is to link the
farmer with the retail market or the consumer thereby reducing the intermediaries in between. It
aims to provide a mechanism to bring together farmers, processors and retailers, and link
agricultural production to the market to ensure maximisation of value addition, minimisation of
wastages, and improving farmers’ income. The idea behind the mega food parks scheme is to
make India’s farm sector more market-driven than supply-driven and the farmers produce will be
based on the demand of products in the market. It will include creation of infrastructure near the
farm, transportation, logistics and centralized processing centres. This would make available
common infrastructure facilities for the food processing Industry especially SMEs. Also, the
farmers will be getting more market information, and would be informed about what has to be
produced and what is needed in the market. The food parks are expected to generate 30,000
direct jobs and many times more of this number as indirect jobs.
Under the scheme for food parks, a grant of 50% of the project cost is provided, excluding the land
component in general areas and 75% in North-Eastern regions and difficult areas, subject to a
maximum of Rs. 500 million. A total of 30 food parks were planned under the Eleventh Five Year
Plan and these were to be implemented in phases. Thus, in the first phase, proposals were invited
in October, 2008 for setting up 10 Mega Food Parks, one each in 10 different States. Of these 10
projects, final approval has been given to 8 projects so far, one project each in Andhra Pradesh,
Assam, Jharkhand, Karnataka, Tamil Nadu, Punjab, West Bengal and Uttarakhand. These projects

Industry Comment Food Processing
www.imacs.in 57
are presently under various stages of implementation with projects in Andhra Pradesh and
Uttarakhand also starting partial commercial operations. The CCEA in November 2010 has
approved setting up of five new Mega Food Parks in addition to the ongoing projects.
During the second phase of scheme implementation, five more Mega Food Parks have been
approved and in principle approval has been accorded to all the five projects. Final approval has
been accorded to three projects. In the Union Budget, 2011-12, announcement for setting up of
15 new Mega Parks was made.
The status of implementation of the 15 ongoing projects is as under:
Status of Project Implementation of 15 Ongoing Mega Food Park Projects
Mega Food Park
Project Cost
(Rs. million)
Amount of
Grant
Released
(Rs. million)
Patanjali Food and Herbal Park Ltd. 950 300
Srini Food Park Pvt. Ltd. 1,265 300
North East Mega Food Park 759 150
Jharkhand Mega Food Park Pvt. Ltd. 1,139 50
Tamil Nadu Mega Food Park Ltd. 1,334 50
Jangipur Bengal Mega Food Park Pvt Ltd. 1,110 50
M/s Integrated Food Park Pvt. Ltd. 1,443 50
M/s International Mega Food Park Ltd. 1,534 50
M/s Keventer Food Park Infra Ltd. 1,533 50
M/s Sikaria Infra Projects Pvt. Ltd. 852 50
M/s Anil Mega Food Park Pvt. Ltd. 1,793 -
M/s Shaktiman Mega Food Park Pvt. Ltd. 1,686
Detailed Project Report (DPR) has been submitted and appraised
M/s Paithan Mega Food Park Ltd. 1,207
In-principle
approval was
accorded and
DPR has been
submitted
M/s MITS Mega Food Park Ltd. 1,167
The submitted DPR has been appraised and scrutinised
M/s, Madhya Pradesh Mega Food Park Ltd. 1,617
In-principle approval has
been accorded and DPR is
awaited
Integrated Cold Chain Facili ty
The objective is to improve viability of cold storages and enhance cold storage capacity. Assistance
is provided to the following types of cold storages:
Industry Comment Food Processing
www.imacs.in 58
Cold storage for non-horticulture produce
Where cold storage is an integral part of processing unit or of the common facilities in
food parks
Special types of cold storages with CA/MA facility
The scheme seeks to provide financial assistance in the form of grant-in-aid at 50% of the total
cost of the plant and machinery and technical civil works in genera areas and 75% in North-
Eastern regions and difficult areas, subject to a maximum of Rs. 100 million. During the financial
year 2011-12, MoFPI has released grants- in-aid of Rs. 440 million (up to December 2011) to 14
integrated cold chain projects in the country. The details of the assisted units are given in the
annexure at the end of this report. Modernised Abattoir
It aims at scientific and hygienic slaughter, causing least pain to the cattle and ensuring better by
product utilization as well as availability of better grade meat for the consumers. It will also ensure
modern technology for slaughter waste management and pollution control, humane treatment of
animals, value addition, chilling facility to prevent microbial activity in slaughtered animals, better
cold chain management and linking the finished meat and meat products to the retail market. An
assistance of 50% of the project cost in general areas and 75% in difficult areas subject to a
maximum of Rs. 150 million for each project will be provided.
Scheme for Technology Up-gradation/Establishment/Modernisation
The scheme for technology up-gradation/establishment/modernisation/expansion of food
processing industries is aimed at creating and upgrading existing processing capabilities. The
scheme provides 25% of the cost of the plant and machinery and technical civil works subject to a
maximum of Rs. 5 million in general areas and 33.3% up to a maximum of Rs. 7.5 million in difficult
areas.
Nat iona l Miss ion on Food Process ing (NMFP)
Objectives of NMFP as charted out by the Working Group of Planning Commission
To spread the message of significance of food processing for enhancing agricultural
productivity and farmers income in the country.
To assist the state governments in creating requisite synergy between their agricultural
plans and development of food processing sector.
To assist the state governments in addressing both institutional and infrastructural gaps
along the Value Chains and thus create efficient Supply Chains for agricultural produces.
To promote initiatives for skill development, training and entrepreneurship which would
meet needs of both post-harvest management and food processing industry.
To assist Micro, Small and Medium Enterprises (MSMEs) in setting up/modernisation of
food processing units by providing need based support in terms of capital/technology/skill
etc.
To assist food processing industry to meet requisite standards in terms of food safety laws
and market demand, both domestic and international.
The guiding principles for the Mission are:
Organising the unorganised food processors, including Self-Help Groups (SHGs) to help
Industry Comment Food Processing
www.imacs.in 59
them reap advantages of the Mission initiatives.
Ensuring advantages of programmes/schemes/institutions/infrastructure of NMFP reach
Micro, Small and Medium Enterprises on preferential basis.
Dedicated, professional, sensitive and accountable support structure to initiate and
implement the Mission initiatives in a transparent manner.
Mission initiatives to be shaped and driven by proposed beneficiaries.
Adoption of best practices for scaling up programmes/initiatives
The NMFP schemes would be implemented as centrally sponsored schemes or through additional
Central assistance route by giving the responsibility of implementation to the State Governments.
The detailed guidelines of these schemes would though be drawn up in discussion with the
Planning Commission and State Governments. NMFP will also take into account the need for
specific initiatives of State Governments. In case of State plan to take up other additional
activities, same may also form a part of admissible components of NMFP, subject to prior approval
of MoFPI.
CRITICAL SUCCESS FACTORS
The critical success factors for the Food Processing Sector are as follows:
Product Selection
From the perspective of the food companies in India, foods can be classified into four categories:
1) products which are entirely new to the Indian palate and for which new demand has to be
created (for instance instant noodles), 2) products which are currently made in-house but where
consumption can be shifted to packaged products (for instance soup mixes), 3) products which
seek to replace existing categories (for instance mineral water), and 4) products which seek to
upgrade current users from existing products (for instance, packaged, iodized salt). Each of these
categories poses a different developmental challenge and therefore calls for careful selection of
product.
Distr ibution Network
Extensive retail presence is imperative. Geographical coverage and number of retail outlets
become critical to a company’s ability to sell in large volumes. For some products such as ice
cream and cold desserts, availability of an efficient cold chain is also imperative for being able to
service consumers in geographically distant areas.
Raw Material Sourcing
The raw material intensive nature of the industry necessitates having access to wide raw material
supplier base, in order to capitalize on regional demand supply imbalances and price fluctuations.
The importance of raw material sourcing increases for upstream activities such as sugar
manufacturing, where a company’s profitability is highly dependent on the assured supply of
sugar cane.

Industry Comment Food Processing
www.imacs.in 60
Quali ty
The importance of quality and hygiene standards cannot be overemphasized, particularly in the
exports market where companies are expected to meet the relatively stringent standards of the
appropriate authorities. As quality and hygiene generally imply a higher degree of mechanization,
companies that are able to invest in the appropriate equipment are likely to gain an advantage
over the competition.
FINANCIAL PERFORMANCE
ROCE and Operat ing Marg ins
Owing to high competitive intensity and high price sensitivity, operating margins tend to be
relatively low, mainly because of high cost of sales and competition. The pressure on margins is
also indicated by slower moving raw materials in each successive year. The food processing
industry’s operating and net margin increased slightly by 0.3% and 0.1% in FY2011 in comparison
to FY2010. The RONW and the ROCE declined during the year.
Profi tabil i ty Indicators for Food Processing Industry
FY 2007 2008 2009 2010 2011
Operating Margins 9.4% 12.1% 12.0% 9.6% 9.9%
Net Margins 5.8% 7.3% 6.4% 5.4% 5.5%
Return on Capital Employed (ROCE) 21.1% 23.2% 21.9% 21.4% 19.8%
Return on Net Worth (RONW) 18.7% 20.8% 19.1% 20.6% 18.4%
The key ratios for the year FY2011 indicate a reasonable liquidity position of the industry. The
current ratio was 2.5. The debt-equity ratio was 0.8, indicating greater use of equity in financing
the assets. The net sales (OI) growth was -7.4% during the year.
Key Rat ios
FY2011, unless otherwise stated
Item FY2011
PBDIT/Net Sales 11.4%
PAT/Net Sales 5.5%
Debt-Equity Ratio 0.8
Current Ratio 2.5
Sales (OI) Growth -7.4%
Net Working Capital Cycle
Debtors Velocity 14.9
Holding Period of Raw Material 69
Holding Period of Work-in-Process
Holding Period of Finished Goods 29
No. of Companies Taken in Preparing the Report 51
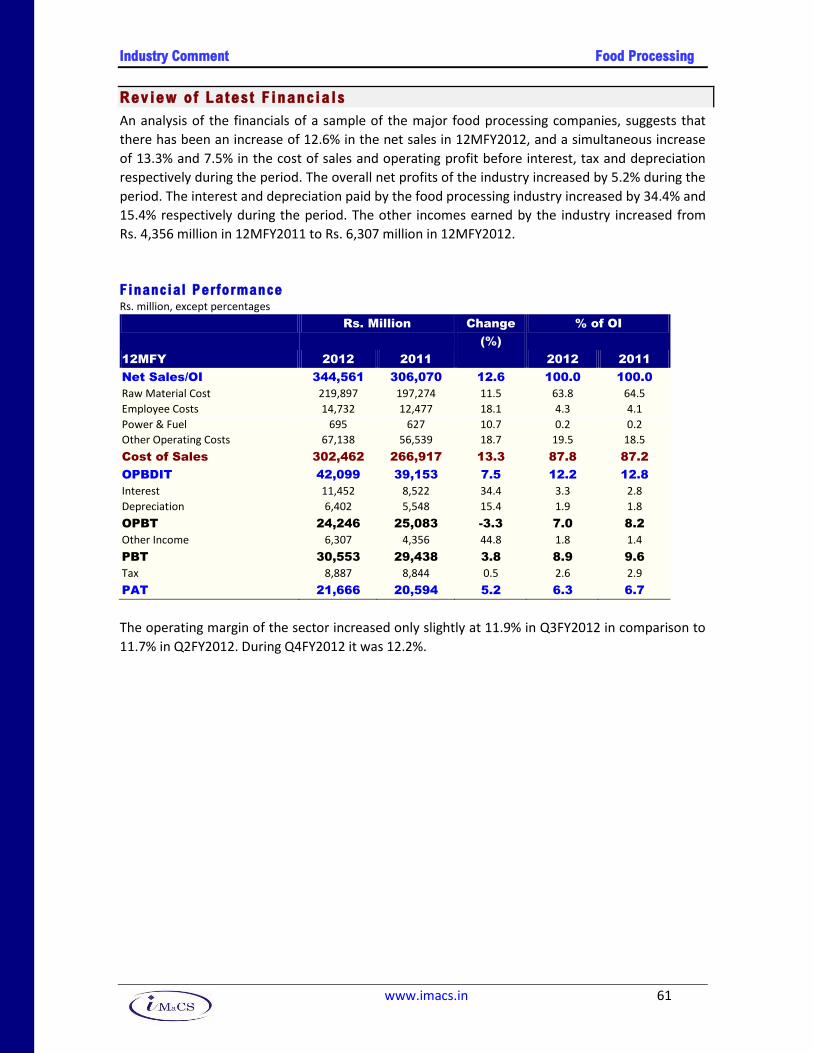
Industry Comment Food Processing
www.imacs.in 61
Rev iew of Lates t F inancia ls
An analysis of the financials of a sample of the major food processing companies, suggests that
there has been an increase of 12.6% in the net sales in 12MFY2012, and a simultaneous increase
of 13.3% and 7.5% in the cost of sales and operating profit before interest, tax and depreciation
respectively during the period. The overall net profits of the industry increased by 5.2% during the
period. The interest and depreciation paid by the food processing industry increased by 34.4% and
15.4% respectively during the period. The other incomes earned by the industry increased from
Rs. 4,356 million in 12MFY2011 to Rs. 6,307 million in 12MFY2012.
Financial Performance Rs. million, except percentages
Rs. Million Change
(%)
% of OI
12MFY 2012 2011 2012 2011
Net Sales/OI 344,561 306,070 12.6 100.0 100.0
Raw Material Cost 219,897 197,274 11.5 63.8 64.5
Employee Costs 14,732 12,477 18.1 4.3 4.1
Power & Fuel 695 627 10.7 0.2 0.2
Other Operating Costs 67,138 56,539 18.7 19.5 18.5
Cost of Sales 302,462 266,917 13.3 87.8 87.2
OPBDIT 42,099 39,153 7.5 12.2 12.8
Interest 11,452 8,522 34.4 3.3 2.8
Depreciation 6,402 5,548 15.4 1.9 1.8
OPBT 24,246 25,083 -3.3 7.0 8.2
Other Income 6,307 4,356 44.8 1.8 1.4
PBT 30,553 29,438 3.8 8.9 9.6
Tax 8,887 8,844 0.5 2.6 2.9
PAT 21,666 20,594 5.2 6.3 6.7
The operating margin of the sector increased only slightly at 11.9% in Q3FY2012 in comparison to
11.7% in Q2FY2012. During Q4FY2012 it was 12.2%.
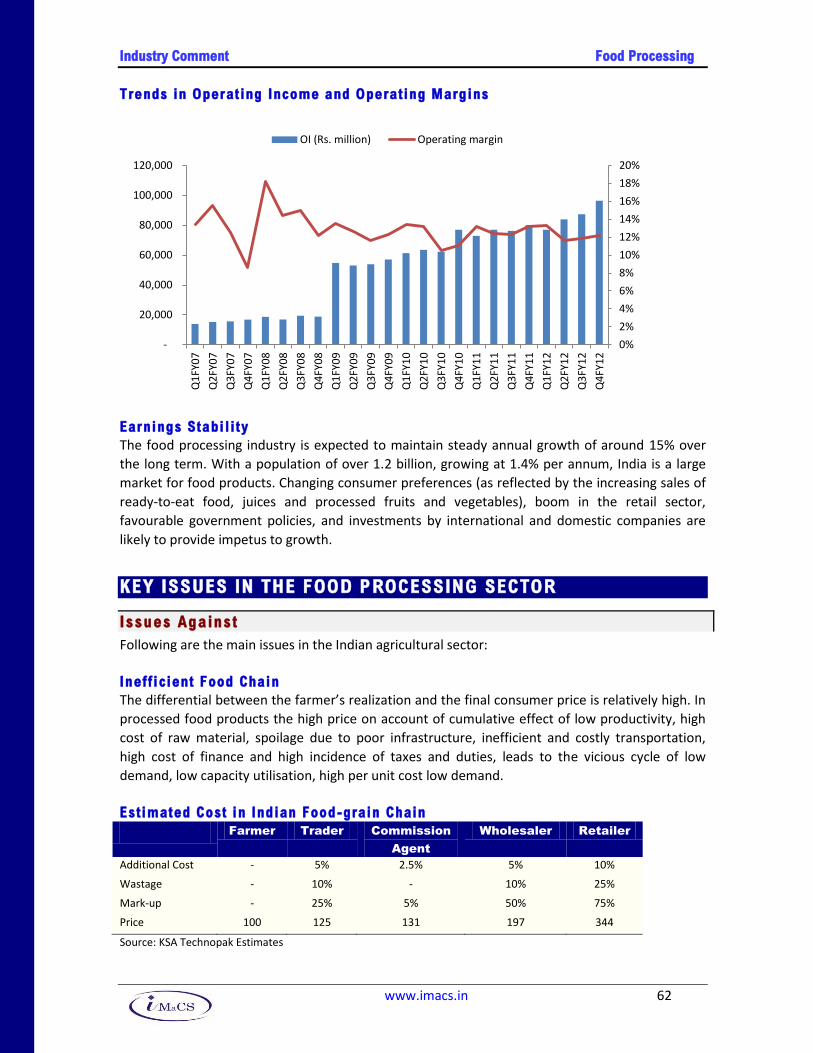
Industry Comment Food Processing
www.imacs.in 62
Trends in Operating Income and Operating Margins
Earnings Stabili ty
The food processing industry is expected to maintain steady annual growth of around 15% over
the long term. With a population of over 1.2 billion, growing at 1.4% per annum, India is a large
market for food products. Changing consumer preferences (as reflected by the increasing sales of
ready-to-eat food, juices and processed fruits and vegetables), boom in the retail sector,
favourable government policies, and investments by international and domestic companies are
likely to provide impetus to growth.
KEY ISSUES IN THE FOOD PROCESSING SECTOR
Issues Agains t
Following are the main issues in the Indian agricultural sector:
Inefficient Food Chain
The differential between the farmer’s realization and the final consumer price is relatively high. In
processed food products the high price on account of cumulative effect of low productivity, high
cost of raw material, spoilage due to poor infrastructure, inefficient and costly transportation,
high cost of finance and high incidence of taxes and duties, leads to the vicious cycle of low
demand, low capacity utilisation, high per unit cost low demand.
Estimated Cost in Indian Food-grain Chain
Farmer Trader Commission
Agent
Wholesaler Retailer
Additional Cost - 5% 2.5% 5% 10%
Wastage - 10% - 10% 25%
Mark-up - 25% 5% 50% 75%
Price 100 125 131 197 344
Source: KSA Technopak Estimates
0%
2%
4%
6%
8%
10%
12%
14%
16%
18%
20%
-
20,000
40,000
60,000
80,000
100,000
120,000
Q1
FY0
7
Q2
FY0
7
Q3
FY0
7
Q4
FY0
7
Q1
FY0
8
Q2
FY0
8
Q3
FY0
8
Q4
FY0
8
Q1
FY0
9
Q2
FY0
9
Q3
FY0
9
Q4
FY0
9
Q1
FY1
0
Q2
FY1
0
Q3
FY1
0
Q4
FY1
0
Q1
FY1
1
Q2
FY1
1
Q3
FY1
1
Q4
FY1
1
Q1
FY1
2
Q2
FY1
2
Q3
FY1
2
Q4
FY1
2
OI (Rs. million) Operating margin
Industry Comment Food Processing
www.imacs.in 63
The backward linkage between the farmer and the processor is yet to take proper shape to tide
over the impediments which exist on account of fragmented and small land holdings, erratic
production due to natural factors, non uniformity and inconsistent supply of raw material and
longer chain of intermediaries. Prevailing packaging system lacks requisite quality and
presentation parameters creating handicap as compared to the imported products.
Weak Linkage with R&D institution
Despite the existence of a strong and wide network of R&D institutions (CSIR labs, ICAR
institutions, ICMR Establishments, Universities and Private institutions), their linkage with the
users like farmers and industry, is not well established resulting in lack of technology flow, pure
and academic research rather than applied and commercial, lack of involvement of industry in
research work, and resource crunch.
Weak Database and Lack of Market Intell igence
There is no efficient system of information (price, demand, and supply) dissemination to the
farmer. This results in farmer not being able to produce and sells goods at the market determined
prices. Though the government and the industry have made efforts to fill this knowledge gap, the
network is still not widespread to reach to all nooks of the country.
Low Yields
Indian agriculture suffers from low productivity. Main reasons for this are as follows:
Fragmented land holdings.
Dependence on monsoons for irrigation. Although the number of tube wells and pump
sets used has increased, their use is restricted due to lack of regular power supply.
Large amounts of land are being rendered unusable due to water logging, land
degradation and salinity.
Rather than being determined by the size of land, funds available and soil nutrients and fertility,
the cropping patterns in Indian agriculture are determined by the farmer’s perception of risk. This
again is a function of the price expectation held by the farmer. Naturally, then crops that face
consistent demand, a lucrative export market or have a support price are chosen.
High Levels of Wastage
Every year around 35% of fruits and vegetables valued at around Rs. 500 billion are wasted. Major reasons for this are inefficient transportation chain, absence of warehousing facilities and manual handling of perishable goods.
Favourable Fac tors
Raw Material Availabili ty
India has a diverse agro-climatic condition due to which there exists a wide-ranging and large raw
material base suitable for food processing industries. India is the largest producer of livestock,
milk, sugarcane, coconut, spices and cashew and is the second largest producer of rice, wheat and
fruits and vegetables. India also has an ample supply of caustic soda and soda ash, the raw
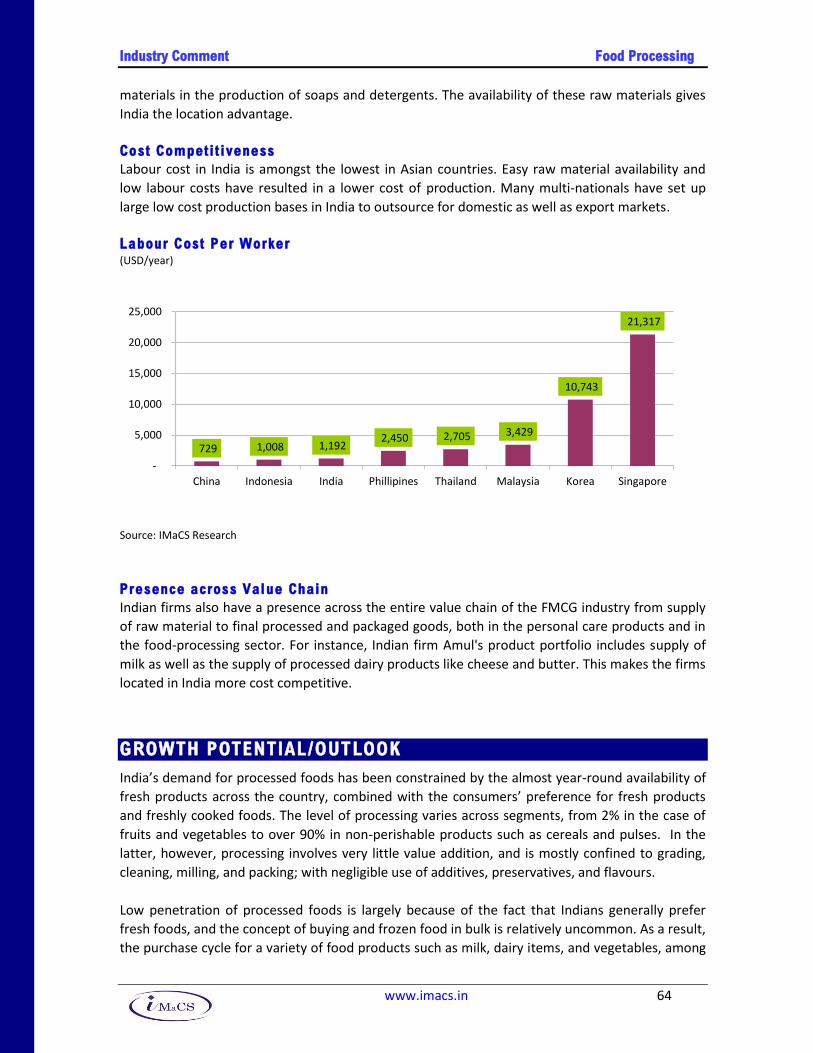
Industry Comment Food Processing
www.imacs.in 64
materials in the production of soaps and detergents. The availability of these raw materials gives
India the location advantage.
Cost Competitiveness
Labour cost in India is amongst the lowest in Asian countries. Easy raw material availability and
low labour costs have resulted in a lower cost of production. Many multi-nationals have set up
large low cost production bases in India to outsource for domestic as well as export markets.
Labour Cost Per Worker (USD/year)
Source: IMaCS Research
Presence across Value Chain
Indian firms also have a presence across the entire value chain of the FMCG industry from supply
of raw material to final processed and packaged goods, both in the personal care products and in
the food-processing sector. For instance, Indian firm Amul's product portfolio includes supply of
milk as well as the supply of processed dairy products like cheese and butter. This makes the firms
located in India more cost competitive.
GROWTH POTENTIAL/OUTLOOK
India’s demand for processed foods has been constrained by the almost year-round availability of
fresh products across the country, combined with the consumers’ preference for fresh products
and freshly cooked foods. The level of processing varies across segments, from 2% in the case of
fruits and vegetables to over 90% in non-perishable products such as cereals and pulses. In the
latter, however, processing involves very little value addition, and is mostly confined to grading,
cleaning, milling, and packing; with negligible use of additives, preservatives, and flavours.
Low penetration of processed foods is largely because of the fact that Indians generally prefer
fresh foods, and the concept of buying and frozen food in bulk is relatively uncommon. As a result,
the purchase cycle for a variety of food products such as milk, dairy items, and vegetables, among
729 1,008 1,192 2,450 2,705 3,429
10,743
21,317
-
5,000
10,000
15,000
20,000
25,000
China Indonesia India Phillipines Thailand Malaysia Korea Singapore

Industry Comment Food Processing
www.imacs.in 65
others, tends to be small, with only small quantities being bought each time. Packaged foods,
because of the time involved in shipping from factory to the retailers' shelves, are viewed as stale.
Moreover given that unorganised players have traditionally dominated the foods sector, there is a
perception that purchased foods may be detrimental to health, as several of these players are not
seen to invest adequately in maintaining quality/hygiene standards. The food habits of the Indian
population are also diverse and each ethnic group has its own unique culture and its own unique
food preferences. Although Indian cuisine is largely associated with the pronounced use of some
key ingredients and spices, differences in region, culture, climate, and religion dictate the
variations in the use of these ingredients.
However, with an estimated population of over 1.2 billion, rising disposable incomes, exposure to
western lifestyle, increase in the population of working women and prevalence of nuclear double
income families, especially in urban areas; India is rapidly becoming a key market for processed,
ready-to-cook and ready-to-eat food, leading to high growth in food processing sector. Busy
lifestyle, heightened awareness, and a desire to achieve western standards of living make India a
very suitable market for prepared foods. Significantly, increased urbanisation has seen the rise of
the middle classes and it is predominantly the lifestyle preferences of this group that mark a
change with the past. Moreover, economic growth has altered the structure of the labour force in
urban areas characterized by increased female participation with important consequences for the
family diet. The growing number of food retail chains in the large and smaller cities is also
expected to impact the sector positively.
The consumption of readymade meals, or foods that cut the long preparation time of traditional
dishes, have increased and are likely to be a more common feature of the diet for families where
there is a high female participation rate. This is expected to increase demand for processed food
products, giving a boost to the domestic food-processing industry, and providing opportunities for
increased imports of processed foods and food ingredients. The Indian food-processing industry
has started looking outward to acquire the latest food ingredients and technology. An indication
of this is the presence of numerous multinational food flavour, ingredient, and machinery
companies in India. Health consciousness is popularizing sugar-free low calorie diet foods and
natural foods containing dietary ingredients.
The government has earmarked considerable investments in rural infrastructure and components
of the supply chain by way of grading and packing centres, controlled atmosphere storage
facilities, reefer vans, testing laboratories, etc., which may not come from private sources. It is,
therefore, essential that public investment is significantly increased to fund these components of
rural infrastructure to enable private enterprise to take up the remaining components of the
supply chain which can be undertaken commercially. This is borne out by the experience of
developed countries where the state has stepped in to build rural infrastructure in a big way.
The failure to direct significant public investment into storage and processing infrastructure, which
could then be managed on a public private partnership basis involving all stakeholders, may be the
reason for low levels of investment in processing facilities, lack of value addition and the inability
of the farmer to obtain better prices and incomes. The management of the supply chain is better
undertaken with the involvement of all stakeholders on a PPP basis. Public investment in the
supply chain providing backward linkages to the farm with processors and retailers is to be given
the due importance.
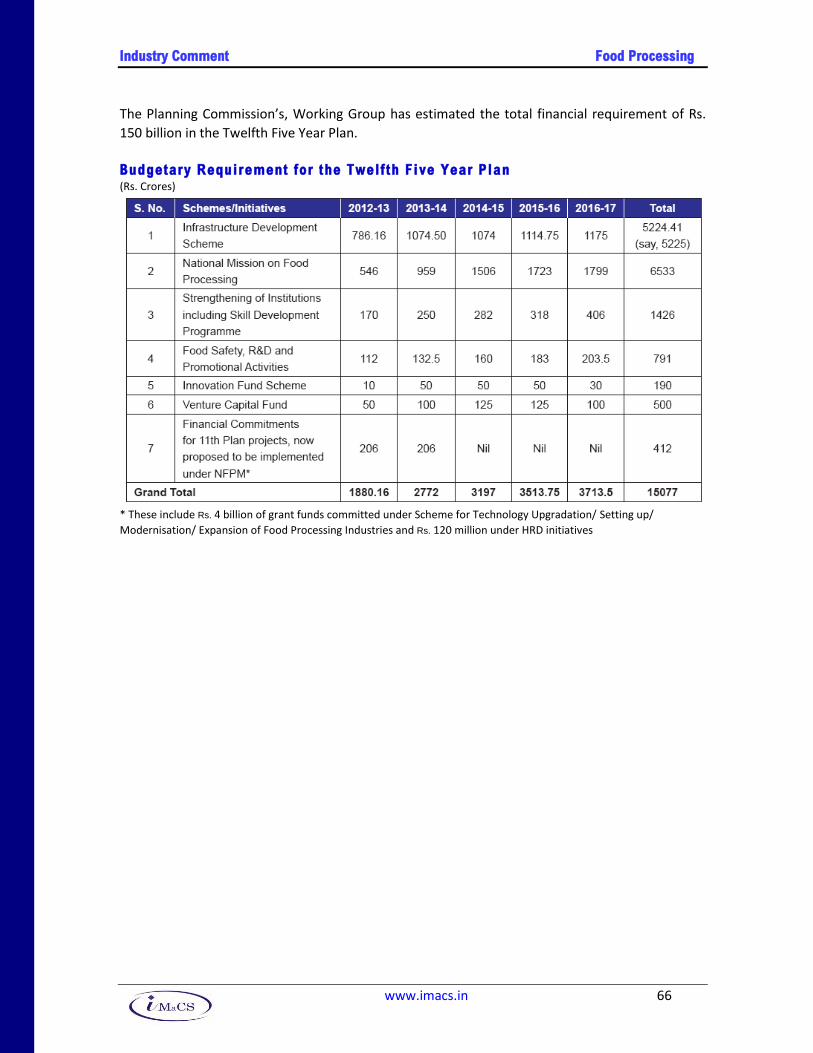
Industry Comment Food Processing
www.imacs.in 66
The Planning Commission’s, Working Group has estimated the total financial requirement of Rs.
150 billion in the Twelfth Five Year Plan.
Budgetary Requirement for the Twelf th Five Year Plan (Rs. Crores)
* These include Rs. 4 billion of grant funds committed under Scheme for Technology Upgradation/ Setting up/
Modernisation/ Expansion of Food Processing Industries and Rs. 120 million under HRD initiatives
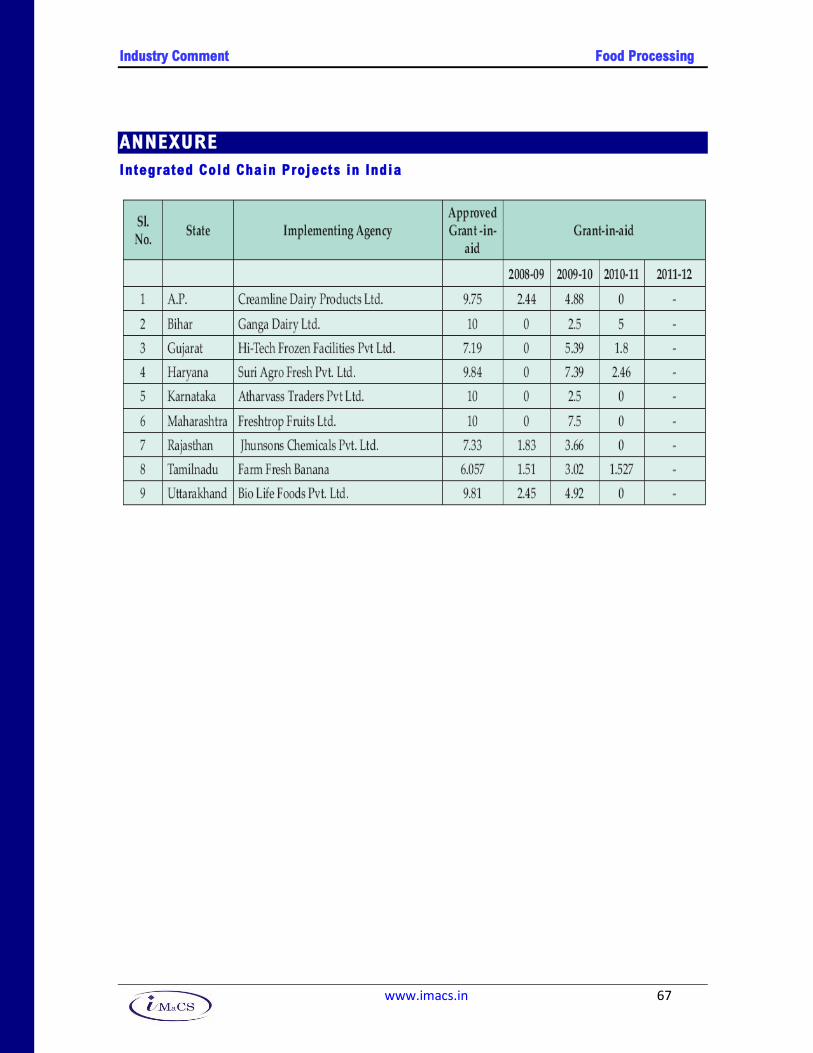
Industry Comment Food Processing
www.imacs.in 67
ANNEXURE
Integrated Cold Chain Projects in India

Industry Comment Food Processing
www.imacs.in 68

Industry Comment Food Processing
www.imacs.in 69
Intellectual Property Rights
The Intellectual Property Rights of this document vest entirely with ICRA Management
Consulting Services Limited (IMaCS). None of the information contained herein may be
copied, otherwise reproduced, repackaged, further transmitted, disseminated, redistributed,
or resold, or stored for subsequent use for any purpose, in whole or in part, in any form or
manner or by means whatsoever, by any entity without IMaCS’ prior written permission.
Media may, however, quote from this publication with due acknowledgement to IMaCS.
Copyright, ICRA Management Consulting Services Limited,
1105, 11th Floor, Kailash Building, 26 Kasturba Gandhi Marg, New Delhi 110 001