Food Processing Ingredients Sector 2007 - USDA · Web viewFood Processing Ingredients Sector...
64
Required Report - public distribution Date: 2/28/2007 GAIN Report Number: CH7604 CH7604 China, Peoples Republic of Food Processing Ingredients Sector Food Processing 2007 Approved by: Joani Dong U.S. Agricultural Trade Office (ATO) Guangzhou Prepared by: Evid Liu, Daniel Taylor, Susan Zhang Report Highlights: Rapid growth continues in China's food processing industry, although it is labor rather than technology intensive. Annual revenue from the industry rose 17% to US$ 248 billion in 2005, the last available full year data. Strong economic growth and rapid urbanization have contributed to higher disposable incomes and increased demand from Chinese consumers for high quality processed foods at home and in restaurants. China is also becoming a profitable base for export oriented food processing. Double-digit growth also means increased demand for certain high quality U.S. ingredients, including soybeans, poultry products, seafood, fruit and nuts, high value dairy products and baking ingredients. Includes PSD Changes: No Includes Trade Matrix: No Annual Report Guangzhou [CH3] [CH] USDA Foreign Agricultural Service GAIN Report Global Agriculture Information Network Template Version 2.09
-
Upload
hoangthuan -
Category
Documents
-
view
218 -
download
1
Transcript of Food Processing Ingredients Sector 2007 - USDA · Web viewFood Processing Ingredients Sector...
Required Report - public distributionDate: 2/28/2007
GAIN Report Number: CH7604CH7604China, Peoples Republic ofFood Processing Ingredients SectorFood Processing2007
Approved by:Joani DongU.S. Agricultural Trade Office (ATO) GuangzhouPrepared by:Evid Liu, Daniel Taylor, Susan Zhang
Report Highlights:Rapid growth continues in China's food processing industry, although it is labor rather than technology intensive. Annual revenue from the industry rose 17% to US$ 248 billion in 2005, the last available full year data. Strong economic growth and rapid urbanization have contributed to higher disposable incomes and increased demand from Chinese consumers for high quality processed foods at home and in restaurants. China is also becoming a profitable base for export oriented food processing. Double-digit growth also means increased demand for certain high quality U.S. ingredients, including soybeans, poultry products, seafood, fruit and nuts, high value dairy products and baking ingredients.
Includes PSD Changes: NoIncludes Trade Matrix: No
Annual ReportGuangzhou [CH3]
[CH]
USDA Foreign Agricultural Service
GAIN ReportGlobal Agriculture Information Network
Template Version 2.09
GAIN Report - CH7604 Page 2 of 46
Executive Summary............................................................................................3I. Background...............................................................................................4
1.1 China Food Industry....................................................................................................41.2 Mooncake Festival - Golden Opportunity for Food Industry..........................................5
II. Business Environment for Food Industry......................................................62.1 Government Encouraging Healthy Development of Food Industry..............................62.2 Steady Economic Growth Fueling Food Related Sectors..............................................72.3 Sociologic Trends Diversifying Food Processing...........................................................92.4 Technical Under-development In Food Industry.........................................................11
III. Market Situation....................................................................................123.1 Sector Size................................................................................................................123.2 Sector Geographic....................................................................................................133.3 Sector Growth...........................................................................................................143.4 Consumer Trends and Sales Patterns.........................................................................163.5 Challenges and Opportunities...................................................................................25
IV. Road Map for Market Entry.......................................................................284.1 Entry Strategy...........................................................................................................284.2 Distribution...............................................................................................................294.3 Company Profiles......................................................................................................314.4 Sector Trends............................................................................................................33
V. Competition.............................................................................................365.1 Domestic Competition...............................................................................................365.2 Import Competition - 2006........................................................................................37
5.2.1 Soybeans (HS Code: 1201)................................................................................375.2.2 Fish and Seafood (HS Code: 03).........................................................................385.2.3 Meat (HS Code: 02)............................................................................................385.2.4 Edible Fruit & Nuts (HS Code: 08).......................................................................395.2.5 Dairy Products (HS Code: 04).............................................................................405.2.6 Preserved Food (HS Code: 20)............................................................................415.2.7 Cereal (HS Code: 10).........................................................................................415.2.8 Fats & Oils (HS Code: 15)....................................................................................425.2.9 Vegetables (HS Code: 07)..................................................................................435.2.10 Preparations of flour (HS Code: 1901).............................................................43
VI. Good Product Prospects............................................................................44VII. Post Contact and Further Information........................................................................47
Executive Summary
This report examines the fast growing food ingredients market in China. It reviews the business environment for the food industry, current market situation, entry road map to China, competition
UNCLASSIFIED USDA Foreign Agricultural Service
GAIN Report - CH7604 Page 3 of 46
of ingredient supplies to China and suggests good product prospects. Latest available statistical data on a calendar year basis are cited in the report; however, readers should bear in mind that last data lag the current situation.
China’s robust economy fuels the fast development of its food industry. Recent years have seen progressive evolvement in the industry, along with the country’s strong economic growth and tremendous improvement of living standards. Industry insiders prudently estimate the overall growth rate of the industry ranging from 15-20 percent, despite various estimates from different sources. By 2005, there were 125,091 registered food enterprises with annual combined sales revenue of over US$ 194.6 billion, a 24 percent increase from the previous year. The industry, mainly consisting of small size private enterprise and operating at low level of management and technical know-how, is a very fragmented one, with many top players only holding a single-digit market share in their respective sectors. The food industry is concentrated in the three coastal regions of Shanghai, Guangdong and Shandong.
Fast urbanization, consumers’ increasing disposable income and expenditure on food are the drivers to the industry’s continuous growth. Some sectors, such as bakery and dairy, are growing at a much faster pace than the overall industry. Top players in these sectors have achieved better economies of scale. Existence of regional variation of food consumption makes China a loosely connected group of regional markets, rather than a single large market which condenses the fragmentary feature of the food market. Therefore, it is not surprising that by far no one single company leads the market.
Big cities in affluent regions lead consumption trends that soon spread to nearby areas. Changing lifestyles impact food consumption and diet: rich protein, lower calorie, health, convenience and diversity are preferred for food. Increased numbers of supermarkets and hypermarkets displace conventional wet markets for food purchases. The fast growing hotel and restaurant sectors and quickening life pace have made dining out more frequent. All these boost the demand for processed food. The rapidly growing market provides many promising opportunities for U.S. food ingredients exports. Meanwhile there are challenges.
Understanding the market and establishing relationships with local importers and traders are crucial for U.S. ingredients exporters who want to enter the fragmented China market. Distribution systems are complicated, involving parties from importers, distributors, logistics providers, customs clearance agent, etc.
This report also analyzes the competition in China market. China itself as one of the largest agricultural nations in the world, produces a large volume of food ingredients for domestic consumption as well as for export. In addition, China also imports substantial amount of food to meet domestic demand. Good product prospects are suggested based on competition analysis.
I. Background
1.1 China Food Industry
China’s population is over 1.3 billion and growing by nearly 8 million, or 0.6 percent, annually. Its per capita GDP is approximately US$ 1,750, and its economy has sustained an annual growth
UNCLASSIFIED USDA Foreign Agricultural Service
GAIN Report - CH7604 Page 4 of 46
rate of 9 percent. China is currently the sixth largest economy in the world and is predicted to surpass Britain and France as the world’s fourth largest in 2006. Its major agricultural products include rice, wheat, potatoes, sorghum, peanuts, tea, millet, barley, cotton, oilseed, pork, and fish.
China is one of the world’s largest consumers of food. For example, China consumes 51 percent of the world’s pork, 33 percent of rice, 19 percent of ice cream, 19 percent of poultry and 12 percent of beef. In raw figures China consumes 8.5 million tons of meat per year, 40 million tons of vegetables and over 12.5 million tons of fruit. According to 2005 official statistics, food constituted over 37 percent of the average urban household’s annual consumption expenditure.
Only about 30 percent of food in China is processed, compared to about 60-80 percent in western nations. While most consumers still prefer to purchase fresh foods, the market for processed foods is growing, especially in urban areas where higher concentrations of wealth and busier lifestyles have led many to seek out more convenient alternatives to cooking with fresh ingredients. China’s current sales of packaged foods constitute nearly 4.0 percent of the world market, and it is estimated that in 2009 it will rise to more than 5 percent with a value of over US$ 71.9 billion. Demands for healthier choices, convenience, and trends turning the younger population’s tastes toward western styles of food are opening the door to high quality imported ingredients. Recent food poisoning incidents have also awakened consumer concern over food quality and safety, and many now look towards food products that are packaged with big-name brands they feel they can trust. In many urban areas, 40 percent of food is processed which shows promising growth. Furthermore, China’s inexpensive labor makes it a profitable center for export-oriented production.
The food processing industry in China is based around the east coast urban regions of Guangzhou, Shanghai and Beijing. In 2005, according to official statistics, there were 23,647 food-processing ventures in China that realized annual sales revenue in excess of 5 million RMB (approximately US$ 600,000). The total sales revenue for the industry was US$ 213 billion. Note that numbers and statistics in China should be used as guidelines since many statistics, both official and unofficial data can be misleading or inaccurate. While the Chinese government only keeps track of enterprises with sales in excess of RMB 5 million per year, there are thousands of small outfits in operation as the industry is still very fragmented. In fact, it is not uncommon to find newspaper articles reporting that China has over 900,000 food processing ventures on the mainland, from mom-and-pop storefronts to multinational corporations. The fragmented nature of the industry is bolstered by research that shows that many of the largest ventures have less than a 5 percent market share in their respective sub-sectors.
Official statistics report that the industry grew 35.2 percent in sales in 2004-2005 and 147.3 % percent from 2001 to 2005. This continued growth is highlighted by the fact that from 2001 to 2005, sales of packaged foods rose 39%. These numbers are staggering, but many industry insiders feel that it is safer to assume double-digit growth in excess of 10 percent. The president of the China Food Industry Association was recently quoted as expecting 10 -12 percent annual growth for the food processing sector. While this outlook is less than the official numbers of 16 percent and 23 percent, it still shows strong growth with excellent potential. In fact, some estimate that the output of the food industry by the year 2010 may double from that of the year 2000, when it was valued at about RMB 800 billion (US$ 102.7 billion).
Retail sales of processed food as well as restaurant and catering industries have also shown impressive growth in the double-digit range over the last few years. Packaged foods, especially baked goods, dairy products, oils and fats, baby food and ice cream have all demonstrated exceptional growth in recent years. Multinational fast-food chains such as KFC and McDonald's
UNCLASSIFIED USDA Foreign Agricultural Service
GAIN Report - CH7604 Page 5 of 46
continue to establish their presence in China with already over 1,500 and 600 restaurants respectively as they look to the Chinese market as their main source of growth. Institutional catering is also on the rise as the number of factory workers skyrockets and companies outsource providing meals for employees.
1.2 Mooncake Festival - Golden Opportunity for Food Industry
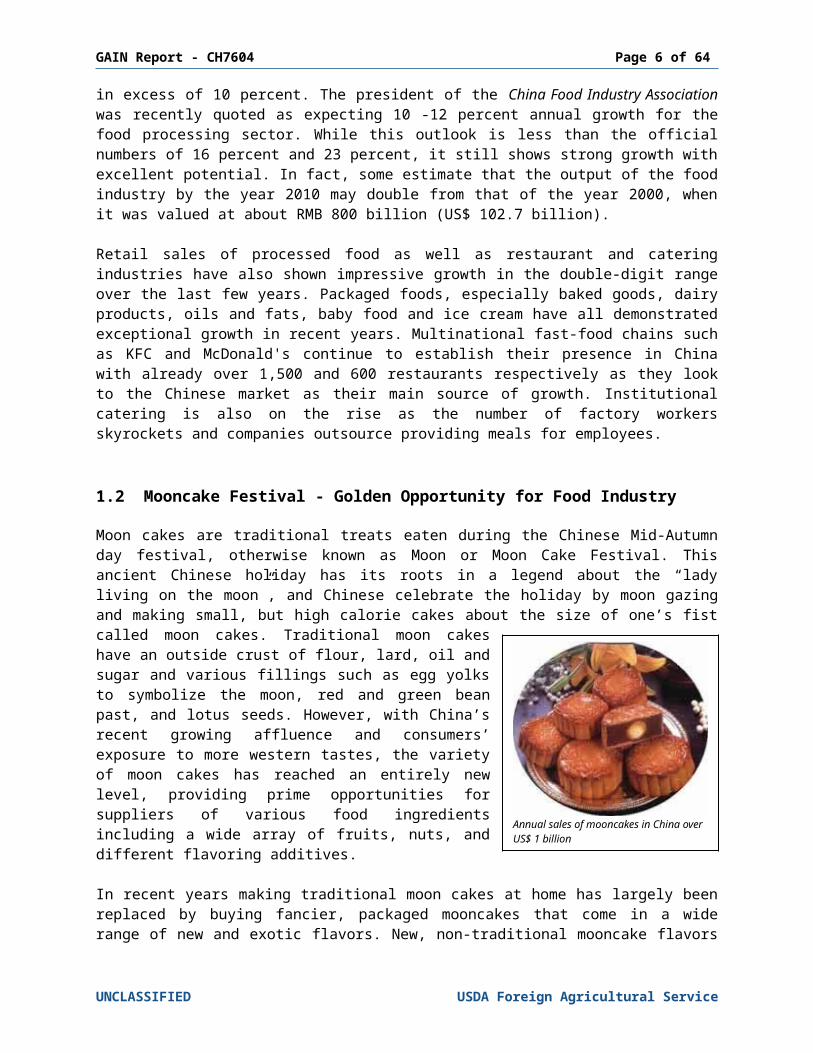
Moon cakes are traditional treats eaten during the Chinese Mid-Autumn day festival, otherwise known as Moon or Moon Cake Festival. This ancient Chinese holiday has its roots in a legend about the “lady living on the moon”, and Chinese celebrate the holiday by moon gazing and making small, but high calorie cakes about the size of one’s fist called moon cakes. Traditional moon cakes have an outside crust of flour, lard, oil and sugar and various fillings such as egg yolks to symbolize the moon, red and green bean past, and lotus seeds. However, with China’s recent growing affluence and consumers’ exposure to more western tastes, the variety of moon cakes has reached an entirely new level, providing prime opportunities for suppliers of various food ingredients including a wide array of fruits, nuts, and different flavoring additives.
In recent years making traditional moon cakes at home has largely been replaced by buying fancier, packaged mooncakes that come in a wide range of new and exotic flavors. New, non-traditional mooncake flavors include chocolate, green tea, ice-cream, and mooncakes with fruit, nuts, and meat fillings. Foreign owned producers often promote these new flavors. In fact, even Starbucks and Haagen-Dazs have taken advantage of these new demands by offering coffee-flavored and ice-cream flavored mooncakes. Although these new varieties of mooncakes do not come cheap, sometimes costing as much as 300 RMB or around US$ 40, they have become very popular among customers in affluent urban areas. Since it is common to give mooncakes as gifts to friends, family, and employers during the holiday, this willingness to spend is not surprising given the strong connection between gift-giving and the Chinese concept of “face”, which demonstrates respect for the recipients and social status of the gift givers.
Table 1.1 Mooncake Sales in ChinaYear 2003 2004 2005
Sales Revenue (million RMB) 7,000 8,400 10,000Change (%) 20% 19%Data Source: China Food Industry Association, Euromonitor International Packaged mooncake sales in 2005 were a staggering 10 billion RMB (US$ 1.25 billion), representing a 19 percent growth from the previous year. Although only 5,000 mooncake manufactures are officially registered, many hotels and restaurants will produce and sell their own mooncakes to take advantage of the high demand during peak season. The sale season for mooncakes is very short. Even though promotion and presales events sometimes happen as early as June, the peak time for sales of mooncakes only last about two weeks between September and October. The mid-autumn festival fell on October 6 for 2006. During this time, domestic competition is very high, with lots of aggressive promotions to take advantage of the short season. There is not yet a widely recognized national brand, only leading brands by region. Top brands in the East are Xing Hua Lou and Guan Sheng Yuan. The North and Northeast region is led by Dao Xiang Cun and Hao Li Lai, number one and two respectively. Guangzhou
UNCLASSIFIED USDA Foreign Agricultural Service
Annual sales of mooncakes in China over US$ 1 billion
GAIN Report - CH7604 Page 6 of 46
Jiujia and Lian Xiang Lou are the top brands of Southern China. An estimated 20 percent annual growth of mooncake sales and emphasis on new and innovative flavors will continue the demand for high quality ingredients from U.S. producers.
II. Business Environment for Food Industry
Recent years have seen progressive development in China’s food processing and manufacturing industry, along with the country’s dynamic economic growth and tremendous improvement of citizen’s living standards. In 20051, state-owned and commercial-sized non-state-owned food enterprises realized production of 2 trillion RMB (US$ 254 billion), a 97.2 percent increase from year 2000. Grain processing, meat processing and dairy processing sectors experienced over 20 percent annual growth from 2000 through 2005. The government’s encouraging policy, steadily robust economy growth, increasing life quality and living standards, as well as development of food processing infrastructure and technology, have all contributed and will continue to support the fast growth of food processing industry in the coming years.
2.1 Government Encouraging Healthy Development of Food Industry
The food industry, as a means to improve living standards and contribute to domestic production, has been considered key to economic development planning by the central and local governments. Supportive policies and regulations have been made and enforced to direct the healthy growth of the industry. As a result, the industry has enjoyed fast growth of food production and experienced industrialization in all areas, from ingredients production, food processing to food manufacturing. Table 2.1 details the production growth in some processed food categories.
A series of regulations, measurements and standards have been enforced nationwide to regulate the food quality and safety. Examples include “Action Plan of Food Safety” by the Ministry of Health (MOH), “Implementation Plan of Concern-Free Food Project” and “Directives of HACCP Implementation for Foodstuff Enterprises” by State Food and Drugs Administration (SFDA). Advocacy occurs often from different stakeholders to amend the current governing law “Food Hygiene Law”, issued in 1995, which has apparently lagged behind the fast growing food processing industry, especially in governing food ingredient farms where safety issues often originates.
Table 2. 1 Output of Processed Food in China
Commodities Production (1,000 tons) Accumulated Growth *CAGR Year 2000 Year 2005
Wheat Flour 27,590 39,220 42.2% 7.3%Edible Veg Oil 8,370 16,120 92.6% 14.0%Meat 61,250 77,430 26.4% 4.8%-including manufactured meat products 4,070 8,500 108.8% 15.9%Dairy 2,080 13,100 529.8% 44.5%-including liquid dairy products 1,250 11,460 816.8% 55.8%
1 Compendium for Food Industry Development in the State 11th Five-Year Plan, State Development and Reform Commission of PRC, Ministry of Agriculture of PRC, Ministry of Science and Technology of PRC, and China National Light Industry Council, 2006
UNCLASSIFIED USDA Foreign Agricultural Service
GAIN Report - CH7604 Page 7 of 46
Convenient Food 2,500 4,580 83.2% 12.9%Canned Food 1,780 3,600 102.2% 15.1%* Compound Annual Growth RateSource: Compendium for Food Industry Development in the 11th Five-Year Plan
The central government’s economic planning also reflects encouragement of food industry development. A series of objectives has been set in the national “Compendium for Food Industry Development in the 11th Five-Year Plan” for the period from 2006 through 2010, including:
1. Fast growth in industry size and profitability: total output of food industry from RMB 2,035 billion (US$ 254 billion) in year 2005 to RMB 4,090 billion (US$ 524 billion) in year 2010, profit from RMB 336.5 billion (US$ 42.1 billion) to RMB 676.8 billion (US$ 86.8 billion), both at a annual growth rate of 15 percent;
2. Establishment of a national system of food technology and innovation, targeting 40% contribution from food technology development to the industry total output;
3. Improvement of food safety infrastructure in an attempt to strengthen the public’s confidence on food safety, including food standards, food safety regulatory system, controlling and testing technology system, food safety certification / accreditation system, creditability system and food safety information system
4. Encouraging emergency of food enterprise giants by integrating resources across countries, areas, industries, and ownership
5. Significant increase of share in food processing and manufacturing6. Continuous improvement on public nutrition7. Sustainable development, in terms of waste generation and recycle, consumption of
energy and water, and reduction of pollutant emission These objectives indicate that the development of the industry in the next five years will not only lead to a larger-sized food market, but also one with higher levels of governance, product quality and productivity, technology and management upgrade and more added value to the chain from farm to consumers. Unbalanced regional development across the country remains one of the main barriers for the industry’s growth in the nation.
2.2 Steady Economic Growth Fueling Food Related Sectors
China’s steadily robust growth of economy has fueled almost all industries in its economy, among which food industry is one of the fastest growing sectors of promising potential. Economic devel-opment impacts the food industry: it pushes development of food product supply and stimulates demand of higher quality and larger volume of food from increasing numbers of consumers.
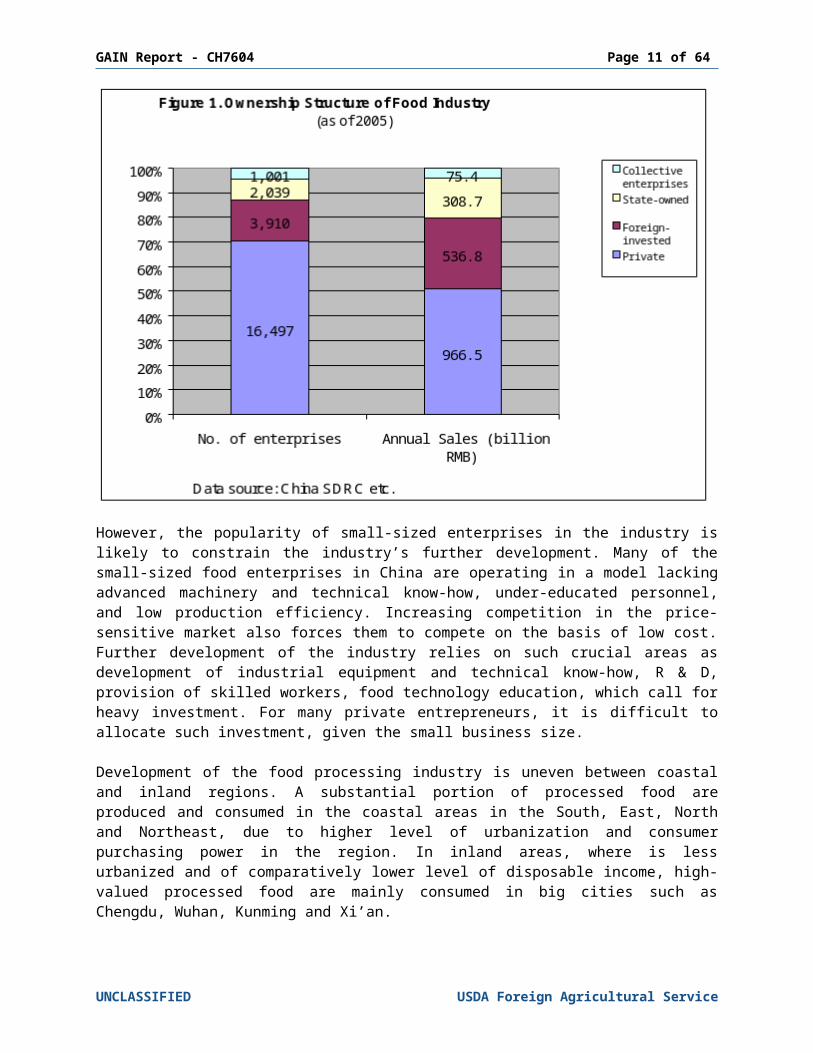
Growth potential and the lucrative profit margin in food industry have lured domestic and foreign investment. This in turn results in diversified ownership structure of the industry, reinforcing competition in the market. Low entry barriers have enabled large numbers of private investors with relatively small amounts of funds entering the industry. By 20051, private enterprises constituted the majority of the industry, accounting for 70.4 percent of the enterprise number, and 51.2 percent of the industry’s annual sales (Figure 1). However, the private sector has the smallest average business size, with average annual sales per enterprise of only 59 million RMB (US$ 7.4 million), about 39% of its state-owned counterparts or 43% of its foreign-invested counterparts.
1 China (2006) Compendium for Food Industry Development in the State 11th Five-Year Plan, Beijing, SDRC et al.
UNCLASSIFIED USDA Foreign Agricultural Service
GAIN Report - CH7604 Page 8 of 46
However, the popularity of small-sized enterprises in the industry is likely to constrain the industry’s further development. Many of the small-sized food enterprises in China are operating in a model lacking advanced machinery and technical know-how, under-educated personnel, and low production efficiency. Increasing competition in the price-sensitive market also forces them to compete on the basis of low cost. Further development of the industry relies on such crucial areas as development of industrial equipment and technical know-how, R & D, provision of skilled workers, food technology education, which call for heavy investment. For many private entrepreneurs, it is difficult to allocate such investment, given the small business size.
Development of the food processing industry is uneven between coastal and inland regions. A substantial portion of processed food are produced and consumed in the coastal areas in the South, East, North and Northeast, due to higher level of urbanization and consumer purchasing power in the region. In inland areas, where is less urbanized and of comparatively lower level of disposable income, high-valued processed food are mainly consumed in big cities such as Chengdu, Wuhan, Kunming and Xi’an.
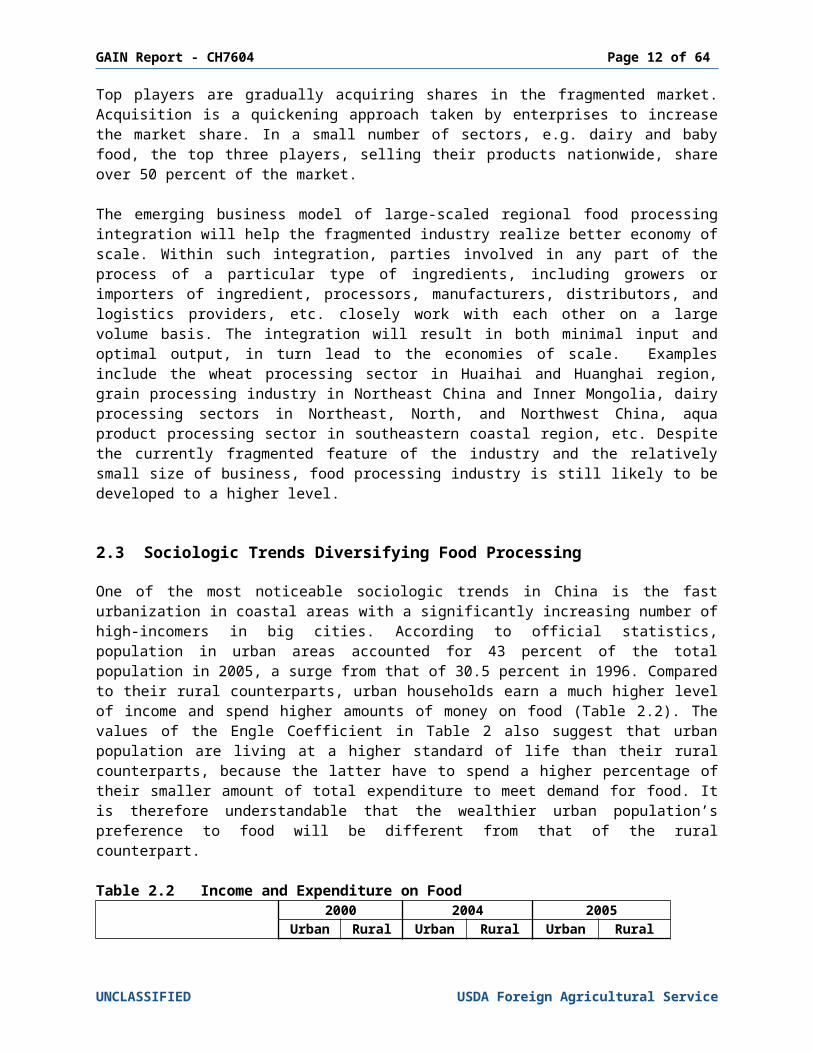
Top players are gradually acquiring shares in the fragmented market. Acquisition is a quickening approach taken by enterprises to increase the market share. In a small number of sectors, e.g. dairy and baby food, the top three players, selling their products nationwide, share over 50 percent of the market.
The emerging business model of large-scaled regional food processing integration will help the fragmented industry realize better economy of scale. Within such integration, parties involved in any part of the process of a particular type of ingredients, including growers or importers of ingredient, processors, manufacturers, distributors, and logistics providers, etc. closely work with each other on a large volume basis. The integration will result in both minimal input and optimal
UNCLASSIFIED USDA Foreign Agricultural Service
GAIN Report - CH7604 Page 9 of 46
output, in turn lead to the economies of scale. Examples include the wheat processing sector in Huaihai and Huanghai region, grain processing industry in Northeast China and Inner Mongolia, dairy processing sectors in Northeast, North, and Northwest China, aqua product processing sector in southeastern coastal region, etc. Despite the currently fragmented feature of the industry and the relatively small size of business, food processing industry is still likely to be developed to a higher level.
2.3 Sociologic Trends Diversifying Food Processing
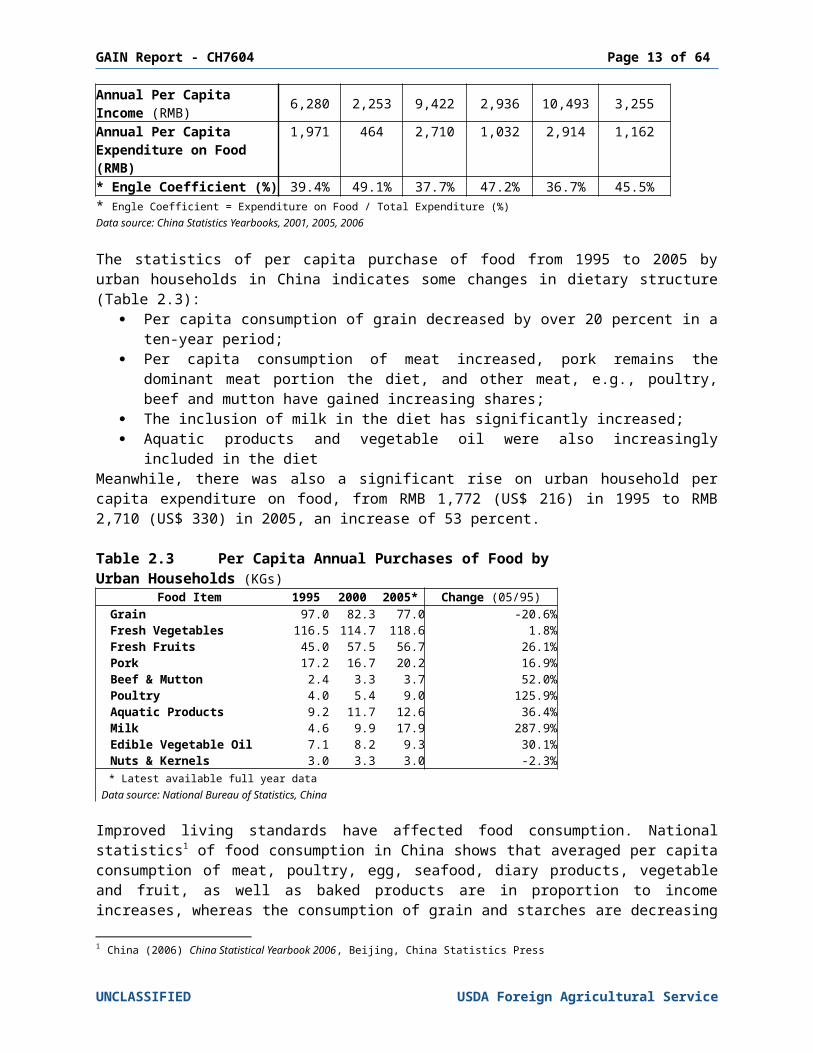
One of the most noticeable sociologic trends in China is the fast urbanization in coastal areas with a significantly increasing number of high-incomers in big cities. According to official statistics, population in urban areas accounted for 43 percent of the total population in 2005, a surge from that of 30.5 percent in 1996. Compared to their rural counterparts, urban households earn a much higher level of income and spend higher amounts of money on food (Table 2.2). The values of the Engle Coefficient in Table 2 also suggest that urban population are living at a higher standard of life than their rural counterparts, because the latter have to spend a higher percentage of their smaller amount of total expenditure to meet demand for food. It is therefore understandable that the wealthier urban population’s preference to food will be different from that of the rural counterpart.
Table 2.2 Income and Expenditure on Food
2000 2004 2005
Urban Rural Urban Rural Urban RuralAnnual Per Capita Income (RMB) 6,280 2,253 9,422 2,936 10,493 3,255
Annual Per Capita Expenditure on Food (RMB) 1,971 464 2,710 1,032 2,914 1,162
* Engle Coefficient (%) 39.4% 49.1% 37.7% 47.2% 36.7% 45.5%* Engle Coefficient = Expenditure on Food / Total Expenditure (%)Data source: China Statistics Yearbooks, 2001, 2005, 2006
The statistics of per capita purchase of food from 1995 to 2005 by urban households in China indicates some changes in dietary structure (Table 2.3):
Per capita consumption of grain decreased by over 20 percent in a ten-year period; Per capita consumption of meat increased, pork remains the dominant meat portion the
diet, and other meat, e.g., poultry, beef and mutton have gained increasing shares; The inclusion of milk in the diet has significantly increased; Aquatic products and vegetable oil were also increasingly included in the diet
Meanwhile, there was also a significant rise on urban household per capita expenditure on food, from RMB 1,772 (US$ 216) in 1995 to RMB 2,710 (US$ 330) in 2005, an increase of 53 percent.
Table 2.3 Per Capita Annual Purchases of Food by Urban Households (KGs)Food Item 1995 2000 2005* Change (05/95)
Grain 97.0 82.3 77.0 -20.6% Fresh Vegetables 116.5 114.7 118.6 1.8% Fresh Fruits 45.0 57.5 56.7 26.1% Pork 17.2 16.7 20.2 16.9% Beef & Mutton 2.4 3.3 3.7 52.0% Poultry 4.0 5.4 9.0 125.9% Aquatic Products 9.2 11.7 12.6 36.4% Milk 4.6 9.9 17.9 287.9%
UNCLASSIFIED USDA Foreign Agricultural Service
GAIN Report - CH7604 Page 10 of 46
Edible Vegetable Oil 7.1 8.2 9.3 30.1% Nuts & Kernels 3.0 3.3 3.0 -2.3% * Latest available full year data Data source: National Bureau of Statistics, China
Improved living standards have affected food consumption. National statistics1 of food consumption in China shows that averaged per capita consumption of meat, poultry, egg, seafood, diary products, vegetable and fruit, as well as baked products are in proportion to income increases, whereas the consumption of grain and starches are decreasing as the income increases. Households in the wealthiest decile in the country spend as much five times more as those in the lowest income decile on dairy and seafood products. The result suggests the trend that wealthier consumers prefer a diet of rich protein and vitamins, but low carbohydrate, fat and calorie.
Dining out has become more and more popular across the nation, especially in big cities. City dwellers, especially young people, frequently consume fast food or convenient food for the dairy meals such as breakfast or lunch, due to the quickening pace of life. Hectic life pace, higher living standards, increasing disposable income, as well as the fast development in restaurant sector have made the dining in a restaurant an affordable social event for gathering with family, friends, business contacts etc. Nice restaurants providing full service are very popular in evening or special occasions such as traditional festivals. The demand of dining out has also given rise to the development of western style restaurants that serve as a good channel to introduce foreign cuisine to many Chinese consumers.
Consumers’ pursuit of convenience is a driver to boost diversification of processed food market in China. Ready meals, breakfast cereals, instant noodles, baked items become increasingly popular. Retail chains carry a wide range of convenient food varieties to satisfy consumer demand.
Public consciousness of food safety has significantly increased. Incidents of food poisoning, food of poor quality, misuse of additive in food industry have commonly gained media exposure in recent years and damaged consumers’ confidence in food safety. Bear such concerns in mind, consumers favor products supplied by reliable companies. The government has strengthened surveillance and tightened punishment on malpractices. This will put those food manufacturers and processors operating at low levels in a disadvantageous position.
Consumers’ increasing consciousness of health and wellness has also ignited the trend favoring products that boost health. A national study2 of the public’s nutrition and health status unveils some health issues undermining the public’s health. Summarily, the current diet contains excessive meat and fat, but inadequate grain, dairy and soy products. Diseases derived from malnutrition still exist, especially in rural areas. The study also found increasing population suffering from high blood pressure, diabetes, overweight and abnormal blood lipid levels. Findings from this research suggest areas of potential demand for nutrition-fortified and functional food.
2.4 Technical Under-development In Food Industry
1 China (2006) China Statistical Yearbook 2006, Beijing, China Statistics Press2 Yang, X. (2006) ‘The Nutrition and Health Status of the Chinese People’, paper presented at the Food Summit in China 2006, Nov 5-7, Xiamen
UNCLASSIFIED USDA Foreign Agricultural Service
GAIN Report - CH7604 Page 11 of 46
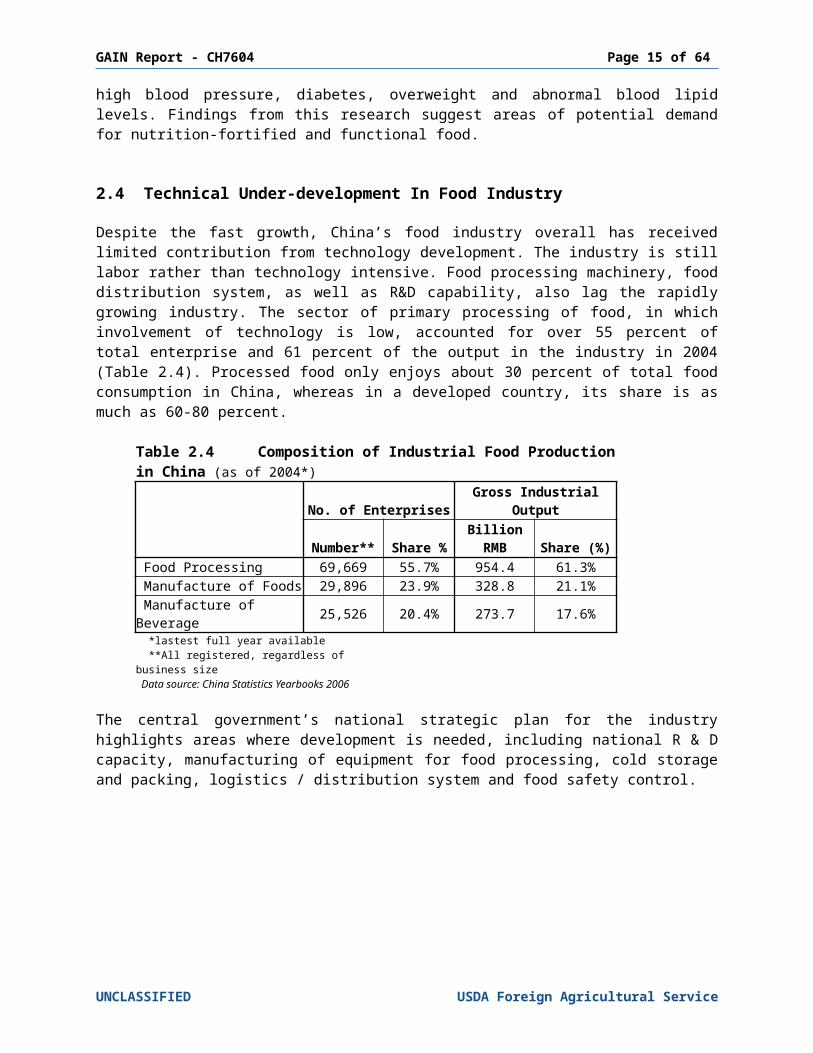
Despite the fast growth, China’s food industry overall has received limited contribution from technology development. The industry is still labor rather than technology intensive. Food processing machinery, food distribution system, as well as R&D capability, also lag the rapidly growing industry. The sector of primary processing of food, in which involvement of technology is low, accounted for over 55 percent of total enterprise and 61 percent of the output in the industry in 2004 (Table 2.4). Processed food only enjoys about 30 percent of total food consumption in China, whereas in a developed country, its share is as much as 60-80 percent.
Table 2.4 Composition of Industrial Food Production in China (as of 2004*)
No. of Enterprises Gross Industrial Output
Number** Share % Billion RMB Share (%) Food Processing 69,669 55.7% 954.4 61.3% Manufacture of Foods 29,896 23.9% 328.8 21.1% Manufacture of Beverage 25,526 20.4% 273.7 17.6% *lastest full year available **All registered, regardless of business size Data source: China Statistics Yearbooks 2006
The central government’s national strategic plan for the industry highlights areas where development is needed, including national R & D capacity, manufacturing of equipment for food processing, cold storage and packing, logistics / distribution system and food safety control.
UNCLASSIFIED USDA Foreign Agricultural Service
GAIN Report - CH7604 Page 12 of 46
III. Market Situation
The food processing industry had combined sales of US$ 248 billion in 2005, an increase of 17 percent on 2004.
The industry is mainly based in Shanghai, Guangdong and Shandong provinces. The industry is very fragmented with many small-scale operations, but there is slow
growth of larger firms as consolidation begins. Double-digit growth is a safe assumption based on current industrial and retail statistics. The primary processing sector has demonstrated the highest consistent growth in both
sales revenue and number of players. Expect strongest growth rate in baby food, oils and fats, dairy, baked goods, and dried
foods. Expect strong growth in all sub-sectors.
3.1 Sector Size
Official statistics separate industrial food production into three categories in China: food processing, food manufacturing and beverage manufacturing. The food-processing sector includes primary activities such as rice milling, flour milling, oil refining, sugar refining, slaughtering, salt processing, feed processing, and aquatic product processing. The food-manufacturing sector is composed of packaged food, pastries and confections, dairy products, canned foods, fermented products, and condiments. The beverage sector involves production of alcoholic beverages (i.e., distilled spirits, beer and wine), soft drinks and tea.
In 2005 the industry realized revenue of RMB 2,035 billion (US$ 248 billion), increase of 17 percent on the previous year. There were a group of 125,091 registered enterprises who respectively gained annual sales of over 5 million (US$ 610 thousand). The group had combined annual sales revenue over US$ 194.6 billion, increase of 24 percent compared to previous year, a rate much higher than the industry’s average growth rate (17%). This reflected that the larger-size group in general outperformed the group of smaller size.
As Table 2.4 suggests, majority of these enterprises are involved in primary food-processing, comprising more than half of the industry while food manufacturing and beverage manufacturing account for approximately 20 percent each.
The industry is still very fragmented. As discussed in Section 1.3, while there are a few giants, and merges and acquisitions continue, the bulk of food processing is done by medium-sized outfits. For example Statistics from China’s Dairy Industry Association show that there are over 1,500 dairy processors in China and that 90 to 95 percent are small and medium-sized enterprises. In retail sales of packaged food Ting Hsin International Group is the industry’s largest player and only has three percent of the overall market share. This is most likely because the industry is still very young. Furthermore, with disparate incomes between urban and rural residents, regional variations in taste and, most importantly, limited infrastructure it will take some time for the industry to consolidate and capitalize on economies of scale.
UNCLASSIFIED USDA Foreign Agricultural Service
GAIN Report - CH7604 Page 13 of 46
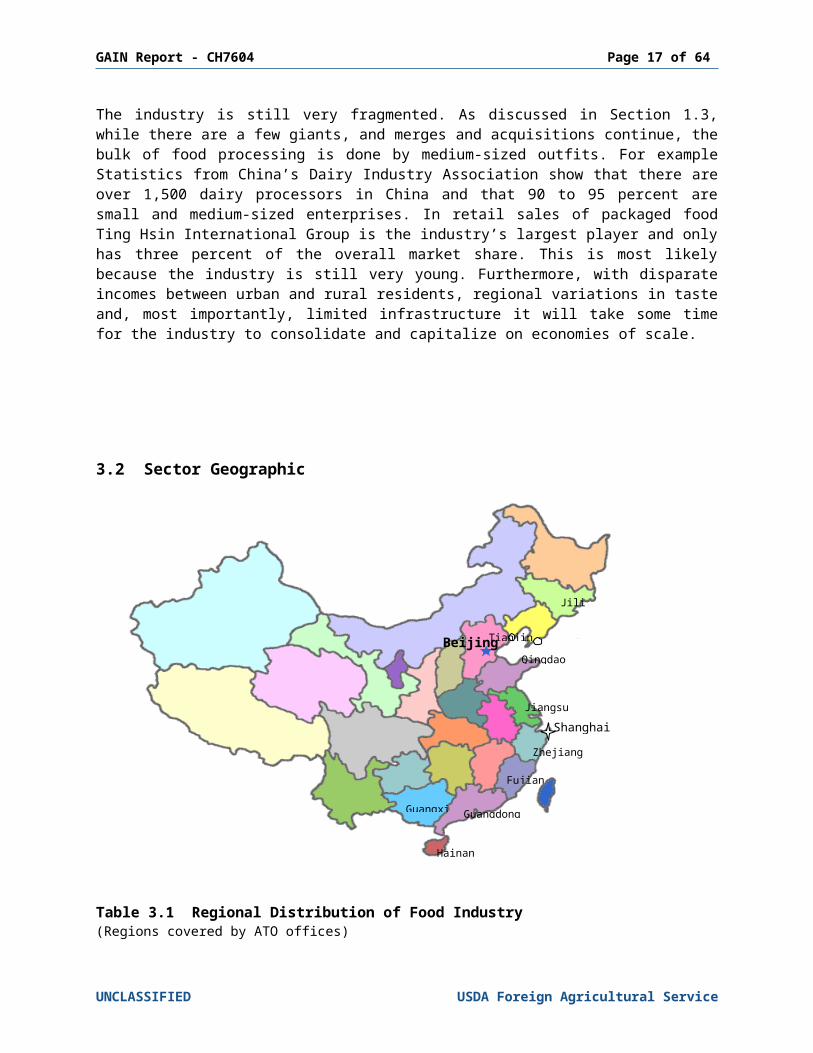
3.2 Sector Geographic
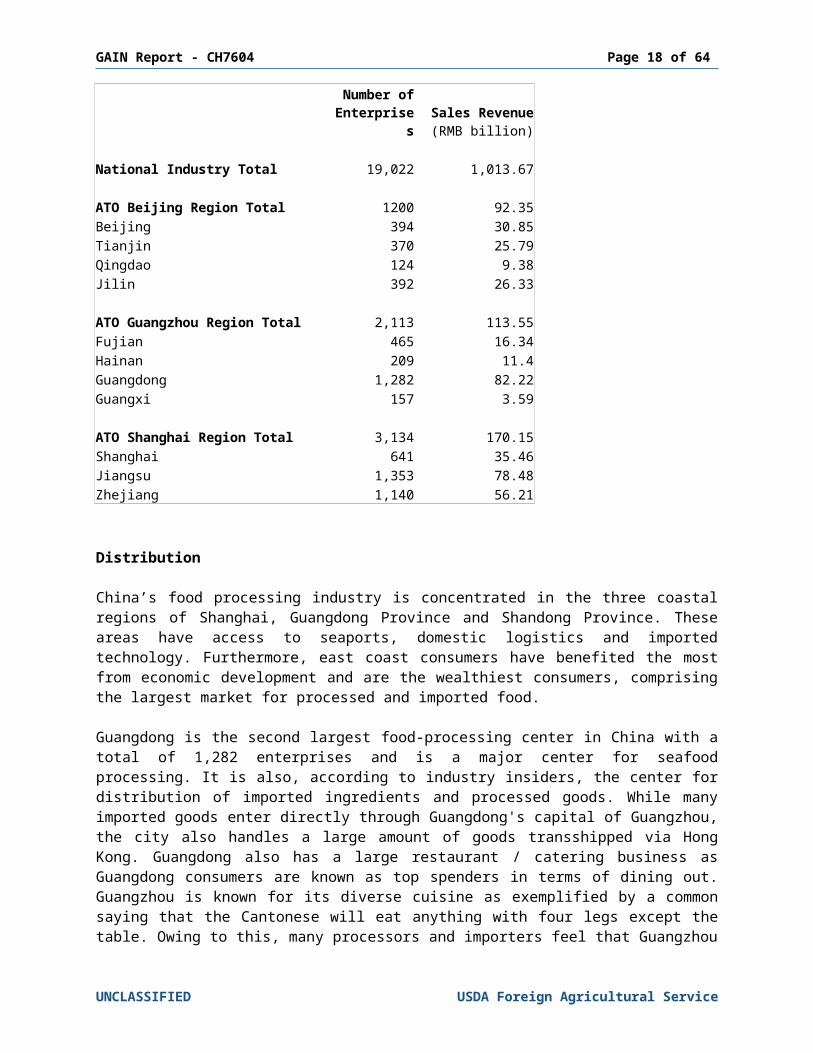
Table 3.1 Regional Distribution of Food Industry (Regions covered by ATO offices)
Number of
EnterprisesSales Revenue
(RMB billion)
National Industry Total 19,022 1,013.67
ATO Beijing Region Total 1200 92.35Beijing 394 30.85Tianjin 370 25.79Qingdao 124 9.38Jilin 392 26.33
ATO Guangzhou Region Total 2,113 113.55Fujian 465 16.34Hainan 209 11.4Guangdong 1,282 82.22Guangxi 157 3.59
ATO Shanghai Region Total 3,134 170.15Shanghai 641 35.46Jiangsu 1,353 78.48Zhejiang 1,140 56.21
Distribution
UNCLASSIFIED USDA Foreign Agricultural Service
Guangdong
Fujian
Guangxi
Hainan
Beijing
Jilin
Jiangsu
Zhejiang
Shanghai
TianjinQingdao
GAIN Report - CH7604 Page 14 of 46
China’s food processing industry is concentrated in the three coastal regions of Shanghai, Guangdong Province and Shandong Province. These areas have access to seaports, domestic logistics and imported technology. Furthermore, east coast consumers have benefited the most from economic development and are the wealthiest consumers, comprising the largest market for processed and imported food.
Guangdong is the second largest food-processing center in China with a total of 1,282 enterprises and is a major center for seafood processing. It is also, according to industry insiders, the center for distribution of imported ingredients and processed goods. While many imported goods enter directly through Guangdong's capital of Guangzhou, the city also handles a large amount of goods transshipped via Hong Kong. Guangdong also has a large restaurant / catering business as Guangdong consumers are known as top spenders in terms of dining out. Guangzhou is known for its diverse cuisine as exemplified by a common saying that the Cantonese will eat anything with four legs except the table. Owing to this, many processors and importers feel that Guangzhou is a good place to test out foreign foods, as they will likely find early acceptance here allowing a foothold in the Chinese market.
Income, population and growth have all made the Yangtze River delta a major center for the food processing industry, and an important market for U.S. food ingredients. Although Shanghai’s industry remains large, many food processors have moved to lower-cost areas in neighboring Jiangsu and Zhejiang provinces, and the food processing industries in these areas are now larger than Shanghai. Jiangsu is the largest of the three, with a 2003 sales value of $9.5 billion in an industry that employs over 214,000 people. The key cities for Jiangsu’s food manufacturing industry include Zhanjiagang, Kunshan and Suzhou. Provincial statistics indicate that profit margins are tight, particularly for food processing (margins for beverage manufacturers a considerably higher). As a result, manufacturers in the Shanghai region are looking for ways to improve or otherwise distinguish their products from the competition. Many are turning to imported ingredients.
3.3 Sector Growth
The food industry in China has experienced robust growth in recent years, which is no surprise given population increases by approximately 8 million people per year. It is safe to assume double-digit growth will continue in the near future as the percentage of processed food in Chinese diets continues to increase. As mentioned previously, only about 30 percent of food in China is processed, compared to about 60 - 80 percent in more developed countries. Clearly there is more room for growth.
As table 3.2 suggests, while the growth of enterprises has slowed, especially in the beverage sector, sales revenue continues to grow. This is due to the fact that while mergers and competition have either swallowed companies or put others out of business, the market continues to grow. (Again, keep in mind that this may only be true of larger scale operations as there are still thousands of small-scale operations in China) While official statistics show 2004-2005 growth in sales revenue at 35.5% percent and 2001-2005 growth at 147 percent it is prudent to assume slower, yet still stable growth. Most industry insiders project a continued growth in the food processing industry of between 15 percent and 20 percent. Again, when dealing with China, assume stable growth but take all statistics with a word of caution.
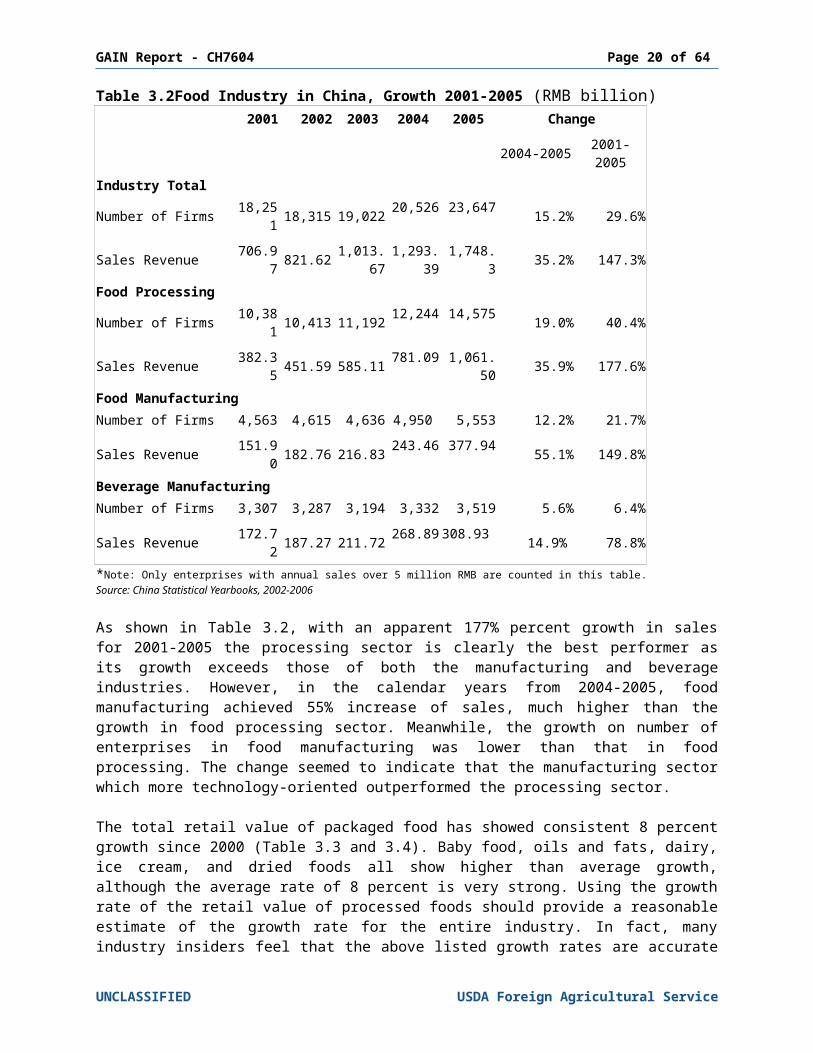
Table 3.2 Food Industry in China, Growth 2001-2005 (RMB billion)
UNCLASSIFIED USDA Foreign Agricultural Service
GAIN Report - CH7604 Page 15 of 46
2001 2002 2003 2004 2005 Change2004-2005 2001-2005
Industry TotalNumber of Firms 18,251 18,315 19,022 20,526 23,647 15.2% 29.6%
Sales Revenue 706.97 821.62 1,013.67 1,293.39 1,748.3 35.2% 147.3%Food ProcessingNumber of Firms 10,381 10,413 11,192 12,244 14,575 19.0% 40.4%
Sales Revenue 382.35 451.59 585.11 781.09 1,061.50 35.9% 177.6%Food ManufacturingNumber of Firms 4,563 4,615 4,636 4,950 5,553 12.2% 21.7%
Sales Revenue 151.90 182.76 216.83 243.46 377.94 55.1% 149.8%Beverage ManufacturingNumber of Firms 3,307 3,287 3,194 3,332 3,519 5.6% 6.4%
Sales Revenue 172.72 187.27 211.72 268.89 308.93 14.9% 78.8%*Note: Only enterprises with annual sales over 5 million RMB are counted in this table.Source: China Statistical Yearbooks, 2002-2006
As shown in Table 3.2, with an apparent 177% percent growth in sales for 2001-2005 the processing sector is clearly the best performer as its growth exceeds those of both the manufacturing and beverage industries. However, in the calendar years from 2004-2005, food manufacturing achieved 55% increase of sales, much higher than the growth in food processing sector. Meanwhile, the growth on number of enterprises in food manufacturing was lower than that in food processing. The change seemed to indicate that the manufacturing sector which more technology-oriented outperformed the processing sector.
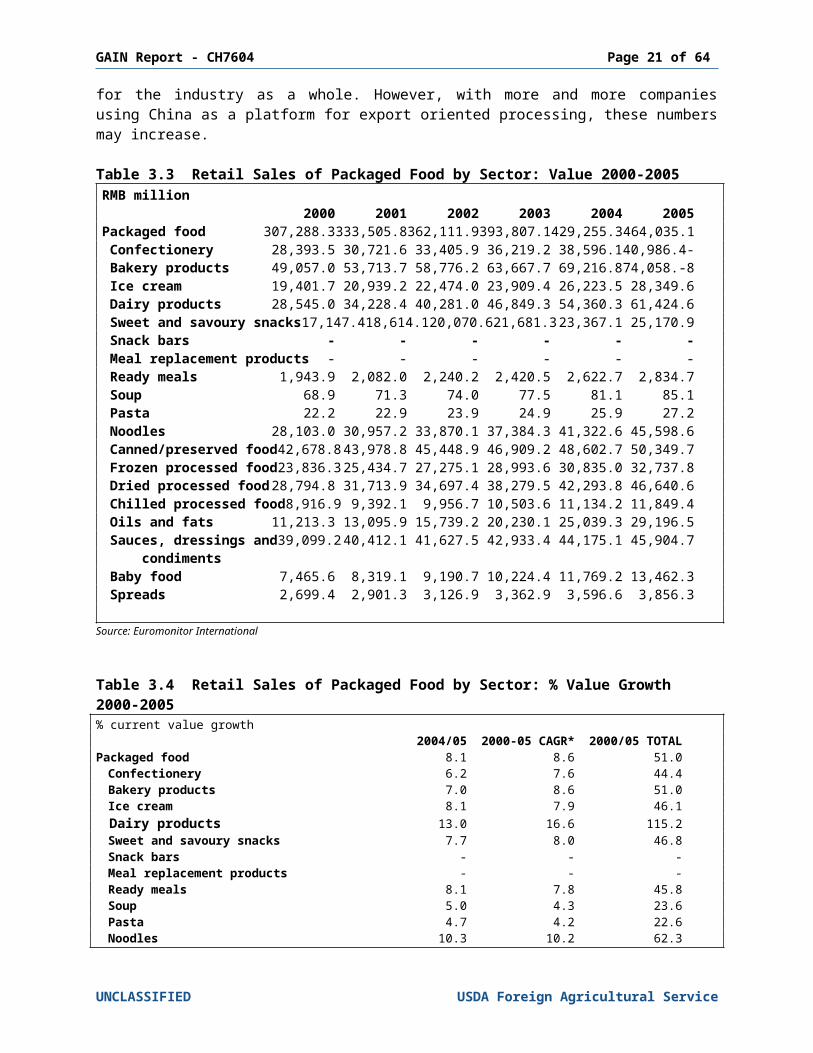
The total retail value of packaged food has showed consistent 8 percent growth since 2000 (Table 3.3 and 3.4). Baby food, oils and fats, dairy, ice cream, and dried foods all show higher than average growth, although the average rate of 8 percent is very strong. Using the growth rate of the retail value of processed foods should provide a reasonable estimate of the growth rate for the entire industry. In fact, many industry insiders feel that the above listed growth rates are accurate for the industry as a whole. However, with more and more companies using China as a platform for export oriented processing, these numbers may increase.
Table 3.3 Retail Sales of Packaged Food by Sector: Value 2000-2005RMB million
2000 2001 2002 2003 2004 2005Packaged food 307,288.3 333,505.8 362,111.9 393,807.1 429,255.3 464,035.1 Confectionery 28,393.5 30,721.6 33,405.9 36,219.2 38,596.1 40,986.4- Bakery products 49,057.0 53,713.7 58,776.2 63,667.7 69,216.8 74,058.-8 Ice cream 19,401.7 20,939.2 22,474.0 23,909.4 26,223.5 28,349.6 Dairy products 28,545.0 34,228.4 40,281.0 46,849.3 54,360.3 61,424.6 Sweet and savoury snacks 17,147.4 18,614.1 20,070.6 21,681.3 23,367.1 25,170.9 Snack bars - - - - - - Meal replacement products - - - - - - Ready meals 1,943.9 2,082.0 2,240.2 2,420.5 2,622.7 2,834.7 Soup 68.9 71.3 74.0 77.5 81.1 85.1 Pasta 22.2 22.9 23.9 24.9 25.9 27.2 Noodles 28,103.0 30,957.2 33,870.1 37,384.3 41,322.6 45,598.6 Canned/preserved food 42,678.8 43,978.8 45,448.9 46,909.2 48,602.7 50,349.7 Frozen processed food 23,836.3 25,434.7 27,275.1 28,993.6 30,835.0 32,737.8
UNCLASSIFIED USDA Foreign Agricultural Service
GAIN Report - CH7604 Page 16 of 46
Dried processed food 28,794.8 31,713.9 34,697.4 38,279.5 42,293.8 46,640.6 Chilled processed food 8,916.9 9,392.1 9,956.7 10,503.6 11,134.2 11,849.4 Oils and fats 11,213.3 13,095.9 15,739.2 20,230.1 25,039.3 29,196.5 Sauces, dressings and 39,099.2 40,412.1 41,627.5 42,933.4 44,175.1 45,904.7 condiments Baby food 7,465.6 8,319.1 9,190.7 10,224.4 11,769.2 13,462.3 Spreads 2,699.4 2,901.3 3,126.9 3,362.9 3,596.6 3,856.3
Source: Euromonitor International
Table 3.4 Retail Sales of Packaged Food by Sector: % Value Growth 2000-2005% current value growth
2004/05 2000-05 CAGR* 2000/05 TOTALPackaged food 8.1 8.6 51.0
Confectionery 6.2 7.6 44.4Bakery products 7.0 8.6 51.0Ice cream 8.1 7.9 46.1Dairy products 13.0 16.6 115.2Sweet and savoury snacks 7.7 8.0 46.8Snack bars - - -Meal replacement products - - -Ready meals 8.1 7.8 45.8Soup 5.0 4.3 23.6Pasta 4.7 4.2 22.6Noodles 10.3 10.2 62.3Canned/preserved food 3.6 3.4 18.0Frozen processed food 6.2 6.6 37.3Dried processed food 10.3 10.1 62.0Chilled processed food 6.4 5.9 32.9Oils and fats 16.6 21.1 160.4Sauces, dressings and condiments 3.9 3.3 17.4Baby food 14.4 12.5 80.3Spreads 7.2 7.4 42.9
*CAGR: compound annual growth rateSource: Euromonitor International
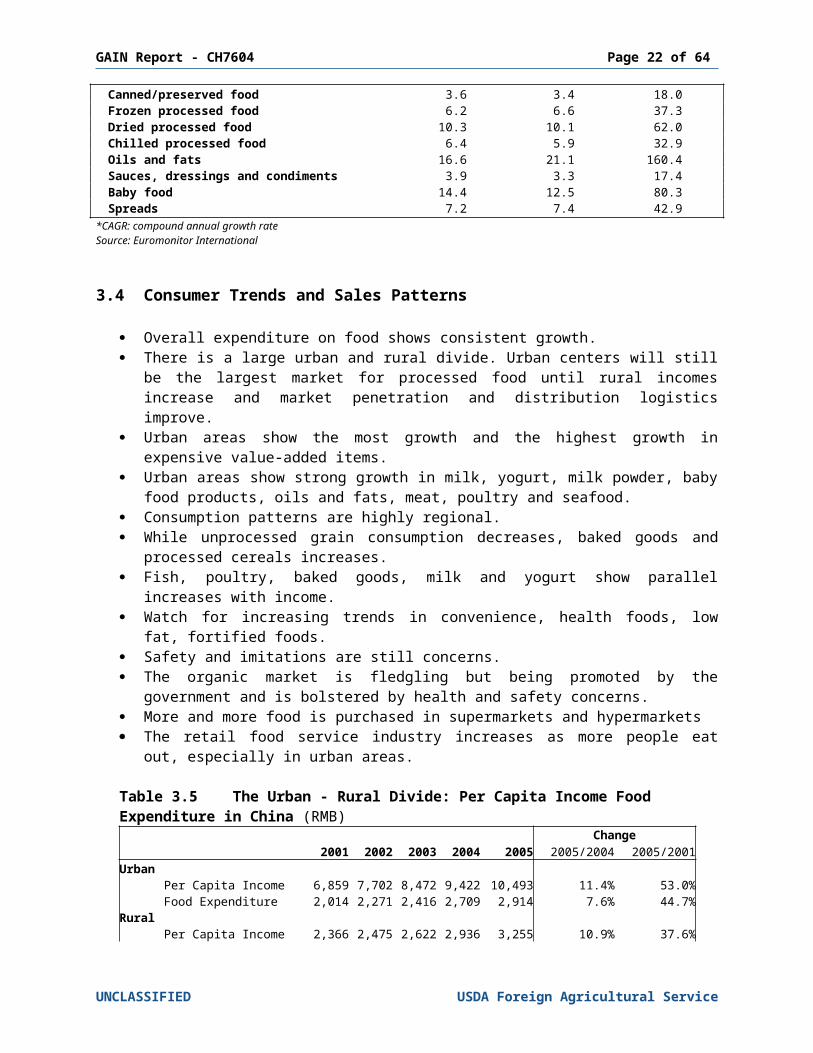
3.4 Consumer Trends and Sales Patterns
Overall expenditure on food shows consistent growth. There is a large urban and rural divide. Urban centers will still be the largest market for
processed food until rural incomes increase and market penetration and distribution logistics improve.
Urban areas show the most growth and the highest growth in expensive value-added items.
Urban areas show strong growth in milk, yogurt, milk powder, baby food products, oils and fats, meat, poultry and seafood.
Consumption patterns are highly regional. While unprocessed grain consumption decreases, baked goods and processed cereals
increases. Fish, poultry, baked goods, milk and yogurt show parallel increases with income. Watch for increasing trends in convenience, health foods, low fat, fortified foods. Safety and imitations are still concerns. The organic market is fledgling but being promoted by the government and is bolstered
by health and safety concerns. More and more food is purchased in supermarkets and hypermarkets
UNCLASSIFIED USDA Foreign Agricultural Service
GAIN Report - CH7604 Page 17 of 46
The retail food service industry increases as more people eat out, especially in urban areas.
Table 3.5 The Urban - Rural Divide: Per Capita Income Food Expenditure in China (RMB)Change
2001 2002 2003 2004 2005 2005/2004 2005/2001Urban
Per Capita Income 6,859 7,702 8,472 9,422 10,493 11.4% 53.0%Food Expenditure 2,014 2,271 2,416 2,709 2,914 7.6% 44.7%
RuralPer Capita Income 2,366 2,475 2,622 2,936 3,255 10.9% 37.6%Food Expenditure 830 872 886 1,031 1,162 12.7% 40.0%
Data source: China Statistics Yearbooks, 2002-2006
According to the table 3.5, per capita expenditure on food in urban areas increased by 7.6 percent between 2004 and 2005, while in rural areas the increase was an even greater 12.7 percent. There was a parallel increase of about 11 percent in amounts of disposable income between rural and urban households. What is important to recognize here though is that while growth in food expenditure is strong in both urban and rural areas, rural disposable income and food expenditure is less than one-third of the urban counterpart. It is also worth mentioning that due to price factors and availability most of the food consumed in rural areas is fresh rather than processed. Therefore the strength of the processed food market and the drivers for tastes and products still reside in urban areas.
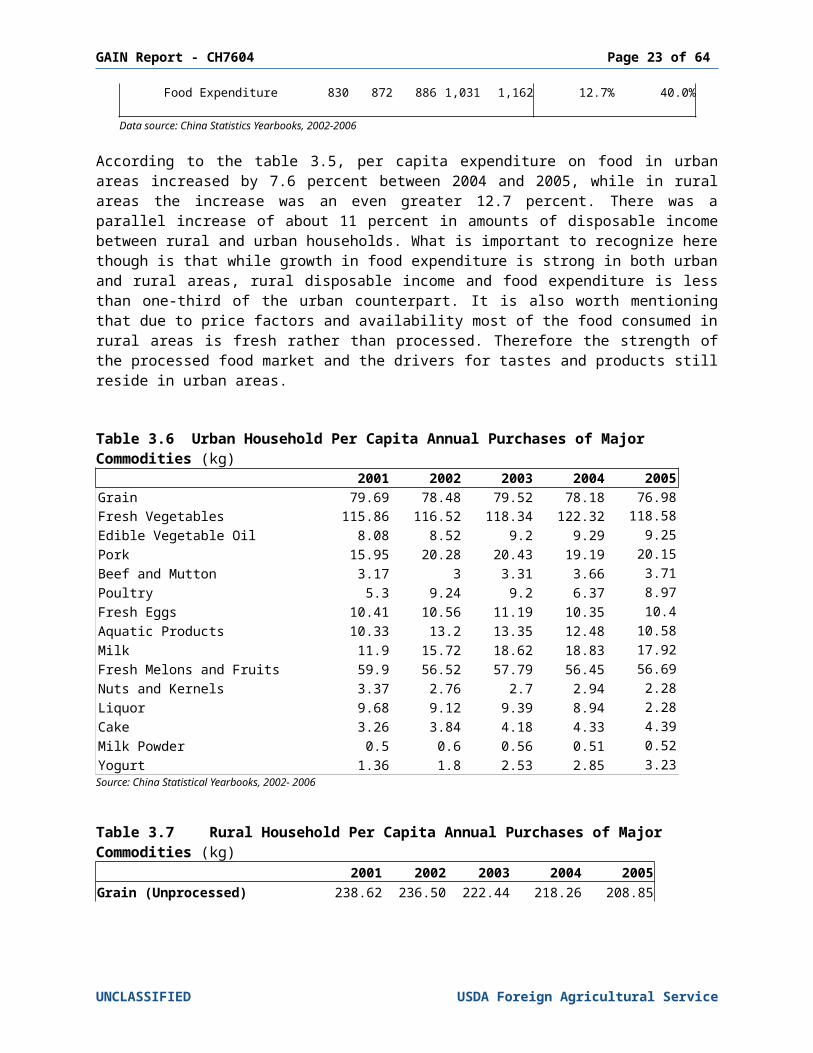
Table 3.6 Urban Household Per Capita Annual Purchases of Major Commodities (kg)2001 2002 2003 2004 2005
Grain 79.69 78.48 79.52 78.18 76.98Fresh Vegetables 115.86 116.52 118.34 122.32 118.58Edible Vegetable Oil 8.08 8.52 9.2 9.29 9.25Pork 15.95 20.28 20.43 19.19 20.15Beef and Mutton 3.17 3 3.31 3.66 3.71Poultry 5.3 9.24 9.2 6.37 8.97Fresh Eggs 10.41 10.56 11.19 10.35 10.4Aquatic Products 10.33 13.2 13.35 12.48 10.58Milk 11.9 15.72 18.62 18.83 17.92Fresh Melons and Fruits 59.9 56.52 57.79 56.45 56.69Nuts and Kernels 3.37 2.76 2.7 2.94 2.28Liquor 9.68 9.12 9.39 8.94 2.28Cake 3.26 3.84 4.18 4.33 4.39Milk Powder 0.5 0.6 0.56 0.51 0.52Yogurt 1.36 1.8 2.53 2.85 3.23Source: China Statistical Yearbooks, 2002- 2006
Table 3.7 Rural Household Per Capita Annual Purchases of Major Commodities (kg)2001 2002 2003 2004 2005
Grain (Unprocessed) 238.62 236.50 222.44 218.26 208.85
UNCLASSIFIED USDA Foreign Agricultural Service
GAIN Report - CH7604 Page 18 of 46
Wheat 76.81 76.31 73.23 72.39 68.44Rice 122.89 123.11 119.31 117.40 113.36
Soybeans and Related Products 5.49 5.76 5.28 5.49 -Soybean 2.46 2.20 2.05 1.91 1.91
Fresh Vegetable 109.3 110.55 107.40 106.61 102.28Edible Oil 7.03 7.53 6.27 5.29 6.01Meats, Poultry and Related Products 18.21 18.60 19.68 19.24 22.42
Pork 13.35 13.70 13.78 13.46 15.62Beef 0.55 0.52 0.50 0.48 0.64Mutton 0.60 0.65 0.76 0.82 0.83Poultry 2.87 2.91 3.20 3.13 3.67
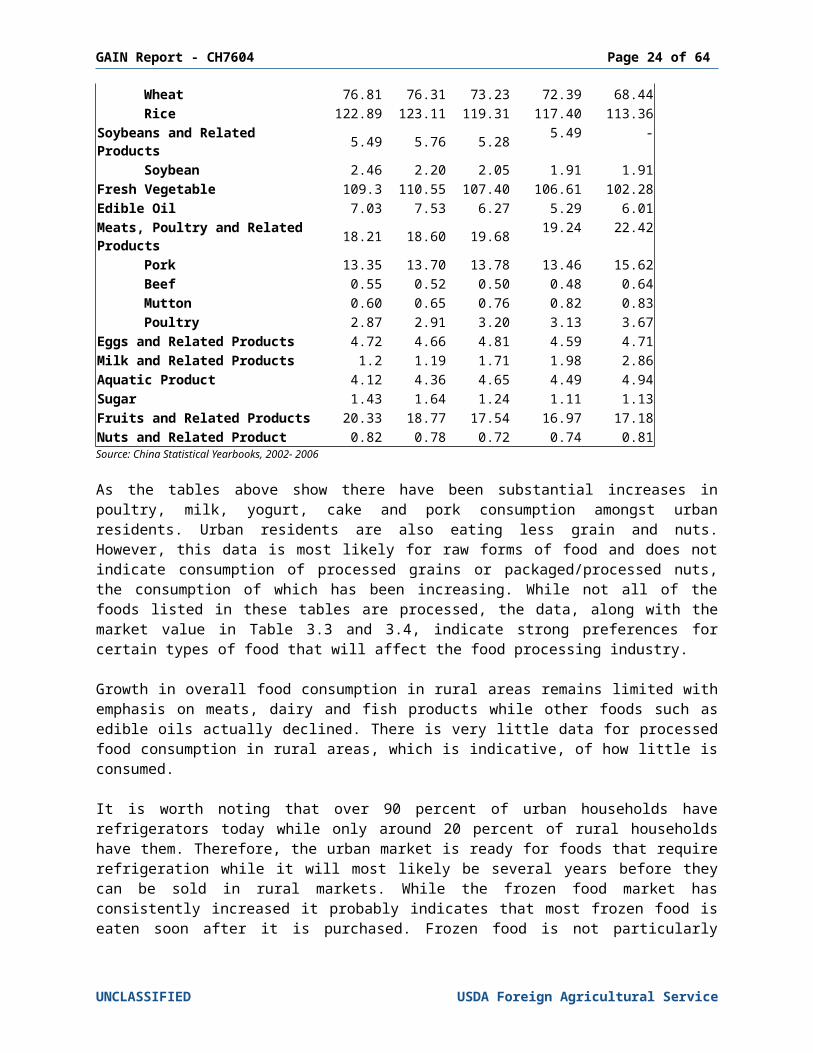
Eggs and Related Products 4.72 4.66 4.81 4.59 4.71Milk and Related Products 1.2 1.19 1.71 1.98 2.86Aquatic Product 4.12 4.36 4.65 4.49 4.94Sugar 1.43 1.64 1.24 1.11 1.13Fruits and Related Products 20.33 18.77 17.54 16.97 17.18Nuts and Related Product 0.82 0.78 0.72 0.74 0.81Source: China Statistical Yearbooks, 2002- 2006
As the tables above show there have been substantial increases in poultry, milk, yogurt, cake and pork consumption amongst urban residents. Urban residents are also eating less grain and nuts. However, this data is most likely for raw forms of food and does not indicate consumption of processed grains or packaged/processed nuts, the consumption of which has been increasing. While not all of the foods listed in these tables are processed, the data, along with the market value in Table 3.3 and 3.4, indicate strong preferences for certain types of food that will affect the food processing industry.
Growth in overall food consumption in rural areas remains limited with emphasis on meats, dairy and fish products while other foods such as edible oils actually declined. There is very little data for processed food consumption in rural areas, which is indicative, of how little is consumed.
It is worth noting that over 90 percent of urban households have refrigerators today while only around 20 percent of rural households have them. Therefore, the urban market is ready for foods that require refrigeration while it will most likely be several years before they can be sold in rural markets. While the frozen food market has consistently increased it probably indicates that most frozen food is eaten soon after it is purchased. Frozen food is not particularly popular with consumers in the south of China but is still widely used in the food service industry there. Although no official statistics exist, microwaves are rapidly becoming a more common appliance in urban households. For example retail surveys in Shanghai show that over 450,000 microwave ovens were sold in retail outlets across the city in 2002. Furthermore this represents a 37 percent increase over 2001.
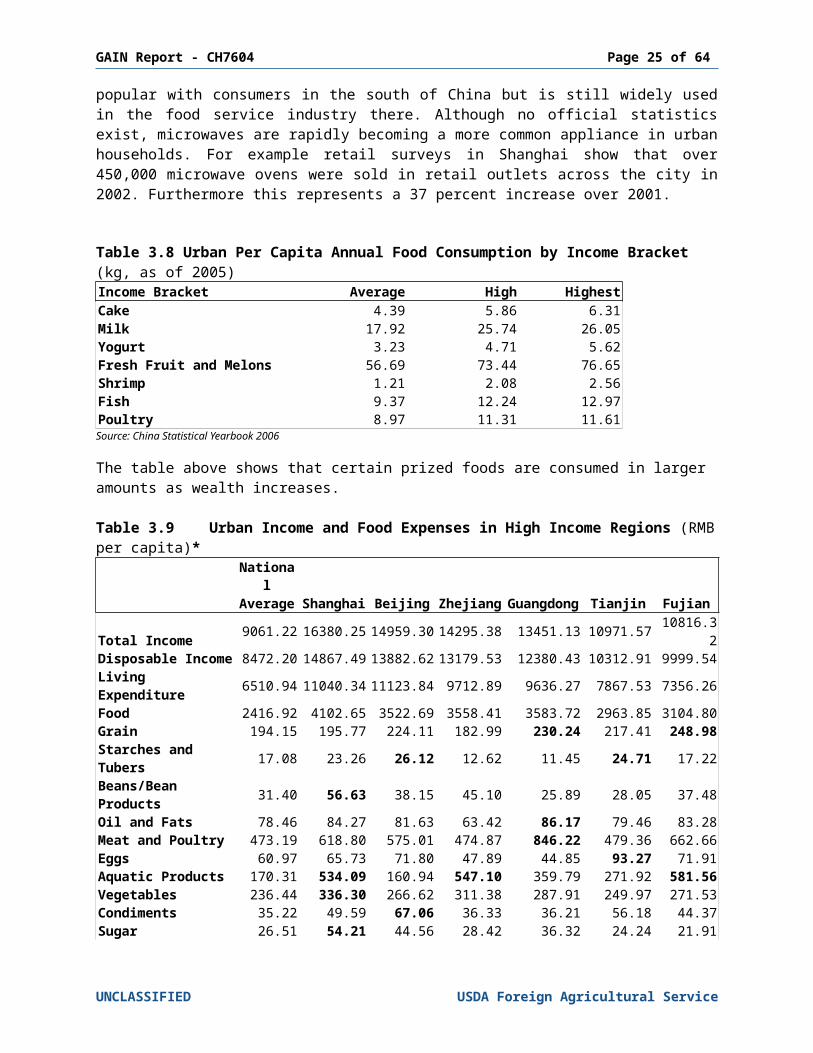
Table 3.8 Urban Per Capita Annual Food Consumption by Income Bracket (kg, as of 2005)Income Bracket Average High Highest
UNCLASSIFIED USDA Foreign Agricultural Service
GAIN Report - CH7604 Page 19 of 46
Cake 4.39 5.86 6.31Milk 17.92 25.74 26.05Yogurt 3.23 4.71 5.62Fresh Fruit and Melons 56.69 73.44 76.65Shrimp 1.21 2.08 2.56Fish 9.37 12.24 12.97Poultry 8.97 11.31 11.61Source: China Statistical Yearbook 2006
The table above shows that certain prized foods are consumed in larger amounts as wealth increases.
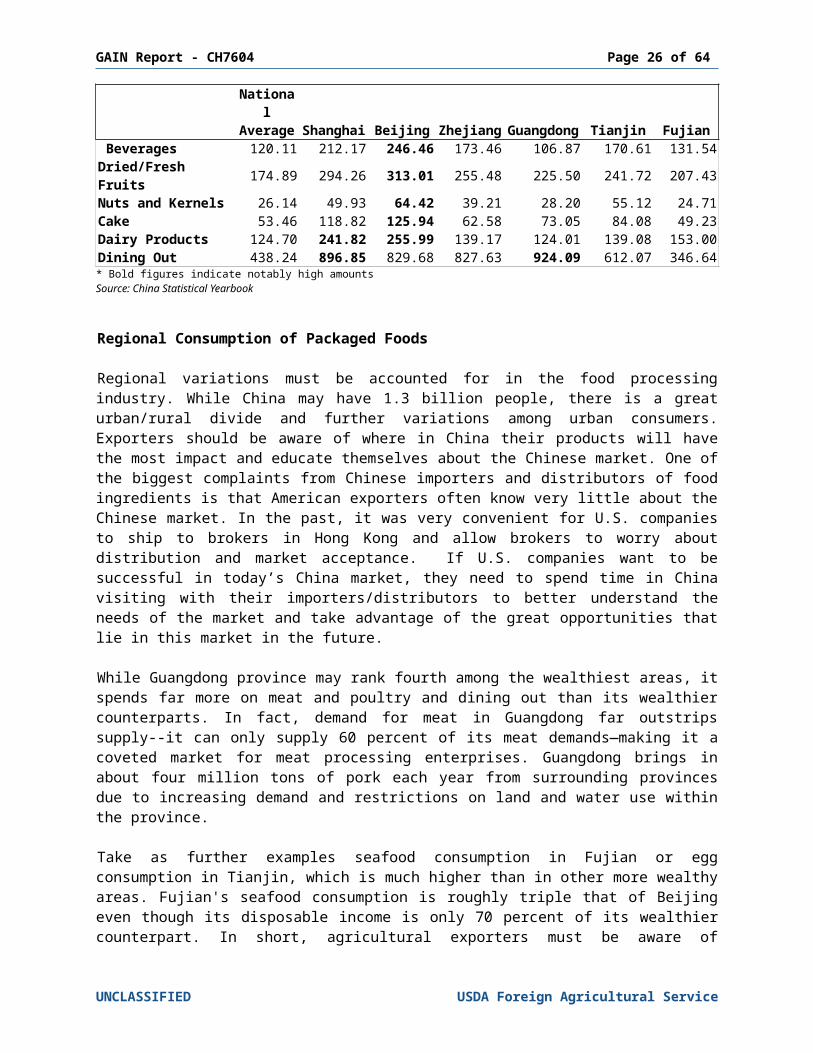
Table 3.9 Urban Income and Food Expenses in High Income Regions (RMB per capita)*National Average Shanghai Beijing Zhejiang Guangdong Tianjin Fujian
Total Income 9061.22 16380.25 14959.30 14295.38 13451.13 10971.57 10816.32Disposable Income 8472.20 14867.49 13882.62 13179.53 12380.43 10312.91 9999.54Living Expenditure 6510.94 11040.34 11123.84 9712.89 9636.27 7867.53 7356.26Food 2416.92 4102.65 3522.69 3558.41 3583.72 2963.85 3104.80Grain 194.15 195.77 224.11 182.99 230.24 217.41 248.98Starches and Tubers 17.08 23.26 26.12 12.62 11.45 24.71 17.22Beans/Bean Products 31.40 56.63 38.15 45.10 25.89 28.05 37.48
Oil and Fats 78.46 84.27 81.63 63.42 86.17 79.46 83.28Meat and Poultry 473.19 618.80 575.01 474.87 846.22 479.36 662.66Eggs 60.97 65.73 71.80 47.89 44.85 93.27 71.91Aquatic Products 170.31 534.09 160.94 547.10 359.79 271.92 581.56Vegetables 236.44 336.30 266.62 311.38 287.91 249.97 271.53Condiments 35.22 49.59 67.06 36.33 36.21 56.18 44.37Sugar 26.51 54.21 44.56 28.42 36.32 24.24 21.91 Beverages 120.11 212.17 246.46 173.46 106.87 170.61 131.54Dried/Fresh Fruits 174.89 294.26 313.01 255.48 225.50 241.72 207.43Nuts and Kernels 26.14 49.93 64.42 39.21 28.20 55.12 24.71Cake 53.46 118.82 125.94 62.58 73.05 84.08 49.23Dairy Products 124.70 241.82 255.99 139.17 124.01 139.08 153.00Dining Out 438.24 896.85 829.68 827.63 924.09 612.07 346.64* Bold figures indicate notably high amountsSource: China Statistical Yearbook
Regional Consumption of Packaged Foods
Regional variations must be accounted for in the food processing industry. While China may have 1.3 billion people, there is a great urban/rural divide and further variations among urban consumers. Exporters should be aware of where in China their products will have the most impact and educate themselves about the Chinese market. One of the biggest complaints from Chinese importers and distributors of food ingredients is that American exporters often know very little about the Chinese market. In the past, it was very convenient for U.S. companies to ship to brokers in Hong Kong and allow brokers to worry about distribution and market acceptance. If U.S. companies want to be successful in today’s China market, they need to spend time in China visiting with their importers/distributors to better understand the needs of the market and take advantage of the great opportunities that lie in this market in the future.
UNCLASSIFIED USDA Foreign Agricultural Service
GAIN Report - CH7604 Page 20 of 46
While Guangdong province may rank fourth among the wealthiest areas, it spends far more on meat and poultry and dining out than its wealthier counterparts. In fact, demand for meat in Guangdong far outstrips supply--it can only supply 60 percent of its meat demands—making it a coveted market for meat processing enterprises. Guangdong brings in about four million tons of pork each year from surrounding provinces due to increasing demand and restrictions on land and water use within the province.
Take as further examples seafood consumption in Fujian or egg consumption in Tianjin, which is much higher than in other more wealthy areas. Fujian's seafood consumption is roughly triple that of Beijing even though its disposable income is only 70 percent of its wealthier counterpart. In short, agricultural exporters must be aware of significant regional variations and not consider China as a single, large market.
In general China’s market for consumption of packaged foods can be divided into 6 major regions: East, Central, North and Northeast, Northwest, South, and Southwest.
East China is clearly the largest regional market for packaged foods in China. In terms of value, this region accounts for 27 percent of all packaged food sold in China. Shanghai is one of China’s leading commercial centers and home to its largest port. With a population of 20 million and a 2006 GDP estimated at $127 billion, the city is at the center of a massive web of development. Shanghai is an aggressively cosmopolitan city, which derives much of its strong sense of identity from a knowledge of international brands and fashions. This region leads the market for most high-end packaged foods including confectionary, ice cream, dairy products, and other western-style foods such as pasta, packaged bread and Western sauces. This region also has a well established distribution infrastructure and a large number of supermarkets and hypermarkets making transportation and accessibility less of a problem than in other regions. Because of this and the general high level of income, education and openness to western food styles, this region is also an excellent launch pad for many new products.
Table 3.10 Retail Sales of Packaged Food by Region: Value 2000-2005RMB million
2000 2001 2002 2003 2004 2005
East China 81,412.1 88,960.5 97,079.4 106,389.6 116,154.8 126,140.0Mid China 52,879.8 57,047.8 61,577.5 66,485.2 71,632.0 76,852.7North and Northeast China 64,891.0 70,558.8 76,789.0 83,648.4 90,957.9 98,199.5Northwest China 17,650.8 18,851.7 20,099.2 21,402.7 23,013.8 24,670.6South China 54,001.7 58,637.5 63,768.6 69,531.4 75,722.9 82,252.7Southwest China 36,452.9 39,449.5 42,798.3 46,349.9 51,774.0 55,919.6TOTAL 307,288.3 333,505.8 362,111.9 393,807.1 429,255.3 464,035.1Source: Euromonitor International
The North and Northeast packaged food markets are also well developed, accounting for nearly 20 percent of total value sales in the country. In general, people in northern China prefer a meatier and starch heavy diet. Combined with somewhat less complicated foods than consumers are used to in the South, northern food and North China constitutes a sizable and tangible market for international food processing businesses in China. Large cities such as Beijing, Harbin and Shenyang provide a strong base for demand. The consumption of noodles, mostly made from wheat flour, is particularly high in this region. Key characteristics of the processed food industry in North China are as follows:
UNCLASSIFIED USDA Foreign Agricultural Service
GAIN Report - CH7604 Page 21 of 46
1. Logistical bottlenecks: Especially in Northeast China, the agricultural production supply chain suffers from low efficiency. This is also a reason the processed food industry is less developed in the region.
2. Highly stratified and distribution facility development is not fully in place. For the same reason Carrefour and other big retail players consider establishing their own regional distribution centers in cities of North East China such as Shenyang in 2006. The rationale is to grow trade in local markets before competitors can move in to these segments.
3. Severe weather conditions leaves a shorter window of opportunity to actively market to consumers and businesses. On the other hand, fewer competitors translate into more opportunities to establish markets. This means an offset of transportation and other costs to establish a solid foothold in regional markets. Two examples are Anheuser Busch's purchase of Harbin Beer in Northeast China's Heilongjiang Province and New Zealand's Fonterra teaming up with Sanlu Milk Powder of Hebei Province. Both local partners are influential brands that can give the joint venture an advantage on expanding existing market shares. It is anticipated that the food processing sector in Northeast China will repeat the development pattern of those in the Pearl and Yangtze River Deltas several years ago, but with an accelerated pace, since North China is the focus of strategic development for the Country in the 11th five year plan, and stakeholders all have in mind a race against their southern peers.
4. A review of Shandong Province is somewhat representative of the North China food processing sector. In 2005 Shandong had 13 enterprises listed in the top 100 food processors ranking it the first in terms of number of businesses among other provinces. However, compared with peers in Shanghai or Jiangsu Province, they all had lower profit rates, economies of scale, etc. Also, Shandong has more primary food processing rather than manufacturing businesses which means products with lower added value and greater vulnerability with regard to meeting competition, especially when there are price increases in raw materials. Currently, in the value-added food processing sector, Japanese and Korean businesses are more present in Shandong and North East China.
The southwest market is the fastest growing with a 8 percent in sales increase in 2005. This fast paced growth is largely due to urbanization of cities like Kunming, Chengdu, and Chongqing. Tourism in these areas has also lead to consumption of more packaged foods. Sichuan cooking is famous in these regions so it is not surprising that this region has the highest growth rate for sauces, dressings, and condiments and that demand for oil and fats rose 25 percent 2004.
South China is a market whose proximity to Hong Kong and large mainland cities like Guangzhou and Shenzhen is reflected in its high disposable incomes and customer knowledge about new products. In 2004 this region was the largest for oils and fats and the second largest for canned/preserved and chilled foods. Fastest growth has been seen for sales of bakery products, dairy products and baby food. The Northwest is a relatively underdeveloped market with few large cities and poor distribution channels as is reflected in the fact that it accounts for a mere 5 percent of total packaged food sales.
Sales Patterns
Presence of traditional wet markets is decreasing. Presence of hypermarkets and supermarkets is dramatically increasing.
UNCLASSIFIED USDA Foreign Agricultural Service
GAIN Report - CH7604 Page 22 of 46
The food retail service industry continues to grow rapidly. Above factors mean a higher presence of processed foods. 52 percent of retail processed food is sold in hypermarkets and supermarkets.
Table 3.11 Retail Sales of Packaged Food by Distribution Format: % Analysis 2000 / 2005% retail value rsp
2000 2005Supermarkets/hypermarkets 38.1 52.2Independent food stores 27.0 16.7Convenience stores 7.2 13.1- Standard convenience stores 7.2 13.1- Petrol/gas/service stations - -Internet sales - -Discounters - -Others 27.7 18.0Total 100.0 100.0Source: Euromonitor International
Supermarkets and hypermarkets are increasing as well as their share of food sales. Furthermore, convenience stores such as 7-Eleven are gaining in numbers as well. Traditional wet markets are losing market share, as more and more consumers are concerned about hygiene and food safety while government tax structures are making it more and more difficult for wet markets to operate. These developments bode well for the food processing industry as currently 52 percent of retail processed food is sold in hypermarkets and supermarkets and more than 10 percent in convenience stores. The rest is split between independent grocery stores and other outlets. Targeting middle-class consumers who are increasingly short on time, hypermarkets offer a wide variety of processed products, ranging from fish fillets to ready-made meals.
Table 3.12 Consumer Expenditure on Food in Retail 2000-2005RMB bn
2000 2001 2002 2003 2004 2005Total 1,303.1 1,379.6 1,397.2 1,484.9 1,607.3 1,708.3
Source: Euromonitor International estimates
Eating out is very popular among Chinese consumers and has become a regular occurrence for most in recent years due to the strength of the economy. Most Chinese meals are still prepared at home, but this figure is in decline. The growth in the number of working women and dual-income households, particularly dual-income households without children, has led to an overall improvement in the disposable incomes of Chinese consumers. In larger cities, the fast pace of life leads many to eat out more often. For example, according to a report by the Chinese research institution Sinomonitor International, over 90% of Beijing’s young white-collars aged 18-35 eat out frequently. Also, during the workweek, 54% of working people eat out more than four times per week. These trends have resulted in considerable growth for restaurants, cafés, and fast food and home delivery businesses across the country. With increased purchasing power and more exposure to western lifestyles, Chinese consumers’ tastes have become more and more varied. They are spending more on eating out, demanding a wider variety of food options, and expecting high-quality food.
The growth of high-end food industry is particularly evident in Shanghai. Shanghai had a total of 30,800 registered restaurants in 20041, slightly less than in 2003. Revenues, however, jumped by
1 latest available data
UNCLASSIFIED USDA Foreign Agricultural Service
GAIN Report - CH7604 Page 23 of 46
almost 20% to reach RMB 7.5 billion (US$ 937 million). The declining number of entities relative to income reflects continued consolidation in the industry as chain stores and professional food service operations continue to displace small enterprises. It is also important to keep in mind that a) this number lumps restaurants and catering together, and b) the number almost certainly grossly understates the size of the industry, as many small or informal restaurants go unregistered.
Traditionally, the catering industry has been viewed as a poor venue for imported products, due to its focus on box lunches produced at a cost of less than US$ 1 per unit. This is starting to change, however, as consumer concerns about food safety have led many Shanghainese to distrust traditional box lunch manufacturers. In response, several high-end restaurants in commercial districts have started producing box lunches, and several retailers (including Lawson’s convenience stores) have begun offering Japanese-style box lunches. Significantly more expensive than traditional box lunches, the main appeal is combination of high quality with convenience. This has created a potential opportunity for U.S. products, and several companies have held discussions with Lawson’s with an eye to including their products in box lunches.
Shanghai is home to one of China’s most vibrant and innovative restaurant scenes. Although separate statistics on the restaurant industry are not available, the city has seen tremendous development. Shanghai now hosts a cohort of world-class restaurants, including Jean-Georges, Sens et Bund and Laris, catering to the city’s growing business elite. Pizza restaurants are becoming increasingly popular, becoming an important driver for demand for cheese.
One of the most important trends in Shanghai’s restaurant industry is the rapid emergence of high-end Chinese restaurant chains, such as Shanghai Uncle, Xiaonanguo, and Lulu. Shanghainese typically prefer to entertain guests in restaurants rather than at home, and gain a great deal of ‘face’ by taking guests to a high-end restaurant. This is especially true for business dinners, which place a premium on over-the-top displays of generosity. At the same time, they prefer to go to a place that is seen to have reliable quality: foreign cuisines are interesting, but unfamiliar and unsuitable for some occasions. These high-end chain restaurants specialize in providing a reliably excellent dining experience with high-end ingredients and consistent preparation, at a price. They innovate in recipes, but only within certain limits. These restaurants’ demand for consistent high quality, willingness to pay higher prices and very high volume (Xiaonanguo has twenty very large restaurants), makes these an excellent venue for imported ingredients. All already serve imported wines, and most already import a number of other ingredients. Shanghai Uncle has an exclusive arrangement with Gallo Wines, and Lulu featured fresh Washington state cherries as part of a promotion last fall.
Shanghai also has a large community of western restaurants, serving a mixed clientele of western expatriates, Taiwanese and local Chinese who have either lived abroad or are just interested in trying something new. Unofficial estimates put
UNCLASSIFIED USDA Foreign Agricultural Service
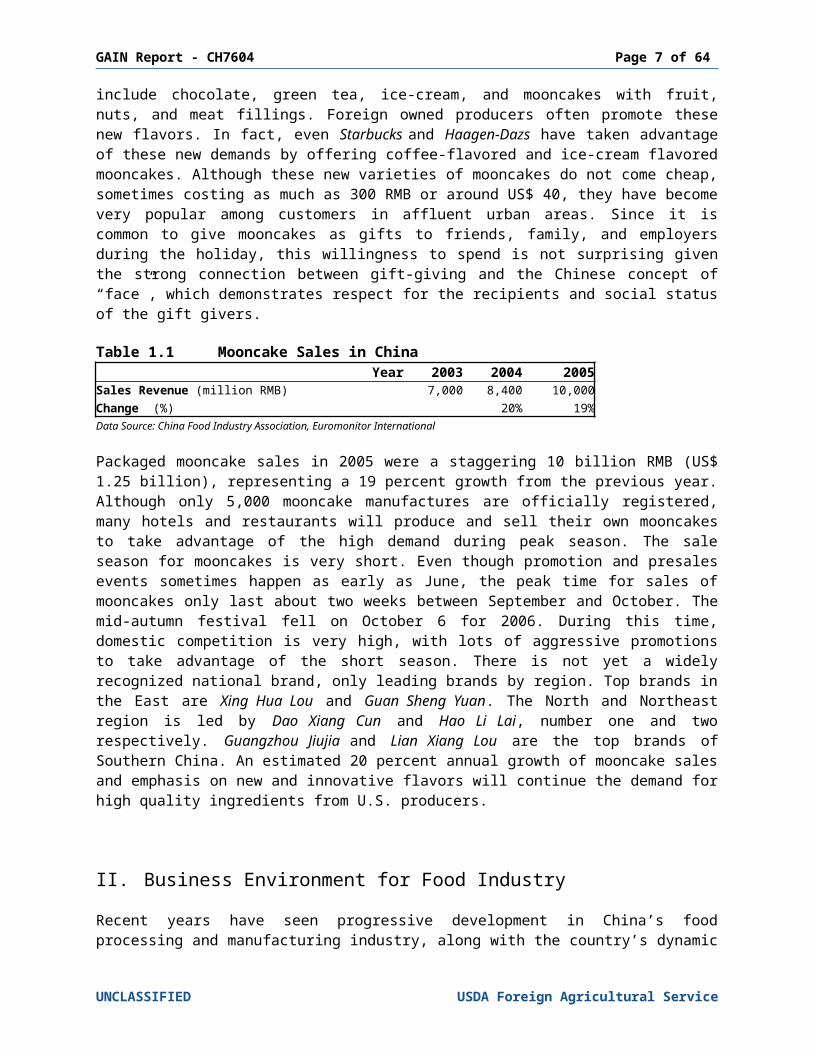
Pricey seafood sold well in upscale restaurants
California almond in Chinese vegetable panfry – Chinese chefs creatively incorporate many high value U.S. ingredients in cooking to satisfy selective customers.
GAIN Report - CH7604 Page 24 of 46
the number of western restaurants at 1,600, serving 20 different cuisines, to an expatriate community estimated at 350,000. Western restaurants are important both as customers for high end products such as wine, and as a means of introducing new products to the market. Some western restaurants have expanded to the point that they generate significant volume on their own: Moon River Diner (U.S. owned and operated), for example, now has three outlets in Shanghai. Specialty restaurants and ethnic restaurants are becoming increasingly common, creating niche markets for very high-end products. Organic food is also becoming an emerging trend, with at least two high-end organic restaurants opening in the past year. Demand is so strong that one local retailer has established strictly controlled greenhouse vegetable farms in the suburbs to cater to the needs of these restaurants.
Demand for knowledge about the preparation and handling of western food is at a premium, and the city suffers from a chronic shortage of well-trained western chefs. One estimate put the number of fully qualified chief chefs (for western food) at 100, most of them working in the star-rated hotels. This constitutes an excellent opportunity for exporters and distributors willing to commit the time to introduce and explain their products. In conjunction with the local chef associations, ATO/Shanghai regularly organizes chef seminars throughout East China that are invariably packed. These events provide USDA cooperator groups such as the Alaska Seafood Marketing Institute, the U.S. Meat Export Federation, the USA Poultry and Egg Export Council, Sunkist Growers, and the California Table Grape Commission, the opportunity to not just introduce new or unusual products, but to explain the proper preparation techniques and potential innovative uses of their products.
Hotels
Shanghai’s hotel sector is already extremely well developed, but is expanding rapidly under pressure from overwhelming demand. Five and four star hotels are routinely fully booked, and during peak seasons there may be no rooms available at this level in the city. At the end of 2004 Shanghai had 359 star-rated hotels, of which 61 were rated four stars or higher—an increase of 21 over the previous year, 11 of which were four or five star hotels. Expansion is likely to continue or accelerate: Marriott has specifically targeted the Yangtze River Delta for development, while Holiday Inn plans to build hotels in every city in China with an airport in the next few years, including 7 new hotels in Shanghai. Business revenues for Shanghai’s hotel industry amounted to over $1.7 billion in 2004, and average room rates for 5-star hotels reached roughly $150/night, according to local government statistics.
Table 3.13 Shanghai Hotel Industry StatisticsYear Total Five Star Four Star Others2004 359 24 37 2792003 338 20 30 288
Source: Shanghai Statistical Yearbook, 2004 and 2005
Restaurants and four and five star hotels continue to form the cutting edge of cuisine in Shanghai, despite growing competition from world-class standalone restaurants like Laris. This makes the hotel industry an ideal entry point for now-to-market and high-end imported food ingredients. As noted earlier, top hotel restaurants have the best qualified chefs for foreign cuisine, and they are generally more familiar with imported products. Whereas other restaurants are willing to be convinced of the virtues of new products, ATO’s experience indicates that these top restaurants aggressively seek them out. They are also more familiar with menu promotions, and their high profile in the restaurant community means that other restaurants tend to follow their lead.
UNCLASSIFIED USDA Foreign Agricultural Service
GAIN Report - CH7604 Page 25 of 46
Despite the growth of high end restaurants in large cities like Shanghai, the most popular type of catering outlets in China are still small, cheap, full-service restaurants. These usually provide a range of local dishes, often seasonal in nature, although economic development is reducing seasonal variations in availability of produce. However, the expanding middle class is developing a taste for fast food and quick service restaurants—many office workers buy breakfast snacks on the way to work and eat out for lunch, often more than 3 times a week. Fast food restaurants are rapidly gaining in popularity, especially amongst younger consumers. US-based Yum! Brands Inc, which owns KFC, Pizza Hut and Taco Bell, is the market leader, with 2004 revenue of RMB 9.4 billion (US $ 1.1 billion) and over 1,200 open in 280 Chinese cities. McDonald's also has over 600 outlets in China. However, fast-food chains must compete with local restaurants that have competitive prices. A typical Chinese take-away lunch box with rice, meat and vegetables costs about $1 USD.
The surge in the popularity of eating out along with the influx of foreign food has had a substantial impact on retail sales of processed food. Consumers often go supermarkets in search of new foods they have tried in restaurants. Growing number of cafés selling gourmet sandwiches has contributed to an increase in supermarket sales of specialty breads and cheeses. Furthermore, manufacturers have responded to the popularity of ethnic food by creating ready-made sauces and meals and many supermarkets now have specific sections for imported Western, Japanese, Korean and other Asian foods.
3.5 Challenges and Opportunities
Opportunities ChallengesWorld’s largest food market; food sector growth in the double digits. China’s economy large enough to survive setbacks that hurt others.
Fragmented market; over 50% of people are scattered in the countryside. Underdeveloped logistics and infrastructure hamper producers, processors, and distributors.
Food is an essential part of Chinese culture and social life.
The Chinese have very strong taste preferences. While they are willing to experiment, they are less willing to incorporate foreign tastes into their daily life without product information.
Fast growing HRI sector creates great demand for food ingredients
Under-developed cold chain and lack of expertise in food storage and distribution hamper distribution and storage of temperature sensitive or publishable products
China is incomprehensibly large. Though many consumers still lack the income to purchase imports, millions join the middle class every year.
Regional differences in culture and taste can be quite stark. Promotions with limited budgets must target specific groups.
Chinese consumers spend more than one third of their disposable income on food and beverages. Higher living standards, health education drive consumers to demand better quality, more variety in new diets.
Chinese consumers are price-sensitive: imported products have difficulty competing with domestic substitutes on price.
Continuous appreciation of RMB makes U.S. ingredients less expensive in this price-sensitive China market
Ingredients from other countries may also benefit from the strong RMB, thus in turn enhance the competition.
Changes in urban living styles favor consumption of more processed food.
Basic agricultural production is not well integrated with commercial food processing sector.
UNCLASSIFIED USDA Foreign Agricultural Service
GAIN Report - CH7604 Page 26 of 46
Opportunities ChallengesUndeveloped agriculture means processors may need to import even basic ingredients to develop their food businesses.
Competition among foreign firms in China is strong.
Imported goods are generally regarded as high in quality.
Imports are regarded as luxury goods: the vast majority of consumers do not believe they can afford them.
High-incomers favor products that can improve the quality of life, and willing to pay premier price
Consumers have limited awareness and knowledge of new products
Many U.S. brands, such as Budweiser, Coca- Cola, M&Ms, Snickers, Campbell’s, Heinz, Wrigley’s, and Pringles are widely recognized in China.
Intellectual property issues. Successful products are quickly counterfeited, and innovative processes may be stolen.
China is new to food processing, open to foreign processes and technologies.
Currently food processing industry operating at relatively low level due to limited involvement of technology
Foreign-invested companies on leading edge of industry, more likely to use imported ingredients.
Local producers catch up quickly; market life of new product may be short.
Low wage structure makes China a good base for value-added processing.
Most Chinese firms are looking for investment, marketing, packaging, and management support.
New markets for imported products are appearing in fast-growing cities throughout China.
Transportation and logistics for these cities remains difficult, and many lack the presence of a qualified distributor for imports.
Overseas fast-food chains are extremely popular, and provide exposure for foreign foods. Overseas retail chains are growing quickly, and carry more imported products than domestic counterparts.
Foreign fast-food chains source most of their products locally. Few of these chains import directly from overseas, working instead through distributors. Many retail chains charge high listing fees to promote new products.
Overseas retail chains and convenience chains are increasingly interested in establishing house brands. This is creating opportunities for bulk shipment of quality foods.
Although interested in quality for their house labels, these chains are tough negotiators, and will leave suppliers with little room for profit.
Consumers have strong food safety concerns, and favor imported products, especially for health food products including fresh fruit and baby food.
Registering food labels on imported products is a lengthy bureaucratic process. Counterfeiting has a negative impact on perceived quality and safety of foreign brands.
Under WTO, China’s duties on imported foods have fallen, and more products are shipped directly to China, instead of through Hong Kong. WTO entry leads to lower tariffs and import barriers, market and legal reform, and increased access for distributors.
Increased access for imports has resulted in greater competition from other exporting countries for products like beef, seafood and pistachios. Non-tariff barriers such as SPS rules and local protectionism will not disappear quickly despite WTO. Import procedures can be costly, obstructive, and inconvenient.
The Chinese market often moves enmasse. If a product becomes trendy, sales can skyrocket overnight.
If a product is successful, it is likely to be counterfeited or imitated.
UNCLASSIFIED USDA Foreign Agricultural Service
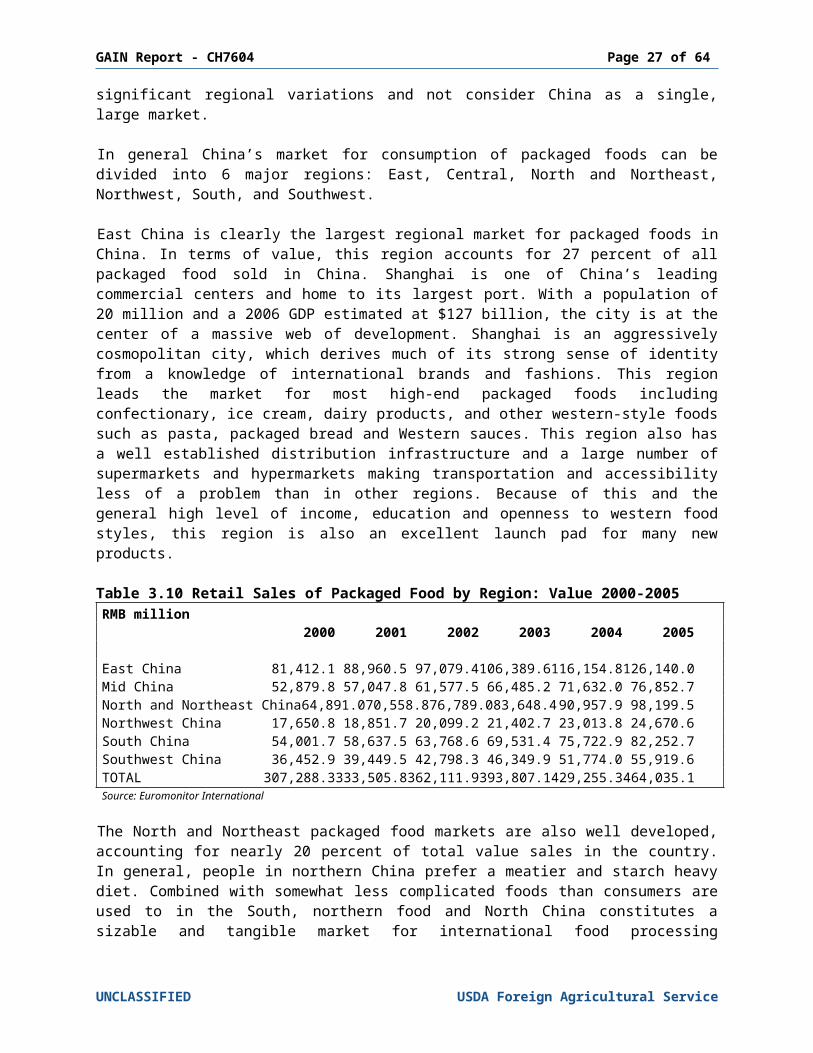
GAIN Report - CH7604 Page 27 of 46
IV. Road Map for Market Entry
Economic reform and market liberalization, removal of price controls and foreign exchange controls, and movement toward removal of import licensing have enhanced possibilities for exports to China.
Regional inconsistency is still a problem. Although import rules are changing, most still use an agent. Relationships and knowledge of Chinese business practices are essential Logistics are modernizing but still need a lot of improvement. Cold storage still limited. Shrink still a problem, especially for fresh ingredients.
4.1 Entry Strategy
China's food processing market is extremely diverse and fragmented which makes it nearly impossible to suggest one model for getting U.S. products into the market. However there are certain factors that all exporters should consider such as the great importance of relationships and market knowledge.
China has an ancient business culture that, like its American counterpart, values efficiency and profit. However, there are considerable differences that exporters must consider. Personal relationships are extremely important, as is respect for hierarchy. Do not be surprised if the more economic option is usurped by a long-standing relationship. It is essential to understand the Chinese concept of face and orientation towards groups and not individuals. The emphasis Chinese place on food extends into business practices as well. Dinners and lunches are an essential and informal way to cement relationships. Regular visits to China are essential.
As mentioned above, the food market in China is incredibly diverse and varies between urban and rural and from region to region. One should not think of China as a single market of 1.3 billion people but rather as several markets that are loosely connected. It is essential to conduct targeted research on a specific consumer groups and ensure that there will be a market for processed food that needs your exports. Try and figure out how your product can be used in, or add innovation to, typical Chinese food products. Only once a successful business model is established, should it then be attempted in different markets. It is said that U.S. exporters often make the mistake of seeing China as one large market and attempting to spread their product over too large an area without a focus on local promotion and market development. In fact, one of the biggest complaints from Chinese distributors about American exporters is their lack of knowledge about the Chinese market and expectations from local importers and distributors.
When looking for distributors, try to find one that not only has established wholesale and retail outlets but one that has relationships in your target market. It’s one thing to accept orders for your product, it’s another thing to make sure your product is penetrating the market and ensuring future growth. Look for distributors that have technicians on staff and experience working with other exporters. Make sure you visit their facilities and warehouses, especially if you are shipping through the cold chain. Be prepared to offer technical assistance and support. Also, be sure you and your importer or distributor have a clear understanding of who will pay certain fees as many times the brand owner is expected to pay fees, which in other countries an importer or distributor might otherwise cover.
All exporters should take full advantage of ATO assistance and producer associations as they have on-the-ground experience and relationships with both Chinese and American agricultural
UNCLASSIFIED USDA Foreign Agricultural Service
GAIN Report - CH7604 Page 28 of 46
interests. Furthermore it is highly recommended that exporters visit various agricultural and food industry trade-shows held throughout China. Contact one of the three ATO offices in China for more information about the most successful trade shows.
4.2 Distribution
The system for importing agricultural products into China is improving but still remains a rather complicated mix of transport modes and authorities. Once an informal system dominated by Hong Kong and Chinese entrepreneurs, the distribution channel has become more open and more formal where Western ideas, capital and management have greater influence. As more foreign retailers set up operations in China, international standards of logistics have been introduced into the country. For example, fast food chains like McDonald’s and KFC have set up cold chain systems that service nearly 200 outlets throughout China.
China has revamped its import-export license system. Traders can handle an import-export activity in China, with no need to get an official license whatsoever. Many importers prefer to contract an agent to handle customs and logistics documentation, facilitate government inspection and certification processes for the imported products.
Further change and improvement is still needed to cope with increasing imports. For example, distribution accounts for up to 30 percent of a product’s cost in China, while the figure is as low as 10 percent in the United States. Cold storage is still limited and shrink remains a problem for distributors. While the system is more transparent and tariffs on imported goods are dropping there still remain many roadblocks to smooth and easy importing of foreign agricultural products. In fact, over 70 percent of importers still use an import agent to help navigate the Chinese bureaucracy.
For purposes of food ingredients distribution, China is generally divided into three regions: North China (China north and east of the Yellow River, including Beijing, Tianjin, and the provinces of Shandong, Hebei Inner Mongolia etc); East China, which includes the coast from Jiangsu to Zhejiang provinces, the city of Shanghai, and Anhui province; and South China, including the coast along the provinces of Guangdong, Fujian, Guangxi and Hainan. Distribution, retail and food markets in the west of China are still largely undeveloped and virtually inaccessible to processors and importers.
Table 4.1 Major Chinese Ports (with annual volume over 100 million tons) (10, 000 tons)Seaport 2000 2001 2002 2003 2004 2005 Shanghai 20,440 22,099 26,384 31,621 37,896 44,317 Ningbo 11,547 12,852 15,398 18,543 22,586 26,881 Guangzhou 11,128 12,823 15,324 17,187 21,520 25,036 Tianjin 9,566 11,369 12,906 16,182 20,619 24,069 Qingdao 8,636 10,398 12,213 14,090 16,256 18,678 Dalian 9,084 10,047 10,851 12,602 14,516 17,805 Qinhuangdao 9,743 11,302 11,167 12,562 15,037 16,900Source: China Statistical Yearbook, 2006
Distribution Pattern
UNCLASSIFIED USDA Foreign Agricultural Service
GAIN Report - CH7604 Page 29 of 46
Historically South China is the gateway for imports into China. For many years cargo destined to China are shipped to ports in South China via Hong Kong, due to the well-developed international shipping service there. Currently this is still the dominant pattern for import to China.
The distribution pattern is changing while the infrastructure in East and North China is beefing up. More northerly ports like Shanghai and Qingdao have grabbed some of the cargo destined to East and North China from southern ports. There is increasing volume of imported food products directly shipped to northern ports without going through South China. Take an example of fruit, Beijing-based fruit distributors are already importing 90 percent of their fruit directly, with only 10 percent coming via Guangdong, though Shanghai distributors say they are still buying about 70 percent of their fruit from wholesale markets in Guangzhou, which is the central hub for imported fruit.
Traders / Importers Traders, often importers, are self-financed, specialized business organizations or people who have their own sales and distribution network. They are capable of purchasing large quantities of goods directly from the manufacturers / exporters or from another importing company. The imported goods are sold directly or through an agent to the food processors / manufacturers with a relatively quick transfer of assets. Some importers are also processors who own processing and packing facility. To a large extent, traders control the demand and the pricing of the goods to the clients.
Logistics Providers There is a good presence of international logistics providers in ports and free trade zones offering shipping, domestic transportation, customs clearance, warehousing services.
Customs Clearance Agent Contracted by importers or logistics provider to handle the customs clearance and import inspection issues with service charge applied.
Direct Distribution Manufacturers / exporters set up sales outlet and sell products directly in China rather than through a local business organization or person. The advantage is that the manufacturers / exporters can meet the consumers face-to-face to learn about the market conditions and trends. They can also reap the benefits of their sales promptly. The drawback is the need to invest in developing a sales network and the high cost of learning how to operate in a foreign market. This method should be made easier with China’s revamping of the import-export system.
Gray Channel The Gray Channel refers to the distribution connection transferring shipments via Hong Kong to China without going through the official import channel of customs and import inspection. This channel has historically been cheaper than official channels as imported goods are often shipped from Hong Kong outside of official channels or using various methods to evade import duty and VAT payments. U.S. exporters should know that this channel is illegal and discouraged. Goods undergoing the gray channel are under high risk, due to the lack of reliable technical expertise provided by gray channel operators and the authority’s anti-smuggling enforcement. Non-US products being deliberately “mislabeled” as U.S. products can also be found in the gray channel. Resulting from the lowered import tariff, the gap between legal channel and gray channel costs is narrowing, so there is less goods that enter South China illegally.
Exporters must complete the following documentation: Bill of Lading
UNCLASSIFIED USDA Foreign Agricultural Service
GAIN Report - CH7604 Page 30 of 46
Label Certificate (required for all packaged food products) Invoice Packing list describing item, weight, and packing material Certificate of Origin Sanitary / Phytosanitary Certificates Packing Declaration Form (for packing without wood material) Fumigation Inspection Certificate (for packing with wood material)
Importers are responsible for the following documentation: Import authorization document Customs declaration documents Quarantine Certificates Additional product specific documents
Figure 3. Distribution Flow Chart
4.3 Company Profiles
As shown in table 4.2, the food processing industry in China is still very fragmented, a fact confirmed by many in the industry. While the retail sale of processed food in the United States is typically a two-horse race between products such as Coca-Cola and Pepsi, this is clearly not the case in China. The leading retail food processing company only has a total market share of 3.5 percent while the rest in the top twenty have between .6 and 2.9 percent. In fact, 40 percent of the market is shared by over 60 companies, while a tiny portion of the market is taken by artisanal labels with the bulk being in the hands of many small-scale operations. Furthermore, as the table below demonstrates, while there is some stratification in sub-sectors with single entities having a greater share, fragmentation remains.
Table 4.2 Package Food Top 20 Players by Market Share (2001-2004*)% retail value rsp
UNCLASSIFIED USDA Foreign Agricultural Service
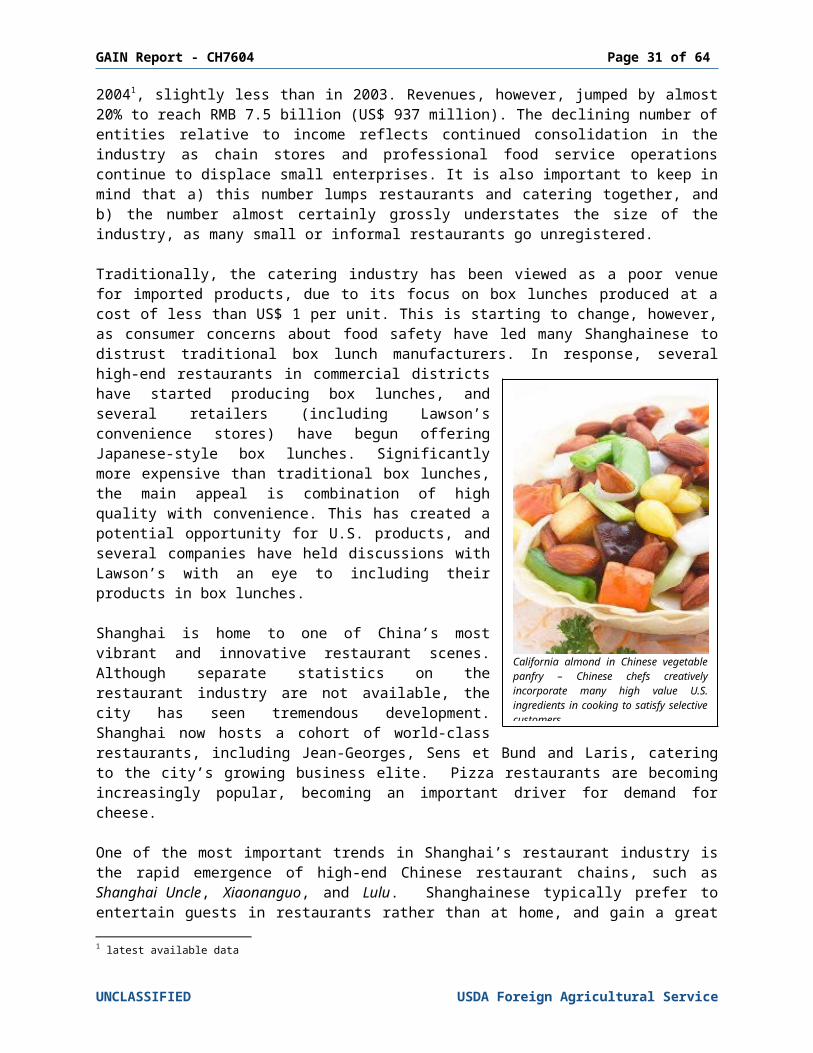
GAIN Report - CH7604 Page 31 of 46
Company 2001 2002 2003 2004*
Ting Hsin International Group 3.3 3.2 3.3 3.5Inner Mongolia Yili Industrial 1.3 1.6 2.3 2.9 Group Co LtdKuok Oils & Grains Pte Ltd 1.3 1.3 2.0 2.3Inner Mongolia Mengniu Group 0.3 0.6 1.3 2.1Shineway Group 1.4 1.7 1.7 1.7Nestlé SA 1.4 1.5 1.6 1.7Bright Dairy & Food Co Ltd - - 1.6 1.6China Yurun Food Industry Group 1.3 1.3 1.3 1.4 Co LtdUni-President Enterprises Corp 1.2 1.2 1.2 1.2Hebei Hua Long Food Co Ltd 0.6 0.8 1.0 1.2Shijiazhuang Sanlu Group 0.6 0.8 0.9 1.0Hai Pa Wang International Food 0.9 0.9 0.9 0.9 GroupPeople's Food Holding Ltd 0.8 0.8 0.7 0.7China National Cereals, Oils & 0.3 0.5 0.6 0.7 Foodstuffs Imp & Exp Corp (COFCO)Danone, Groupe 0.5 0.6 0.6 0.7Want Want Group 0.9 0.8 0.8 0.7Long Fong Group 0.8 0.8 0.7 0.7Wrigley Jr Co, William 0.6 0.6 0.6 0.6Foshan Haitian Flavouring & 0.4 0.4 0.5 0.6 Food LtdBaixiang Food Group 0.5 0.5 0.6 0.6* Latest available full year dataSource: Euromonitor International
Sub-sectors of the retail market are generally fragmented, as shown in Table 4.3. Although the top two companies in each sector may account for over 50 percent of the market, there are usually more than 20 other enterprises in the sector with shares between 0.1 and 10 percent. More often than not 20 to 70 percent of the market share goes to companies too small to list. As the industry is further broken down in smaller and smaller sub-sectors, clear leaders prevail in some cases but not all. For example, while Kraft Foods may have the retail market lead in biscuits it only has a 6.2 percent share and the top 13 companies only have 24 percent of the market.
Table 4.3 Processed Food Retail Sub-Sector Market Share (%) 2001 2002 2003 2004*Baby food International Nutrition Co., Ltd. 12.5 16.9 16.8 18.5 Nestlé SA 17.5 18.8 18.5 18.5Bakery products Danone Biscuits 1.4 1.7 2.0 2.0 Ting Hsin International Group 1.7 1.7 1.5 1.7Canned/preserved food Shineway Group 8.5 11.2 11.9 12.2 Jiangsu Yurun Food Industry Group 4.9 5.2 5.4 5.6Chilled processed food Jiangsu Yurun Food Industry Group 25.0 25.0 26.0 28.0 Shineway Group 5.8 11.8 12.2 14.0Confectionery Wrigley Jr Co, William 6.1 6.4 6.5 6.3 Effem Foods (Beijing) Co., Ltd. 4.0 3.7 3.7 3.8
UNCLASSIFIED USDA Foreign Agricultural Service
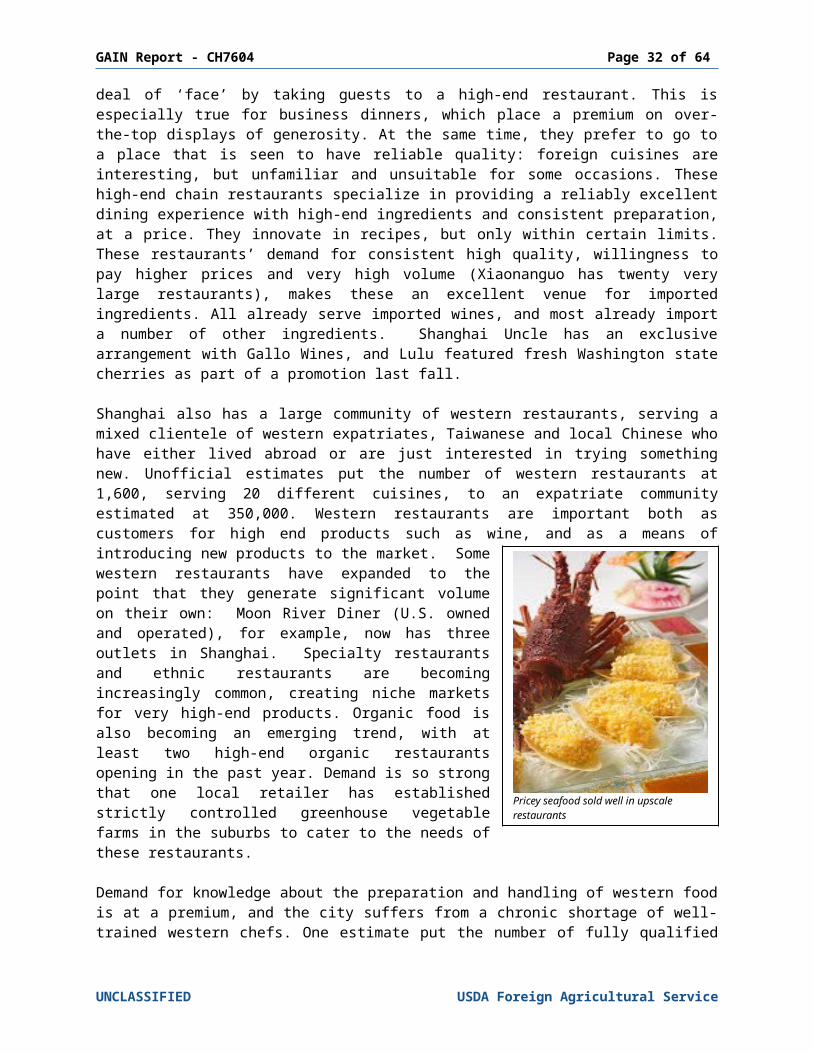
GAIN Report - CH7604 Page 32 of 46
2001 2002 2003 2004*Dairy products Inner Mongolia Yili Industrial Group Co Ltd 7.1 9.9 11.2 15.8 Bright Dairy & Food Co Ltd - - 14.6 13.3Dried processed food Ting Hsin International Group 30.6 29.4 30.3 30.8 Hebei Hua Long Food Co., Ltd. 6.4 8.5 10.0 11.7Noodles Ting Hsin International Group 31.3 30.2 31.0 31.6 Hebei Hua Long Food Co., Ltd. 6.6 8.7 10.2 12.0Oils and fats Kuok Oils & Grains Pte Ltd 32.4 31.0 38.5 38.7 China National Cereals, Oils & Foodstuffs Imp & Exp Corp 6.9 10.0 10.2 10.5Pasta Dongguan Humen Ri Long Food Factory 14.0 15.0 15.3 14.3 Zhuhai Yat Hing Food Ltd 10.5 10.5 10.7 9.4Ready meals Hangzhou Wahaha Group 19.5 19.5 19.5 19.5 Xiamen Tongmao Canned Food Co. 17.0 17.0 17.5 18.0Sauces, dressings and condiments Foshan Haitian Flavouring & Food Ltd 3.0 3.4 4.2 5.7 Lee Kum Kee Co Ltd 2.5 2.7 3.0 3.3Sweet and Savory snacks Wang Wang Group 12.3 11.4 10.1 9.5 Guangdong Strong (Group) Co Ltd 7.9 8.6 9.0 9.5Soup Unilever Group 30.09 33.0 36.0 37.0 McCormick & Co Inc 12.0 12.0 13.0 13.5Spreads Beijing Kewpie Food Co., Ltd. 8.4 8.0 7.8 7.7 Shanghai Ruihua Foods Co., Ltd. 6.4 6.3 6.2 5.4* Latest full year data availableSource: Euromonitor Market Database
4.4 Sector Trends
According to lastest official statistics there are currently 3,958 foreign funded ventures with total combined sales revenue of approximately 550.5 billion RMB ($68.8 billion USD). This represents a growing amount of foreign investment in China as the number of state-owned ventures decreases. Foreign-funded ventures typically have more technology and size than Chinese counterparts, process for the domestic market or re-export and are more likely to use foreign ingredients to attain higher quality and consistent input. Big players in the market include Danone, Cadbury, Cargill, Hormell, Purdue, Nestle, Kraft, Pilsbury, Yum!, Chaeron, Campbell’s, Kellogs, Smithfield, McCormick, and Heinz. Foreign companies have high hopes for China, such as Heinz, which expects 20 - 30 percent of its ketchup supply to come from China and is the market leader in baby cereal. American companies are not the only ones getting into the market though. Asian companies from Japan and Korea play a dominant role in foreign investment while EU investment continues to increase. For example, Nippon Suisan Kaisha recently built its largest plant in Qingdao to process for export to Japan.
UNCLASSIFIED USDA Foreign Agricultural Service
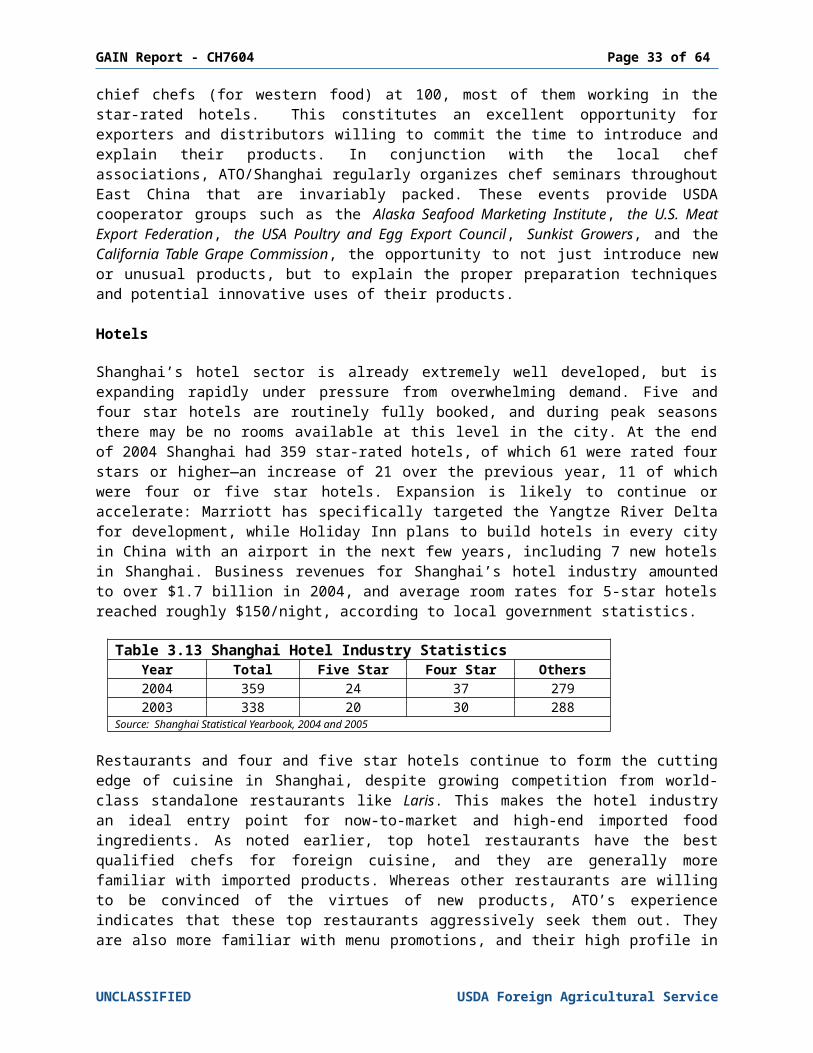
GAIN Report - CH7604 Page 33 of 46
Table 4.4 Foreign Funded Food Industry (As of 2005*) Enterprise
NumberSales Revenue
(billion RMB)Food Processing 2,130 307.2Manufacture of Foods 1,259 137.7Manufacture of Beverages 569 105.6Total 3,958 550.5* Latest full year data availableSource: China Statistical Yearbook 2006
Headaches As the number of foreign-funded enterprises continues to grow there have been, and will continue to be, certain difficulties, especially for production geared toward the domestic market. Many foreign companies are not familiar with the Chinese market or sensitive enough to the importance of price, even among the more affluent and growing middle class. While more and more consumers look towards quality and choice, most, probably more than 80 percent, view price as the most important factor in purchasing processed foods, while less than 20 percent view quality as the primary factor. Given that foreign funded companies tend to produce high quality products at higher prices it can be difficult to break into the Chinese market. In 1993, for example, multinational dairy corporations began to break into China's domestic market. Nestle, Kraft, Danone and Parmalat all began to build their own manufacturing and distribution channels. Soon, however, they met repeated setbacks. Kraft withdrew from the Beijing dairy market in 2002. Parmalat Nanjiing, founded in 2001, saw sales of its dairy products on the decline less than two years later in Shanghai and Nanjing. Danone started a partnership with the domestically owned Bright Dairy Co. in 1992 but by 2001 had only a 3.8 percent share in the joint-venture and by 2002 had granted Bright the right to use its trademarks and designs for free until September 2011. Danone later bounced back to increase its stake in Bright Dairy to 7.7 percent.
Lessons LearnedDairy companies had difficulties entering the Chinese market for several reasons. First, multinationals had fewer domestic farms owing to sensitivities over land ownership. Second, traditional dairy distribution in China relies on a fragmented network reaching every street and community of a city, and it is not easy for foreign brands to penetrate even with substantial investments. Third, and perhaps most importantly, multinationals knew little about Chinese consumption habits and miscalculated the positioning of their products. Parmalat, for example, focused only on high-end products selling its fruit-flavored yogurt for RMB 2 Yuan per cup, double the price of similar local brands, while their milk was sold only in supermarkets in packaged promotions. Lessons have been learned and multinationals are getting over the initial growing pains but there will always be unanticipated setbacks for processors and agricultural exporters especially if they do not conduct research and familiarize themselves with the Chinese industry and market.
Supply Chain Improvement As more foreign retailers set up operations in China, international standards of logistics have been introduced into the country. Central distribution centers are now a common feature of chain supermarkets. In order to keep prices down, suppliers and manufacturers are often required to deliver their goods to the central distribution center of supermarket chains. The chains will subsequently undertake the distribution to their own stores and will levy suppliers and manufacturers a delivery fee of 3-5% on the cost of goods. Many fast-food companies are following the same model of centralized distribution centers. For some premium products such as
UNCLASSIFIED USDA Foreign Agricultural Service
GAIN Report - CH7604 Page 34 of 46
wine and spirits, the major supermarkets have begun importing them into the country directly to save on the extra margin charged by importers.
WTOAs a WTO member country, China is committed to gradually lowering import tariff rates. Tariffs on agricultural imports have been cut to an average of 15.2 percent in 2006. Non-tariff measures, such as most of the import licensing arrangements and import quotas, will also be abolished in phases. China has also committed to liberalizing and allowing greater foreign participation in distribution, telecommunication, finance, and professional services. However, local importers have said that as tariffs on certain commodities drop, some Chinese customs officials have found other ways of raising the cost of importing products, sometimes by increasing the estimated value of products entering the country. China’s entry into the WTO has also changed the status of company’s obligation to have joint venture status. This has allowed foreign companies to have more oversight and control of their operations in China.
UNCLASSIFIED USDA Foreign Agricultural Service
GAIN Report - CH7604 Page 35 of 46
V. Competition
5.1 Domestic Competition
Output of almost all the food commodities in a moderate rise Food price increasing at a faster pace than inflation Grain harvest picking up from the lowest year of 2003 Flat production of oil-bearing crops stimulating the import of substitute crops and edible
oils The 160 million ton supply of domestic fruits not likely to match consumption demand Skyrocketed milk production still lagging behind the fast growing demand Domestic production not fully satisfying the domestic demand in term of quantity and
quality, and the need for food import remaining Media exposure of misuse of chemicals in farm operation and food production lowering
the public’s confidence on food safety
Table 5.1 Domestic Agricultural Output in China, Yield of Farm Crops (10, 000 tons)2000 2001 2002 2003 2004 2005*
Grain 46,217.5 45,263.7 45,705.8 43,069.5 46,946.9 48,402.2
Cereal 40,522.4 39,648.2 39,798.7 37,428.7 41,157.2 42,776.0Rice 18,790.8 17,758.0 17,453.9 16,065.6 17,908.8 18,058.8Wheat 9,963.6 9,387.3 9,029.0 8,648.8 9,195.2 9,744.5Corn 10,600.0 11,408.8 12,130.8 1,1583 13,028.7 13,936.5
Oil-bearing Crops 2,954.8 2,864.9 2,897.2 2,811.0 3,065.9 3,077.1Peanuts 1,443.7 1,441.6 1,481.8 1,342.0 1,434.2 1,434.2Rapeseeds 1,138.1 1,133.1 1,055.2 1,142.0 1,318.2 1,305.2Sesame 81.1 80.4 89.5 59.3 70.4 62.5
Fruits 6,225.1 6,658.0 6,952.0 14,517.4 15,340.9 16,120.1 Apples 2,043.1 2,001.5 1,924.1 2,110.2 2,367.5 2,401.1 Grapes 328.2 368.0 447.9 517.6 567.5 579.4 Citrus 878.3 1,160.7 1,199.0 1,345.4 1,495.8 1,591.9
Meat 6,125.4 6,333.9 6,586.5 6,932.9 7,244.8 7743.1Pork 4,031.4 4,184.5 4,326.6 4,518.6 4,701.6 5010.6Beef 532.8 548.8 584.6 630.4 675.9 711.5Mutton 274.0 292.7 316.7 357.2 399.3 435.5
Milk 919.1 1,122.9 1,400.4 1,848.6 2,368.4 2,864.8
Poultry Eggs 2,243.3 2,336.7 2,462.7 2,606.7 2,723.7 2,879.5
Total Aquatic Products 4,278.5 4,381.3 4,564.5 4,704.6 4,901.8 5107.6 Seawater Products 2,538.7 2,571.7 2,646.3 2,685.8 2,767.8 2838.3 Freshwater Products 1,739.7 1,09.6 1,918.2 2,018.8 2,134.0 2269.3
*Latest available full year dataSource: China Statistical Yearbooks, 2001- 2006
Moderate growth was recorded in the output of most agricultural products in China (Table 5.1). Given rising incomes and living standards, population growth, shrinking arable land and trade
UNCLASSIFIED USDA Foreign Agricultural Service
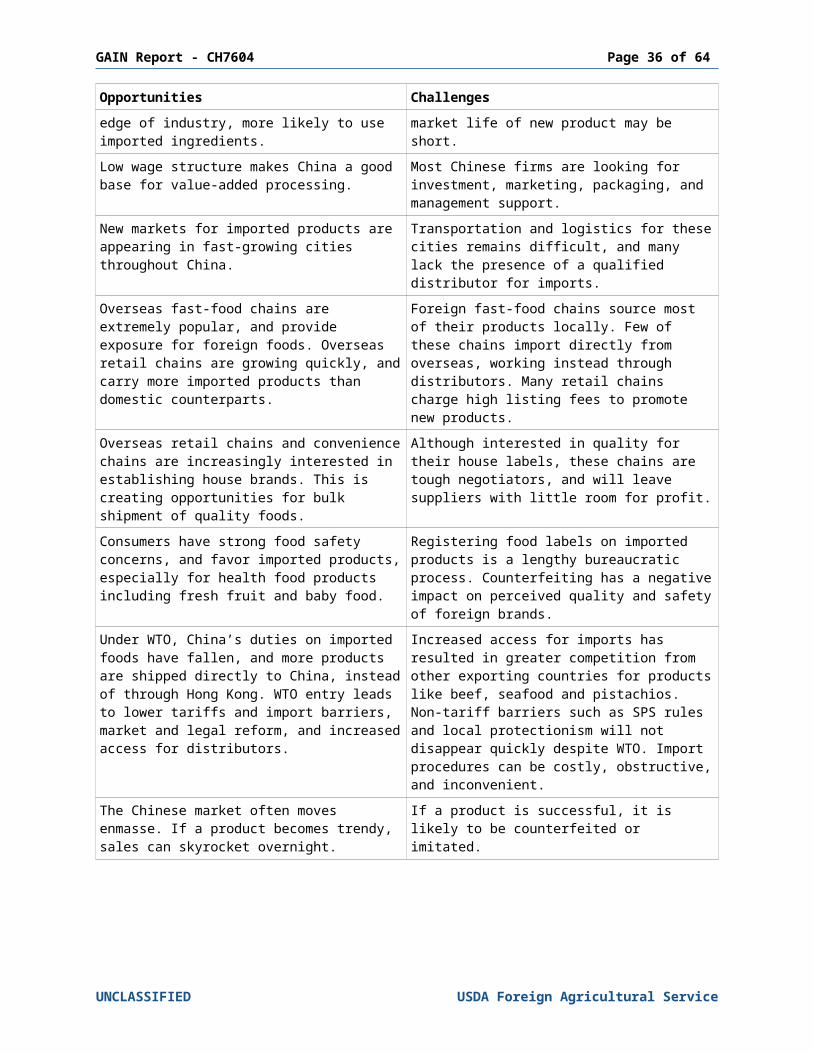
GAIN Report - CH7604 Page 36 of 46
liberalization, the necessity to import more food becomes increasingly evident. Recent years have seen large import volume of a wide variety of agricultural products to China, including grain, cereal, fruit, meat, poultry products, and seafood etc. With China’s grain production no longer under heavy government control, many Chinese farmers are switching to grow more profitable high-value commodities, such as fruits and vegetables. It is therefore not surprising to see the accelerating fruit production in recently years which consists of both conventional domestic varieties and many newly introduced varieties from abroad.
Thanks to the government’s encouragement of milk consumption to the public, milk production has skyrocketed, but still lags behind the fast growing demand. Technology is helping to improve domestic output with many feeling that China will be able to satisfy most of its demand through domestic production. Milk and yogurt consist of the majority of the domestic dairy production, and the industry does not seem to be able to satisfy the increasing demand of high value dairy products such as cheese and whey.
Stagnant production of oil-bearing crops in recent years has resulted in short supply of edible oils to meet fast growing domestic demand. Opportunities arise to import of oils or oil-bearing crops such as soybean to satisfy consumers in favor of oils over animal originated fat for health reasons. Import data of large volume of soybean and edible oil in recent year reflect such demand.
Moreover, the gradual rise in meat production is not likely to match demand. Poultry, beef and lambs have gained increasing share in the pork-dominant meat consumption. Furthermore, China’s domestic fishing industry has been severely strained by over fishing in recent years while aquaculture production continues to increase. China now produces over 70 percent of the world’s aquaculture products.
5.2 Import Competition - 2006
Note: The following information is based on Chinese customs data of China’s import in 20061 retrieved from the Global Trade Atlas System. Commodities are specified by their HS code.
5.2.1 Soybeans (HS Code: 1201)
Total Import Value US$ 7.5 billion, a 3.7 percent decrease from 2005
Import Value from US US$ 2.7 billion, a 36.3 percent share, down 13.9 percent from 2005
Main Products Highlight All the soybeans imported to China were yellow soya beans (120100).
Key Exporting Countries Brazil and US, respectively sharing 37.2 and 34.1 percent of the total import value, led the market. Following was Argentina, at a 20 percent share.
1 Data in this section are for the calendar year of 2006 unless otherwise advise.
UNCLASSIFIED USDA Foreign Agricultural Service
GAIN Report - CH7604 Page 37 of 46
Main Importing Ports and Share 2 East, South and North China each had an even share of the total import: East China: Nanjing (22%), Ningbo (4.3%), Hangzhou (4.1%), Shanghai (2.3%) North China: Qingdao (16.2%), Tianjin (8.5%), Dalian (4.8%), Shijiazhuang (4.3%) South China: Huangpu (8.9%), Nanning (8.3%), Xiamen (5.1%), Zhanjiang (3.1%), Shenzhen
(3.0%)
5.2.2 Fish and Seafood (HS Code: 03)
Total Import Value US$ 3.2 billion, a 9.3 percent increase from the previous year
Import Value from US US$ 407 million, sharing 12.9 percent of the total import, a rise of 18.7 percent from 2005
Main Products Highlight Frozen fish (0303), including cod, pacific salmon, plaice etc, valued US$ 2.4 billion,
accounting for 76.5 percent of the total import of fish and seafood; Other seafood (0307), mainly cuttle fish, squid and sea snails, valued US$ 336 million,
sharing 10.6% of total import; Crustaceans (0306) valued at US$ 292.2 million, a 9.3 percent share
Over 80 percent of the import went through Qingdao and Dalian, going to the processing plants nearby for further processing.
Key Exporting Countries Russia exported US$ 1.2 billion, holding 38.4 percent share; US placed at second with an amount of US$ 407 million, a 12.9 percent share; Canada and Norway each shared 5 percent in the market; Another 13 countries, including India, Netherlands, South Korea etc, each respectively a
share about 1-3 percent. Main Importing Ports and Share Majority of the import entered through northern ports, including Qingdao (58.9%) and Dalian (23.1%). Shanghai held a small share of 4.5 percent.
5.2.3 Meat (HS Code: 02)
Total Import Value US$ 686 million, a 16.84 percent increase from the previous year
Import Value from US US$ 358 million, a 52.4 percent share, a rise of 44.7 percent from 2005
Main Products Highlight
2 In the sections from 5.2.1 to 5.2.10, the percentage after each port is the share of the import value of designated commodity category through all the ports in China. For example, “Nanjing (22%)” in the section “5.2.1. Soybeans (HS Code 1201)” means that 22% of the value of China’s import of Soybeans (HS Code 1201) entered through Nanjing.
UNCLASSIFIED USDA Foreign Agricultural Service
GAIN Report - CH7604 Page 38 of 46
Poultry meat (0207), mainly consisting of chicken paw and wing tips, accounted for majority of this category, with a 67.4 percent share, followed by edible animal offal (0206) with a 20.9 percent share.
Lamb (0204) and pork (0203) accounted for a small share, respectively 7 and 3 percent of the total import value.
China’s import of beef (0202, and 0201) has been minimal at a value of US$ 4.5 million in 2006, owing to BSE. Most imports in 2006 were boneless cut from Australia. Currently the market for U.S. beef is still not officially open, and when the market will be resume remains unknown. Prior to BSE, the United States had 71 percent of the market in imported beef. For comparison, note that the value of imported meat in 2002 was US$ 11.9 million and that the value of imports from the United States was more than US$ 8.6 million.
Lamb (0204), amounted at US$ 50 million, was dominated by New Zealand and Australia, together sharing more than 98 percent of the total import. Pork (0203), amounted at US$ 21 million, was shared by Canada (71.2%), France (14%), USA (4.8%) and Denmark (3.4%)
Key Exporting Countries US was the largest exporter for this category, sharing 52 percent of China’s total meat import, followed by Brazil and France, respectively having a share of 17.4% and 8.8%. Canada, Australia, New Zealand and Argentina, each having a share ranging from 3-5 percent.
Main Importing Ports and Share South China has historically been the largest import region, handling more than 50% of the China’s import. Guangzhou and Shenzhen were the largest importing ports, respectively having a share of 25.7 and 22.7 percent of the country’s total import value.
Shanghai handled most of the meat import in East China, a 24 percent of China’s total import value. In North China, Dalian and Tianjin were the major importing ports, respectively handled 13.6 and 5.5 percent of the country’s total.
5.2.4 Edible Fruit & Nuts (HS Code: 08)
Total Import Value US$ 737 million, 12.4 percent up from 2005
Import Value from US US$ 112.5 million, a 15.3 percent share, 3.4 percent up from 2005
Main Products Highlight This category has a very fragmented composition, because China purchases a wide range of fruit and nuts from various countries:Other fresh fruit (mainly tropical fruits) (0810) US$ 180.9 millionBanana (0803) US$ 116.2 million Other nuts, fresh or dried, including almond, hazelnut, pistachio etc. (0802) US$ 103.6 millionGrapes and raisin (0806) US$ 85.1 million Fruit & nuts, frozen, including strawberry, raspberry, blackberry etc. (0811) US$ 56.0 millionCitrus, fresh or dried (0805) US$ 54.5 million
UNCLASSIFIED USDA Foreign Agricultural Service
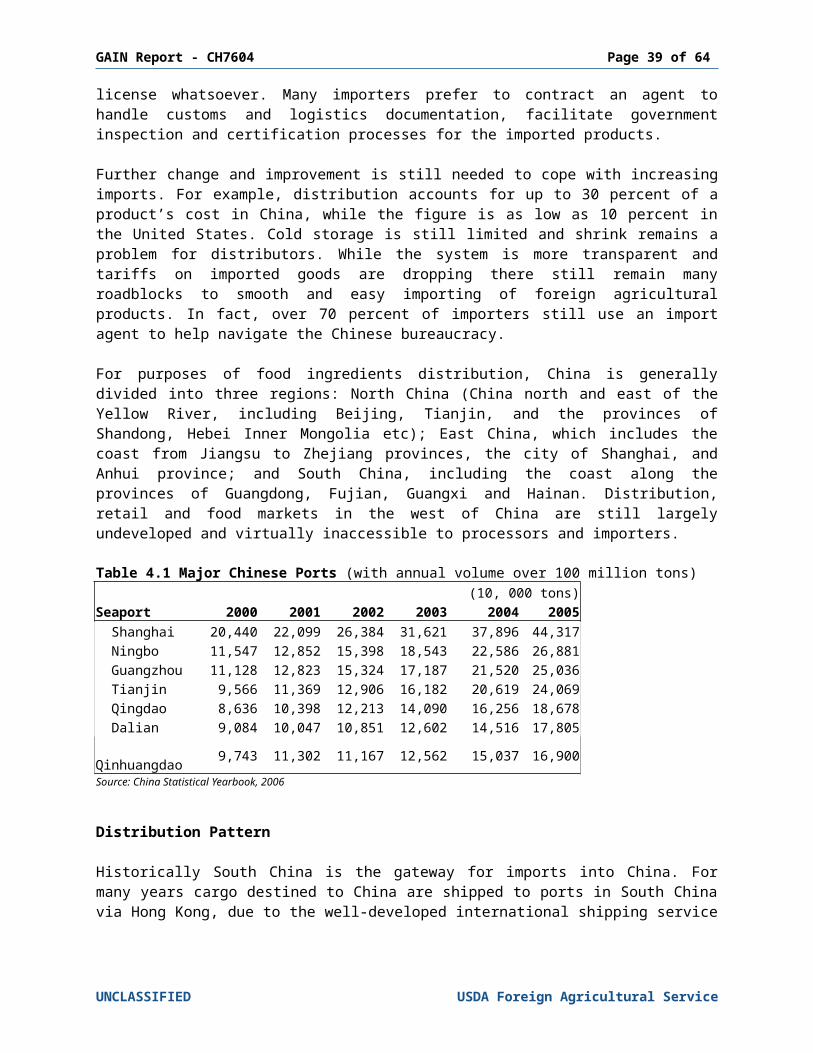
GAIN Report - CH7604 Page 39 of 46
Other dried fruit, including dried Longan, prune etc. (0813) US$ 34.8 millionDate, fig, pineapple etc (0804) US$ 33.8 million Melon, papayas, fresh (0807) US$ 27.7 million Apple, pear, quince, fresh (0808) US$ 25.3 millionCoconut, Brazil nut, Cashew nut (0801) US$ 14.1 million
Key Exporting Countries Thailand, Philippines, USA, Vietnam and Chile were the largest exporters of edible fruit and nuts to China, respectively holding a share of 23.4, 15.4, 15.3, 12.5, and 7.4 percent of China’s import value.
Export from the US included table grape, citrus, apple, cherries, raisin, almond, pistachio, etc. at a total value of US$ 112.5 million.
For fresh fruit, Thailand, Philippines, USA, Vietnam, Chile, New Zealand, Australia and South African are the main exporting countries; For nuts, US, Russia, Iran, Korea are the major players.
Main Importing Ports and Share South China has historically been the largest import region for fruit and nuts, handling more
than 50% of the China’s import. Most of the imported fruit and nuts are consumed in this region, and a small portion is distributed to East or North China. Major importing ports are Guangzhou (27.1%), Nanning (11.4%) and Shenzhen (10.6%).
East China: Shanghai (12.2%) North China: Dalian (10.4%), Qingdao (6.1%), Tianjin (4.0%)
5.2.5 Dairy Products (HS Code: 04)
Total Import Value US$ 565 million, 22.2 percent up from 2005
Import Value from US US$ 84.5 million, a 15 percent share, 38.8 percent up from the previous year
Main Products Highlight The import mainly consisted of powdered milk (0402, 51.6%), whey (0404, 34.1%). Cheese (0406, 6.8%) and butter (0405, 4.8%) only accounted for a small portion of the import.
---Powdered milk (0402)Value of US$ 291.6 million, of which US$ 226.9 million (77.8%) were from New Zealand, and US$ 27.8 million from US (9.5%), and US$ 24.5 million (8.4%) from Australia. Domestic dairy plants consume substantial of the powdered milk.
---Whey (0404)Import value of US$ 194 million, 23 percent up from the previous year. France and the US were the largest exporters, respectively accounting for 27.8 and 27 percent of China’s imports. Netherlands, Finland, Australia and Ireland each had a 5-7 percent share. Whey based products of rich protein but low fat are becoming popular in China as increasing number of consumers become aware of the products.
---Cheese (0406)
UNCLASSIFIED USDA Foreign Agricultural Service
GAIN Report - CH7604 Page 40 of 46
Import value US$ 38 million, 44.3 percent up from the previous year. In this relatively small section, New Zealand and Australia had the largest shares, respectively 38.1 and 30 percent. US had a share of 10.1 percent. France, Germany, Demark and Italy each had a 2-5 percent share. China itself has very limited cheese production, and products available in the market are almost all imported. Despite the currently small sales, the consumption of cheese is quickly growing in big cities, as products such as cheesecake become very popular.
---Butter (0405)Import value US$ 27 million, 14.8 percent down from the previous year. New Zealand dominated in the export to China, accounting for 79.5% of total imports. Australia, Finland and France respectively had a 3-5 percent share in China’s import. Though the fast growing bakery sector in China would help expand butter usage, the health conscious consumers still limit intake.
Main Importing Ports and Share North China: Tianjin (34 %), Beijing (4.3%), Dalian (3.1%)East China: Shanghai (29.1%), Nanjing (2.4%)South China: Huangpu (8.2%), Gongbei (7.3%), Guangzhou (2.4 %)
5.2.6 Preserved Food (HS Code: 20)
Total Import Value US$ 198.3 million, 26.4 percent up from 2005
Import Value from US US$ 60.7 million, accounting for 31 percent of the import value, 33 percent up from 2005
Main Products Highlight Fruit juice (2009) import value of US$ 99 million, accounting for 50 percent of China’s import
value of preserved food, 35 percent up from 2005; 56% of the import from Brazil, and 24% from Israel. US contributed 5%.
Prepared potato (2004) import value of US$ 44 million, accounting for 22 percent of China’s import value of preserved food, 6.5% up on 2005; Majority of imports were from US.
Prepared fruit (2008) import value of US$ 43 million, accounting for 22 percent of China’s import value of preserved food, 28 percent up from 2005. Majority of the import was prepared citrus from US and Brazil.
Main Importing Ports East China: Shanghai (43%)North China: Tianjin (15%), Beijing(7%)South China: Shenzhen (10%), Huangpu (9%)
5.2.7 Cereal (HS Code: 10)
Total Import Value US$ 821 million, dropped 41.6 percent from the previous year
Import Value from US US$ 53.0 million, a 5.2 percent share, dropped 59.2 percent from previous year
Main Products Highlight
UNCLASSIFIED USDA Foreign Agricultural Service
GAIN Report - CH7604 Page 41 of 46
The majority of the cereal import in 2006 consisted of barley (1003), rice (1006) and wheat (1001), respectively a share of 49.5%, 35.2% and 13.1%.
---Barley (1003)Value of US$ 406 million, of which US$ 311 million (74.6%) was from Australia, and US$ 92.3 million from Canada (22.7%). Breweries consume a substantial portion of the imported barley. In 2006, more than 60 percent of the barley import went to North China, via Dalian, Qingdao, Shijiazhuang and Tianjin. The rest was shipped to East and South China via a number of ports.
---Rice (1006)Import value of US$ 288 million. This section was almost Thailand’s monopoly who held a 97% share of the market. 90 percent of the import entered Guangdong for local consumption.
---Wheat & Maslin (1001)
Import value US$ 108 million. Australia sold US$ 55 million, ranking the first, and US sold US$ 33 million, holding 31 percent market share, followed by Canada of US$ 19 million sales and a 17.6 percent share.
About 70 percent of the import in 2006 was shipped to South China via Shenzhen and Guangzhou for milling, and 23% to East China via Shanghai, Nanjing and Hangzhou. The rest went to North China via Tianjin and Qingdao.
It is worth noting that China harvested 49 million tons of wheat in 2006, the highest in past seven years, and that the import of wheat has dramatically dropped since 2003.
---Corn (1005)Import value US$ 11.9 million, of which US$ 9.6 million was from US, accounting for 80 percent. The rest was from India, Laos and a number of other countries. Qingdao was the largest importing ports in China in 2006, handling 67 percent of the import, followed by Tianjin (8.7%), Shanghai (7.8%) and Kunming (6.1%). Only about 5 % were handled in South China.
---Oats (1004)Import value US$ 3.8 million, all of which was from Australia. Shenzhen was the main port of entry, handling 63% of total imports.
5.2.8 Fats & Oils (HS Code: 15)
Total Import Value US$ 3,924 million, a 18.7 percent increase from 2005
Import Value from US US$ 26.6 million, only 0.7 percent share of China’s total import, but a 130 percent leap from 2005
Main Products Highlight The import of oils and fats in 2006 included:Palm oil (1511) US$ 2,296.7 millionSoybean oil (1507) US$ 802.6 millionCoconut, palm kernels or Banassu oil (1513) US$ 251.8 millionAnimal and vegetable oil and fats, hydrogen (1516) US$ 164.8 millionBovine, sheep and goat fat (1502) US$ 141 million
UNCLASSIFIED USDA Foreign Agricultural Service
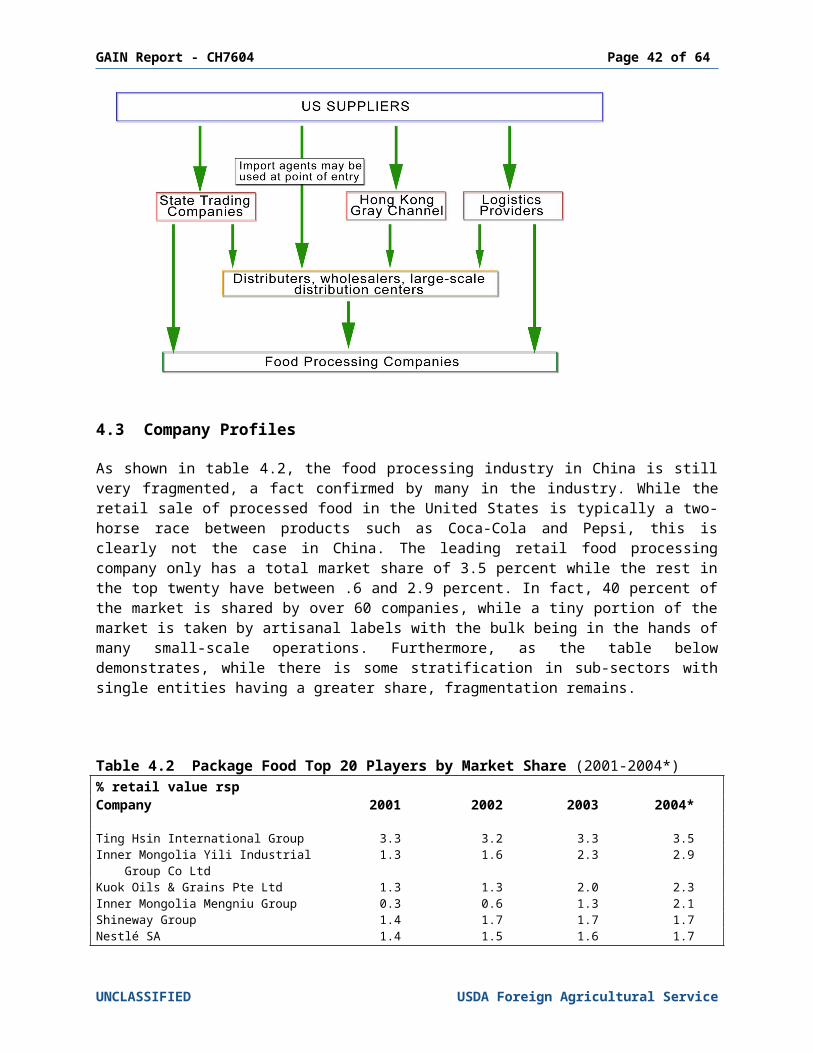
GAIN Report - CH7604 Page 42 of 46
Fixed veg oil and fats nesoi (1515) US$ 75 millionMargarine (1517) US$ 58 millionRapeseed, Colza or mustard oil (1514) US$ 28 millionFats & oils, fish and marine mammal (1504) US$ 28 millionOlive oil (1509) US$ 22 millionVarious seed oil (1512) US$ 20 million
Key Exporting Countries Malaysia was the largest exporter to China, realizing export worth US$ 1.6 billion, holding a 41.7 percent market share; Indonesia was the second largest exporter to China, with export value of US$ 1.1 billion, a 27.3 percent share of the market; Argentina placed at the third, with the value at USS 670 million, 17 percent share of the market. The rest of the market was fragmented by a number of countries, including Brazil, Australia, and India etc.
Main Importing Ports and Share East China: Nanjing (28.4%), Shanghai (7.3%), and Hangzhou (2.8%)North China: Tianjin (17.8%), Qingdao (5.4%), and Dalian (2.1%)South China: Huangpu (16.2%), Shenzhen (6.2%), and Xiamen (2.3%)
5.2.9 Vegetables (HS Code: 07)
Total Import Value US$ 755.6 million, 44.3 percent up from 2005
Import Value from US US$ 24.5 million, only accounting for 3.2 percent of China’s vegetable import, though 43.5 percent up from the previous year
Main Products Highlight Dried manioc (0714) import value of US$ 620.5 million, accounting for 82 percent of total
vegetable import, 47 percent up from 2005; majority from Thailand and Vietnam. Dried peas (0713) import value of US$ 98.8 million, accounting for 14% of the vegetable
import, 35.2% up from 2005; Canada accounted for 60 percent of the import, and India for 26 percent. US had a share of 6 percent.
Frozen vegetables (0710), import value of US$ 20 million, accounting for 3.4 percent of the vegetable import, 11 percent up from 2005. The supply is dominated by the US, accounting for 83 percent of the import in 2006, an increase of 19 percent from 2005. New Zealand contributed 10 percent to the supply. About 90 percent of the imported frozen goes to north and east of China via Shanghai, Qingdao, Ningbo and Tianjin. Only one-tenth of the import goes to the south via Xiamen and Huangpu.
5.2.10 Preparations of flour (HS Code: 1901)
Total Import Value US$ 281.8 million, 60.5 percent up from 2005
Import Value from US US$ 12.7 million, only 4.5 percent share of the import value, an increase of 43 percent from 2005
Main Products Highlight
UNCLASSIFIED USDA Foreign Agricultural Service
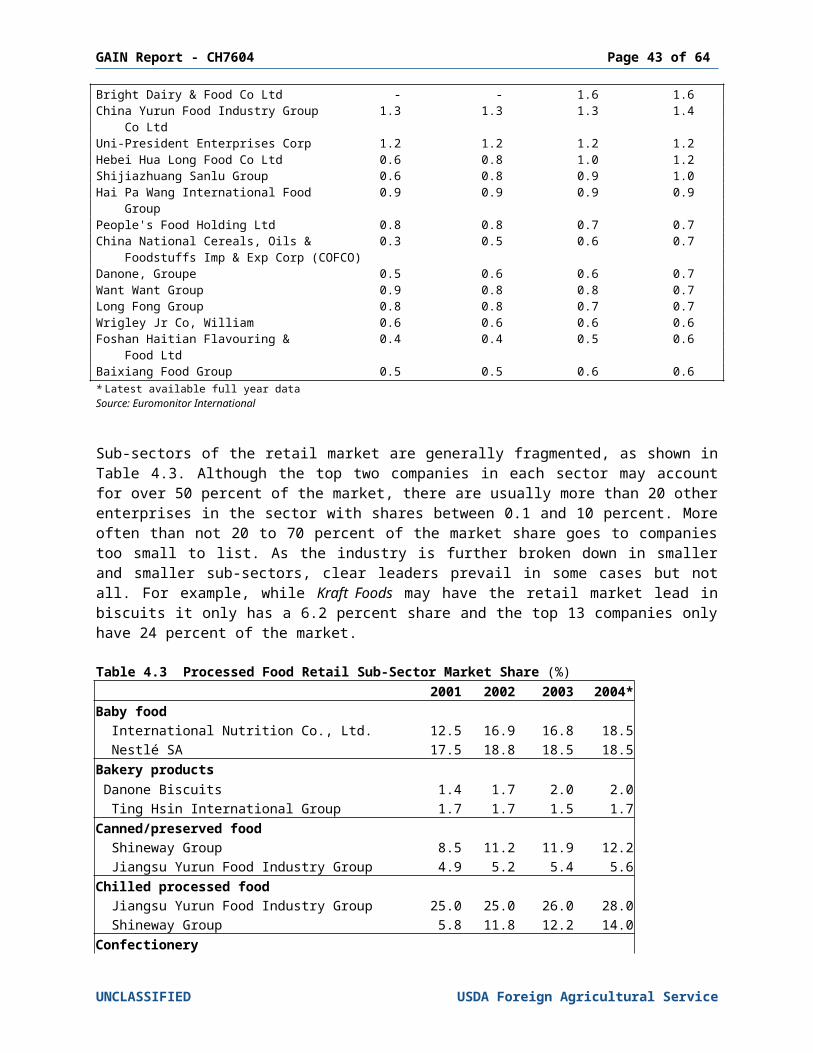
GAIN Report - CH7604 Page 43 of 46
There is no surprise to see the surge in China’s import of flour preparations, owning to the fast growth of baking sector in the most-developed parts of the country.
Key Exporting Countries Many countries are aggressively seeking business in this new sector in China, including: Singapore (34%), New Zealand (25%), Ireland (10.2%), Demark (9%), Netherlands (8%), USA (5%) etc.
Main Importing Ports and Share East China: Shanghai (41%)South China: Shenzhen (36%), Huangpu (9%), Gongbei (8%)
VI. Good Product Prospects
Below highlights favourable conditions for the export of U.S. ingredients to the China market:
Anticipated continuous strong growth on China’s economy strongly supports the fast development of food industry and food consumption in the country;
Strong Chinese currency “Renminbi” versus U.S. dollar makes U.S. food export more competitive in the price-sensitive China market;
Average import tariff on agricultural products was further lowered down to 15.2% in 2006; Strong demand for food products of high quality, health benefit, and convenience will
particularly fit a broad range of U.S. ingredients, from grain and cereal to produce and meat products, which features rich nutrition, safety, and advanced technology.
Developing corn and wheat goods will suit US exporters particularly well. Dairy products continue to grow in popularity among Chinese consumers, and improving
cold storage capabilities and expansion of supermarket chains will ensure a steady demand. Moreover, the limited availability of high value dairy products such as cheese and whey powder creates opportunities for U.S. dairy export.
Established and growing bakery sector in affluent regions in China creates strong demand for high quality baking ingredients
China’s consumers are demanding more and more fish and seafood. At the same time, domestic seafood production is limited by new limits on fishing.
Increasing foreign exposure is increasing popularity of western-style food and diet. Sophisticated baked goods are becoming more popular, and bakeries need high quality
imported ingredients. More and more bakeries are also using innovative ingredients in traditional products such as moon cakes.
Limited domestic production of oil-bearing crops has resulted in sound demand of imported soybeans.
China is a price sensitive market, and price remains one of the constraints that U.S. exporters encounter. Ingredients with high price tags are only limited in high-end niche in well-developed regions. A competitive price would help increase the share in the market.
Good Prospects for Ingredients in China
Soybeans
UNCLASSIFIED USDA Foreign Agricultural Service
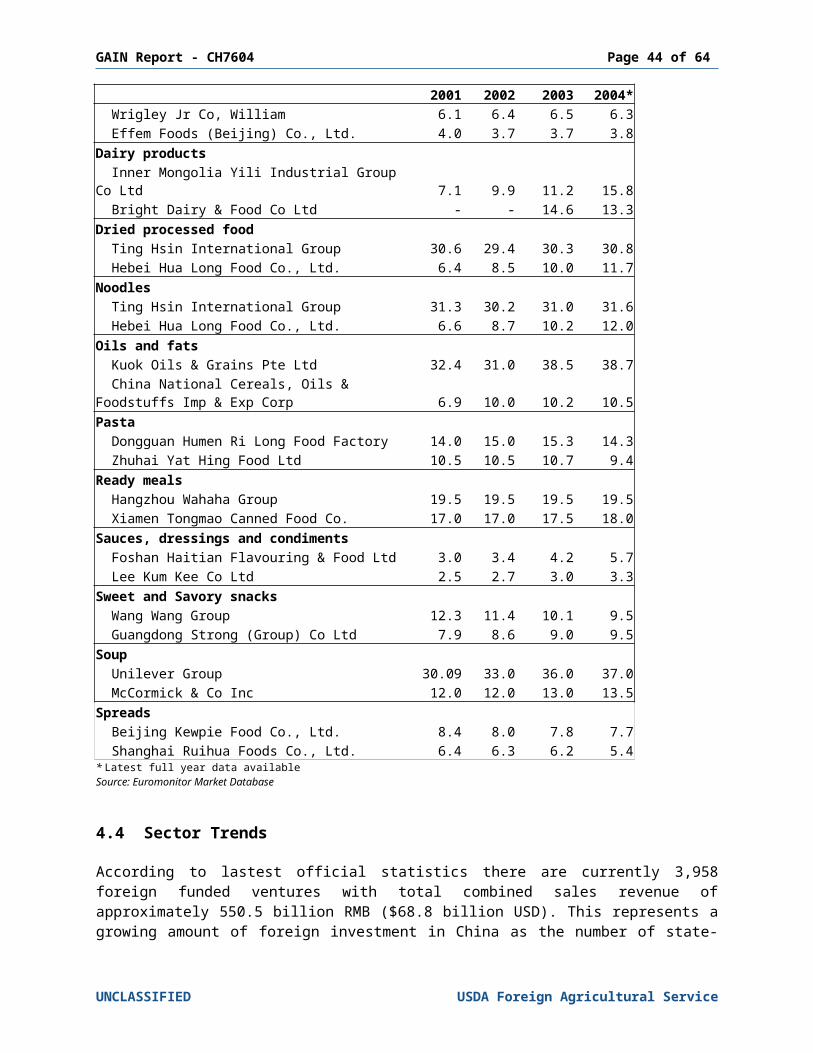
GAIN Report - CH7604 Page 44 of 46
China does not have enough supply to meet increasing domestic demand for soybeans. The shortfall of domestic oil-bearing seeds for years has resulted in greater demand for soybean imported from other countries. In 2006, China's import of soybeans exceeded 28 million tons at a 6.3% rise from the previous year. Meanwhile soybean exports dropped to only 395,000 tons by 4.5%, a much lower level compared to the import volume. The productions of high-value product such as soybean protein, as well as increasing proportion of soybeans in the daily diet also boost demand. US is one of the largest soybean exporter to China, enjoying 34% of the market share. The market is in favor for the US to further extend market share in China.
SeafoodChina's national statistics shows a significant increase of seafood in Chinese's daily diet, especially in the more affluent region. The well-developed restaurant sector, especially the upscale restaurants, has immediate urgency for top-quality food ingredients to better serve discriminating mouths. Urban dwellers in big cities, especially South China which offers diverse food options, are crazy for premier seafood. Currently a significant portion of China’s seafood import is consumed by processing plants for re-export. High quality and uniqueness originating from the growing area can place U.S. seafood at a very competitive position in the China market. The local demand for high quality seafood in affluent regions gives rise to promising prospects for high quality U.S. seafood such as Alaska seafood.
Poultry productsUS and China fit very well in the poultry consumption, as both have large consumption, but on totally different parts of a chicken. Chinese love chicken paws, wings or wing tips, and Americans favor the meaty chicken breast. For years, China has been the largest importer of U.S. poultry products. In addition, per capita consumption of poultry, especially in urban area, is also increasing. The demand for U.S. poultry is very likely to continue and increase, as more Chinese consumers, especially those in a less developed region, with the increasing disposable income, are likely to purchase larger quantity of such affordable food items as chicken paws and wing-tips.
BeefSimilarly to seafood, good prospects for beef originate from Chinese consumers' pursuit of premier food. Currently the China market remains closed to U.S. beef, but demand will be immediate once the market is resumed, as recognition of the taste and quality among upscale restaurants and hotels is high. It is advisable for potential exporters to keep a close eye on the China market.
Dried Fruit & NutsThe versatility of U.S. dried fruit and nuts has a lot to offer affluent Chinese consumers. The pursuit of leisure, health, convenience in life has created huge demand for food in various forms, e.g., snacks, baked products, convenience food etc, into which U.S. dried fruit and nuts can certainly add value. Furthermore, Chinese has a traditional belief that some types of food possess specific health attributes. Such belief with the increasing disposable income has led many consumers to a higher level of consumption of pricey food items believed to possess certain health benefit. Many of the U.S. dried fruit and nuts, have been scientifically proved to contain high levels of certain types of healthy substances,
for example, rich anti-oxidants in blueberry, high vitamin E content in almond, etc. Educating consumers will certainly differentiate the product and encourage the consumption.
UNCLASSIFIED USDA Foreign Agricultural Service
Nuts in traditional-styled package are popular gifts in Chinese New Year.
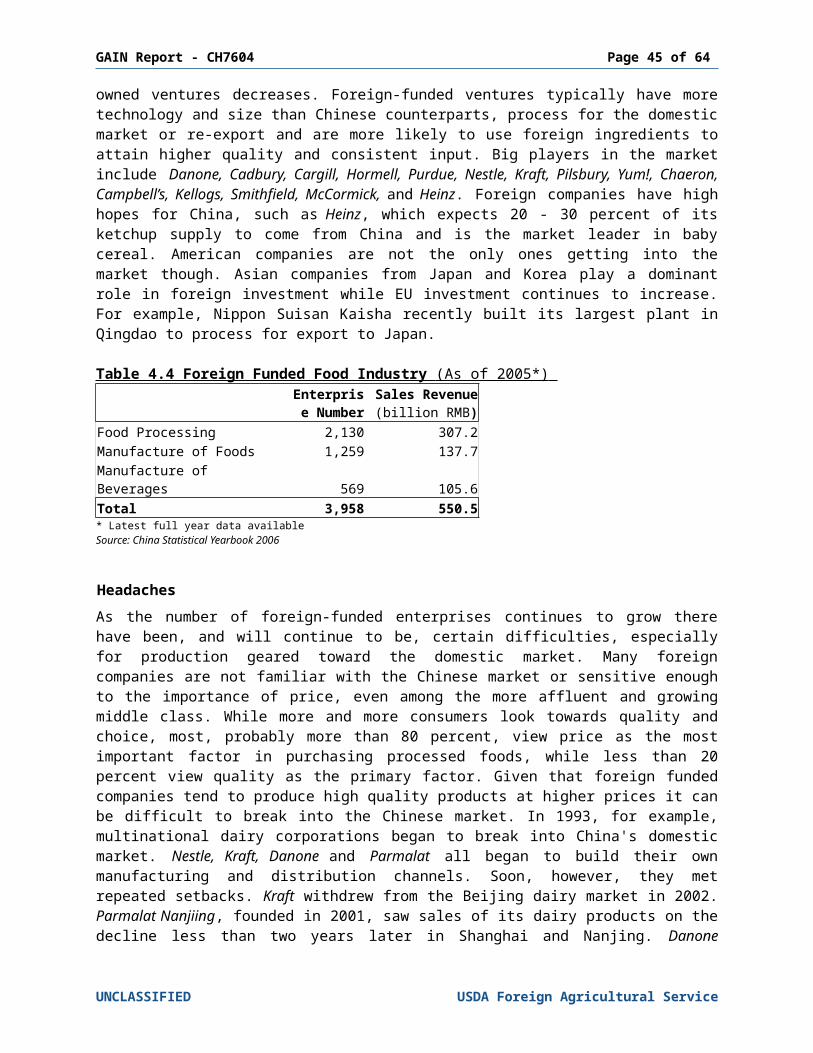
GAIN Report - CH7604 Page 45 of 46
Fresh FruitU.S. fruit is popular in China despite the higher prices compared to domestic fruit in season. In addition to consumption for the home, consumers buy pricey, usually imported fruit as gift to give important personal or business contacts which has become popular practice, especially on such occasions as important festivals, or visiting friends. In spite of relatively high prices, consistent high quality and uniqueness of U.S. fruits are strong attributes to affluent Chinese consumers in the highly competitive market.
High Value Dairy ProductsHigh-value dairy market has very limited presence in China market, despite the fact that milk consumption has skyrocketed in recent years. Dairy products, especially high value dairy products, such as cheese, has very limited presence in the traditional Chinese diet, and as a result, consumers have little knowledge of these products. However, there is promising potential for high value dairy products to fit food consumption pattern that is becoming more diverse and richer in protein, especially in well-developed areas. Food containing dairy ingredients, e.g. cheesecake, has started to gain popularity in the big cities. Increasing number of baked products is entering the food market in China. The fast growing sectors of bakery and health food manufacturing deliver high value dairy products to consumers. Increasing potential consumer’s awareness and knowledge of dairy products ignite the demand for high value dairy products by a larger consumer group.
Grain & CerealFast growing food processing sectors and consumers’ changing life style in well-developed areas has provided sound opportunities for high quality grain and cereal ingredients such as wheat and oats. Food sectors, e.g., bakery need high quality wheat flour to enhance the their product quality in terms of texture, content of nutritional substance and taste. In addition, consumers in well-developed areas favor baked products and ready-to-eat cereals, especially for breakfast, which simultaneously offer health benefit and convenience. Opportunities for high quality grain and cereal ingredients may also arise in developed area in China where per capita consumption of grain has started to decline, as health conscious consumers are willing to include less carbohydrate, but more nutritional substances such as dietary fiber and protein which are richer in U.S. grain and cereal.
Potato ProductsDespite being the largest potato grower in the world, China annually imports processed potato products worth multimillions. Processed potato products, for example, dehydrated potato, has the versatility to be used as ingredients in food manufacturing, cooking, and baking.
Baking IngredientsSuch products are well suited to the fast growing baking sectors which attempt to differentiate their products against competitors.
Safe Food AdditivesAdditives that enhance the features of processed products, such as preservatives, emulsifiers, flavorings or colorings, are in good demand, especially for large or upscale enterprises.
UNCLASSIFIED USDA Foreign Agricultural Service
Cheese and blueberries becoming popular in bakeries, but limited to the upscale niche due to high price
GAIN Report - CH7604 Page 46 of 46
VII. Post Contact and Further Information
For further market information, please contact the appropriate ATO office. FAS/China has ATOs in Beijing, Shanghai and Guangzhou. E-mail and fax numbers are as follows:
ATO Beijing: [email protected], (8610) 8529-6692
ATO Shanghai: [email protected], (8621) 6279-8336
ATO Guangzhou: [email protected], (8620) 8666-0703
For policy issues, please contact the Agricultural Affairs Office in the US Embassy in Beijing at:
OAA Beijing: [email protected], (8610) 6532-2962
Further information is also available on the USDA China website at http://www.usdachina.org.
UNCLASSIFIED USDA Foreign Agricultural Service