“Food price inflation in the dairy sector: the role of ... · the role of retailers’ strategies...
22
E. Castellari, D. Moro, S. Platoni, P. Sckokai, C. Soregaroli January, 2013 “Food price inflation in the dairy sector: the role of retailers’ strategies”
Transcript of “Food price inflation in the dairy sector: the role of ... · the role of retailers’ strategies...

E. Castellari, D. Moro, S. Platoni, P. Sckokai, C. Soregaroli
January, 2013
“Food price inflation in the dairy sector:
the role of retailers’ strategies”

January, 2013
2
High frequency data
Data are from Symphony IRI Group
156 weeks (2009-2011)
400 points of sale (POS) described by
Chain name (blinded as “chain A”)
Retailer Formats (Hyper, Super, Superette)
We don’t know where the store is located
(just in Italy), discounts are excluded
Sample is not representative
9 dairy product categories: Butter, Mozzarella, Ricotta, Processed cheese, Yogurt
Cream and Milk (both refrigerated and UHT)

January, 2013
3
An Example: Within the Refrigerated milk category:
for each
• Week (156)
• Point of sale (400)
• Group(14)
We observe
• Value Volume and Unit sold with\without Temporary Price
Reductions (TPR)
• Price in volume, value and Unit with\without TPR
Brand Unit (BU)=
Producers x Brands x Packaging

January, 2013
4
I. Do retailer strategies influence prices? How?
II. What is the influence of certain observed retailer’s
strategies on food prices?
• Assortment strategy;
• PL share;
• PL shelf depth;
• Promotion;
• PL promotion intensity.
III. What is the magnitude of specific chain and format
not observed strategies on prices variation?
Research Questions:

January, 2013
5
Research Design:
I. For each of the dairy product available we compute drift-free
indexes chain-format specific over weeks.
II. Use three-way ECM estimator to capture the unobservables
due to chain time and format variation.
III. Identify the contribution of some observed retailer strategy on
prices.
The observed retail strategies are:
-Promotion (overall and PL promotion);
-Assortment;
-PL presence and shelf depth .

January, 2013
6
What price index?
The use of high frequency scanner data on computing
Price indexes has many advantages:
I. Product price and quantities of all goods are available
-> Superlative weighted CPI
I. Use actual consumer purchasing behavior
-> CPI accounts for all observable and unobservable
marketing strategies influencing consumption

January, 2013
7
1. However, some complications arise:
Chain Drift Bias:
Caused by some price dynamics known as “price and quantity
bouncing” (Nakamura et al. 2011, Ivanic et al. 2011, Haan and van der
Grent 2011)
“Quantity bouncing arises from the fact that households tend to
stock up during sale periods and consume from inventory at times
when the goods are not on sale” (Haan and van der Grient, 2011)
Presence of chain drift bias has been found comparing price
indexes calculated with all prices and only with “regular prices”,
without sales (Nakamura et al.,2011)
Highly disaggregated unit and time values will lead to more
volatile and unstable estimates of price changes (Ivancic et al.
2011).

January, 2013
8
Solutions to overcome the Chain Drift Bias:
I. Nakamura et al. (2011) analysis suggests that “averaging within
chains will ameliorate the chain drift problem.” However “…the
chain drift problem will not be solved solely by averaging data
across stores within retail chains”.
II. Ivanic et al. (2011) show conventional superlative indexes, even
calculated at the level of aggregation that empirically seems to
minimize the drift bias, “show a troubling degree of volatility when
high-frequency data are used”
They proposed the use of a drift-free multilateral index
GEKS index.

January, 2013
9
1.A) Index Calculation:

January, 2013
10
1.B) Index Calculation:
January, 2013
11
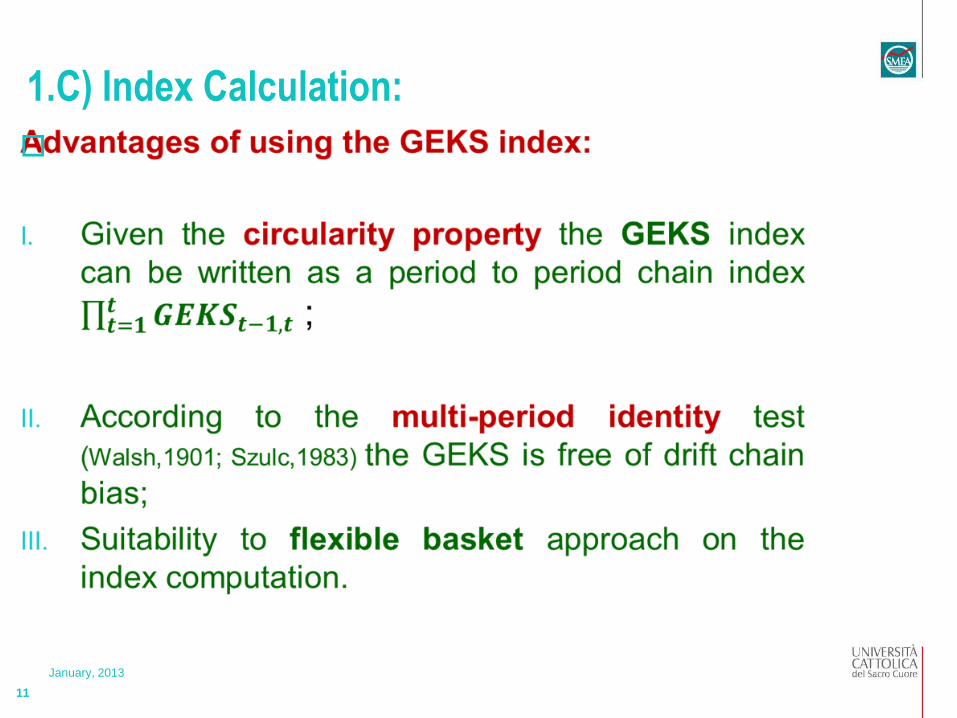
1.C) Index Calculation:

January, 2013
12
1.D) Index Calculation:

January, 2013
13
Observed retailer Strategies:

January, 2013
14
Descriptive Statistics:
Mean values
Butter Cheese Milk UHT Mozzarelle Cream Yogurt
GEKS-Price 7.12 9.06 1.43 0.96 7.70 4.48 4.22
Assortment 15.27 12.58 15.85 26.47 23.54 13.15 86.67
Share PL 0.28 0.03 0.11 0.16 0.19 0.21 0.09
PL Shelf Depth 0.40 0.30 0.28 0.70 0.41 0.40 0.58
Promotion 0.22 0.32 0.05 0.32 0.31 0.20 0.26
PL Promotion 0.17 0.15 0.12 0.22 0.23 0.19 0.22

January, 2013
15
Model Specification and estimation:

January, 2013
16
Results Variable
Butter Cheese UHT Milk
FE RE FE RE FE RE FE RE
Constant 7.1759*** 9.7064*** 1.0224*** 1.3174***
Assortment 0.0056** 0.0057**
0.0063 0.0079* -0.0002 -0.0002 0.0073*** 0.0075***
Share PL -0.4587*** -0.4193***
-
0.3252 -0.2020 -0.0392*** -0.0331** -0.2690*** -0.2729***
PL Shelf
Depth 0.9635*** 0.9302*** 0.5905*** 0.5074*** 0.0714*** 0.0671*** 0.1039*** 0.1071***
Promotion -1.9547*** -1.9555***
-
3.0148*** -3.0106*** -0.3281*** -0.3281*** -0.1751*** -0.1885***
PL Promotion 0.1063*** 0.0948*** 0.2192*** 0.2094*** 0.0275*** 0.0251***
0.0007
0.0019
R squared 0.6795 0.6856 0.6709 0.7503
0.2146 0.5531 0.00370 0.0057
0.1137 0.1049 0.00020 0.0007
0.1282 0.1375 0.00015 0.0019
0.1967 0.1967 0.4627 0.4627 0.0035 0.0035 0.0031 0.0031

January, 2013
17
Results Variable
Mozzarella Yogurt Cream
FE RE FE RE FE RE
Constant 7.9673*** 4.7864*** 4.8963***
Assortment 0.0084*** 0.0296*** -0.0022*** -0.0023*** -0.0133*** -0.0101***
Share PL -2.1910*** -2.1393*** -2.3033*** -2.2219*** -0.4655*** -0.4369***
PL Shelf Depth 0.5814*** 0.4616*** 0.2311*** 0.2596*** 0.1594*** 0.1873***
Promotion -2.9341*** -2.9099*** -1.5281*** -1.5096*** -1.5510*** -1.5544***
PL Promotion 0.5934*** 0.5614*** 0.2149*** 0.2056*** 0.2640*** 0.2462***
R squared 0.5085 0.6574 0.5648
0.2325 0.0284 0.1269
0.0240 0.0015 0.0025
-0.0064 0.0025 0.0075
0.3525 0.3525 0.0476 0.0476 0.1250 0.1250

January, 2013
18
Results
Assortment strategy has a mixed effect among products (Overall positive effect on price index with the exception of yogurt and
cream).
A higher PL market share has a negative effect on the Price
Index over all products categories.
However, a higher variety of the PL products in the shelf
(shelf depth) has a positive influence on the Price index.
• Do categories with higher price attract more consumers after the PL
entry?
• Do higher PL variety bring an increase of PL prices?

January, 2013
19
Result 2:
Higher rate of promotion activity, considering both NB and
PL products, has a negative impact on Price indexes;
However, a higher PL promotion share has a positive effect
on prices.
• Does PL promotional share have lower impact on price Index reduction
with respect to promotion on NB products?
• Are promotions on PL smaller on value with respect to NB products?

January, 2013
20
What is next?
Explore effect of retailer strategies on the inflation rate of
the overall dairy industry (considering all products covered
by our dataset)
This will imply the construction of an unique model with all
products category included.
Investigate the casual relationship between NB prices and
PL share.
The literature is controversial. Giving the high level of
disaggregation of our database, we can explore the research question
controlling for more effects (sub group in a products, chains and
formats, POS etc..)

January, 2013
21
Selected references
• Davies (2002). "Estimating multi-way error components models with unbalanced panel
data structures" Journal of Econometrics, 106, 67-95.
• de Haan J., van der Grient H.A., (2011). “Eliminating Chain Drift in Price Indexes Based
on Scanner Data”. Journal of Econometrics 161, 36–46.
• Ivanic L . et al. (2011). “Scanner data, time aggregation and the construction of price
indexes.” Journal of econometrics,161,24-35.
• Nakamura A.O et al. (2011).“Price dynamics, retail chain and inflation measurement.”
Journal of Econometrics, 161, 47-55.

January, 2013
22
Thank you!
Comments…