FOOD POLICY AND APPLIED NUTRITION PROGRAM...Comparing Household Survey-Based Measures of Food...
55
The Gerald J. and Dorothy R. Friedman School of Nutrition Science and Policy FOOD POLICY AND APPLIED NUTRITION PROGRAM DISCUSSION PAPER NO. 7 Comparing Household Survey-Based Measures of Food Insecurity Across Countries: Case Studies in India, Uganda, and Bangladesh Mark Nord (Economic Research Service, United States Department of Agriculture) Anoop Kumar Satpathy and Nikhil Raj (Jawaharlal Nehru University, India) Patrick Webb and Robert Houser (School of Nutrition Science and Policy, Tufts University, United States of America) June 14, 2002 Corresponding Author: Mark Nord Economic Research Service 1800 M St NW, Room 2078 Washington, DC USA Email: [email protected] Telephone: 202-694-5433 FAX: 202-694-5642 Discussion papers provide a means for researchers, students and professionals to share thoughts and findings on a wide range of topics relating to food, hunger, agriculture and nutrition. They contain preliminary material and are circulated prior to a formal peer review in order to stimulate discussion and critical comment. Some working papers will eventually be published and their content may be revised based on feedback received. The views presented in these papers do not represent official views of the School. The discussion paper series is available on line at http://nutrition.tufts.edu/publications/fpan . Please submit drafts for consideration as FPAN Discussion Papers to [email protected] .
Transcript of FOOD POLICY AND APPLIED NUTRITION PROGRAM...Comparing Household Survey-Based Measures of Food...

The Gerald J. and Dorothy R. Friedman School of Nutrition Science and Policy FOOD POLICY AND APPLIED NUTRITION PROGRAM
DISCUSSION PAPER NO. 7
Comparing Household Survey-Based Measures of Food Insecurity Across Countries: Case Studies in India, Uganda, and Bangladesh
Mark Nord (Economic Research Service, United States Department of Agriculture)
Anoop Kumar Satpathy and Nikhil Raj
(Jawaharlal Nehru University, India)
Patrick Webb and Robert Houser (School of Nutrition Science and Policy, Tufts University, United States of America)
June 14, 2002
Corresponding Author: Mark Nord
Economic Research Service 1800 M St NW, Room 2078
Washington, DC USA
Email: [email protected] Telephone: 202-694-5433 FAX: 202-694-5642
Discussion papers provide a means for researchers, students and professionals to share thoughts and findings on a wide range of topics relating to food, hunger, agriculture and nutrition. They contain preliminary material and are circulated prior to a formal peer review in order to stimulate discussion and critical comment. Some working papers will eventually be published and their content may be revised based on feedback received. The views presented in these papers do not represent official views of the School. The discussion paper series is available on line at http://nutrition.tufts.edu/publications/fpan. Please submit drafts for consideration as FPAN Discussion Papers to [email protected].

Abstract Ongoing research is exploring the validity and reliability of household food security assessment through surveys that ask respondents about behaviors and experiences known to characterize households having difficulty meeting their food needs. The Food Security Measurement Project in the United States of America has developed and tested a food security survey module for domestic use. Statistical methods based on the Rasch measurement model (a non-linear factor analytic model) are used to combine responses to questions in the module into a scale that measures the severity of food insecurity. The food security module and scale are in regular use in household surveys in the U.S. both for research and monitoring purposes. The U.S. Food Security Survey Module is also being adapted for use in low-income populations in several other countries. This paper examines data collected in three such adaptations: A study of child labor in Orissa, India; a general household survey in Kampala, Uganda; and a study of participants in an income-generation program in Bangladesh. Rasch-model-based methods are used to assess the suitability of the food security items in each study for scale construction and to assess the internal validity of scales based on the selected items. One of the strengths of the Rasch model is the ability to make scales comparable across surveys based on the presence of several equivalent items in the surveys. The feasibility of making such comparisons between surveys conducted in different countries, cultures, and languages is explored by attempting to adjust each of the three test scales to be comparable to the U.S. scale. The paper demonstrates the methods used to assess items, construct a scale, select appropriate thresholds for categorizing households as to food security status, and adjust the metric of the scale in order to make the scale equivalent in meaning to that in another country. Key Words: Food Security Measurement, Survey Methods, Inter-Country Comparison
Presented at the International Scientific Symposium on Measurement and Assessment of Food Deprivation and Under-Nutrition
Sponsored by the Food and Agriculture Organization, Rome, Italy, 26-28 June 2002
2

Comparing Household Survey-Based Measures of Food Insecurity Across Countries: Case Studies in India, Uganda, and Bangladesh1
Introduction
Food security—access by all people at all times to enough food for an active healthy life—is an important
objective of every nation, formalized most recently in the “Rome Declaration” adopted by 186 countries
at the World Food Summit in 1996. The Declaration begins with this commitment:
We pledge our political will and our common and national commitment to achieving food
security for all and to an ongoing effort to eradicate hunger in all countries, with an
immediate view to reducing the number of undernourished people to half their present level
no later than 2015.
Reliable and adequately detailed information about the food security of a nation’s population is essential
for the development of policies and programs to reduce food insecurity and hunger. One tool that can
provide this information is a household food security survey with a series of questions about behaviors
and experiences that are known to characterize households having difficulty meeting their food needs.
The food security questions are included in a survey of a representative sample of the population of
interest. Appropriate statistical methods are used to combine responses to the selected questions in order
to create a scaled measure of household food security.
During the 1990’s, the Unites States Food Security Measurement Project, with leadership from the U.S.
Government, developed and tested a food security survey module and food security scale for domestic use
(Hamilton et al., 1997a; Hamilton et al., 1997b; Bickel et al., 2000). The module is now in regular use in
household surveys in the U.S. both for research and monitoring purposes. A large, nationally
representative food security survey is fielded annually, and findings are published as a statistical series by
the U.S. Department of Agriculture (Hamilton et al., 1997a; Bickel et al., 1999; Andrews et al., 2000;
Nord et al., 2002). Other national, State, and special purpose surveys in the U.S. also utilize the food
security survey module for monitoring and research.
Methods based on similar approaches have been developed in other countries. In some cases, these have
been adaptations of the U.S. methods based on translation of questions in the U.S. module, while others
have been based on substantial qualitative research work, including focus groups and cognitive testing of
proposed questions and statistical analysis of survey data (Wolfe and Frongillo, 2001; Webb, Coates, and
1
1 The authors thank Jesko Hentschel and Norbert Schady, of the World Bank, for facilitating access to the data from the Kampala, Uganda, Study of Access, Usage, and Satisfaction with Social Services.

Houser 2001a; Maxwell et al., 1999; Chung et al., 1997; Gittleson, Mookherji, and Pelto, 1998). This
paper examines data collected from newly developed food security survey modules in three low-income
populations: a study of child labor in Orissa, India; a general household survey in Kampala, Uganda; and
a study of participants in an income-generation program in Bangladesh. Statistical methods based on the
Rasch measurement model (a non-linear factor analysis based on item response theory) are used to assess
the items and combine them into a food security scale. The analysis is focused on two issues in each
survey:
• Are all of the proposed questions in the survey module suitable as components of a scale to
measure the severity food insecurity of households in this language and culture? If not, what
subset of items should comprise the scale?
• How can the metric of a country-specific or survey-specific food security scale be set
equivalent to that of another country or another survey so that equal scale scores represent
equal levels of food hardship? One of the strengths of the Rasch model is the ability to make
scales comparable across surveys based on the presence of several equivalent items in the
surveys (Nord, 2000). This allows the comparison of prevalence rates of food insecurity at
various specified levels of severity across countries and subpopulations. In this paper,
comparisons are made to the U.S. food security scale for illustrative purposes, because the
U.S. has the most extensively documented measurement methods based on this scaling
methodolgy. These comparisons are presented to demonstrate the feasibility of these methods
for developing inter-country comparability and should not be interpreted as comparisons
between food insecurity rates in the U.S. and the three countries in which these surveys were
conducted. The surveys analyzed here were all either of particularly vulnerable populations or
limited geographical areas within each country and do not represent the entire countries.
The first section of the paper describes the U.S. Food Security Survey Module and Food Security Scale.
Section 2 describes some of the issues that must be addressed to adapt those tools for use in other cultures
and languages, and Section 3 describes the statistical methods used to carry out the scaling analysis
component of that adaptation for each of the three applications under study. Sections 4-6 then apply these
methods to data from each of the three studies and describe findings from each study. A summary section
describes common findings across the three surveys. Appendix A presents a technical overview of the
Rasch measurement model, and Appendices B, C, and D provide translations of the food security sections
of the three survey questionnaires.
These analyses focus solely on scale development and assessment in terms of internal reliability.
Important work remains to be done to validate and assess the reliability of these scales against external
criteria (see Maxwell et al., 1999; Chung et al., 1997; Gittlesohn et al., 1998; Hoddinott 1999).
2

1. The U.S. Household Food Security Survey Module and Food Security Scale
The U.S. Food Security Scale is a “direct” measure of the severity of household food stress or food
deprivation as compared with indirect indicators such as measures of household resources (generally
income) that may be available to procure food, or measures of outcomes of inadequate food access such
as nutritional anthropometry. It is based on self-reported behaviors, experiences, and conditions collected
by interviewing one member of each household using a standardized survey instrument, the U.S. Food
Security Survey Module. The food security status of each household is assessed by their responses to 18
questions about food-related behaviors, experiences, and conditions that are known to characterize U.S.
households having difficulty meeting their food needs. The questions cover a wide range of severity of
food access problems, from worrying about running out of food to children not eating for a whole day.
Each question specifies a lack of money or other resources to obtain food as the reason for the condition
or behavior, so the scale is not affected by hunger due to voluntary dieting or fasting. All questions are
referenced to the previous 12 months.
The food security scale works well as a measure because the experiences and behaviors represented by
the 18 items in the scale correspond closely to the most prevalent experiences and responses of the U.S.
population in coping with inadequate resources for food. This result was achieved by basing the questions
upon a substantial body of research among low-income U.S. families regarding their experiences of food
deprivation and how they described and coped with them. (Wehler et al. 1992; Radimer et al. 1990;
Radimer et al. 1992; Fitchen 1981; Fitchen 1988). The questions reflect familiar conditions, experiences,
and behaviors, and use natural language derived from the qualitative research to describe them.
Responses to the 18 questions are combined into a scale using non-linear statistical methods based on the
Rasch measurement model. The scale provides a continuous, graduated measure of the severity of food
deprivation across the range of severity encountered in U.S. households. Based on their food security
scale scores, households are also classified into three categories for monitoring and statistical analysis of
the food security status of the population. The categories are “food secure,” “food insecure without
hunger,” and “food insecure with hunger.” Based on the most recent food security survey data available,
89.5 percent of U.S. households were food insecure throughout the year ending in September 2000. The
remaining 10.5 percent were food insecure at some time during the year, including 7.4 percent that were
food insecure without hunger and 3.1 percent that were food insecure with hunger (Nord et al., 2002).
3

2. Adapting the U.S. Food Security Measurement Methods for Use in Other Countries
The questions in the U.S. measure were developed through a “grounded research” process and were
assessed and combined into a scale using analytic tools based on the Rasch measurement model. To
achieve optimal results in adapting the measurement method to a setting that is culturally, linguistically,
and economically distinct from the U.S., much of this qualitative research and scale development work
must be replicated in the target population (Wolfe and Frongillo, 2001).
The qualitative research will typically include focus groups, ethnographic methods, and in-depth open-
ended interviews, to explore how adults in low-income households describe their food situations.
Particular attention must be given to observing the language and concepts that are used to describe
conditions, experiences, and behaviors of household members in times of food stress or food deprivation.
The U.S. items, or a subset of them, may be considered candidate items, but will need to be tested. If the
general level of deprivation is more severe, attention should be given to identifying additional questions
in the more severe part of the range. Based on findings from this qualitative research, questions will be
developed to inquire about a selection of those conditions, experiences, and behaviors that typify the
various levels of severity. These questions should then be tested, first in focus groups, then in structured
interviews, and finally in survey field tests.
After the first substantial data collection, the items should be assessed using Rasch model-based statistical
tools to confirm that the items measure a common underlying phenomenon, and do so with appropriate
reliability and sensitivity. This analysis will also establish the relative severity of the items, which is
essential information for combining them into a scale and for specifying appropriate thresholds to define
categories for the purpose of estimating prevalence rates of food insecurity and hunger.
A strength of this measurement method is that scales adapted to two different contexts, with many unique
items, emphasizing different levels of severity, can be brought into a common metric (Nord 2000). To do
so requires that at least three or four items be common to the two surveys and judged to mean the same
thing or to measure equivalent levels of severity. Use of a common metric allows meaningful comparison
of prevalence rates of food insecurity or hunger between countries. To exploit this strength of the
measurement methodology when adapting it to another national context, attention should be given to
including several questions that are as near as possible the same in meaning as those in other surveys to
which comparison is wanted. This is no easy task given the differences in language, culture, and life-
experiences among countries. As a result, the comparability of scales and the prevalence rates based on
them is never perfect, and such comparisons should be considered approximate. Even approximate
comparability may have some value, however.
4

For use in very low-income settings, further attention may need to be given to incorporating the
dimensions of frequency and duration of food deprivation into the measure (Maxwell et al., 1999;
Hoddinott, 1999). In many poorer societies, a majority of the population faces food stress at times. The
most important differences among households may be in how often this occurs and over how much of the
year. Additionally, in countries that face frequent acute shocks (such as periodic severe flooding in
Bangladesh and cyclones and droughts in Orissa) the experience of food insecurity may differ markedly
from countries where such disruptive exogenous shocks are rare.
Of the three studies analyzed in this paper, only the Bangladesh survey module was based on extensive
in-depth qualitative research work and included food security questions additional to those in the U.S.
module (Webb, Coates, and Houser, 2001a; 2002). The Orissa and Kampala survey modules were
developed by simply translating the questions in the U.S. module, or a subset of them, and conducting a
modest amount of cognitive testing to assure that the questions were understandable. The scaling analysis
will show to what extent this simpler and less expensive approach achieved acceptable results.
3. Statistical Methods Used to Analyze Data from the Three Studies
The same set of statistical methods used to develop the U.S. Food Security Scale and to specify the
standard methods for applying it to U.S. survey data were used to assess the data from the households
interviewed in each of the three studies. A basic understanding of the Rasch measurement model and the
meanings of item discrimination, item severity scores, and item-fit statistics based on the model are
essential for interpreting the analyses in the following sections. These basic Rasch-model concepts and
statistics are described in the appendix for readers who are not familiar with them.
The statistical scaling analyses of data from each country study were intended to answer four questions:
1. Which of the candidate items should be included in the food security scale?
2. How should the metric be adjusted so that the scale is equivalent in meaning to the U.S. scale?
(Comparison to the U.S. is examined for illustrative purposes. Comparability to scales from other
countries or to other surveys in the same country could be achieved using the same techniques.)
3. Where should thresholds be set so as to make prevalence rates of food insecurity and hunger
comparable to those based on the U.S. scale? (Again, comparison to the U.S. was for illustrative
purposes.)
4. How reliable is the scale?
The methods used to answer each of these questions are described briefly below.
5

The first two questions were addressed together through an iterative model fitting process. First, all
candidate items were edited to create dichotomous indicator variables. An initial scale was created by
fitting the data to a single-parameter Rasch model using joint maximum likelihood methods implemented
by ERSRasch (SAS-based programs developed by ERS for Rasch analysis of food security data). The
metric of the scale was set equivalent to that of the U.S. scale by constraining the mean and standard
deviation of a subset of items (the metric-adjustment subset) to be equal to the mean and standard
deviation of the equivalent items in the U.S. module (Bickel et al., 2000; Nord, 2000). An item was
included in the metric-adjustment subset if its objective meaning appeared to be the same as an item in the
U.S. module. The model was then revised, if needed, and the data were again fitted to the Rasch model
with the revised specifications. At each iteration, items with poor item-fit statistics were excluded from
the scale and any item whose severity differed excessively from that of its equivalent item in the U.S.
scale was removed from the metric-adjustement subset (but retained in the scale if its item-fit statistics
were acceptable). The process was repeated until all item-fit statistics were acceptable and severities of
items in the metric-adjustment subset were reasonably linear with respect to the corresponding items in
the U.S. scale.
Item-fit statistics, especially infit, were examined to assess whether an item was suitable for inclusion in
the scale. An item’s infit statistic essentially measures the extent to which the item discriminates more or
less sharply than the average item in the module.2 Infit less than 1 indicates that the item discriminates
more sharply than the average. The Rasch model assumes that all items discriminate equally, so infit
values too far above or below 1 raise questions as to the suitability of the item for inclusion in the scale.
In general, infits between 0.8 and 1.2 are considered quite good, and infits between 0.7 to 1.3 may be
acceptable. Item outfit statistics were also examined. This statistic measures the extent of highly
improbable responses. Excessively high outfit indicates a greater than expected frequency of erratic or
highly unusual responses. This may indicate that the item is misunderstood by some subset of the
population, or that it is a behavior with a somewhat erratic relationship to the underlying construct of food
security. The outfit statistic is, however, very sensitive and can be inflated by only one or two highly
unexpected responses in a sample of several hundred. Thus, as long as the infit for the item is reasonable,
6
2 For those familiar with linear factor analysis, it may help to think of infit as being similar to factor loading (or, more precisely, to the factor loading of a variable compared to the average loading of all variables in a scale). The meaning of item discrimination can be visualized by considering how households across a range of severity of food insecurity respond to an item of mid-range severity. The probability that households with low levels of food insecurity will affirm the item is nearly zero. As the severity of food insecurity in households increases and approaches the severity calibration of the item, the probability that they will affirm the item increases. The probability of an affirmative response reaches 0.5 when the severity of food insecurity of the household is equal to the calibration of the item. As the severity of food insecurity of households increases further, the probability of an affirmative response increases, reaching nearly 1.0 at high levels of household food insecurity. For an item with high discrimination, the angle of this probability curve in the region near the severity of the item calibration is steeper.

high outfit is not usually grounds to drop the item. It may suggest the need for cognitive or other
qualitative research, however, to improve the item.
To assess whether the items in the metric-adjustment set are appropriate for equating the metrics of the
test scale and the U.S. scale, the severity of the items in the test scale are plotted against the severities of
the equivalent items in the U.S. scale (as specified in Bickel et al. 2000). Under ideal conditions, the
association between the two sets of item scores is perfectly linear. Identical relative severities of two sets
of items that are supposed to have the same meanings is convincing evidence that the corresponding items
do, in fact, mean the same thing in the two populations. Ideal conditions are seldom encountered,
however, and the process of selecting a metric-adjustment set is somewhat of an art. If a single item
differs substantially in severity between the test data and comparison data, while calibrations of three or
four other items are nearly equal in the two datasets, then the discordant item probably means something
different in the two populations and should be dropped from the adjustment set. It can be retained in the
scale, but it should not be used to adjust the metric. On the other hand, if scores of supposedly equivalent
items are only weakly correlated between the test data and comparison data, it is not possible to equate
the metrics of the two scales with any confidence.
For purposes of monitoring food security and comparing food security across populations or regions or
countries, a categorical measure of food security is often desirable. In the U.S. project, for example,
households are classified as food secure, food insecure without hunger (or with no hunger evident), and
food insecure with hunger (or with hunger evident). The Rasch-based food security scale is a continuous,
graduated measure; the statistical analysis does not provide information as to where thresholds should be
placed to convert the scale to a categorical measure. The Rasch analysis can, however, provide decision-
support information for the threshold setting process. The specific probablistic relationship, inherent in
the Rasch model, between the severity of food insecurity in a household and the household’s response to
each item allows researchers to characterize conditions in a household of any specified scale score. This
information can then be used to identify thresholds that are appropriate for the objectives of the
measurement process in the particular national or program context.
In brief, the process of characterizing conditions in a household at specified scale scores is as follows.
Once a scale has been specified (that is, the items selected and the metric set), scale scores are calculated
for each raw household score (number of affirmative responses, assuming that the household responded to
all items in the scale).3 The mathematical relationship assumed by the Rasch model between the level of
severity of household food insecurity and responses to each item results in a one-to-one mapping of
7
3 Scale scores can be calculated for all households, but the scores for households responding to all items are most useful for specifying thresholds.

household raw score to household scale score. In other words, raw score is an ordinal, but not interval,
measure of severity of food insecurity under Rasch assumptions. For example, all households that affirm
3 items have the same scale score—the same measured level of food insecurity—irrespective of which 3
items are affirmed.4 Given the ordered character of responses to items of varying severity, the
characteristic response pattern of a household affirming n items is to affirm the least severe n items and
deny the remaining items. Thus, conditions in households at each observed level of food insecurity can be
described in terms of the content of the items that the characteristic household with that raw score will
have affirmed. Considering these sets of conditions, thresholds can be specified to identify ranges of
interest for policy or research and appropriate language selected to describe the ranges, drawing on expert
opinion or political or administrative process.
It is worth noting that these characteristics of the Rasch model have great practical value for food security
measurement. They result in a measure that is soundly based in a statistically rigorous measurement
theory, yet easy to implement and to describe to the public once the initial development work on the
measure is completed. Once the scale is specified, field applications are as simple as counting up the
number of affirmative responses by each surveyed household to a standardized set of questions and
reading a table to assign scale scores and food security status categories. No special software or statistical
knowledge is needed by the field practitioner. The classification of households can be readily explained to
the public in terms of raw scores and the characteristics of households with those scores without need to
describe the statistical underpinnings of the scale. For example in the U.S. case, “Households that say yes
to 3 or more of the 18 questions are classified as food insecure. To be classified as food insecure, a
household must report at least the following three conditions, or conditions more severe….” These
explanations are much more accessible to the public than those required to explain scales based on
extracted factors, two-parameter item-response-theory models, or other statistically sound scaling
methods.
It is relatively straightforward to set thresholds for the purposes of comparing the food security of a
population under study to that of another population or nation for which thresholds have already been set.
Provided that the metric of the scale for the population under study has been set equivalent to that of the
comparison population, the scale-score thresholds for the comparison population can be used directly. For
example, the U.S. food insecurity threshold is 3.25, and the hunger threshold is 6.38. Alternatively,
cumulative distributions across the entire measured range of severity of food insecurity can be compared
between the two populations, although we have not illustrated this method in the present paper.
8
4 This may seem counterintuitive, but it reflects the fact that the Rasch model takes into consideration what respondents deny as well as what they affirm.

The reliability of each scale was assessed by examining the average item discrimination and by
comparing the measureable range of the scale to the measurement standard error for household scale
scores. Average item discrimination of each scale was compared to that of the U.S. scale by noting the
size of the discrimination parameter required to equate the metrics of the two scales. Average item
discrimination measures the consistency of the ordering of responses to the items, which indicates:
• The extent to which the behaviors and experiences indicated by the scale questions are
consistently ordered (with respect to overall food stress or food deprivation) across the
population;
• The extent to which respondents understood the items, took them seriously, and provided careful
responses;
• The extent to which interviewers generally asked the questions clearly and recorded responses
correctly.
A scale with higher overall item discrimination measures households’ food security with more precision
and reliability than a scale with lower item discrimination.5 Carelessness in providing or recording
responses reduces the consistency of ordering in the recorded responses and would be seen as lower-than-
expected average discrimination of the items. Since the scale metrics for all test scales were set to that of
the U.S. Food Security Scale, a discrimination parameter of 1 would indicate that the consistency of
ordering of responses to items in the test scale was similar to that in the U.S. survey.
The second method for assessing reliability compared the measureable range of the scale to the
measurement standard error for household scale scores. Because these scales are based on multiple
indicators with (assumed) specified statistical relationships to the underlying phenomenon, it is possible
to estimate the precision with which the severity of food insecurity of each household is measured. This
precision is expressed as a standard error of the estimated scale score for the household. It is a function of
the number of items in the scale and the discrimination of those items. The measurable range of the
scale—the difference between the highest and lowest household score, also depends on the number and
discrimination of the items as well as on their distribution across the severity range. The ratio of the
measurable range to twice the standard measurement error provides an approximation of how many
categories can be meaningfully identified by the scale.6
5 This assumes that the two scales have the same number of items with the same item calibrations.
9
6 This ratio is the number of categories with centers separated by two standard deviations that can be fitted into the measureable range. It is a somewhat impressionistic measure of reliability, but it provides at least an approximate assessment of the precision of the scale that is not dependent on the population distribution, as true measures of reliability are. The standard error of measurement for Rasch-based scales varies across the range, with the smallest errors typically near midrange. We used the mid-range error, which gives a somewhat overly optimistic estimate of average precision.

4. Findings: Orissa, India, Child Labor Study
The Orissa Survey
Ten questions adapted from the U.S. Food Security Survey Module were included in a baseline survey of
282 low-income households in rural Orissa, India. The survey was conducted during the period 2000-
2001 as part a study of child labor in three districts of western Orissa that are particularly vulnerable to
income and employment shocks from natural disasters such as cyclones, floods, and drought. Two
representative villages were selected in each district. From each of the six villages, households to be
interviewed were selected with equal probability from a sample frame of households with high
proportions of household employment in either agriculture or manufacturing. Four research scholars
native to the study areas, along with the Principal Investigators, collected the data.
Findings of the survey along with further details on sampling and interviewing methodology are
discussed in Raj and Satpathy (2002). The food security section of the questionnaire is included as
Appendix B. Nine questions intended to create a food security scale were included along with the food
sufficiency question (#1). The questions were translated into the regional language, Oriya, by one of the
PIs who is a native speaker of the language. A backtranslation of the questionnaire by another native
speaker not familiar with the original English-language module was examined to assure that essential
concepts were retained in the translation. Before finalizing the questionnaire a pilot survey of the
translated version was undertaken in thirty households to test comprehension of the questions and to
assess the effects of several modifications that were made to adapt the U.S. module to local culture and
conditions. Several focus group discussions were also conducted to obtain information at the village level
about seasonal patterns of food consumption and food distress, coping mechanisms, and other food-
related aspects of village life.
At least five of the nine items proposed for an “Orissa Food Security Scale” are essentially equivalent in
meaning to their counterparts in the U.S. module, which should provide sufficient basis for equating the
metric of the two scales. All of the Orissa scale questions were referenced to the previous 30 days rather
than the previous 12 months to improve recall accuracy. Research in the U.S. has confirmed that the scale
is robust to this change in reference period. Questions 2, 3, 4, 5, and 6 may be considered equivalent to
corresponding items in the U.S. module. Question 4a (“How often did this [adult cutting the size of meals
or skipping meals] happen in the last 30 days?”) may be equivalent to its counterpart in the U.S. module
(“How often did this happen in the last 12 months? Almost every month, some months but not every
month, or in only 1 or 2 months?”) The Orissa 30-day adaptation scored responses of 1 to 4 days as
negative and 5 or more as affirmative, in accordance with Hamilton et al. (1997b) and Bickel et al.
(2000). More recent research by ERS, however, suggests that 3 or more days is a more appropriate cut-
10

point if the objective is to replicate the relative severity of frequency follow-up to base item that is
observed in the 12-month version (Nord, forthcoming.)
Questions 7, 8, 8a, and 9 in the Orissa module ask about conditions and experiences of children in the
household, and are specifically referenced to children under 14 years old. The younger age specification
(compared with under 18 in the U.S. module) is appropriate for the legal and social conditions of India,
but it would be expected to increase the severity of these items relative to those of adult-referenced items.
On the other hand, cultural differences may substantially affect the extent to which children share in the
food deprivation of a household. Thus, in the first round of assessing scale equivalence, some of the child-
referenced items were included, but with the awareness of a likely disjuncture between relative severity of
child-referenced and adult-referenced items. Furthermore, items 8 and 8a are not fully equivalent in
meaning to any items in the U.S. scale. Question 8 combines information about children cutting the size
of meals and skipping meals, while the U.S. scale includes separate questions about these two
experiences. The combined question was preferred for the Orissa survey because focus group and
cognitive research indicated that skipping of children’s meals is very rare in even the lowest-income
households. Thus, response to the combined item in the Orissa scale is likely to be determined almost
completely by the behavior of cutting the size of children’s meals. In the analysis described below,
question 8 is compared to the U.S. question about cutting the size of children’s meals while keeping in
mind that the Orissa question is expected to be slightly less severe than it would be if it were exactly
parallel to the U.S. question. There is no item in the U.S. scale corresponding to Orissa item 8a, the
frequency follow-up to cutting the size of children’s meals or children skipping meals.
The Orissa Food Security Scale
Response rates to the food security questions were lower than expected based on U.S. experience.
Although no household refused all questions, 34 percent missed at least one of the nine scale questions,
and 12 percent missed 3 or more items. In large-scale national surveys in the U.S., missing responses are
rare, usually less than 1 percent of households miss any item. In the Orissa survey, missing responses to
the first four questions were rare, less than 1 percent. About 6 percent of households with children refused
the two questions about cutting the size of children’s meals. Between 13 and 20 percent of households
refused each of the remaining questions. These relatively high rates of missing responses may suggest that
the questions are sensitive or annoying in some way or that respondents find it difficult to respond to
them.
The nine items based on the Orissa food security module form a scale with relatively good reliability
based on Rasch-model assumptions. Responses of the 230 households that affirmed at least one item, but
not all items, were fitted to the Rasch model using joint maximum likelihood methods (table 1). (Note
11

that households with valid responses that were excluded from the scaling analysis because they affirmed
no items or affirmed all items were, nevertheless, assigned to appropriate food security categories and
included in the prevalence analysis described later in this section. Those that affirmed no items were
classified as food secure; those that affirmed all items were classified in the most severely food-insecure
category. The food security status of households with these so-called “extreme” response patterns is
unambiguous, but they cannot be included in the Rasch scaling analysis because they provide no
information about the relative severity of the items.) Average item discrimination was nearly double that
of the corresponding items in the U.S. module (2.14 and 1.12, respectively). This indicates that the
conditions, behaviors, and experiences indicated by the Orissa items were consistently ordered across
households, and that the questions were consistently understood by respondents. Operationally it means
that the items are more consistently associated with the underlying phenomenon common to the items
than is true in the U.S. survey. Item infit ranged from 0.75 to 1.11, indicating that the discriminations of
all items were similar enough that a scale based on the single-parameter Rasch model was appropriate.
Outfit statistics were moderately high for several of the items (“couldn’t afford balanced meals,”
“Respondent ate less than should,” “Cut size of child’s meal, or child skipped meal,” and the frequency-
of-occurrence follow-up for this item). This indicates a higher than expected proportion of erratic
responses to these items, and might suggest that additional qualitative research be conducted to assure that
their meanings are clear. Given the low infit statistics for these items and the high overall item
discrimination, however, the outfit statistics do not invalidate the inclusion of the items in the scale.
The severities of the Orissa scale items were plotted against equivalent or nearly equivalent items in the
U.S. scale to assess the feasibility of equating the metrics of the two scales (figure 1.)7 The child-
referenced Orissa items were generally less severe than their U.S. counterparts. The two child-referenced
items with adult-referenced counterparts in the Orissa scale were, however, more severe than the
corresponding adult-referenced items. This indicates that children were protected from food deprivation
to a greater extent than were adults in the same household, although not to as great an extent as in the
U.S.8 The greater severity of child-referenced items is consistent with informal information supplied to
interviewers by several respondents to the effect that first priority in the household is given to ensuring
7 The equivalence of relative severities of items does not mean that similar proportions of respondents affirmed the items in the two countries. It implies, rather, that households at the same level of severity of food insecurity in the two countries are equally likely to affirm items with the same severity scores.
12
8 The extent of the protection of children relative to adults was substantial, especically for cutting the size of meals or skipping meals. The child-referenced item was 3.7 logistic units more severe than the adult-referenced items (calculated as the difference in item calibrations multiplied by the discrimination parameter). This means that in a household with food insecurity just severe enough that adults may or may not cut the size of meals or skip meals, the probabiltiy that children will do so is less than .03. Or conversely, in a household with food insecurity just severe enough that the children are on the borderline of having the size of their meals cut or skipping meals, the probability that adults will do so is greater than .97.

that the children are fed normally, because they cannot bear going without food for long periods. Only
during periods of severe food distress are children’s food intakes reduced.9
The disjuncture between relative severities of adult and child items in the Orissa and U.S. scales makes it
impossible to equate the two scales in terms of both adult and child conditions simultaneously. Given the
larger number of equivalent adult items (five, versus 2 or 3 child items), these were used to equate the
scales for the primary comparison of prevalence rates. Sensitivity of this specification was then tested by
equating metrics based on the 3 nearly equivalent child items and, alternatively, by all equivalent items.
The calibrations of the five adult items are clearly correlated between the two scales, but disparities are
great enough that the equivalence of the metrics as established by these items can only be treated as
approximate.
Household scale scores and food security status for each raw score were calculated for households with
no missing responses (table 2). These are based on the metric adjusted to that of the U.S. scale as
described above. It must be emphasized that the thresholds presented here are for purposes of comparing
prevalence rates to those in the U.S., primarily to illustrate how such inter-country comparisons can be
carried out. Other thresholds and language appropriate for describing demarcated ranges may be more
appropriate for research and policy communication within India. Based on table 2, and imputing all
missing responses as negatives,10 the prevalence rates of food insecurity and hunger were calculated for
the 282 households in the survey. These indicate that the surveyed population was very food insecure; 92
percent of the surveyed households were classified as food insecure including 57 percent classified as
food insecure with hunger. It should be noted that the sample was drawn from a very economically
vulnerable population within Orissa for the purposes of studying child labor; it is not representative of the
population of Orissa as a whole.
To check the sensitivity of the rates of food insecurity and hunger to specification of the metric, two
alternative specifications were tested. With the metric of the Orissa scale adjusted to equate the mean and
standard deviation of all arguably equivalent items to those of the equivalent items in the U.S. scale
(excluding only the two frequency-of-occurrence follow-ups and the item about cutting the size of
9 In this study, food consumption by adults was not differentiated by gender. Future survey module development may include separate questions about women’s food intake. Research supported by the U.K. Department for International Development indicates that women are expected to eat only after everyone else in the household has finished eating, and that during times of shortage, women may be left with almost nothing to eat at all (Praxis, 1998). Cultural norms that limit women’s decision making power and access to resources accentuate this gender bias in food consumption.
13
10 Because of the high rate of item nonresponse, imputation using either Rasch software or the imputation procedures described in Bickel et al. (2000) might be appropriate. Examination of the patterns of missing data suggest, however, that few items would be imputed as affirmatives. Typically one or more of the least severe items were denied prior to refusing succeeding items.

children’s meals or children skipping meals), the proportion food insecure remained at 92 percent, and the
proportion food insecure with hunger increased to 66 percent. Adjusting the metric of the Orissa scale
based only on the three child-referenced items with equivalents or near equivalents in the U.S. scale
resulted in a higher proportion (96 percent) being classified as food insecure and 66 percent classified as
food insecure with hunger.
The measurable range of the Orissa scale was 6.6 units (extending from 2.87 to 9.47), with a standard
measurement error at midrange of 0.56 units. This suggests that 5 to 6 categories of severity (i.e., the ratio
of the measurable range to twice the measurement error) could be meaningfully identified by the scale.
5. Findings: Kampala, Uganda, Access, Usage, and Satisfaction with Social Services Questionnaire
The Kampala Survey
Selected food security questions adapted from the U.S. Food Security Survey Module and from the U.S.
CPS Food Security Supplement were included in a 1999 household survey in Kampala, Uganda. The
survey of 2000 households was part of a study, funded by the World Bank, of access, usage, and
satisfaction with social services in the city. An English translation of the food security section of the
questionnaire is included as Appendix C.11
Six of the questions in the Kampala survey were essentially equivalent to items in the U.S. Food Security
Scale; five of these were included in an exploratory Kampala food security scale (table 3). The Kampala
questionnaire included two additional food security questions that were in the early CPS Food Security
Supplements but are not part of the U.S. scale. H6 (“In the last 12 months … did you or anyone in this
household ever get food or borrow money for food from friends or relatives?”) was not considered a
candidate for the Kampala scale because no resource constraint is specified as a reason for the action. H15
(“In the last 12 months … did you or any of the adults in your household ever send or take your child or
other children in this household to the homes of friends or relatives for a meal because you were running
out of food?”) was considered a candidate scale item, but its infit statistic was too high, indicating that it
was not sufficiently sensitive to include in the scale.12
Considerable attention was given in the Kampala survey to eliciting information on how frequently the
conditions, behaviors, and experiences indicating food insecurity and hunger occurred. Affirmative
11 Information on translation and testing of the food security questions has been requested, but is not yet available.
14
12 The infit was 1.41. An infit of 1.3 is generally considered marginally too high. The item calibration was higher (more severe) than that of any other item, even children not eating for a whole day. Taken together the infit and calibration indicate that this is a rare behavior not strongly correlated with other indicators of food insecurity.

responses to each food security item were followed with the standard frequency-of-occurrence follow-up
used in the U.S. module: “How often did this happen? Almost every month, some months but not every
month, or in only 1 or 2 months.” (This follow-up was used for all items except H10, which is asked with
a response set of “often true/sometimes true/never true”). Frequency-of-occurrence is likely to be an
important dimension of food insecurity in low-income populations, so this additional temporal
information can enrich understanding of food conditions considerably. This information could be
incorporated into the scale directly, either as separate items (similar to the three frequency-of-occurrence
items in the U.S. scale) or by making each of the scale items a “multi-level” item. However, this assumes
that frequency and severity of food insecurity are a single dimension. Rather than assuming
unidimensionality (as in Maxwell et al., 1999), we took an alternative approach in order to explore the
extent to which the two aspects of food insecurity lie on the same dimension. We created three scales,
each comprised of five items.
• For the “ever in the last 12 months” scale, items were scored as affirmative if the respondent
answered “yes” to the base question (e.g., “In the last 12 months … did you or any of the other
adults in your household ever not eat for a whole day because there was not enough money for
food?”)
• For the “recurring” scale, items were scored as affirmative if the respondent answered “yes” to
the base question and reported that this happened “almost every month” or “some months but
not every month.” These items were scored as negative if the respondent reported that it
happened “in only 1 or 2 months” or if they responded “no” to the base question.
• For the “chronic” scale, items were scored as affirmative if the respondent answered “yes” to
the base question and reported that this happened “almost every month.” These items were
scored as negative if the respondent reported that it happened “some months but not every
month” or “in only 1 or 2 months” or if they responded “no” to the base question.13
Cross-tabulating the three scales provides a more complete picture of how food insecurity and hunger are
experienced temporally by households. Because we used this approach, we excluded the frequency-of-
occurrence follow-up to the question about adults not eating for a whole day from the basic (“ever in the
last 12 months”) scale, even though it is an item in the U.S. scale.
The Kampala Food Security Scale
With the exception of one question, there were no missing responses to the food security questions. It is
likely that this resulted from editing and imputation prior to release of the data. The only item with
missing responses in the edited data file was H10, for which 284 cases were missing. This was a child-
15
13 For both the recurring and chronic scales, H10, which had a response set of “often/sometimes/never,” was coded as affirmative only for responses of “often.” Scaling analysis indicated that a response of “often” is roughly equivalent to “almost every month.”

referenced item, and all but 55 of the households for which it was missing were households without
children, as indicated by ages in the household roster. (The other child-referenced items were not missing
for these households, however.) Since there were too few adult-referenced items to produce a useable
scale for households without children, the childless households were excluded from the analysis, leaving a
total of 1,543 households in the analysis file. For scaling purposes, the dichotomous scale item calculated
from H10 was set to missing for the 55 households for which H10 was missing. For purposes of assigning
scale scores, the missing values were imputed as negative for households that affirmed no other item and
imputed as affirmative for households that affirmed any other item.14
The five base items in the Kampala food security module form a scale with relatively good reliability,
considering the small number of items. Responses of the 1,063 households that affirmed at least one item,
but not all items, were fitted to the Rasch model using joint maximum likelihood methods (table 3).
Average item discrimination was somewhat lower than that of the corresponding items in the U.S. module
(1.22 and 1.35, respectively). This indicates that the conditions, behaviors, and experiences indicated by
the Kampala items were slightly less consistently ordered across households than in the U.S. CPS, or that
the questions were not as well understood by respondents. For practical purposes, however, a difference
in discrimination of this proportion (about 10 percent) does not substantially compromise the reliability of
the scale. Item infit ranged from 0.77 to 1.12, indicating that the discriminations of all items were similar
enough that a scale based on the single-parameter Rasch model was appropriate. Outfit statistics were
good for four of the items, but extremely high for H10 (“Relied on a few kinds of low-cost food to feed
children.”) Since this is the least severe item, the high outfit indicates that the item was denied by
households that answered “yes” to several other questions. Analysis of specific response patterns revealed
that the high outfit was almost entirely the result of just two households that denied this item while
affirming all four of the other items. The meaning of the item may have been unclear to some
respondents, but these two erratic responses could also have resulted from inattention, miscoding or
incorrect data entry.
The severities of the Kampala scale items were plotted against equivalent items in the U.S. scale to assess
the feasibility of equating the metrics of the two scales (figure 2.) As in the Orissa scale, the child-
referenced items in the Kampala scale—especially the item about cutting the size of a child’s meal—was
less severe than the U.S. counterparts. The relative severities of items in the two surveys were, however,
near enough the same to provide a reasonably precise matching of the metrics. The precision of the five-
item scale is limited, in any case, and a small difference in the metric will not make any substantive
difference in the comparison of prevalence rates.
16
14 This is consistent with the standard imputation methods described in Bickel et al. (2000), since this was by far the least severe item in the scale.

Household scale scores and food security status for each raw score were calculated for households with
no missing responses (table 4). These are based on the metric adjusted to that of the U.S. scale as
described above. We emphasize again that the thresholds presented here are for purposes of comparing
prevalence rates to those in the U.S. to illustrate how such inter-country comparisons can be carried out.
Other thresholds and language appropriate for describing demarcated ranges may be more appropriate for
research and policy communication within Uganda. The prevalence rates of food insecurity and hunger
were calculated for the 1,548 households in the survey with children present. The scale did not include a
sufficient number of adult-referenced items to classifity households without children with any degree of
precision or confidence. Of the surveyed households, 81 percent were classified as food insecure
including 53 percent classified as food insecure with hunger. For comparison to U.S. statistics, the
prevalence of food insecurity is likely to be understated by the Kampala scale. Because there are few
items in the less severe range, the scale’s precision near the food-insecure threshold is poor and the lowest
measurable level of food insecurity (scale score 5.26) is well above the food insecure threshold. This
paucity of less severe items is not a criticism of the Kampala scale. Given the higher level of food
insecurity and hunger in the surveyed population, policy concern in Uganda may be focused at a more
severe level than in the U.S., where the Kampala scale performs better. However, when comparing
prevalence statistics to those of the U.S., this characteristic of the Kampala scale should be taken into
consideration.
Prevalence rates of “recurring” and “chronic” food insecurity and hunger (table 5) provide additional
perspective on the food security of the surveyed households.15 More than half (53 percent) of surveyed
households with children were food insecure with hunger at some time during the 12 months prior to the
survey. This condition was recurring—occurring in 3 or more months—for 32 percent of households and
chronic—occurring in almost every month—for 14 percent. A large majority, 81 percent, of households
were food insecure at some time during the year. This condition was recurring for 50 percent of
households and chronic for 29 percent.
Cross-tabulation of food security status based on the “ever in the last 12 months” scale and the “chronic in
the last 12 months” scale suggests that frequency and severity of food insecurity, although they are
closely related, do not lie on a single dimension (table 6).16 Of all households that were food insecure with
15 Details of the scaling analyses for these two scales are not shown. Average item discriminations for both scales were around half that of the “ever in the last 12 months” scale. This indicates that measured at higher rates of frequency, these behaviors are less consistently ordered than when measured for whether they ever occurred in the last 12 months. Item fit statistics for the chronic scale were good, and for the recurring scale they were acceptable except for the item about relying on a few kinds of low-cost foods to feed children. This is likely a result of the different response set used for this question.
17
16 Cross-tabulation of the full 5-increment scales demonstrated the bi-dimensionality even more clearly.

hunger at some time during the year, over half (52.2 percent) reported that none of the conditions
indicating food insecurity or hunger occurred chronically throughout the year. Additional analysis at a
more severe level of hunger (not presented in the table) found that more than one in three households that
affirmed 4 or 5 items on that scale (i.e., households in which either adults or children went a whole day
without eating at some time during the year) reported that none of the conditions indicating food
insecurity or hunger occurred chronically throughout the year. Further analysis based on a scale with a
larger number of items may shed further light on the relationship between frequency and severity of food
insecurity. These results suggest that the two dimensions may best be measured separately and the
appropriate measure, or combination of measures, selected for specific policy and research purposes.
The measurable range of the Kampala “ever in the last 12 months” scale was 6.71 units with a
measurement standard error of 1.1 units at midrange. This implies that only about three categories
(calculated as the range divided by twice the measurement error) of severity can be meaningfully
distinguished by the scale. However, the limited range of the scale resulted partly from excluding the
frequency-of-occurrence information and using it to construct a separate scale. Incorporating the
frequency-of-occurrence dimension along with the “maximum severity in the last 12 months” dimension
will extend the effective range of the measure.
6. Findings: Bangladesh Study of Participants in the Income Generation for Vulnerable Group
Development (IGVGD) Program
The Bangladesh Survey
Researchers at the Tufts University, Friedman School of Nutrition Science and Policy, are collaborating
with several research and operational organizations in Bangladesh to develop methods for assessing
household food security in Bangladeshi households. Rather than simply translating questions from the
U.S. module, researchers conducted extensive qualitative research, including ethnographic study and
focus groups, to discover how low-income Bangladeshis describe their food situations. Based on the
findings from the qualitative research they developed potential survey questions and then used cognitive
testing methods to further refine the questions. The qualitative research is described in detail in Webb et
al. (2001a; 2002). The food security questions were then fielded in several surveys of low-income
households. Here we report on development of a food security scale using data from the earliest of these
surveys. It should be noted, however, that the development of the survey module and scales is ongoing.
Analysis of additional data collected in collaboration with World Vision Bangladesh’s Food Security
18

Enhancement Initiative is currently underway. The scale described here is preliminary and will be
modified based on further cognitive and statistical research.17
A prototype food security survey module consisting of 35 questions was included in a 2001 survey of 606
women who participated in the Income Generation for Vulnerable Group Development (IGVGD)
Program operated by the Bangladesh Rural Advancement Committee (BRAC) in collaboration with the
United Nations World Food Programme (Webb et al., 2001b). An English translation of the food security
section of the questionnaire is included as Appendix D. Not all of the questions were intended for use in a
food security scale. Some questions provide additional detail on specific conditions and behaviors. Based
on the content of the questions and theoretical considerations, a preliminary set of 16—relevant for
households both with and without children—were selected for initial scaling analysis.
The Bangladesh Food Security Scale
Of the 606 cases in the sample, 103 (17 percent) had missing responses for one or more of the preliminary
set of scale questions. This is a much higher rate of item non-response than is typical in U.S. surveys, and
further analysis and cognitive research are needed to clarify which items were missed and why. The initial
scaling analysis was conducted using a subsample consisting of the 503 cases with no missing data for the
preliminary set of items.
In order to provide data on the frequency of food insecurity and hunger, five response categories to the
food security questions were listed:
• Never
• Rarely
• Sometimes
• Often
• Mostly.18
This response set provides the basis for at least two food security scales, a basic scale that is sensitive to
the highest level of food insecurity during the previous year, and a “chronic” scale that is sensitive to food
insecurity and hunger only if they were frequent or chronic during the year. We present a detailed analysis
of the first of these and then summarize findings regarding the chronic scale. For the basic scale,
responses were dichotomized as “never” or “rarely” versus “sometimes,” “often,” or “mostly.” For
17 In particular, further cognitive testing of the survey module with minority populations is needed. Some of the questions are only relevant for the majority muslim population and may not be appropriate, or responses may be misleading, for Hindus and Buddhists.
19
18 Parenthetical statements to clarify the meaning of the response categories are indicated in the questionnaire (see Appendix D), and they vary from question to question. It is not clear whether the parentheticals were read to the respondents or provided only if respondents asked for clarification.

questions asking about desirable conditions or behaviors (such as eating meat), responses of “never” or
“rarely” were coded as affirmative of a food access problem.19 For questions asking about undesirable
conditions or behaviors (such as not eating for a whole day), the opposite coding was used.
Based on this coding, seven households indicated no food access problem on any of the 16 items. These
households were excluded from the scaling analysis since such households’ responses provide no
information about the relative severities of the items. For purposes of prevalence estimation, however,
these households were retained in the sample and classified as food secure. This left 496 households for
the scaling analysis. Two of the questions in the preliminary scale, A3 and B7, were dropped after initial
analysis indicated that they were less sensitive, or more erratic, indicators of food insecurity than the other
items. The remaining 14 items form a scale with relatively good reliability based on Rasch-model
assumptions (table 7). Average item discrimination was 16 percent lower than that of the U.S. scale. This
may indicate somewhat less consistency of ordering of the conditions and behaviors represented by the
questions across the population. A difference of this magnitude is not very serious; it would reduce the
reliability of the scale only slightly. Furthermore, there is some uncertainty about the equivalence of the
metrics (discussed below), which could account for most or all of the difference in the discrimination
parameters.
Item infit statistics were excellent, ranging from 0.83 to 1.16. This indicates nearly equal sensitivity of all
14 indicator variables in the scale. Item outfit statistics were also fairly consistent, indicating few erratic
responses. The items are concentrated in the less severe range of the food insecurity continuum, however,
with relatively sparse coverage of the more severe (i.e., hunger) range. Half of the items are less severe
than the U.S. food insecurity threshold and only three items exceed the severity level of the U.S. hunger
threshold (assuming that the metrics have been equated correctly in table 7). This is not optimal
distribution for measuring food security in a population as economically vulnerable as that of Bangladesh.
Development of additional indicators in the more severe range (calibrations in the range of 5 to 10) is
underway to provide more precise measurement of household food insecurity in the hunger range.
The metric of the Bangladesh food security scale cannot be equated to that of the U.S. scale with great
precision or confidence. Based on their content, four items have approximately equivalent meanings in
the two surveys, but only two of the items (A13, respondent did not eat for a whole day; and A11,
respondent skipped entire meals) appear to have almost precisely equivalent meanings in the two surveys.
The latter item is not part of the U.S. scale as a separate item. The U.S. module asks about the behavior of
20
19 We are considering using a slightly different coding for A2, regarding eating 3 “square meals” daily. The “Sometimes” response is interpreted to mean “3 meals only a few times in the month,” and should probably be coded as indicating a food access problem. We are waiting for clarification about translation of the question before finalizing this detail.

adults skipping meals only in the combination question, “… did you or other adults in your household
ever cut the size of your meals or skip meals because there wasn’t enough money for food?” However, in
the April 1997 CPS, a test was conducted in which questions about the two behaviors, cutting the size of
meals and skipping meals, were asked separately, rather than as a combined question, to a subsample of
households. The calibration of this test item is presented in table 7 and figure 3 and used to adjust the
metric of the Bangladesh scale. Given the great differences between Bangladesh and the United States in
language, household food management processes, and economic conditions, it is not surprising that food
security conditions cannot be compared with precision. And, indeed, there is no need to do so. Even an
approximate equivalence helps analysts and readers in one country to more meaningfully interpret food
security statistics for another country (or for subpopultions in another country).
Household scale scores and food security status for each raw score were calculated for households with
no missing responses (table 8). These are based on the metric adjusted to that of the U.S. scale as
described above. The thresholds presented here are for purposes of comparing prevalence rates to those in
the U.S. to illustrate how such inter-country comparisons can be carried out. Other thresholds and
language appropriate for describing demarcated ranges may be more appropriate for research and policy
communication within Bangladesh. Among this subsample with no missing responses, 32 percent were
food secure, 58 percent were food insecure without hunger, and 10 percent were food insecure with
hunger.20 If, as we suspect, items B2 and B1 in the Bangladesh scale are more severe than their U.S.
counterparts, then the above statistics understate somewhat the extent of food insecurity and hunger in
this sample. The sampled population was not, of course, nationally representative of Bangladesh, but
represented only families participating in a particular set of income generating projects.
A preliminary scale measuring chronic food insecurity and hunger was also assessed. For this scale,
questions asking about desirable conditions or behaviors were coded as indicating a food access problem
only for responses “never.” Questions asking about undesirable conditions or behaviors were coded as
indicating a food access problem for responses of “often” and “mostly.” Statistics for this scale are not
presented, but the items coded to indicate chronic food insecurity and hunger fit the Rasch model at least
as well as those coded for the basic scale described above. Based on the same thresholds described above,
about 29 percent of households in the sample were chronically food insecure, including 2 percent that
were food insecure with chronic hunger. Although the two scales measure primarily a single dimension,
there is sufficient variation that the chronic scale adds substantial information value. For example, among
the 53 households with hunger at some time during the year, 8 had chronic hunger, 42 were chronically
21
20 These statistics are based on unweighted cases. The sample in this survey was stratified both regionally and by extent of participation in the economic assistance program, so weighted prevalence rates could differ substantially from those presented here.

food insecure, but without chronic hunger, and 3 (about 6 percent of the households with hunger at some
time during the year) were not chronically food insecure.
The measurable range of the base (ever in the last 12 months) Bangladesh scale was 12.18 units
(extending from –0.34 to 11.84) with a measurement standard error of 0.8 units at midrange. This implies
that about 7 categories (calculated as the range divided by twice the measurement error) of severity can be
meaningfully distinguished by the scale. Adding the information provided by the chronic scale extends
the effective range of the scale even further.
7. Summary and Conclusions
Results of these three exploratory adaptations of U.S. food security measurement methods are
encouraging. In all three cases, reasonably reliable scales were constructed from the food security items in
the survey modules. This was true even for the two surveys that essentially just translated questions from
the U.S. module and conducted modest amounts of cognitive testing prior to fielding the surveys. The
item-fit, model-fit, and measurement error statistics from Rasch-model based statistical assessments
indicate that, within each study, the items in the final scale measure a common underlying phenomenon
and do so with sufficient sensitivity to provide useable measures of household food security. It should be
emphasized, however, that these analyses assessed only the internal characteristics of the scales—based
on the interrelationships among the multiple items in each scale. External validation both to alternative
measures of food insecurity and to expected outcomes of food insecurity are still needed before
widespread use of these scales can be recommended with confidence (Maxwell et al., 1999; Chung et al.,
1997; Gittlesohn et al., 1998; Hoddinott, 1999; Hamilton et al., 1997b).
Two of the scales can be benchmarked with some confidence to the U.S. scale based on sets of equivalent
items so that prevalence rates measured in the various surveys can be meaningfully compared. The
Bangladesh scale can also be set approximately equivalent to the U.S. scale, although with somewhat less
precision and confidence. Although all such comparisons across significant cultural, linguistic, and
economic gaps must be treated as approximate at best, these results demonstrate the methods and
feasibility of achieving at least some degree of comparability.
To develop a scale for widespread or multiple uses in a country or unique population, it is worthwhile to
begin with extensive qualitative work to develop a survey module that is thoroughly grounded in the
food-related experiences of the culture and the natural language used in that culture to discuss food
conditions. The excellent fit statistics of the Bangladesh scale are evidence of the efficacy of this
22

approach. However, findings from the other two surveys suggest that for single-use surveys or limited
applications, careful translation of U.S. module questions with a modest amount of cognitive testing may
provide acceptable results.
Some lessons can be learned from these studies.
• Questions should be distributed across the entire range of severity that is of interest for the purposes
of the study. A Rasch-based scale is most precise in a range that is densely covered with items.
• Unless all households in the survey have children, it is essential to include enough non-child
referenced items to provide a useable measure for households without children.
• In most cases, it will be worthwhile to capture frequency-of-occurrence information for every
question in the scale. This can be accomplished either by provided an array of response categories
that register frequency of occurrence or by separate follow-up questions that ask about frequency of
occurrence if the respondent reports that the behavior or condition occurred at any time during the
reference period. Further work is needed to develop ways to present information on frequency of
occurrence in meaningful ways.
• If the survey module is to be used for multipurpose surveys in the country, unique characteristics of
all substantial minority populations should be considered in developing the questions, and included in
cognitive tests of the questions.
• If cross-national comparability is important, it is essential to include three or four items that are, as
nearly as possible, equivalent to items in the U.S. scale or in a scale of the nation to which
comparison is intended. These equivalent items, which are used to equate the metrics of the two
scales, should be well distributed across the severity range.
• If food security research results are to be reported to the public or to policy makers, expert attention
should be given to identifying thresholds to demarcate ranges of severity that are meaningful in the
local context and to choosing language to name and describe the ranges so that prevalence statistics
can be understood and interpreted correctly. As these measures become more reliable and accepted
they are likely to be used increasingly for resource prioritization (targeting) with potentially serious
consequences to human welfare if their meanings are not clearly understood.
23
The findings from these three studies suggest that the general approach to measuring food insecurity and
hunger by direct questions about food-related conditions and behaviors is not unduly biased by social
expectations related to the extent of food insecurity and hunger in the population. There has been concern
that this method might primarily register food conditions relative to surrounding social norms, and would,
therefore, seriously understate food insecurity in societies with very high rates of actual food insecurity.
However, these studies registered rates of food insecurity as high as 90 percent and rates of hunger as
high as 50 percent. In spite of these high rates, the scales were generally consistent with the U.S. scale in

regard to internal statistical characteristics. It appears that the concrete, specific nature of the questions
makes them quite robust to differing social expectations.
24

Appendix A
The Rasch Model in Food Security Measurement:
Basic Concepts, Parameters, and Statisitcs
The Rasch measurement model provides a powerful set of analytic tools to assess the suitability of a set of
survey items for scale construction, to create a scale from the items, and to compare performance of the
set of items in various populations and survey contexts. This appendix presents basic concepts and
mathematics underlying the Rasch model and describes the model parameters and item-fit statistics
commonly used to assess food security survey data. More detailed information on the Rasch model is
available in Wright (1977; 1983), Baker (1992) and Hambleton et al. (1991), and from the website of the
MESA psychometric laboratory at the University of Chicago at www.rasch.org. Information about
applications of Rasch methods to the development and assessment of food security scales is available in
Hamilton et al. (1997a; 1997b), Ohls et al. (2001), Bickel et al. (2000), and Nord (2000).
Basic Concepts: Item Severity and Household Severity
An essential characteristic of the food security scale is that the items comprising it vary across a wide
range of severity of food insecurity. The precise severity level of each item (the “item calibration,” or
“item score” discussed below) is estimated empirically from the overall pattern of response to the scale
items by the interviewed households. However, the range of severity of the conditions identified by the
items is also intuitively evident from inspection of the items. For example, the item, children did not eat
for a whole day, is a more severe manifestation of food insecurity than is the item, adults cut the size of
meals or skipped meals, and the latter indicates a more severe level of food insecurity than does the item,
worried whether food would run out before we got money to buy more. These differences in severity are
observed in the response patterns of surveyed households. The more severe items are less frequently
affirmed than less severe items. Moreover, a household that affirms an item of mid-range severity is likely
to have also affirmed all items that are less severe. Similarly, a household that denies an item at mid-range
is likely to deny all items that are more severe. These typical response patterns are not universal, but they
are predominant, and among households that do deviate from the typical patterns, the extent of deviation
tends to be slight.
In essence, the Rasch model (named for the Danish Mathematician, Georg Rasch) formalizes this concept
of the severity-ordering of items and provides standard statistical methods to estimate the relative severity
of each item and to assess the extent to which the response patterns observed in a data set are consistent
with the severity-order concept. The Rasch model was developed primarily in the educational testing
25

field, where multiple correct/incorrect items, varying in difficulty, are used to measure an individual’s
level of knowledge or skill. More generally, the model can be used to assess the location of an individual
or household along a continuum—in the present case, a continuum of the severity of deprivation in the
basic need for food—by combining information from multiple dichotomous (yes/no) items that vary as to
the point on the continuum that each one uniquely reflects. This corresponds exactly to the character of
the food insecurity/hunger measurement construct. There is no commonly used language that describes
the entire continuum of food insecurity and hunger. People do not ask, “On a scale of 1 to 10, how food
insecure is your household?” But people do speak readily about specific experiences, such as running out
of money for food, and the specific behaviors and conditions that result, such as being forced to cut back
on quality or quantity of food. Information about these experiences, behaviors, and conditions then, can
be elicited by well designed survey questions.
Mathematics of the Rasch Model
Using the Rasch model to create a measure of food insecurity and hunger assumes that both the indicator
items making up the scale and the households responding to the items can be located on the same
underlying continuum of severity of food insecurity. It further assumes that the probability of a specific
household affirming a specific item depends on the difference between the severity-level of that
household and the severity of that item. The single-parameter Rasch model, which is used to create the
food security scale, assumes specifically that the log of the odds of a household affirming an item is
proportional to the difference between the “true” severity level of the household and the “true” severity
level of the item. Thus, the odds that a household at severity-level h will affirm an item at severity-level i
is:
(1) Ph,i/Qh,i=e(h-i)
where P is the probability of affirming the item, Q is 1-P, that is, the probability the household will deny
the item, and e is the base of the natural logarithms. Rewriting equation 1 in terms of the probability that
the household will affirm the item gives:
(2) Ph,i =e(h-i)/(1+e(h-i))
26
The severity of an item, then, can be thought of as the severity-level of households that are just at the
threshold of affirming or denying that item. The odds that a household will affirm an item right at the
severity level of the household is 1, corresponding to a probability of 0.5. The odds that a household will

affirm an item with a severity score one unit lower than that of the household is e1, or about 2.7,
corresponding to a probability of 0.73 [i.e., 2.7/(1+2.7)]. The probability that the household will affirm an
item two units lower than its own severity measure is 0.88, and for an item three units lower, it is 0.95.
Scale Metrics and Average Item Discrimination
Since it is the difference between the household and item score that determines the probability of
affirmation, it is clear that the metric can be transformed by adding a constant to both household and item
scores without changing the character of the scale. That is, the size of the intervals on the scale conveys
meaningful information, but the zero point is arbitrary. The Federal interagency food security
measurement project has adopted a standard computational metric for the 18-item scale based on a mean
item score of 7 for the 18 items in order to keep all item and household scores positive (Bickel et al.
2000). This results in household scores that range from about 1.5 to 13.
Although the size of the interval on the Rasch scale is inherently meaningful, it can be affected by factors
(such as statistical “noise”) that are not fundamental to the measurement construct. To meaningfully
compare item severities between two surveys, it is, therefore, often convenient to multiply the item scores
of one of the scales by a constant so as to equate the dispersion of item scores in the two scales.
(Dispersion is commonly measured by the standard deviation or mean absolute deviation of the item
scores.) In this case the comparison is referred to as a comparison of relative item severities.
Mathematically, this scale adjustment is equivalent to fitting the Rasch model as in (1) above, with the
addition of a discrimination parameter, k,as follows:21
(3) Ph,i/Qh,i=e(k(h-i))
For a scale based on a given set of data, the discrimination parameter is inversely proportional to the
standard deviation (or any other linear measure of dispersion such as mean absolute deviation) of the
scores of the items in the scale. This relationship is used to assess how well the items in a survey
discriminate, compared to a standard. If test data are fitted to the Rasch model with the discrimination
parameter constrained to 1, then the ratio of the standard deviation of the items in the test data to the
standard deviation of the same items in a standard scale (such as that based on the 1998 CPS) compares
the average discrimination of the items in the test data to their average discrimination in the standard.
Alternatively, if the data are fit to the Rasch model with the standard deviation of the item scores
27
21 The discrimination parameter is also referred to as a “slope” parameter, since, it represents the slope of the line plotting the log-odds of affirming the item against (h-i).

constrained to that of the standard and the discrimination parameter estimated freely, then the size of the
estimated discrimination parameter is a measure of the average discrimination of the items in the test data
compared to their average discrimination in the standard (since the latter is 1).
Rasch Model Estimation and Household Severity Scores
Software that implements the Rasch model begins with the household-by-item matrix of responses.
Maximum-likelihood methods are then used to estimate simultaneously the household and item severity
scores most consistent with the observed responses under the Rasch assumptions. The resulting household
scores are a continuous interval-level measure of the extent of food insecurity or hunger in the household.
These scores are appropriate for linear models such as correlation and regression analysis, with the caveat
that the score for households that denied all items or were screened out cannot be estimated by the Rasch
model. The score of zero assigned to such households in some data sets is purely nominal. While Rasch
modelling produces an interval scale, the size of the interval between households that denied all items and
those that affirmed one item cannot be determined statistically.
Assessing Individual Items: Item-Fit Statistics
The Rasch model also provides the basis for “fit” statistics that assess how well each item, each
household, and the overall data conform to the assumptions of the measurement model. Two statistics
commonly used to assess how well responses to items correspond to the Rasch-model assumptions (or
“fit” the model) are “infit” and “outfit.” After item calibrations and household scores have been
estimated, the probability of an affirmative response in each cell of the household-by-item matrix is
calculated. The infit and outfit statistics are then calculated by comparing the actual responses to the
probablistically expected responses in each cell of the matrix. Infit is an “information-weighted” fit
statistic for each item that is sensitive to responses by households with severity scores in the range near
the severity level of the particular item. Outfit is sensitive to unexpected responses from households with
severities much higher or lower than that of the item—that is, to highly improbable responses (outliers).
Both statistics compare observed deviations of responses from those expected under Rasch assumptions,
so the expected value of the statistics is 1. Deviations above 1.0 indicate a disproportionate share of “out-
of-order” responses (i.e., affirmative responses by households with severity scores below that of the item
or denials by households with severity scores above that of the item), while deviations below 1.0 indicate
a smaller proportion of such responses than would be expected. The single-parameter Rasch model, which
is used in creating the food security scales, assumes that all items discriminate equally sharply, so fit-
28

statistic values (especially infit) that are far from unity call into question the suitability of the item for use
in the scale. As a general rule, infits in the range of 0.8 to 1.2 are considered to be good, and 0.7 to 1.3 are
acceptable. Similar standards may be applied to outfit statistics, but, in practice, outfits are very sensitive
to a few highly unexpected observations. As few as two or three highly unexpected responses (i.e., denials
of the least severe item by households that affirm most other items) among several thousand households
can elevate the outfit for that item to 10 or 20.
Food Security Scale: Applications and Standards
In the United States, food security data have been collected annually since 1995 through nationally
representative household surveys. A module of qestions about food access, sponsored by USDA, is
administered by the U.S. Census Bureau as a supplement to the Current Population Survey (Hamilton et
al. 1997a; Bickel et al. 1999; Andrews et al. 2000). The food security scale was initially developed and
tested using data from the April 1995 CPS Food Security Supplement (Hamilton et al. 1997b). The food
security scale has been reassessed in the succeeding years and found to be essentially stable (Ohls et al.
2001). Item scores based on the August 1998 food security survey are presented in Guide to Measuring
Household Food Security, Revised 2000 (Bickel et al. 2000) and are the basis of the standard method
described in the Guide for assigning household scores, a method that does not require Rasch software.
The standard scores in the Guide are also the basis for household scores in the public-use data files of the
CPS food security surveys beginning in 1998. These item scores are used as a standard of comparison in
the present study.
29

Appendix B
Food Security Section of Orissa Child Labor Study Questionnaire 1. Which of these statements best describes the food eaten in your household in the last 30 days? [1] Enough of the kinds of food we want to eat [2] Enough but not always the kinds of food we want [3] Sometimes not enough to eat [4] Often not enough [5 ] DK or Refused 2. “The food that we bought just didn’t last, and we didn’t have money to get more.” Was that often,
sometimes, or never true for your household in the last 30 days? [1] Often true [2] Sometimes true [3] Never true [4] DK or Refused
3. “We couldn’t afford to eat balanced meals.” Was that often, sometimes, or never true for your
household in the last 30 days? [1] Often true [2] Sometimes true [3] Never true [4] DK or Refused
4. In the last 30 days, did you or other adults in your household ever cut the size of your meals or skip
meals because there wasn't enough money for food? [1] Yes [2] No (Skip 4a) [3] DK or Refused (Skip 4a)
4a. [IF Q4. is answered YES then, ASK] How often did this happen in last 30 days? _________ days. 5. In the last 30 days, did you ever eat less than you felt you should because there wasn't enough money
to buy food? [1] Yes [2] No [3] DK or Refused 6. In the last 30 days, were you every hungry but didn't eat because you couldn't afford enough food?
[1] Yes [2] No [3] DK or Refused 7. “We couldn’t feed our child (who are under 14 years) a balanced meal, because we couldn’t afford
that.” Was that often, sometimes, or never true for your household in the last 30 days? [1] Often true [2] Sometimes true [3] Never true [4] DK or Refused
8. The next questions are about children living in the household who are under 14 years old. In the last
30 days, did you ever cut the size of any of the children's meals /or ever skipped meals of children because there wasn't enough money for food?
[1] Yes [2] No (Skip 8a) [3] DK or Refused (Skip 4a)
8a. [IF Q8. is answered YES then, ASK] How often did this happen in last 30 days? _________ days. 9. In the last 30 days, did any of the children ever not eat for a whole day because there wasn't enough
money for food? [1] Yes [2] No [3] DK or Refused
30

Appendix C
Food Security Section of Kampala Access, Usage, and Satisfaction with Social Services Questionnaire
Lead: We are now going to ask you some questions about food used in your household, and the ways in which you are managing your food need. H-1: People do different things when they are running out of money for food in order to make their food or their food money go further. In the last 12 months, since September of last year, did you ever run short of money and try to make your food or your food money go further?
Yes No Lead: The next questions are about the food eaten in your household, and whether you were able to afford the food you need. H-2: Which of these statements best describes the food eaten in your household in the last 12 months—(i) enough of the kinds of food we want to eat, (ii) enough, but not always the KINDS of food we want to eat, (iii) sometimes not enough to eat, (iv) often not enough to eat? [if answer is (i), go to H-4] Enough of the kinds of food we want to eat Enough but not always the kinds we want Sometimes not enough to eat Often not enough to eat H-3: Here are some reasons why people do not always have the quality or variety of food they want. For each one, please tell me if that is a reason why YOU don’t always have the kinds of food you want to eat. [Read out all alternatives; mark every row] Yes No Not enough money for food Too hard to get to the market or store Kind of food we want not available Good quality food not available H-4: In the last 12 months, since September of last year, were you or anyone in your household ever hungry but did not eat because you could not afford enough food? [if no, go to H-6]
Yes No H-5: How often did this happen? Almost every month Some months but not every month Only 1 or 2 months H-6: In the last 12 months, since September of last year, did you or anyone in this household ever get food or borrow money for food from friends or relatives? [if no, go to H-8]
Yes No H-7: How often did this happen? Almost every month Some months but not every month
31

Only 1 or 2 months H-8: In the last 12 months, since September of last year, did you, or any of the other adults (aged 16 or older) in your household ever not eat for a whole day because there was not enough money for food? [if no, go to H-10]
Yes No H-9: How often did this happen? Almost every month Some months but not every month Only 1 or 2 months Lead: The next questions concern children 16 or younger [if household has no children aged 16 or younger, go to H-17]. Now I am going to read to you several statements that people have made about their food situation. For these statements, please tell me whether the statement was OFTEN true, SOMETIMES true, or NEVER true for you or your household in the last 12 months. H-10: The next statement is “I (we) relied on only a few kinds of low-cost food to feed the children in this household because I was (we were) running out of money to buy food” Was that OFTEN true, SOMETIMES true, or NEVER true for you (or your household) in the last 12 months? OFTEN true SOMETIMES true NEVER true H-11: In the last 12 months, since September of last year, did you ever cut the size of the meals given to any of the children (under 16 years of age) in this household because there was not enough money to buy food? [if no, go to H-13]
Yes No H-12: How often did this happen? Almost every month Some months but not every month Only 1 or 2 months H-13: In the last 12 months, since September of last year, did any of the children in this household (under 16 years of age) ever not eat for a whole day because there was not enough money for food? [if no, go to H-15]
Yes No
32

H-14: How often did this happen? Almost every month Some months but not every month Only 1 or 2 months H-15 In the last 12 months, since September of last year, did you or any of the adults in your household ever send or take your child or other children in this household to the homes of friends or relatives for a meal because you were running out of food? [if no, go to H-17]
Yes No H-16: How often did this happen? Almost every month Some months but not every month Only 1 or 2 months
33

Appendix D
Food Security Section of Bangladesh “Income Generation for Vulnerable Group Development” Study Questionnaire, 2001
Section ‘A’: On Quantity and Quality Issues
A1. How often in the past 12 months did your family eat meat as part of an ordinary meal (not a
festival day)? [Quality] Interviewer: circle the letter giving the closest answer:
1. Mostly (most days/weeks) 2. Often (a few times each month) 3. Sometimes (only a few times in the year – 7 to 12 times) 4. Rarely (only 1 to 6 times in a year) 5. Never
A2. How many ‘square meals’ (full stomach meals) did your family eat each day in the past 12
months (not a festival day)? [Quantity] Interviewer: circle the letter giving the closest answer:
1. Always (3 meals every day) 2. Often (3 at least a few times each week) 3. Sometimes (3 meals only a few times in the month) 4. Rarely (3 meals per day only a few times each year) 5. Never (we never ate 3 meals per day)
A3. In the past 12 months how often could you give your children money for shadaipati (not
including festival days)? (snacks purchased outside of the home) [Quality] Interviewer: circle the letter giving the closest answer:
1. Mostly (most days/weeks) 2. Often (a few times each month) 3. Sometimes (only a few times in the year – 7 to 12 times) 4. Rarely (only 1 to 6 times in a year) 5. Never
A4. In the past 12 months how often did you purchase chanachur and/or other snacks (purchased from shops) for the family (not including festival days)? [Quality]
Interviewer: circle the letter giving the closest answer: 1. Mostly (most days/weeks) 2. Often (a few times each month) 3. Sometimes (only a few times in the year – 7 to 12 times) 4. Rarely (only 1 to 6 times in a year) 5. Never
A5. In the past 12 months how often did your family eat big fish (for example, carp, hilsha etc.)?
(not including festival days) [Quantity] Interviewer: circle the letter giving the closest answer:
1. Mostly (most days/weeks) 2. Often (a few times most months) 3. Sometimes (only a few times in the year – 7 to 12 times) 4. Rarely (only 1 to 6 times in a year) 5. Never
34
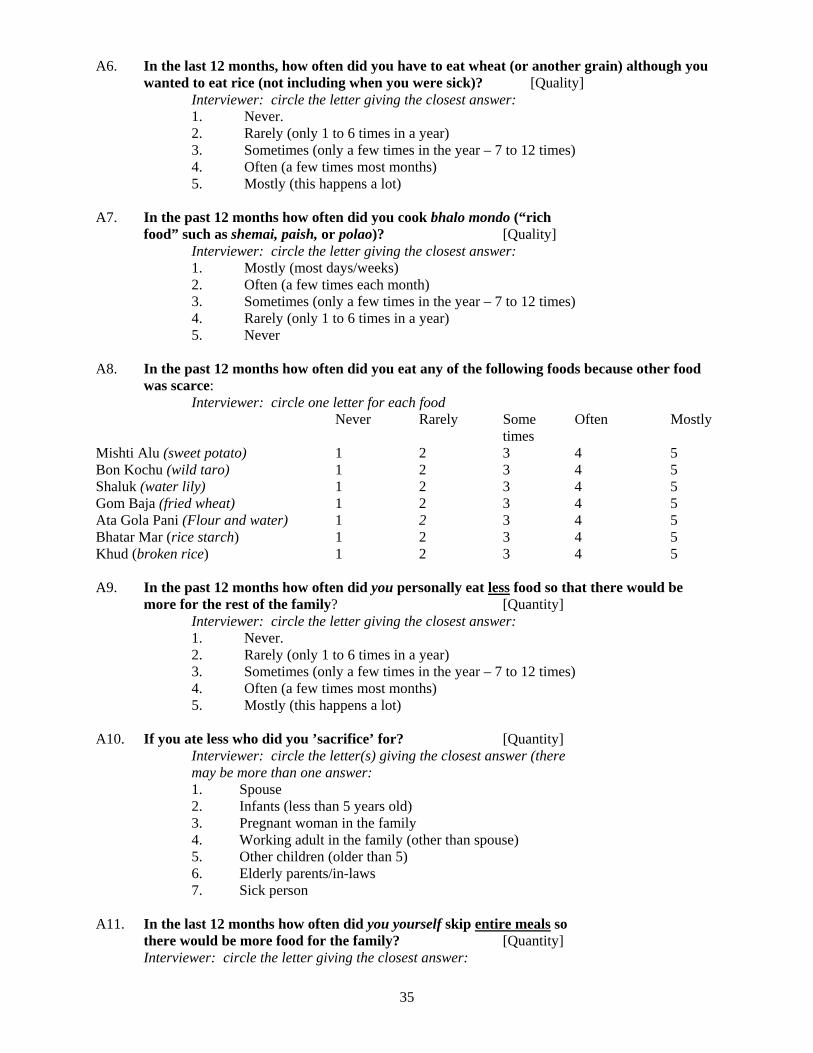
A6. In the last 12 months, how often did you have to eat wheat (or another grain) although you wanted to eat rice (not including when you were sick)? [Quality]
Interviewer: circle the letter giving the closest answer: 1. Never. 2. Rarely (only 1 to 6 times in a year) 3. Sometimes (only a few times in the year – 7 to 12 times) 4. Often (a few times most months) 5. Mostly (this happens a lot)
A7. In the past 12 months how often did you cook bhalo mondo (“rich food” such as shemai, paish, or polao)? [Quality] Interviewer: circle the letter giving the closest answer:
1. Mostly (most days/weeks) 2. Often (a few times each month) 3. Sometimes (only a few times in the year – 7 to 12 times) 4. Rarely (only 1 to 6 times in a year) 5. Never
A8. In the past 12 months how often did you eat any of the following foods because other food
was scarce: Interviewer: circle one letter for each food Never Rarely Some Often Mostly times Mishti Alu (sweet potato) 1 2 3 4 5 Bon Kochu (wild taro) 1 2 3 4 5 Shaluk (water lily) 1 2 3 4 5 Gom Baja (fried wheat) 1 2 3 4 5 Ata Gola Pani (Flour and water) 1 2 3 4 5 Bhatar Mar (rice starch) 1 2 3 4 5 Khud (broken rice) 1 2 3 4 5 A9. In the past 12 months how often did you personally eat less food so that there would be
more for the rest of the family? [Quantity] Interviewer: circle the letter giving the closest answer:
1. Never. 2. Rarely (only 1 to 6 times in a year) 3. Sometimes (only a few times in the year – 7 to 12 times) 4. Often (a few times most months) 5. Mostly (this happens a lot)
A10. If you ate less who did you ’sacrifice’ for? [Quantity] Interviewer: circle the letter(s) giving the closest answer (there may be more than one answer:
1. Spouse 2. Infants (less than 5 years old) 3. Pregnant woman in the family 4. Working adult in the family (other than spouse) 5. Other children (older than 5) 6. Elderly parents/in-laws 7. Sick person
A11. In the last 12 months how often did you yourself skip entire meals so there would be more food for the family? [Quantity] Interviewer: circle the letter giving the closest answer:
35

1. Never 2. Rarely (only 1 to 6 times in a year) 3. Sometimes (only a few times in the year – 7 to 12 times) 4. Often (a few times each month) 5. Mostly (this happens a lot)
A12. If you skipped entire meals for whom did you ‘sacrifice’?
Interviewer: circle the letter(s) giving the closest answer (there may be more than one answer: 1. Spouse 2. Infants (less than 5 years old) 3. Pregnant woman in the family 4. Working adult in the family (other than spouse) 5. Other children (older than 5) 6. Elderly parents/in-laws 7. Sick person
A13. In the last 12 months how often did you yourself not eat for an entire day? (Not counting Ramadan, upobas and sickness) [Quantity]
Interviewer: circle the letter giving the closest answer: 1. Never 2. Rarely (only 1 to 6 times in a year) 3. Sometimes (only a few times in the year – 6 to 12 times) 4. Often (a few times most months) 5. Mostly (this happens a lot)
Interviewer: if answer is 2-5, skip to question A15 A14. If Yes, was this during flood times only? Y N No Flood A15. In the past 12 months how often did your children eat any of the following foods because
other food was scarce: Interviewer: circle one letter for each food Never Rarely Some Often Mostly times Mishti Alu (sweet potato) 1 2 3 4 5 Bon Kochu (wild taro) 1 2 3 4 5 Shaluk (water lily) 1 2 3 4 5 Gom Baja (fried wheat) 1 2 3 4 5 Ata Gola Pani (Flour and water) 1 2 3 4 5 Bhatar Mar (rice starch) 1 2 3 4 5 Khud (broken rice) 1 2 3 4 5 A16. In the last 12 months how often did the infants (under 5) skip entire meals because there was no food? (not including times when they were sick). [Quantity] Interviewer: circle the letter giving the closest answer:
1. Never 2. Rarely (only 1 to 6 times in a year) 3. Sometimes (only a few times in the year – 7 to 12 times) 4. Often (a few times almost every month) 5. Mostly (this happens a lot)
A17. In the last 12 months how often did the main working adult in your family skip entire meals
because there was no food? (not including times when they were sick). [Quantity] Interviewer: circle the letter giving the closest answer:
36

1. Never 2. Rarely (only 1 to 6 times in a year) 3. Sometimes (only a few times in the year – 7 to 12 times) 4. Often (a few times most months) 5. Mostly (this happens a lot)
A18. In the last 12 months how often did infants (under 5) not eat for an entire day because there
was no food? (Do not include times when they were sick). [Quantity] Interviewer: circle the letter giving the closest answer:
1. Never 2. Rarely (only 1 to 6 times in a year) 3. Sometimes (only a few times in the year – 7 to 12 times) 4. Often (a few times each month) 5. Mostly (this happens a lot)
Interviewer: if answer is “1”, skip to question B1 A19. If Yes, was this during flood times only? Y N No flood
-----------------------------------------------------------------------------------------
Section ‘B’: On Acceptability and Security Issues B1. In the past 12 months how often did food stored in your home run out and there was no money
to buy more that day? [Insecurity] Interviewer: circle the letter giving the closest answer:
1. Never—we always have enough money to buy food. 2. Rarely (only 1 to 6 times in a year) 3. Sometimes (only a few times in the year – 7 to 12 times) 4. Often (a few times almost every month) 5. Mostly (this happens a lot)
B2. In the past 12 months how often did you worry about where food would come from? (Mathar
bhitre koto chinta from food or money worries) [Insecurity] Interviewer: circle the letter giving the closest answer:
1. Never. 2. Rarely (only 1 to 6 times in a year) 3. Sometimes (only a few times in the year – 7 to 12 times) 4. Often (a few times each month) 5. Mostly (this happens a lot)
B3. In the past 12 months what was the main reason that you were worried about not getting
enough food? [Insecurity] 1. Flood/Cyclone 2. Food prices 3. Sickness of family member 4. Debt 5. No regular cash income (job security) 6. Other_________________________________________
B4. In the past 12 months, how often did your family purchase rice? [Insecurity] Interviewer: circle the letter giving the closest answer:
1. Never 2. Rarely (a few months in each year) 3. Sometimes (a few times in each month)
37

4. Often (every week) 5. Mostly (Every day)
B5. In the past 12 months how often did you borrow money from local moneylenders with
interest? [Acceptability] Interviewer: circle the letter giving the closest answer:
1. Never. 2. Rarely (only 1 to 6 times in a year) 3. Sometimes (only a few times in the year – 7 to 12 times) 4. Often (a few times each month) 5. Mostly (this happens a lot) Interviewer: If answer is ”1”, go to question B7
B6. If you did borrow, what was the most important thing you borrowed money for?
Interviewer: circle the letter giving the closest answer: 1. Food 2. Dowry 3. Sickness 4. Clothing 5. School costs 6. Housing costs 7. Repay other loans 8. Travel (including seasonal migration) 9. Other___________________________________
B7. In the past 12 months how often did you take food (rice, lentils etc.) on credit (or loan) from
a local shop? [Acceptability] Interviewer: circle the letter giving the closest answer:
1. Never. 2. Rarely (only 1 to 6 times in a year) 3. Sometimes (only a few times in the year – 7 to 12 times) 4. Often (a few times almost every month) 5. Mostly (this happens a lot)
B8. In the past 12 months how often did you have to borrow food from relatives or neighbors to make a meal? [Acceptability]
Interviewer: circle the letter giving the closest answer: 1. Never. 2. Rarely (only 1 to 6 times in a year) 3. Sometimes (only a few times in the year – 7 to 12 times) 4. Often (a few times almost every month) 5. Mostly (this happens a lot)
B9. In the past 12 months how often did you borrow food to serve to Attio Shojan or Kutum?
[Acceptability] Interviewer: circle the letter giving the closest answer:
1. Never. 2. Rarely (only 1 to 3 times in a year) 3. Sometimes (only a few times in the year – 3 to 6 times) 4. Often (a few times most months) 5. Mostly (this happens a lot)
B10. At the last Kurbani did your family seek Kurbani meat? Y N [Acceptability]
38

B11. In the past 12 months did you receive or seek Jakat or Fitra? Y N [Acceptability]
B12. In the last 12 months how often did you have to use money that you needed to use for
another purpose to buy food? [Acceptability] Interviewer: circle the letter giving the closest answer:
1. Never 2. Rarely (only 1 to 6 times in a year) 3. Sometimes (only a few times in the year – 7 to 12 times) 4. Often (a few times most months) 5. Mostly (this happens a lot)
B13. If yes, what would you have used the money for (if not for food)?
Interviewer: multiple response is possible 1. Sickness/medicines 2. Dowry 3. Clothing 4. School costs 5. Housing costs 6. Repay other loans 7. Investment in assets 8. Travel (including seasonal migration) 9. Other___________________________________
B14. In the past 12 months how often did you have to sell or mortgage your own things in order
to get food? [Acceptability] Interviewer: circle the letter giving the closest answer: 1. Never 2. Rarely (only 1 to 6 times in a year) 3. Sometimes (only a few times in the year – 7 to 12 times) 4. Often (a few times most months) 5. Mostly (this happens a lot) Interviewer: If answer is “1”, go to question B18
B15. If yes, what did you sell or mortgage to get food?
Interviewer: multiple response is possible 1. Farming equipment 2. Jewelry 3. Clothing 4. Radio/TV 5. Bicycle/cart 6. Sewing machine 7. Livestock 8. Other______________________________________
B16 If Yes, was this during flood times only? Y N No Flood B17 Based on answers to the above questions, in the enumerator’s opinion, this household
should be classified as: 1. Food secure 2. Food insecure without hunger 3. Food insecure with hunger
39

References
Andrews, Margaret, Mark Nord, Gary Bickel, and Steven Carlson. 2000. Household Food Security in the United States, 1999. Food Assistance and Nutrition Research Report no. 8. Washington, DC: Economic Research Service, U.S. Department of Agriculture. Baker, Frank B. 1992. Item Response Theory: Parameter Estimation Techniques. New York: Marcel Dekker, Inc. Bickel, Gary, Steven Carlson, and Mark Nord. 1999. Household Food Security in the United States, 1995-1998, Advance Report. Alexandria, VA: Office of Analysis, Nutrition, and Evaluation, Food and Nutrition Service, U.S. Department of Agriculture. Bickel, Gary, Mark Nord, Cristofer Price, William L. Hamilton, and John T. Cook. 2000. Guide to Measuring Household Food Security, Revised 2000. Alexandria, VA: Office of Analysis, Nutrition, and Evaluation, Food and Nutrition Service, U.S. Department of Agriculture. Chung, Kimberly, Lawrence Haddad, Jayashree Ramakrishna, and Frank Riely. 1997. Alternative Approaches to Locating the Food Insecure: Qualitative and Quantitative Evidence from South India, Discussion Paper No. 22. Washington, DC: International Food Policy Research Institute. Fitchen, Janet M. 1981. Poverty in Rural America: A Case Study. Boulder, CO: Westview Press. Fitchen, Janet M. 1988. “Hunger, Malnutrition, and Poverty in the Contemporary United States: Some Observations on Their Social and Culteral Context,” Food and Foodways, Vol. 2, pp. 309-333. Gittlesohn, Joel, Sangeeta Mookherji, and Gretel Pelto. 1998. “Operationalizing Household Food Security in Rural Nepal.” Food and Nutrition Bulletin 19 (3): 210-222 (The United Nations University). Hambleton, Ronald K., H. Swaminathan, and H. Jane Rogers. 1991. Fundamentals of Item Response Theory. Newbury Park: Sage Publications. Hamilton, William L., John T. Cook, William W. Thompson, Lawrence F. Buron, Edward A. Frongillo, Jr., Christine M. Olson, and Cheryl A. Wehler. 1997a. Household Food Security in the United States in 1995: Summary Report of the Food Security Measurement Project. Washington DC: Office of Analysis, Nutrition, and Evaluation, Food and Nutrition Service, United States Department of Agriculture. Hamilton, William L., John T. Cook, William W. Thompson, Lawrence F. Buron, Edward A. Frongillo, Jr., Christine M. Olson, and Cheryl A. Wehler. 1997b. Household Food Security in the United States in 1995: Technical Report. Washington DC: Office of Analysis, Nutrition, and Evaluation, Food and Nutrition Service, United States Department of Agriculture. Hoddinott, John. 1999. Choosing Outcome Indicators of Household Food Security. Technical Guide No. 7. Washington, DC: International Food Policy Research Institute. Maxwell, Daniel, Clement Ahiadeke, Carol Levin, Margaret Armar-Klemesu, Sawadatu Zakariah, and Grace Mary Lamptey. 1999. “Alternatiave Food-Security Indicators: Revisiting the Frequency and Severity of ‘Coping Strategies’,” Food Policy 24: 411-429. Nord, Mark. 2000. “Comparing Prevalence Rates of Food Insecurity and Hunger Based on Non-Standard Question Sets to the National Benchmark,” poster presented at the Fourth International Conference on Dietary Assessment Methods, Tucson Arizona, September 17-20.
40

Nord, Mark and Gary Bickel. 2001. “Estimating the Prevalence of Children’s Hunger from the Current Population Survey Food Security Supplement.” Second Food Security Measurement and Research Conference, Volume II: Papers. Food Assistance and Nutrition Research Report 11-2, pp. 31-49. Edited by Margaret Andrews and Mark Prell. U.S. Dept. Agr., Economic Research Service. Nord, Mark, Nader Kabbani, Laura Tiehen, Margaret Andrews, Gary Bickel, and Steven Carlson. 2002. Household Food Security in the United States, 2000. Food Assistance and Nutrition Research Report No. 21. Washington, DC: Economic Research Service, U.S. Department of Agriculture. Nord, Mark. Forthcoming. A Revised 30-Day Food Security Scale for Current Population Survey Food Security Supplement Data, Food Assistance and Nutrition Research Report. Washington, DC: Economic Research Service, U.S. Department of Agriculture. Ohls, James, Larry Radbill, and Allen Schirm (2001 forthcoming). Final Report of the Project to Analyze 1996 and 1997 Food Security Data. Report prepared for USDA, Food and Nutrition Service, Alexandria, VA. Radimer, K.L., C.M. Olson, J.C. Greene, C.C. Campbell, and J.P. Habicht. 1992. “Understanding Hunger and Developing Indicators to Assess it in Women and Children.” Journal of Nutrition Education 24 (1): 36S-44S. Radimer, K.L., C.M. Olson, and C.C. Campbell. 1990. “Development of Indicators to Assess Hunger.” Journal of Nutrition 120 (Suppl 11): 1544-1548. Raj, Nikhil and Anoop Kumar Satpathy. 2002. “Household Food Insecurity and Child Labour: Some Evidences from Rural Orissa,” Chapter 14 in Coming to Grips with Rural Child Work, Nira Ramchandran and Lionel Massum (eds.). New Delhi: IHD Publishers. PRAXIS. 1998. “Participatory Poverty Profile Study, Bolangir District, Orissa.” Bhubaneshwar, India: Institute for Participatory Practices and Action Aid. Webb, Patrick, Jennifer Coates, and Robert Houser. 2002. “Challenges in Developing a ‘Direct Measure’ of Hunger and Food Insecurity for Bangladesh: Preliminary Findings from Ongoing Field Research.” Paper prepared for the the International Scientific Symposium on Measurement and Assessment of Food Deprivation and Under-Nutrition Sponsored by the Food and Agriculture Organization, Rome, Italy, June 26-28, 2002. Webb, Patrick, Jennifer Coates, and Robert Houser. 2001a. “A Report on the Formulation of the Core Food Security Module, and Experiences in Its Implementation in Bangladesh. Food Insecurity Measurement and Validation Study.” Report to the Academy for Educational Development, Washington, D.C. Webb, Patrick, Jennifer Coates, Robert Houser, Zahidul Hassan, and Md. Zobair. 2001b. “Expectations of Success and Constraints to Participation Among IGVGD Women.” Report to the United Nations World Food Programme. Wehler, C.A., R.I. Scott, and J.J. Anderson. 1992. “The Community Childhood Hunger Identification Project: A Model of Domestic Hunger--Demonstration Project in Seattle, Washington.” Journal of Nutrition Education 24 (1): 29S-35S. Wolfe, Wendy S. and Edward A. Frongillo. 2001. “Building Household Food-Security Measurement Tools from the Ground Up,” Food and Nutrition Bulletin 22(1): 5-12, The United Nations University. (Available: www.unu.edu/unupress/food/Unupress.htm#bulletin.)
41

Wright, B. D. 1977. Solving Measurement Problems with the Rasch Model. Mesa Psychometric Laboratory, the University of Chicago, College of Education, Chicago, IL. (Available: www.rasch.org/memos.htm.) Wright, B. D. 1983. Fundamental Measurement in Social Science and Education. Mesa Psychometric Laboratory, the University of Chicago, College of Education, Chicago, IL. (Available: www.rasch.org/memos.htm.)
42

Table 1. Item calibrations and fit statistics, Orissa Child Labor Study
Item1
Calib. in U.S.
scale2
Calib. in Orissa scale2
Valid number of cases
Raw score4 Infit5 Outfit5
Std. error of
item calib. in Orissa scale
2. Food bought didn’t last 2.79 3.17 230 214 0.75 0.16 0.16 3. Couldn’t afford balanced meals 3.67 2.94 230 218 1.00 4.96 0.17 4. Adult cut size of meal or skipped meal 5.37 6.30 228 122 .76 .32 0.12
4a. Adult cut size of meal or skipped meal, 5+ days1 6.42 7.45 228 72 .88 .71 0.10
5. Respondent ate less than should 5.53 5.50 192 136 1.11 3.07 0.14 6. Respondent hungry, did not eat 7.54 7.00 194 90 .98 1.11 0.11 7. Couldn’t feed child balanced meal 5.04 3.56 178 160 .94 .24 0.17
8. Cut size of child’s meal, or child skipped meal 8.793 8.04 194 40 .86 1.95 0.12
8a. Cut size of child’s meal, or child skipped meal, 5+ days1 NA 8.65 194 22 .97 2.20 0.14
9. Child did not eat whole day 11.94 9.04 170 14 1.10 .73 0.16 Mean of items used to adjust metric 4.98 4.98
Standard deviation of items used to adjust metric 1.65 1.65
Discrimination parameter 1.126 2.14 Notes: 1Questions in the Orissa survey were referenced to the “last 30 days.” Follow-up questions asking “How often did this happen in the last 30 days” were dichotomized so that 1-4 days=negative 5 or more days=affirmative. 2Scores in bold were used to adjust the metric of the Orissa scale to that of the U.S. scale in order to make household scores and prevalence rates comparable. 3This item in the Orissa scale includes cutting the size of a child’s meal or a child skipping a meal. It is not quite equivalent to the U.S. counterpart which asks only about cutting the size of a child’s meal. (The U.S. scale includes a separate item about children skipping meals.) Analysis not shown indicates that, in the U.S., response to this combined item is determined almost completely by the behavior of cutting the size of children’s meals, while children skipping meals is substantially more severe. The combined question is expected to be less severe, but only slightly less severe, than the question about only cutting the size of child’s meal shown here as a comparison item. 4Number of affirmative responses to scale items. 5Item-fit statistics for all items except the two frequency-of-occurrence follow-up items were estimated with the two frequency-of-occurrence items excluded from the model. This avoids bias due to the statistical dependence of the frequency-of-occurrence items and their base items. Item-fit statistics for the two frequency-of-occurrence items were estimated with their based items excluded from the model. 6Average discrimination of items in the 18-item U.S. Food Security Scale is 1.0. However, when responses to the items corresponding to those in the Orissa scale are fit to the Rasch model without the other items in the U.S. scale, average discrimination is somewhat higher, as reflected in the discrimination parameter of 1.12. Source: Calculated by ERS based on data from the Orissa Child Labor Study and the U.S. Current Population Survey Food Security Supplement, August 1998.

Table 2. Household scale scores and food security status categories by raw score, Orissa Child Labor Study1
Raw score (number of “yes” responses) Household with
child2 Household with no
child Household scale score
Percentage of households
(N=282) Food security status
category3 04 04 NA 3.5 1 2.87 4.3 1 3.05 0.7
Food secure (8.5 % of households)
3.25 Threshold—food insecure 2 3.56 12.4 2 4.40 2.5
3 4.61 10.6 4 5.79 7.1 3 5.80 1.4
Food insecure without hunger
(34.0 % of households)
6.38 Threshold--hunger 5 6.56 5.7 4 6.60 0.0
6 7.19 9.2 5 7.34 3.5
7 7.77 15.6 64 7.83 2.1
8 8.35 2.1 9 9.01 10.6
104 9.47 8.5
Food insecure with hunger (57.4 % of households)
Notes: 1Households in this survey are not representative of Orissa as a whole. They were selected based on being in low-income areas and on criteria indicating economic vulnerability. 2The severity of food insecurity experienced by children in Orissa households is likely to be understated compared to that in U.S. households with the same scale score. A single scale cannot be made equivalent for both adults and children between the two populations because of differences in the way households manage food shortage in the two populations. 3Thresholds are set equivalent to those in the U.S. food security scale in order to illustrate how prevalence rates can be compared across surveys conducted in different countries. These may not be appropriate thresholds and categorical assignments for policy communication in India. For example, for this specific survey of a particularly vulnerable population, it may be appropriate to divide the category labeled food insecure with hunger—which comprises 57 percent of the sample households—into two or even three categories. 4Household scale scores cannot be calculated precisely for households that affirm no items or for households that affirm all valid items. When using scale scores in linear models, appropriate account must be taken of the uncertainty with respect to household scores of households that affirmed no items. Scores presented here for households affirming all items are approximations based on a hypothetical case of affirming all but one-half of one item. For most purposes these can be used in linear models without introducing serious distortions because the households affected are few. Source: Calculated by ERS based on data from the Orissa Child Labor Study and the U.S. Current Population Survey Food Security Supplement, August 1998.

Table 3. Item calibrations and fit statistics, Kampala study
Item1
Calib. in U.S. scale
Calib. in Kamp. scale
Valid number of cases
Raw score2 Infit Outfit
Std. error of
item calib. in Kamp. scale
H10. Relied on few kinds of low-cost food to feed children 3.27 3.18 1,046 1014 1.04 29.40 .15
H4. Any person hungry, did not eat 7.54 8.23 1,063 417 .87 .99 .07 H11. Cut size of child’s meal 8.79 7.82 1,063 480 1.12 1.19 .07 H8. Adult did not eat whole day 9.12 9.73 1,063 207 .77 1.07 .08 H13. Child did not eat whole day 11.94 11.71 1,063 46 1.04 .69 .14 Mean of items calibrations 8.13 8.13 Standard deviation of item calibrations 2.83 2.83
Discrimination parameter 1.353 1.22 Notes: 1Items are presented in order of severity on the U.S. scale to facilitate analysis. All items included in the Kampala scale were considered to be equivalent to items in the U.S. scale and were used to adjust the metric of the Kampala scale to that of the U.S. scale in order to make household scores and prevalence rates comparable. 2Number of affirmative responses to scale items. 3Average discrimination of items in the 18-item U.S. Food Security Scale is 1.0. However, when responses to the items corresponding to those in the Kampala scale are fit to the Rasch model without the other items in the U.S. scale, average discrimination is somewhat higher, as reflected in the discrimination parameter of 1.35. Source: Calculated by ERS based on data from Kampala, Uganda, Study of Access, Usage, and Satisfaction with Social Services, 1999, and U.S. Current Population Survey Food Security Supplement, August 1998.

Table 4. Household scale scores and food security status categories by raw score, households with children in Kampala study
Raw score (number of “yes” responses) Household with
child Household with no
child1 Household scale score
Percentage of households (N=1548)
Food security status category2
03 NA 19.4 Food secure 3.25 Threshold—food insecure
1 5.26 27.34 Food insecure without hunger4
6.38 Threshold--hunger 2 7.86 18.7 3 9.20 14.7 4 10.86 8.1 53 11.97 11.9
Food insecure with hunger (53.3 % of households)
Notes: 1There were not enough adult-referenced items to provide a meaningful scale for households without children. 2Thresholds are set equivalent to those in the U.S. food security scale in order to illustrate how prevalence rates can be compared across surveys conducted in different countries. These may not be appropriate thresholds and categorical assignments for policy communication in Uganda. 3Household scale scores cannot be calculated precisely for households that affirm no items or for households that affirm all valid items. When using scale scores in linear models, appropriate account must be taken of the uncertainty with respect to household scores of households that affirmed no items. The scores presented here for households affirming all five items is an approximation based on a hypothetical case of affirming all but one-half of one item. For most purposes this can be used in linear models without introducing serious distortions if the households affected are few. If a substantial proportion of households affirm all items in a scale, then additional items should be added that are sensitive to more severe levels of food insecurity. 4Because of the paucity of lower-severity items in this scale, the lowest measured level of food insecurity is substantially higher than the food insecure threshold specified. A substantial proportion of households classified as food secure would likely be classified as food insecure without hunger if the range of the scale were extended downward by adding one or two less severe items. Source: Calculated by ERS based on data from Kampala, Uganda, Study of Access, Usage, and Satisfaction with Social Services, 1999, and U.S. Current Population Survey Food Security Supplement, August 1998.

Table 5. Prevalence rates of recurring and chronic food insecurity and hunger in households with children in Kampala study (N=1548)
Temporal reference of food security scale
Food security status Ever in last 12
months Recurring in last 12
months Chronic in last 12
months - - - - - - - - - - Percent of households - - - - - - - - - - Secure (or insecurity not recurring or not chronic) 19.4 50.4 71.3
Insecure without hunger 27.3 17.6 15.1
Insecure with hunger 53.3 32.0 13.6
Source: Calculated by ERS based on data from Kampala, Uganda, Study of Access, Usage, and Satisfaction with Social Services, 1999. Thresholds are for illustrative purposes only, and are set equivalent to those of the U.S. Food Security Scale.

Table 6. Crosstabulation of food security status of Kampala study households based on “ever in last 12 months” scale and “chronic in last 12 months” scale Food security status based on “chronic in last 12 months” scale Not chronically
insecure Chronically insecure, not
chronically with hunger
Chronically food insecure with hunger
Total
Number of households Cell as percent of total
- - - - - - - - - - Cell as percent of row - - - - - - - - - - Cell as percent of column
300 0 0 300 19.38 19.38
100.00 Food secure
27.17 373 49 0 422
24.10 3.17 27.26 88.39 11.61 Food insecure without hunger
33.79 21.03 431 184 211 826
27.84 11.89 13.63 53.36 52.18 22.28 25.54 Food insecure with hunger
39.04 78.97 100.00 1104 233 211 1548
71.32 15.05 13.63 100.00
Food
Sec
urity
stat
us b
ased
on
“eve
r in
last
12
mon
ths”
scal
e
Total
Source: Calculated by ERS based on data from Kampala, Uganda, Study of Access, Usage, and Satisfaction with Social Services, 1999. Thresholds are for illustrative purposes only, and are set equivalent to those of the U.S. Food Security Scale.

Table 7. Item calibrations and fit statistics, Bangladesh study1
Bangladesh scale
Item2
Calib. in U.S.
scale3 Calib.3
Valid number of cases
Raw score4 Infit Outfit
Std. error of
item calib.
A7 Rarely or never cooked good quality food (bhalo mondo) 0.80 496 447 1.01 0.86 0.19
A9 Respondent ate less food so there would be more for family 1.61 496 416 1.01 0.95 0.16
A5 Rarely or never ate (large) fish 1.82 496 406 1.07 1.57 0.16 A1 Rarely or never ate meat 2.22 496 385 1.12 1.25 0.15 B8 Had to borrow food from relatives or neighbors 2.49 496 369 1.15 1.34 0.14
B2 Worried where food would come from 1.49 2.75 496 353 0.83 0.64 0.14
B1 Food stored in home ran out and no money to buy more 2.79 2.90 496 343 0.88 0.83 0.13
A4 Rarely or never bought chanachur and other snacks 3.67 496 289 1.09 1.12 0.13
A11 Respondent skipped entire meals so there would be more food for family 6.255 3.97 496 267 0.90 0.81 0.13
A2 Rarely or never ate 3 square meals (full stomach meals) per day 4.33 496 240 0.94 1.03 0.13
A6 Ate wheat or other grains although wanted to eat rice 4.76 496 208 0.87 0.82 0.13
B9 Had to borrow food to feed guests 7.86 496 45 1.16 1.71 0.20 A13 Respondent did not eat for whole day (except Ramadan) 9.12 10.02 496 10 0.85 0.43 0.40
B14 Had to sell or mortgage possessions to get food 10.70 496 6 1.09 1.88 0.51
Mean of items used to adjust metric 4.91 4.91 Standard deviation of items used to adjust metric 2.99 2.99
Discrimination parameter 1.006 0.84 Notes: 1Development work is still in process on the Bangladesh scale; these results are preliminary. 2For full question wording, see Appendix E. 3Scores in bold were used to adjust the metric of the Bangladesh scale to that of the U.S. scale in order to make household scores and prevalence rates comparable. 4Number of responses to scale items that indicate food access problems. Response sets to questions in the Bangladesh survey were never/rarely/sometimes/often/mostly. For the basic food security scale, responses of “never” and “rarely” were coded as indicating a food access problem for questions about desirable behaviors and experiences (such as eating meat). Responses of “sometimes,” “often,” or “mostly” were coded as indicating a food access problem for undesirable behaviors and experiences (such as skipping meals). 5The U.S. scale does not include a separate item about adults skipping meals. The calibration used here is based on data from a split panel experiment in the April 1997 CPS Food Security Supplement in which separate questions were asked about adults cutting the size of meals and skipping meals. 6Average discrimination of items in the 18-item U.S. Food Security Scale is 1.0. This is a valid basis of comparison for discrimination of the Bangladesh scale since the two scales have approximately the same number of items that extend across approximately equivalent ranges of severity. Source: Calculated by ERS based on data from the Bangladesh “Income Generation for Vulnerable Group Development” Program Study, 2001, and the U.S. Current Population Survey Food Security Supplements, April 1997 and August 1998.

Table 8. Household scale scores and food security status categories by raw score, Bangladesh study1
Raw score (number of responses indicating food access problems)
Household scale score
Percentage of households
(N=503) Food security status
category2 03 NA 1.4 1 -0.34 0.6 2 .71 1.4 3 1.43 4.2 4 2.03 6.8 5 2.57 7.6 6 3.10 9.9
Food secure (31.8 % of households)
3.25 Threshold—food insecure 7 3.64 13.9 8 4.22 13.3 9 4.91 13.5
10 5.78 16.9
Food insecure without hunger
(57.7 % of households)
6.38 Threshold—hunger 11 7.07 9.3 12 8.79 1.0 13 10.64 .2 143 11.84 0.0
Food insecure with hunger (10.5 % of households)
Notes: 1Households in this survey are not representative of Bangladesh as a whole. They were selected based on participation in a specific set of income-generating projects. Development work continues on the Bangladesh scale; these results are preliminary even for the sampled population. 2Thresholds are set equivalent to those in the U.S. food security scale in order to illustrate how prevalence rates can be compared across surveys conducted in different countries. (In the case of the Bangladesh scale, the comparability is only roughly approximate, however, because there are few items with equivalent meanings in the Bangladesh and U.S. surveys with which to establish comparability.) These specific thresholds and categorical assignments may not be appropriate for policy communication in Bangladesh. 3Household scale scores cannot be calculated precisely for households that affirm no items or for households that affirm all valid items. When using scale scores in linear models, appropriate account must be taken of the uncertainty with respect to household scores of households that affirmed no items. The scores presented here for households affirming all 14 item is an approximation based on a hypothetical case of affirming 13.5 items. For most purposes, households with this score could be used in linear models without introducing serious distortions because the proportion of households will be few. (There were none in this sample.) Source: Calculated by ERS based on data from the Bangladesh “Income Generation for Vulnerable Group Development” Program Study, 2001, and the U.S. Current Population Survey Food Security Supplements, April 1997 and August 1998.

Figure 1. Calibrations of items in the Orissa Child Labor Study Food Security Scale compared to equivalent items in the U.S. Food Security Scale.
2
4
6
8
10
12
2 4 6 8 10 12
Item score, U.S. CPS 1998
Item
scor
e, O
rissa
Chi
ld L
abor
Stu
dy
Equal score
Metric-adjustment item
Other itemCouldn't afford balanced meals
Ate less than felt should
Cut size of meal or skipped meal
Cut or skipped, 5+ days
Food bought didn't last
Adult hungry
Couldn't afford balanced meals for children
Child cut or skipped
Child didn't eat whole day
Source: Calculated by ERS based on data from the Orissa Child Labor Study and the U.S. Current Population Survey Food Security Supplement, August 1998.

Figure 2. Calibrations of items in theKampala Food Security Scale compared to equivalent items in the U.S. Food Security Scale.
2
4
6
8
10
12
14
2 4 6 8 10 12 14Item score, U.S. CPS 1998
Item
scor
e, K
ampa
la st
udy
Equal score
Scale itemRelied on few kinds of low-cost foods for children
Hungry, did not eatCut size of child's meal
Child didn't eat whole day
Adult didn't eat whole day
Source: Calculated by ERS based on data from Kampala, Uganda, Study of Access, Usage, and Satisfaction with Social Services, 1999, and U.S. Current Population Survey Food Security Supplement, August 1998.

Figure 3. Calibrations of selected items in the preliminary Bangladesh Food Security Scale compared to approximately equivalent items in the U.S. Food Security Scale.
0
2
4
6
8
10
12
0 2 4 6 8 10 12Item score, U.S. CPS 1998
Item
scor
e, B
angl
ades
h st
udy
Equal score
Scale item
Worried food would run out
Food did not last
Respondent skipped meal*
Respondent did not eat whole day
*The U.S. scale does not include a separate item about adults skipping meals. The calbration used here is based on data from a split panel experiment in the April 1997 Current Population Survey Food Security Supplement in which separate questions were asked about adults cutting the size of meals and skipping meals. Source: Calculated by ERS based on data from the Bangladesh “Income Generation for Vulnerable Group Development” Program Study, 2001, and the U.S. Current Population Survey Food Security Supplements, April 1997 and August 1998.