Food Intake
89
United States Environmental Protection Agency Analysis of Total Food Intake and Composition of Individual’s Diet Based on USDA’s 1994–1996, 1998 Continuing Survey of Food Intakes by Individuals (CSFII)
description
kebutuhan asupan pangan
Transcript of Food Intake

United States Environmental Protection Agency
Analysis of Total Food Intake and Composition of Individual’s Diet Based on USDA’s 1994–1996, 1998 Continuing Survey of Food Intakes by Individuals (CSFII)

United States Environmental Protection Agency/ORD National Center for
Environmental Assessment Washington, DC 20460
Official Business Penalty for Private Use $300
EPA/600/R-05/062F March 2007
PRESORTED STANDARDPOSTAGE & FEES PAID
EPAPERMIT No. G-35

EPA/600/R-05/062F March 2007
Analysis of Total Food Intake and Composition ofIndividual’s Diet Based on USDA’s 1994–1996, 1998
Continuing Survey of Food Intakes by Individuals (CSFII)
National Center for Environmental AssessmentOffice of Research and Development
U.S. Environmental Protection AgencyWashington, DC 20460
DISCLAIMER
This document has been reviewed in accordance with U.S. Environmental Protection Agency policy and approved for publication. Mention of trade names or commercial products does not constituted endorsement or recommendation for use.
ABSTRACT
The American food supply is generally considered to be one of the safest in the world. The U.S. Department of Agriculture has been protecting the nation’s food supply for over a century through a number of food safety programs that monitor chemical and biological contaminants and rank the quality of various food items. Nevertheless, contamination of foods may occur through environmental pollution of air, water, and soil or through intentional use of chemicals such as pesticides or other agrochemical products. To assess chemical exposure through this pathway, information on food ingestion rates is needed. The National Center for Environmental Assessment (NCEA) conducted an analysis to provide an updated characterization of food consumption habits of individuals in the United States. The analysis was conducted using the data from the U.S. Department of Agriculture’s 1994–96 Continuing Survey of Food Intakes by Individuals (CSFII) and its 1998 Supplemental Children’s Survey and the EPA’s Food Commodity Intake Database (FCID). Distributions were derived to characterize (1) total food intake among various groups in the U.S. population, subdivided by age, race, geographic region, and urbanization; (2) intake of various food categories (e.g., meats, grains, and vegetables) by different age groups within the U.S. population; and (3) intake of various food categories of individuals exhibiting high end consumption patterns of one specific food category (e.g., individuals above the 90th percentile for meat consumption).
Preferred Citation: U.S. Environmental Protection Agency (EPA). (2007) Analysis of total food intake and composition of individual’s diet based on USDA’s 1994–96, 1998 continuing survey of food intakes by individuals (CSFII). National Center for Environmental Assessment, Washington, DC; EPA/600/R-05/062F. Available from the National Technical Information Service, Springfield, VA, and online at www.epa.gov/ncea.
ii

CONTENTS
LIST OF TABLES . . . . . . . . . . . . . . . . . . . . . . . . . . . . . . . . . . . . . . . . . . . . . . . . . . . . . . . . . . . . iv LIST OF FIGURES . . . . . . . . . . . . . . . . . . . . . . . . . . . . . . . . . . . . . . . . . . . . . . . . . . . . . . . . . xiii PREFACE . . . . . . . . . . . . . . . . . . . . . . . . . . . . . . . . . . . . . . . . . . . . . . . . . . . . . . . . . . . . . . . . . xiv AUTHORS, CONTRIBUTORS, AND REVIEWERS . . . . . . . . . . . . . . . . . . . . . . . . . . . . . . . . xv
1. INTRODUCTION . . . . . . . . . . . . . . . . . . . . . . . . . . . . . . . . . . . . . . . . . . . . . . . . . . . . . . 1
2. SOURCES OF FOOD CONSUMPTION AND FAT CONTENT DATA . . . . . . . . . . . . 2 2.1. FOOD CONSUMPTION SURVEYS . . . . . . . . . . . . . . . . . . . . . . . . . . . . . . . . . . 2 2.2. SAMPLE WEIGHTS . . . . . . . . . . . . . . . . . . . . . . . . . . . . . . . . . . . . . . . . . . . . . . . 3 2.3. CONVERSION OF USDA FOOD CODES TO EPA COMMODITY CODES . . 52.4. IDENTIFICATION OF FOOD CATEGORIES . . . . . . . . . . . . . . . . . . . . . . . . . . 5
3. DATA ANALYSIS . . . . . . . . . . . . . . . . . . . . . . . . . . . . . . . . . . . . . . . . . . . . . . . . . . . . . 12 3.1. PREPARATION OF DATA . . . . . . . . . . . . . . . . . . . . . . . . . . . . . . . . . . . . . . . . 12 3.2. IDENTIFICATION OF DEMOGRAPHIC COHORTS . . . . . . . . . . . . . . . . . . . 15 3.3. USE OF WEIGHTING FACTORS . . . . . . . . . . . . . . . . . . . . . . . . . . . . . . . . . . . 17
4. RESULTS . . . . . . . . . . . . . . . . . . . . . . . . . . . . . . . . . . . . . . . . . . . . . . . . . . . . . . . . . . . . 18 4.1. TOTAL DIETARY INTAKE: WHOLE POPULATION AND POPULATION
SUBGROUPS . . . . . . . . . . . . . . . . . . . . . . . . . . . . . . . . . . . . . . . . . . . . . . . . . . . 18 4.2. INTAKE OF INDIVIDUAL FOOD GROUPS, CATEGORIZED BY AGE . . . 18 4.3. IDENTIFICATION OF HIGH-END, MID-RANGE, AND LOW-END
DECILES OF FOOD INTAKE . . . . . . . . . . . . . . . . . . . . . . . . . . . . . . . . . . . . . . 18
REFERENCES . . . . . . . . . . . . . . . . . . . . . . . . . . . . . . . . . . . . . . . . . . . . . . . . . . . . . . . . . . . . . . 72
Attachment 1. Documentation for the Continuing Survey of Food Intakes by Individuals (CSFII) Attachment 2. EPA Food Commodity Vocabulary
Note: Included with this document is a CD that contains files for the document and supplemental information (Attachments 1 and 2).
iii

LIST OF TABLES
Table 1. Hypothetical Example of the Effect of Weighting Fac. tors 5. . . . . . . . . . . . . . . . . . . . .
Table 2. EPA Commodity Codes, by Food Cate. gory 6. . . . . . . . . . . . . . . . . . . . . . . . . . . . . . . . .
Table 3. Listing of Food Consumption Events in Datab. ase 13 . . . . . . . . . . . . . . . . . . . . . . . . . .
Table 4. Definition and Size of Demographic Cohorts . . . . . . . . . . . . . . . . . . . . . . . . . . . 16
Table 5A. Per Capita Total Dietary Intake (g/kg/day) . . . . . . . . . . . . . . . . . . . . . . . . . . . . . 19
Table 5B. Per Capita Total Dietary Intake (g/day) . . . . . . . . . . . . . . . . . . . . . . . . . . . . . . . . 20
Table 6. Table Numbers for Each Age Group and Type of Intake . . . . . . . . . . . . . . . . . . 21
Table 7A. Per Capita Intake of Major Food Groups, All Ages Combined (g/kg/day) . . . . . 22
Table 7B. Per Capita Intake of Major Food Groups, All Ages Combined (g/day) . . . . . . . 22
Table 7C. Per Capita Intake of Major Food Groups, Age 20+ Years (g/kg/day) . . . . . . . . . 23
Table 7D. Per Capita Intake of Major Food Groups, Age 20+ Years (g/day) . . . . . . . . . . . 23
Table 7E. Per Capita Intake of Major Food Groups, Age <1 Year (g/kg/day) . . . . . . . . . . 24
Table 7F. Per Capita Intake of Major Food Groups, Age <1 Year (g/day) . . . . . . . . . . . . . 24
Table 7G. Per Capita Intake of Major Food Groups, Ages 1-2 Years (g/kg/day) . . . . . . . . 25
Table 7H. Per Capita Intake of Major Food Groups, Ages 1-2 Years (g/day) . . . . . . . . . . . 25
Table 7I. Per Capita Intake of Major Food Groups, Ages 3-5 Years (g/kg/day) . . . . . . . . 26
Table 7J. Per Capita Intake of Major Food Groups, Ages 3-5 Years (g/day) . . . . . . . . . . . 26
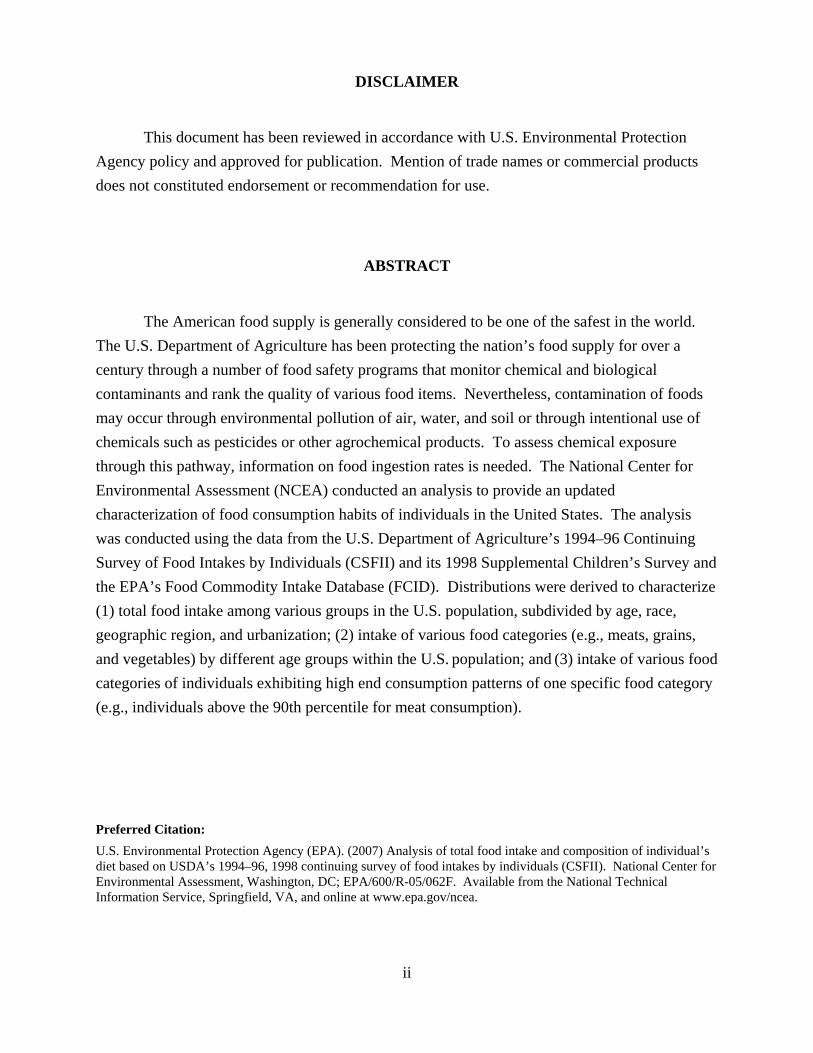
Table 7K. Per Capita Intake of Major Food Groups, Ages 6-11 Years (g/kg/day) . . . . . . . 27
Table 7L. Per Capita Intake of Major Food Groups, Ages 6-11 Years (g/day) . . . . . . . . . . 27
Table 7M. Per Capita Intake of Major Food Groups, Ages 12-19 Years (g/kg/day) . . . . . . 28
Table 7N. Per Capita Intake of Major Food Groups, Ages 12-19 Years (g/day) . . . . . . . . . 28
Table 8. Guide to Table Numbers . . . . . . . . . . . . . . . . . . . . . . . . . . . . . . . . . . . . . . . . . . . 29
iv

LIST OF TABLES (continued)
Table 9A. Per Capita Intake of Total Foods and Major Food Groups and Percent of Total Food Intake for Individuals with Low-End, Mid-Range, and High-End Total Food Intake, All Age Groups Combined (g/kg/day) . . . . . . . . . . . . . . . . . . . . . . . . . . 30
Table 9B. Per Capita Intake of Total Foods and Major Food Groups and Percent of Total Food Intake for Individuals with Low-End, Mid-Range, and High-End Total Food Intake, All Age Groups Combined (g/day) . . . . . . . . . . . . . . . . . . . . . . . . . . . . . 30
Table 9C. Per Capita Intake of Total Foods and Major Food Groups and Percent of Total Food Intake for Individuals with Low-End, Mid-Range, and High-End Total Food Intake, Age 20+ Years (g/kg/day) . . . . . . . . . . . . . . . . . . . . . . . . . . . . . . . . . . . . 31
Table 9D. Per Capita Intake of Total Foods and Major Food Groups and Percent of Total Food Intake for Individuals with Low-End, Mid-Range, and High-End Total Food Intake, Age 20+ Years (g/day) . . . . . . . . . . . . . . . . . . . . . . . . . . . . . . . . . . . . . . . 31
Table 9E. Per Capita Intake of Total Foods and Major Food Groups and Percent of Total Food Intake for Individuals with Low-End, Mid-Range, and High-End Total Food Intake, Age <1 Year (g/kg/day) . . . . . . . . . . . . . . . . . . . . . . . . . . . . . . . . . . . . . . 32
Table 9F. Per Capita Intake of Total Foods and Major Food Groups and Percent of Total Food Intake for Individuals with Low-End, Mid-Range, and High-End Total Food Intake, Age <1 Year (g/day) . . . . . . . . . . . . . . . . . . . . . . . . . . . . . . . . . . . . . . . . 32
Table 9G. Per Capita Intake of Total Foods and Major Food Groups and Percent of Total Food Intake for Individuals with Low-End, Mid-Range, and High-End Total Food Intake, Ages 1-2 Years (g/kg/day) . . . . . . . . . . . . . . . . . . . . . . . . . . . . . . . . . . . . 33
Table 9H. Per Capita Intake of Total Foods and Major Food Groups and Percent of Total Food Intake for Individuals with Low-End, Mid-Range, and High-End Total Food Intake, Ages 1-2 Years (g/day) . . . . . . . . . . . . . . . . . . . . . . . . . . . . . . . . . . . . . . 33
Table 9I. Per Capita Intake of Total Foods and Major Food Groups and Percent of Total Food Intake for Individuals with Low-End, Mid-Range, and High-End Total Food Intake, Ages 3-5 Years (g/kg/day) . . . . . . . . . . . . . . . . . . . . . . . . . . . . . . . . . . . 34
Table 9J. Per Capita Intake of Total Foods and Major Food Groups and Percent of Total Food Intake for Individuals with Low-End, Mid-Range, and High-End Total Food Intake, Ages 3-5 Years (g/day) . . . . . . . . . . . . . . . . . . . . . . . . . . . . . . . . . . . . . . 34
Table 9K. Per Capita Intake of Total Foods and Major Food Groups and Percent of Total Food Intake for Individuals with Low-End, Mid-Range, and High-End Total Food Intake, Ages 6-11 Years (g/kg/day) . . . . . . . . . . . . . . . . . . . . . . . . . . . . . . . . . . 35
v

LIST OF TABLES (continued)
Table 9L. Per Capita Intake of Total Foods and Major Food Groups and Percent of Total Food Intake for Individuals with Low-End, Mid-Range, and High-End Total Food Intake, Ages 6-11 Years (g/day) . . . . . . . . . . . . . . . . . . . . . . . . . . . . . . . . . . . . . 35
Table 9M. Per Capita Intake of Total Foods and Major Food Groups and Percent of Total Food Intake for Individuals with Low-End, Mid-Range, and High-End Total Food Intake, Ages 12-19 Years (g/kg/day) . . . . . . . . . . . . . . . . . . . . . . . . . . . . . . . . . 36
Table 9N. Per Capita Intake of Total Foods and Major Food Groups and Percent of Total Food Intake for Individuals with Low-End, Mid-Range, and High-End Total Food Intake, Ages 12-19 Years (g/day) . . . . . . . . . . . . . . . . . . . . . . . . . . . . . . . . . . . . 36
Table 10A. Per Capita Intake of Total Foods and Major Food Groups and Percent of Total Food Intake for Individuals with Low-End, Mid-Range, and High-End Total Meat Intake, All Age Groups Combined (g/kg/day) . . . . . . . . . . . . . . . . . . . . . . . . . . . 37
Table 10B. Per Capita Intake of Total Foods and Major Food Groups and Percent of Total Food Intake for Individuals with Low-End, Mid-Range, and High-End Total Meat Intake, All Age Groups Combined (g/day) . . . . . . . . . . . . . . . . . . . . . . . . . . . . . 37
Table 10C. Per Capita Intake of Total Foods and Major Food Groups and Percent of Total Food Intake for Individuals with Low-End, Mid-Range, and High-end Total Meat Intake, Age 20+ Years (g/kg/day) . . . . . . . . . . . . . . . . . . . . . . . . . . . . . . . . . . . . 38
Table 10D. Per Capita Intake of Total Foods and Major Food Groups and Percent of Total Food Intake for Individuals with Low-End, Mid-Range, and High-end Total Meat Intake, Age 20+ Years (g/day) . . . . . . . . . . . . . . . . . . . . . . . . . . . . . . . . . . . . . . . 38
Table 10E. Per Capita Intake of Total Foods and Major Food Groups and Percent of Total Food Intake for Individuals with Low-End, Mid-Range, and High-end Total Meat Intake, Age <1 Year (g/kg/day) . . . . . . . . . . . . . . . . . . . . . . . . . . . . . . . . . . . . . . 39
Table 10F. Per Capita Intake of Total Foods and Major Food Groups and Percent of Total Food Intake for Individuals with Low-End, Mid-Range, and High-end Total Meat Intake, Age <1 Year (g/day) . . . . . . . . . . . . . . . . . . . . . . . . . . . . . . . . . . . . . . . . 39
Table 10G. Per Capita Intake of Total Foods and Major Food Groups and Percent of Total Food Intake for Individuals with Low-End, Mid-Range, and High-end Total Meat Intake, Ages 1-2 Years (g/kg/day) . . . . . . . . . . . . . . . . . . . . . . . . . . . . . . . . . . . 40
Table 10H. Per Capita Intake of Total Foods and Major Food Groups and Percent of Total Food Intake for Individuals with Low-End, Mid-Range, and High-end Total Meat Intake, Ages 1-2 Years (g/day) . . . . . . . . . . . . . . . . . . . . . . . . . . . . . . . . . . . . . . 40
vi

LIST OF TABLES (continued)
Table 10I. Per Capita Intake of Total Foods and Major Food Groups and Percent of Total Food Intake for Individuals with Low-End, Mid-Range, and High-end Total Meat Intake, Ages 3-5 Years (g/kg/day) . . . . . . . . . . . . . . . . . . . . . . . . . . . . . . . . . . . 41
Table 10J. Per Capita Intake of Total Foods and Major Food Groups and Percent of Total Food Intake for Individuals with Low-End, Mid-Range, and High-end Total Meat Intake, Ages 3-5 Years (g/day) . . . . . . . . . . . . . . . . . . . . . . . . . . . . . . . . . . . . . . 41
Table 10K. Per Capita Intake of Total Foods and Major Food Groups and Percent of Total Food Intake for Individuals with Low-End, Mid-Range, and High-end Total Meat Intake, Ages 6-11 Years (g/kg/day) . . . . . . . . . . . . . . . . . . . . . . . . . . . . . . . . . . 42
Table 10L. Per Capita Intake of Total Foods and Major Food Groups and Percent of Total Food Intake for Individuals with Low-End, Mid-Range, and High-end Total Meat Intake, Ages 6-11 Years (g/day) . . . . . . . . . . . . . . . . . . . . . . . . . . . . . . . . . . . . . 42
Table 10M. Per Capita Intake of Total Foods and Major Food Groups and Percent of Total Food Intake for Individuals with Low-End, Mid-Range, and High-end Total Meat Intake, Ages 12-19 Years (g/kg/day) . . . . . . . . . . . . . . . . . . . . . . . . . . . . . . . . . 43
Table 10N. Per Capita Intake of Total Foods and Major Food Groups and Percent of Total Food Intake for Individuals with Low-End, Mid-Range, and High-end Total Meat Intake, Ages 12-19 Years (g/day) . . . . . . . . . . . . . . . . . . . . . . . . . . . . . . . . . . . . 43
Table 11A. Per Capita Intake of Total Foods and Major Food Groups and Percent of Total Food Intake for Individuals with Low-End, Mid-Range, and High-End Total Meat and Dairy Intake, All Age Groups Combined (g/kg/day) . . . . . . . . . . . . . . . . . . 44
Table 11B. Per Capita Intake of Total Foods and Major Food Groups and Percent of Total Food Intake for Individuals with Low-End, Mid-Range, and High-End Total Meat and Dairy Intake, All Age Groups Combined (g/day) . . . . . . . . . . . . . . . . . . . . . 44
Table 11C. Per Capita Intake of Total Foods and Major Food Groups and Percent of Total Food Intake for Individuals with Low-End, Mid-Range, and High-End Total Meat and Dairy Intake, Age 20+ Years (g/kg/day) . . . . . . . . . . . . . . . . . . . . . . . . . . . 45
Table 11D. Per Capita Intake of Total Foods and Major Food Groups and Percent of Total Food Intake for Individuals with Low-End, Mid-Range, and High-End Total Meat and Dairy Intake, Age 20+ Years (g/day) . . . . . . . . . . . . . . . . . . . . . . . . . . . . . . 45
Table 11E. Per Capita Intake of Total Foods and Major Food Groups and Percent of Total Food Intake for Individuals with Low-End, Mid-Range, and High-end Total Meat and Dairy Intake, Age <1 Year (g/kg/day) . . . . . . . . . . . . . . . . . . . . . . . . . . . . . 46
vii

LIST OF TABLES (continued)
Table 11F. Per Capita Intake of Total Foods and Major Food Groups and Percent of Total Food Intake for Individuals with Low-End, Mid-Range, and High-end Total Meat and Dairy Intake, Age <1 Year (g/day) . . . . . . . . . . . . . . . . . . . . . . . . . . . . . . . . 46
Table 11G. Per Capita Intake of Total Foods and Major Food Groups and Percent of Total Food Intake for Individuals with Low-End, Mid-Range, and High-End Total Meat and Dairy Intake, Ages 1-2 Years (g/kg/day) . . . . . . . . . . . . . . . . . . . . . . . . . . . 47
Table 11H. Per Capita Intake of Total Foods and Major Food Groups and Percent of Total Food Intake for Individuals with Low-End, Mid-Range, and High-End Total Meat and Dairy Intake, Ages 1-2 Years (g/day) . . . . . . . . . . . . . . . . . . . . . . . . . . . . . . 47
Table 11I. Per Capita Intake of Total Foods and Major Food Groups and Percent of Total Food Intake for Individuals with Low-End, Mid-Range, and High-end Total Meat and Dairy Intake, Ages 3-5 Years (g/kg/day) . . . . . . . . . . . . . . . . . . . . . . . . . . . 48
Table 11J. Per Capita Intake of Total Foods and Major Food Groups and Percent of Total Food Intake for Individuals with Low-End, Mid-Range, and High-end Total Meat and Dairy Intake, Ages 3-5 Years (g/day) . . . . . . . . . . . . . . . . . . . . . . . . . . . . . 48
Table 11K. Per Capita Intake of Total Foods and Major Food Groups and Percent of Total Food Intake for Individuals with Low-End, Mid-Range, and High-end Total Meat and Dairy Intake, Ages 6-11 Years (g/kg/day) . . . . . . . . . . . . . . . . . . . . . . . . . . 49
Table 11L. Per Capita Intake of Total Foods and Major Food Groups and Percent of Total Food Intake for Individuals with Low-End, Mid-Range, and High-end Total Meat and Dairy Intake, Ages 6-11 Years (g/day) . . . . . . . . . . . . . . . . . . . . . . . . . . . . 49
Table 11M. Per Capita Intake of Total Foods and Major Food Groups and Percent of Total Food Intake for Individuals with Low-End, Mid-Range, and High-end Total Meat and Dairy Intake, Ages 12-19 Years (g/kg/day) . . . . . . . . . . . . . . . . . . . . . . . . . 50
Table 11N. Per Capita Intake of Total Foods and Major Food Groups and Percent of Total Food Intake for Individuals with Low-End, Mid-Range, and High-end Total Meat and Dairy Intake, Ages 12-19 Years (g/day) . . . . . . . . . . . . . . . . . . . . . . . . . . . 50
Table 12A. Per Capita Intake of Total Foods and Major Food Groups and Percent of Total Food Intake for Individuals with Low-End, Mid-Range, and High-End Total Fish Intake, All Age Groups Combined (g/kg/day) . . . . . . . . . . . . . . . . . . . . . . . . . . 51
Table 12B. Per Capita Intake of Total Foods and Major Food Groups and Percent of Total Food Intake for Individuals with Low-End, Mid-Range, and High-End Total Fish Intake, All Age Groups Combined (g/day) . . . . . . . . . . . . . . . . . . . . . . . . . . . . . 51
viii

LIST OF TABLES (continued)
Table 12C. Per Capita Intake of Total Foods and Major Food Groups and Percent of Total Food Intake for Individuals with Low-End, Mid-Range, and High-end Total Fish Intake, Age 20+ Years (g/kg/day) . . . . . . . . . . . . . . . . . . . . . . . . . . . . . . . . . . . . 52
Table 12D. Per Capita Intake of Total Foods and Major Food Groups and Percent of Total Food Intake for Individuals with Low-End, Mid-Range, and High-end Total Fish Intake, Age 20+ Years (g/day) . . . . . . . . . . . . . . . . . . . . . . . . . . . . . . . . . . . . . . . 52
Table 12E. Per Capita Intake of Total Foods and Major Food Groups and Percent of Total Food Intake for Individuals with Low-End, Mid-Range, and High-end Total Fish Intake, Age <1 Year (g/kg/day) . . . . . . . . . . . . . . . . . . . . . . . . . . . . . . . . . . . . . . 53
Table 12F. Per Capita Intake of Total Foods and Major Food Groups and Percent of Total Food Intake for Individuals with Low-End, Mid-Range, and High-end Total Fish Intake, Age <1 Year (g/day) . . . . . . . . . . . . . . . . . . . . . . . . . . . . . . . . . . . . . . . . 53
Table 12G. Per Capita Intake of Total Foods and Major Food Groups and Percent of Total Food Intake for Individuals with Low-End, Mid-Range, and High-end Total Fish Intake, Ages 1-2 Years (g/kg/day) . . . . . . . . . . . . . . . . . . . . . . . . . . . . . . . . . . . . 54
Table 12H. Per Capita Intake of Total Foods and Major Food Groups and Percent of Total Food Intake for Individuals with Low-End, Mid-Range, and High-end Total Fish Intake, Ages 1-2 Years (g/day) . . . . . . . . . . . . . . . . . . . . . . . . . . . . . . . . . . . . . . 54
Table 12I. Per Capita Intake of Total Foods and Major Food Groups and Percent of Total Food Intake for Individuals with Low-End, Mid-Range, and High-end Total Fish Intake, Ages 3-5 Years (g/kg/day) . . . . . . . . . . . . . . . . . . . . . . . . . . . . . . . . . . . 55
Table 12J. Per Capita Intake of Total Foods and Major Food Groups and Percent of Total Food Intake for Individuals with Low-End, Mid-Range, and High-end Total Fish Intake, Ages 3-5 Years (g/day) . . . . . . . . . . . . . . . . . . . . . . . . . . . . . . . . . . . . . . 55
Table 12K. Per Capita Intake of Total Foods and Major Food Groups and Percent of Total Food Intake for Individuals with Low-End, Mid-Range, and High-end Total Fish Intake, Ages 6-11 Years (g/kg/day) . . . . . . . . . . . . . . . . . . . . . . . . . . . . . . . . . . 56
Table 12L. Per Capita Intake of Total Foods and Major Food Groups and Percent of Total Food Intake for Individuals with Low-End, Mid-Range, and High-end Total Fish Intake, Ages 6-11 Years (g/day) . . . . . . . . . . . . . . . . . . . . . . . . . . . . . . . . . . . . . 56
Table 12M. Per Capita Intake of Total Foods and Major Food Groups and Percent of Total Food Intake for Individuals with Low-End, Mid-Range, and High-end Total Fish Intake, Ages 12-19 Years (g/kg/day) . . . . . . . . . . . . . . . . . . . . . . . . . . . . . . . . . 57
ix

LIST OF TABLES (continued)
Table 12N. Per Capita Intake of Total Foods and Major Food Groups and Percent of Total Food Intake for Individuals with Low-End, Mid-Range, and High-end Total Fish Intake, Ages 12-19 Years (g/day) . . . . . . . . . . . . . . . . . . . . . . . . . . . . . . . . . . . . 57
Table 13A. Per Capita Intake of Total Foods and Major Food Groups and Percent of Total Food Intake for Individuals with Low-End, Mid-Range, and High-End Total Fruit and Vegetable Intake, All Age Groups Combined (g/kg/day) . . . . . . . . . . . . . . . 58
Table 13B. Per Capita Intake of Total Foods and Major Food Groups and Percent of Total Food Intake for Individuals with Low-End, Mid-Range, and High-End Total Fruit and Vegetable Intake, All Age Groups Combined (g/day) . . . . . . . . . . . . . . . . . 58
Table 13C. Per Capita Intake of Total Foods and Major Food Groups and Percent of Total Food Intake for Individuals with Low-End, Mid-Range, and High-End Total Fruit and Vegetable Intake, Age 20+ Years (g/kg/day) . . . . . . . . . . . . . . . . . . . . . . . . 59
Table 13D. Per Capita Intake of Total Foods and Major Food Groups and Percent of Total Food Intake for Individuals with Low-End, Mid-Range, and High-End Total Fruit and Vegetable Intake, Age 20+ Years (g/day) . . . . . . . . . . . . . . . . . . . . . . . . . . . 59
Table 13E. Per Capita Intake of Total Foods and Major Food Groups and Percent of Total Food Intake for Individuals with Low-End, Mid-Range, and High-End Total Fruit and Vegetable Intake, Age <1 Year (g/kg/day) . . . . . . . . . . . . . . . . . . . . . . . . . . 60
Table 13F. Per Capita Intake of Total Foods and Major Food Groups and Percent of Total Food Intake for Individuals with Low-End, Mid-Range, and High-End Total Fruit and Vegetable Intake, Age <1 Year (g/day) . . . . . . . . . . . . . . . . . . . . . . . . . . . . 60
Table 13G. Per Capita Intake of Total Foods and Major Food Groups and Percent of Total Food Intake for Individuals with Low-End, Mid-Range, and High-End Total Fruit and Vegetable Intake, Ages 1-2 Years (g/kg/day) . . . . . . . . . . . . . . . . . . . . . . . 61
Table 13H. Per Capita Intake of Total Foods and Major Food Groups and Percent of Total Food Intake for Individuals with Low-End, Mid-Range, and High-End Total Fruit and Vegetable Intake, Ages 1-2 Years (g/day) . . . . . . . . . . . . . . . . . . . . . . . . . . 61
Table 13I. Per Capita Intake of Total Foods and Major Food Groups and Percent of Total Food Intake for Individuals with Low-End, Mid-Range, and High-End Total Fruit and Vegetable Intake, Ages 3-5 Years (g/kg/day) . . . . . . . . . . . . . . . . . . . . . . . 62
Table 13J. Per Capita Intake of Total Foods and Major Food Groups and Percent of Total Food Intake for Individuals with Low-End, Mid-Range, and High-End Total Fruit and Vegetable Intake, Ages 3-5 Years (g/day) . . . . . . . . . . . . . . . . . . . . . . . . . . 62
x

LIST OF TABLES (continued)
Table 13K. Per Capita Intake of Total Foods and Major Food Groups and Percent of Total Food Intake for Individuals with Low-End, Mid-Range, and High-End Total Fruit and Vegetable Intake, Ages 6-11 Years (g/kg/day) . . . . . . . . . . . . . . . . . . . . . . 63
Table 13L. Per Capita Intake of Total Foods and Major Food Groups and Percent of Total Food Intake for Individuals with Low-End, Mid-Range, and High-End Total Fruit and Vegetable Intake, Ages 6-11 Years (g/day) . . . . . . . . . . . . . . . . . . . . . . . . . 63
Table 13M. Per Capita Intake of Total Foods and Major Food Groups and Percent of Total Food Intake for Individuals with Low-End, Mid-Range, and High-End Total Fruit and Vegetable Intake, Ages 12-19 Years (g/kg/day) . . . . . . . . . . . . . . . . . . . . . 64
Table 13N. Per Capita Intake of Total Foods and Major Food Groups and Percent of Total Food Intake for Individuals with Low-End, Mid-Range, and High-End Total Fruit and Vegetable Intake, Ages 12-19 Years (g/day) . . . . . . . . . . . . . . . . . . . . . . . . 64
Table 14A. Per Capita Intake of Total Foods and Major Food Groups and Percent of Total Food Intake for Individuals with Low-End, Mid-Range, and High-End Total Dairy Intake, All Age Groups Combined (g/kg/day) . . . . . . . . . . . . . . . . . . . . . . . . . . . 65
Table 14B. Per Capita Intake of Total Foods and Major Food Groups and Percent of Total Food Intake for Individuals with Low-End, Mid-Range, and High-End Total Dairy Intake, All Age Groups Combined (g/day) . . . . . . . . . . . . . . . . . . . . . . . . . . . . . 65
Table 14C. Per Capita Intake of Total Foods and Major Food Groups and Percent of Total Food Intake for Individuals with Low-End, Mid-Range, and High-End Total Dairy Intake, Age 20+ Years (g/kg/day) . . . . . . . . . . . . . . . . . . . . . . . . . . . . . . . . . . . . 66
Table 14D. Per Capita Intake of Total Foods and Major Food Groups and Percent of Total Food Intake for Individuals with Low-End, Mid-Range, and High-End Total Dairy Intake, Age 20+ Years (g/day) . . . . . . . . . . . . . . . . . . . . . . . . . . . . . . . . . . . . . . . 66
Table 14E. Per Capita Intake of Total Foods and Major Food Groups and Percent of Total Food Intake for Individuals with Low-End, Mid-Range, and High-End Total Dairy Intake, Age <1 Year (g/kg/day) . . . . . . . . . . . . . . . . . . . . . . . . . . . . . . . . . . . . . . 67
Table 14F. Per Capita Intake of Total Foods and Major Food Groups and Percent of Total Food Intake for Individuals with Low-End, Mid-Range, and High-End Total Dairy Intake, Age <1 Year (g/day) . . . . . . . . . . . . . . . . . . . . . . . . . . . . . . . . . . . . . . . . 67
Table 14G. Per Capita Intake of Total Foods and Major Food Groups and Percent of Total Food Intake for Individuals with Low-End, Mid-Range, and High-End Total Dairy Intake, Ages 1-2 Years (g/kg/day) . . . . . . . . . . . . . . . . . . . . . . . . . . . . . . . . . . . . 68
xi

LIST OF TABLES (continued)
Table 14H. Per Capita Intake of Total Foods and Major Food Groups and Percent of Total Food Intake for Individuals with Low-End, Mid-Range, and High-End Total Dairy Intake, Ages 1-2 Years (g/day) . . . . . . . . . . . . . . . . . . . . . . . . . . . . . . . . . . . . . . 68
Table 14I. Per Capita Intake of Total Foods and Major Food Groups and Percent of Total Food Intake for Individuals with Low-End, Mid-Range, and High-End Total Dairy Intake, Ages 3-5 Years (g/kg/day) . . . . . . . . . . . . . . . . . . . . . . . . . . . . . . . . . . . 69
Table 14J. Per Capita Intake of Total Foods and Major Food Groups and Percent of Total Food Intake for Individuals with Low-End, Mid-Range, and High-End Total Dairy Intake, Ages 3-5 Years (g/day) . . . . . . . . . . . . . . . . . . . . . . . . . . . . . . . . . . . . . . 69
Table 14K. Per Capita Intake of Total Foods and Major Food Groups and Percent of Total Food Intake for Individuals with Low-End, Mid-Range, and High-end Total Dairy Intake, Ages 6-11 Years (g/kg/day) . . . . . . . . . . . . . . . . . . . . . . . . . . . . . . . . . . 70
Table 14L. Per Capita Intake of Total Foods and Major Food Groups and Percent of Total Food Intake for Individuals with Low-End, Mid-Range, and High-end Total Dairy Intake, Ages 6-11 Years (g/day) . . . . . . . . . . . . . . . . . . . . . . . . . . . . . . . . . . . . . 70
Table 14M. Per Capita Intake of Total Foods and Major Food Groups and Percent of Total Food Intake for Individuals with Low-End, Mid-Range, and High-End Total Dairy Intake, Ages 12-19 Years (g/kg/day) . . . . . . . . . . . . . . . . . . . . . . . . . . . . . . . . . 71
Table 14N. Per Capita Intake of Total Foods and Major Food Groups and Percent of Total Food Intake for Individuals with Low-End, Mid-Range, and High-End Total Dairy Intake, Ages 12-19 Years (g/day) . . . . . . . . . . . . . . . . . . . . . . . . . . . . . . . . . . . . 71
xii

LIST OF FIGURES
Figure 1. Geographic regions as defined by CSFII . . . . . . . . . . . . . . . . . . . . . . . . . . . . . . . 17
xiii

PREFACE
The Exposure Factors Program of the National Center for Environmental Assessment (NCEA) of the U.S. Environmental Protection Agency’s (EPA’s) Office of Research and Development (ORD) has three main goals: (1) provide updates to the Exposure Factors Handbook (U.S. EPA, 1997) and the Child-Specific Exposure Factors Handbook (U.S. EPA, 2002); (2) identify exposure factors data gaps and needs in consultation with clients; and (3) develop companion documents to assist clients in the use of exposure factors data. The activities under each goal are supported by and respond to the needs of the various program offices.
Although the American food supply is generally considered to be one of the safest in the world, contamination of foods may occur through environmental pollution. To assess chemical exposure through this pathway, information on food ingestion rates is needed. For this reason, a thorough analysis of the dietary habits of the American public would aid in the identification of potential exposure pathways. Data on food consumption rates reported in the Exposure Factors Handbook and the Child-Specific Exposure Factors Handbook were collected by the U.S. Department of Agriculture through national surveys. These surveys are conducted periodically. Updating food consumption data in the handbooks is necessary to reflect changes in people’s diets. To that end, EPA developed per capita food intake rates for various food item and food categories using databases developed by the U.S. Department of Agriculture (USDA). These intake rates were published in CSFII Analysis of Food Intake Distributions (U.S. EPA, 2003).
EPA has expanded the analysis of food intake in order to examine the food consumption habits of individuals in greater detail. This report presents the results of an analysis of the total food intake using data from the USDA’s 1994–1996, 1998 Continuing Survey of Food Intakes by Individuals (CSFII) and EPA’s Food Commodity Intake Database (FCID) (U.S. EPA, 2000). This analysis will assist exposure and risk assessors in identifying target populations for intensive study and food-specific exposure pathways for the general population or for individual groups. However, this analysis was conducted before EPA published the guidance document entitled Selecting Age Groups for Monitoring and Assessing Childhood Exposures to Environmental Contaminants (U.S. EPA, 2005). Therefore, the age groups used for children in this analysis are not entirely consistent with the age groups recommended in the 2005 guidance document. Some of the data will be reanalyzed in the future update to the Child-Specific Exposure Factors Handbook to conform with EPA’s recommended age groups for children.
xiv

AUTHORS, CONTRIBUTORS, AND REVIEWERS
The National Center for Environmental Assessment (NCEA) of EPA’s Office of Research and Development was responsible for preparing this report. The report was compiled by the Exposure Assessment Division of Versar, Inc., in Springfield, Virginia, under EPA Contract No. 68-D5-0051. Jacqueline Moya served as the EPA Work Assignment Manager, providing overall direction and technical assistance, as well as Contributing Author.
AUTHOR WORD PROCESSING Versar, Inc Versar, Inc. Christopher Greene Wendy Powell Dr. Linda Phillips
This document was reviewed by an external panel of experts. The panel was composed of the following individuals:
Christine Chaisson CF Chaisson Scientific Advisors, Inc. Annadale, VA 22003
Barbara Peterson Novigen Sciences, Inc. Washington, DC 20036
Barry Ryan Department of Environmental and Occupational Health Rollins School of Public Health Atlanta, Georgia 30322
Nga Tran John Hopkins University Baltimore, MD 21205-2179
ACKNOWLEDGMENT
The project manager would like to acknowledge USDA for providing the data files. The
project manager would also like to acknowledge the contributions of the following individuals:
Terri Konoza of NCEA who managed the document production activities, Patricia von Brook of
KBM Group who provided editing support, and Rita Harding of KBM Group who designed the
front cover.
xv

1. INTRODUCTION
The American food supply is generally considered to be one of the safest in the world.
The U.S. Department of Agriculture has been protecting the nation’s food supply for over a
century through a number of food safety programs that monitor chemical and biological
contaminants and rank the quality of various food items. However, contamination of foods may
occur through environmental pollution of air, water, and soil or through intentional use of
chemicals such as pesticides or other agrochemical products. A thorough analysis of the dietary
habits of the American public would aid in identifying potential exposure pathways. To this end,
the U.S. Environmental Protection Agency (EPA) developed per capita food intake rates for
various food items and food categories using databases developed by the U. S. Department of
Agriculture (USDA). These intake rates were incorporated into EPA’s 1997 Exposure Factors
Handbook (U.S. EPA, 1997). EPA has since recommended that the food intake study be updated
and expanded. Thus, a more comprehensive analysis is presented in this document.
The purpose of this study was to characterize the consumption of food by the people of
the United States. This characterization includes the quantification of (1) total food intake
among various subgroups of the U.S. population, subdivided on the basis of age, race, geographic
region, and urbanization; (2) the consumption of various food categories (e.g., meats, grains, and
vegetables) by different age groups within the U.S. population; and (3) the consumption of
various food categories of individuals exhibiting unusual consumption patterns of one specific
food category, e.g., consumption behavior of individuals above the 90th percentile for meat
consumption.
The results of the analysis, presented in a series of tables, provide a tool for examining
food consumption at a high level of detail. They allow exposure assessors and risk analysts to
identify target populations for intensive study and to identify food-specific exposure pathways for
the general population or for individual groups. Please note that, due to their size, all the tables
mentioned in this report are presented at the end of the text.
1

2. SOURCES OF FOOD CONSUMPTION DATA
2.1. FOOD CONSUMPTION SURVEYS
Food consumption data were acquired from two separate surveys of food intake
conducted by USDA’s Agricultural Research Service (USDA, 2000): the 1994–96 Continuing
Survey of Food Intakes by Individuals (CSFII) and its 1998 Supplemental Children’s Survey.
These two surveys were designed to obtain data from a statistically representative sample of
noninstitutionalized persons living in the United States. Survey participants were selected using
a multistage process described in Attachment 1, Appendix B, Section 3.1.1 which contains
documentation provided with the CSFII databases. The 1998 Supplemental Children’s Survey
was conducted in order to expand the number of children in the database for the purpose of
conducting child- and infant-specific exposure studies. It was carried out using a multistage
process similar to that of the 1994–96 study (see Attachment 1, Appendix B, Section 3.1.1). The
two surveys are hereinafter referred to jointly as CSFII 1994–96, 1998.
Respondents to CSFII 1994–96, 1998 were contacted multiple times to obtain a wide
range of demographic information, including physical (gender, age, weight), economic (income,
household size), cultural (race, ethnicity), and geographical (urban, regional) data. The
respondents were interviewed twice to collect information on food consumption during two
nonconsecutive days. The Day 1 interviews were conducted in person. Day 2 interviews
typically took place 3 to 10 days after Day 1 interviews, but not on the same day of the week.
Five percent of the Day 2 interviews were conducted via telephone; 95% were conducted in
person in a manner similar to the Day 1 interviews. Interview days were chosen in such a way
that, across the sample population, each day of the week was represented in at least 10% of the
interviews. For further discussion on how the survey was conducted, refer to Attachment 1,
Appendix B, Section 3.1.1.
On the first interview day, respondents were asked to recall all food and drink consumed
between midnight and midnight on the previous day. Following the respondent’s initial listing
of food consumption, he or she was asked to add any additional items forgotten during the first
listing and to identify the eating occasion (e.g., lunch, snack, breakfast) and approximate time
associated with each food consumed. Interviewers also asked for details such as brand names of
foods, cooking methods, seasonings added to cooked food, and ingredients included in food
2

mixtures such as salads and casseroles. The quantity of food consumed was estimated by the
survey respondent; interviewers carried measurement guides such as bowls, measuring cups, and
pictures of fish and chicken parts to assist in the estimation.
2.2. SAMPLE WEIGHTS
Each individual in the CSFII 1994–96, 1998 was assigned a personal weighting factor.
These weighting factors vary from person to person due to demographic differences between the
sampled population and the total U.S. population, and serve to compensate for variability in the
survey response rate, the timing of the survey, and other factors inherent in such a large-scale
survey. The weighting factors were calculated in such a way that the sum of weighting factors
for the entire survey population would approximate the population of the United States. Because
the demographic makeup of the population in the original 1994–96 CSFII changed with the
addition of the 1998 data, each individual has a weighting factor for the 1994–96 study alone and
another factor for the combined 1994–96 and 1998 data sets. Similarly, each individual has
different weighting factors for one-day consumption data and two-day average consumption data
because the characteristics of the entire survey population and the portion that completed both
days of the survey are slightly different. Because the present study used only combined two-day
average consumption data from both the original 1994–96 survey and the 1998 children’s
supplement, the weighting factor for the two-day average using the combined 1994–96 and 1998
data sets was used in this study.
Annual person-level data sets for each of the four years of the study (1994, 1995, 1996,
and 1998) were assigned sample weights as follows. Each individual in the sample was assigned
a “base weight equal to the reciprocal of the probability of selection.” Individuals were selected
for participation in the survey through a multi-stage process involving the selection of a “primary
sampling unit” (PSU), a population segment within any given PSU, an individual household
within a segment, and an individual within a household. Each of these stages has a probability of
selection that may be calculated from the known number of units available and the number
selected; the product of these four probabilities equals the probability of selection for an
individual and was used to calculate each individual’s base weight. Following this, base weights
were adjusted to account for the non-response rate; for this step, respondents were classified into
groups based on characteristics that were determined to be positively correlated with the response
3

rate. In the final step, the sample weights were adjusted based on U.S. Census Bureau population
estimates for March of the year being assessed, using a process known as “ranking ration
weighting.” In this process, individual sample weights were adjusted in such a manner that the
sum of all weights for certain demographic groups, e.g., males, females, persons in specific age
categories, urbanization, employment status, etc., would equal the total United States population
estimate for that demographic group. By statistically compensating for anomalies in sampling,
this multi-step process of determining sample weights served to make the survey population as
representative of the overall United States population as possible. For further discussion of the
sample weighting process, the reader is referred to Appendix C of the CSFII 1994–96, 1998
documentation (USDA, 2000).
Each individual’s weighting factor was used in calculating percentile values of food
consumption for the various demographic cohorts that were analyzed in the study. Conceptually,
the calculation of percentiles was analogous to sorting the individuals in ascending order on the
basis of consumption of food and, knowing the total number of individuals, identifying the
desired percentile values by counting the appropriate distance down the sorted list. However, in
order to account for differences in sample weight from one individual to the next, the conceptual
“sorted list” was modified so that each individual had a number of entries on the list that
corresponded to his or her weighting factor. Thus, the sorted list may have 1,000 entries for one
individual and 2,000 for another, based on their weighting factors. In this way, each individual
would tend to “stretch” the histogram of food consumption values to a degree proportional to his
or her weighting factor, and the percentiles would reflect that stretching. A simplified example
of how this process works is shown in Table 1. The two sorted lists—one weighted and one
unweighted—show the 50th percentile value, which by definition lies at the midpoint of each
sorted list. The unweighted and weighted lists result in different values for the 50th percentile
because, as shown in the example, the weighting factors happen to favor the individuals with
lower consumption. In the actual data set used in this study, the same process, occurring for
much larger population sizes, was used to increase or decrease the relative significance of each
individual’s contribution in order to more accurately represent the entire U.S. population.
4

Table 1. Hypothetical Example of the Effect of Weighting Factors
Individual Consumption g/day
Weighting Factors
50th percentile unweighted
g/day
50th percentile weighted
g/day
A B C D E F G
90 80 30 20 70 60 50
1 1 3 3 1 2 2
D 20 C 30 G 50
F 60 ² 50th percentile E 70 B 80 A 90
D 20 D 20 D 20 C 30 C 30 C 30
G 50 ² 50th percentile G 50 F 60 F 60 E 70 B 80 A 90
2.3. CONVERSION OF USDA FOOD CODES TO EPA COMMODITY CODES
Intakes of food expressed in CSFII 1994–96, 1998 were converted to EPA food
commodity codes using data provided in EPA’s Food Commodity Intake Database (FCID) (U.S.
EPA, 2000). The FCID contains a “translation file” that broke down the USDA food codes used
in the CSFII into the EPA commodity codes listed in Table 2. A single food item in CSFII may
be associated with several EPA commodity codes. The method used to translate USDA food
codes into EPA commodity codes is discussed in detail in the documentation included in CSFII
1994-96, 1998 (Attachment 1). The EPA commodity codes used in this study are documented in
EPA’s Food Commodity Vocabulary (Attachment 2).
2.4. IDENTIFICATION OF FOOD CATEGORIES
The 548 EPA commodity codes were assigned to 10 food categories for use in the
analysis, and “other” category that was not included in the analysis (Table 2). The categories are
Dairy, Meat, Eggs, Fish, Grain, Vegetables, Fruits, Fats, Soy Products, and Nuts. Water, coffee,
tea, sugar, vinegar, and a few other foods that were not appropriate for any other category were
5

Table 2. EPA Commodity Codes, by Food Category
Meats Grains 21000470 Beef, fat 21000471 Beef,fat- babyfood 23001710 Goat, fat 25002930 Pork, fat 25002931 Pork, fat- babyfood 26003410 Sheep, fat 26003411 Sheep, fat- babyfood 40000960 Chicken, fat 40000961 Chicken, fat- babyfood 50003850 Turkey, fat 50003851 Turkey, fat- babyfood 60003040 Poultry, other, fat 21000440 Beef, meat 21000441 Beef, meat- babyfood 21000450 Beef, meat, dried 21000460 Beef, meat byproducts 21000461 Beef, meat byproducts- babyfood 21000480 Beef, kidney 21000490 Beef, liver 21000491 Beef, liver- babyfood 23001690 Goat, meat 23001700 Goat, meat byproducts 23001720 Goat, kidney 23001730 Goat, liver 24001890 Horse, meat 25002900 Pork, meat 25002901 Pork, meat- babyfood 25002910 Pork, skin 25002920 Pork, meat byproducts 25002921 Pork, meat byproducts- babyfood 25002940 Pork, kidney 25002950 Pork, liver 26003390 Sheep, meat 26003391 Sheep, meat- babyfood 26003400 Sheep, meat byproducts 26003420 Sheep, kidney 26003430 Sheep, liver 28002210 Meat, game 29003120 Rabbit, meat 40000930 Chicken, meat 40000931 Chicken, meat- babyfood 40000940 Chicken, liver 40000950 Chicken, meat byproducts 40000951 Chicken, meat byproducts- babyfood 40000970 Chicken, skin 40000971 Chicken, skin- babyfood 50003820 Turkey, meat 50003821 Turkey, meat- babyfood 50003830 Turkey, liver 50003831 Turkey, liver- babyfood 50003840 Turkey, meat byproducts 50003841 Turkey, meat byproducts- babyfood 50003860 Turkey, skin 50003861 Turkey, skin - babyfood 60003010 Poultry, other, meat 60003020 Poultry, other, liver 60003030 Poultry, other, meat byproducts 60003050 Poultry, other, skin
15000250 Barley, pearled barley 15000251 Barley, pearled barley - babyfood 15000260 Barley, flour 15000261 Barley, flour- babyfood 15000270 Barley, bran 15000650 Buckwheat 15000660 Buckwheat, flour 15001200 Corn, field, flour 15001201 Corn, field, flour- babyfood 15001210 Corn, field, meal 15001211 Corn, field, meal- babyfood 15001220 Corn, field, bran 15002260 Millet, grain 15002310 Oat, bran 15002320 Oat, flour 15002321 Oat, flour- babyfood 15002330 Oat, groats/rolled oats 15002331 Oat, groats/rolled oats- babyfood 15003230 Rice, white 15003231 Rice, white- babyfood 15003240 Rice, brown 15003241 Rice, brown- babyfood 15003250 Rice, flour 15003251 Rice, flour- babyfood 15003260 Rice, bran 15003261 Rice, bran- babyfood 15003280 Rye, grain 15003290 Rye, flour 15003440 Sorghum, grain 15003810 Triticale, flour 15003811 Triticale, flour- babyfood 15004010 Wheat, grain 15004011 Wheat, grain - babyfood 15004020 Wheat, flour 15004021 Wheat, flour- babyfood 15004030 Wheat, germ 15004040 Wheat, bran 15004050 Wild rice 18000020 Alfalfa, seed 95000060 Amaranth, grain 95003110 Quinoa, grain 1012980 Potato, flour 1012981 Potato, flour - babyfood
Dairy Products 27002221 Milk, fat - baby food/infant formula 27012230 Milk, nonfat solids 27012231 Milk, nonfat solids- baby food/infant formula 27022240 Milk, water 27022241 Milk, water- babyfood/infant formula 27032251 Milk, sugar (lactose)- baby food/infant formula
Eggs 70001450 Egg, whole 70001451 Egg, whole - babyfood 70001460 Egg, white 70001461 Egg, white (solids)- babyfood 70001470 Egg, yolk 70001471 Egg, yolk- babyfood
6

Table 2. EPA Commodity Codes, by Food Category(Continued)
Vegetables Vegetables (continued) 95000200 Avocado 1010500 Beet, garden, roots 1010501 Beet, garden, roots- babyfood 1010520 Beet, sugar 1010521 Beet, sugar- babyfood 1010530 Beet, sugar, molasses 1010531 Beet, sugar, molasses - babyfood 1010670 Burdock 1010780 Carrot 1010781 Carrot- babyfood 1010790 Carrot, juice 1010840 Celeriac 1011000 Chicory, roots 1011900 Horseradish 1012500 Parsley, turnip rooted 1012510 Parsnip 1012511 Parsnip - babyfood 1012960 Potato, chips 1012970 Potato, dry (granules/ flakes) 1012971 Potato, dry (granules/ flakes)- babyfood 1012990 Potato, tuber, w/peel 1012991 Potato, tuber, w/peel- babyfood 1013000 Potato, tuber, w/o peel 1013001 Potato, tuber, w/o peel- babyfood 1013140 Radish, roots 1013160 Radish, Oriental, roots 1013270 Rutabaga 1013310 Salsify, roots 1013710 Tanier, corm 1013880 Turnip, roots 1030150 Arrowroot, flour 1030151 Arrowroot, flour- babyfood 1030170 Artichoke, Jerusalem 1030820 Cassava 1030821 Cassava- babyfood 1031390 Dasheen, corm 1031660 Ginger 1031661 Ginger - babyfood 1031670 Ginger, dried 1031680 Ginseng, dried 1033660 Sweet potato 1033661 Sweet potato- babyfood 1034060 Yam, true 1034070 Yam bean 2000510 Beet, garden, tops 2001010 Chicory, tops 2001400 Dasheen, leaves 2003150 Radish, tops 2003170 Radish, Oriental, tops 2003320 Salsify, tops 2003890 Turnip, tops 3001640 Garlic 3001650 Garlic, dried
6020330 Bean, cowpea, succulent 6020370 Bean, lima, succulent 6022550 Pea, succulent 6022551 Pea, succulent- babyfood 6022590 Pea, pigeon, succulent 6030300 Bean, black, seed 6030320 Bean, broad, seed 6030340 Bean, cowpea, seed 6030350 Bean, great northern, seed 6030360 Bean, kidney, seed 6030380 Bean, lima, seed 6030390 Bean, mung, seed 6030400 Bean, navy, seed 6030410 Bean, pink, seed 6030420 Bean, pinto, seed 6030980 Chickpea, seed 6030981 Chickpea, seed - babyfood 6030990 Chickpea, flour 6031820 Guar, seed 6031821 Guar, seed - babyfood 6032030 Lentil 6032560 Pea, dry 6032561 Pea, dry- babyfood 6032580 Pea, pigeon, seed 8001480 Eggplant 8002700 Pepper, bell 8002701 Pepper, bell- babyfood 8002710 Pepper, bell, dried 8002711 Pepper, bell, dried- babyfood 8002720 Pepper, non-bell 8002721 Pepper, non-bell, - babyfood 8002730 Pepper, non-bell, dried 8003740 Tomatillo 8003750 Tomato 8003751 Tomato- babyfood 8003760 Tomato, paste 8003761 Tomato, paste- babyfood 8003770 Tomato, puree 8003771 Tomato, puree- babyfood 8003780 Tomato, dried 8003781 Tomato, dried - babyfood 8003790 Tomato, juice 9021350 Cucumber 9023080 Pumpkin 9023090 Pumpkin, seed 9023560 Squash, summer 9023561 Squash, summer- babyfood 9023570 Squash, winter 9023571 Squash, winter- babyfood
15001230 Corn, field, starch 15001231 Corn, field, starch- babyfood 15001240 Corn, field, syrup 15001241 Corn, field, syrup- babyfood
7

Table 2. EPA Commodity Codes, by Food Category(Continued)
Vegetables (continued) Vegetables (continued) 3001651 Garlic, dried- babyfood 3001980 Leek 3002370 Onion, dry bulb 3002371 Onion, dry bulb- babyfood 3002380 Onion, dry bulb, dried 3002381 Onion, dry bulb, dried- babyfood 3002390 Onion, green 3003380 Shallot 4010050 Amaranth, leafy 4010180 Arugula 4011040 Chrysanthemum, garland 4011330 Cress, garden 4011340 Cress, upland 4011380 Dandelion, leaves 4011500 Endive 4012040 Lettuce, head 4012050 Lettuce, leaf 4012480 Parsley, leaves 4013130 Radicchio 4013550 Spinach 4013551 Spinach- babyfood 4020760 Cardoon 4020850 Celery 4020851 Celery- babyfood 4020860 Celery, juice 4020870 Celtuce 4021520 Fennel, Florence 4023220 Rhubarb 4023670 Swiss chard 5010610 Broccoli 5010611 Broccoli- babyfood 5010620 Broccoli, Chinese 5010640 Brussels sprouts 5010690 Cabbage 5010710 Cabbage, Chinese, napa 5010720 Cabbage, Chinese, mustard 5010830 Cauliflower 5011960 Kohlrabi 5020630 Broccoli raab 5020700 Cabbage, Chinese, bok choy 5021170 Collards 5021940 Kale 5022290 Mustard greens 5023180 Rape greens 6003470 Soybean, seed 6003480 Soybean, flour 6003481 Soybean, flour- babyfood 6003490 Soybean, soy milk 6003491 Soybean, soy milk- babyfood or infant formula 6010430 Bean, snap, succulent 6010431 Bean, snap, succulent- babyfood 6012570 Pea, edible podded 6020310 Bean, broad, succulent
15001260 Corn, pop 15001270 Corn, sweet 15001271 Corn, sweet- babyfood 15003450 Sorghum, syrup 19010280 Basil, fresh leaves 19010281 Basil, fresh leaves - babyfood 19010290 Basil, dried leaves 19010291 Basil, dried leaves- babyfood 19011030 Chive 19011440 Dill 19011840 Herbs, other 19011841 Herbs, other- babyfood 19012020 Lemongrass 19012200 Marjoram 19012201 Marjoram - babyfood 19012490 Parsley, dried leaves 19012491 Parsley, dried leaves - babyfood 19013340 Savory 19021050 Cinnamon 19021051 Cinnamon- babyfood 19021180 Coriander, leaves 19021181 Coriander, leaves - babyfood 19021190 Coriander, seed 19021191 Coriander, seed - babyfood 19021430 Dill, seed 19022740 Pepper, black and white 19022741 Pepper, black and white- babyfood 19023540 Spices, other 19023541 Spices, other- babyfood 19023870 Turmeric 95000160 Artichoke, globe 95000190 Asparagus 95000220 Bamboo, shoots 95001110 Coconut, meat 95001111 Coconut- meat, babyfood 95001120 Coconut, dried 95001130 Coconut, milk 95002270 Mulberry 95002280 Mushroom 95002340 Okra 95002430 Palm heart, leaves 95002750 Peppermint 95003060 Psyllium, seed 95003350 Seaweed 95003351 Seaweed - babyfood 95003360 Sesame, seed 95003361 Sesame, seed- babyfood 95003520 Spearmint 95003640 Sunflower, seed 95003800 Tomato, Tree 95003970 Water chestnut 95003980 Watercress
8

Table 2. EPA Commodity Codes, by Food Category(Continued)
Fats Fish 6003500 Soybean, oil 6003501 Soybean, oil- babyfood
10001080 Citrus, oil 14000040 Almond, oil 14000041 Almond, oil- babyfood 14001560 Filbert, oil 15001250 Corn, field, oil 15001251 Corn, field, oil- babyfood 21000470 Beef, fat 21000471 Beef,fat- babyfood 23001710 Goat, fat 25002930 Pork, fat 25002931 Pork, fat- babyfood 26003410 Sheep, fat 26003411 Sheep, fat- babyfood 27002220 Milk, fat 40000960 Chicken, fat 40000961 Chicken, fat- babyfood 50003850 Turkey, fat 50003851 Turkey, fat- babyfood 60003040 Poultry, other, fat 95001140 Coconut, oil 95001141 Coconut, oil- babyfood 95001280 Cottonseed, oil 95001281 Cottonseed, oil - babyfood 95001630 Flaxseed, oil 95002360 Olive, oil 95002440 Palm, oil 95002441 Palm, oil - babyfood 95002650 Peanut, oil 95002760 Peppermint, oil 95003190 Rapeseed, oil 95003191 Rapeseed, oil - babyfood 95003300 Safflower, oil 95003301 Safflower, oil - babyfood 95003370 Sesame, oil 95003371 Sesame, oil- babyfood 95003530 Spearmint, oil 95003650 Sunflower, oil 95003651 Sunflower, oil - babyfood
80001570 Fish- freshwater finfish 80001580 Fish- freshwater finfish, farm raised 80001590 Fish- saltwater finfish, tuna 80001600 Fish- saltwater finfish, other 80001610 Fish- shellfish, crustacean 80001620 Fish- shellfish, mollusc
Nuts 14000030 Almond 14000031 Almond- babyfood 14000590 Brazil nut 14000680 Butternut 14000810 Cashew 14000920 Chestnut 14001550 Filbert 14001850 Hickory nut 14002130 Macadamia nut 14002690 Pecan 14002820 Pistachio 14003910 Walnut 95002630 Peanut 95002640 Peanut, butter 95002780 Pine nut
Other/Not Classified
Soy Products
86003920 Water, dilution, source NS 86003930 Water, tapwater- direct (drinking) 86003940 Water- indirect (cooking) 86003950 Water, bottled water 86003960 Water, commercial beverage 95000770 Carob 95001090 Cocoa bean, chocolate 95001100 Cocoa bean, powder 95001150 Coffee, roasted bean 95001160 Coffee, instant 95001860 Honey 95001861 Honey- babyfood 95001880 Hop 95002180 Maple, sugar 95002190 Maple syrup 95003620 Sugarcane, sugar 95003621 Sugarcane, sugar- babyfood 95003630 Sugarcane, molasses 95003631 Sugarcane, molasses - babyfood 95003720 Tea, dried 95003730 Tea, instant 95003900 Vinegar
6003500 Soybean, oil 6003501 Soybean, oil- babyfood 6003470 Soybean, seed
9

Table 2. EPA Commodity Codes, by Food Category(Continued)
Fruits Fruits (continued) 9010750 Cantaloupe 9010800 Casaba 9011870 Honeydew melon 9013990 Watermelon 9014000 Watermelon, juice 9020210 Balsam pear 9020880 Chayote, fruit 9021020 Chinese waxgourd
10001060 Citrus citron 10001070 Citrus hybrids 10001800 Grapefruit 10001810 Grapefruit, juice 10001970 Kumquat 10001990 Lemon 10002000 Lemon, juice 10002001 Lemon, juice- babyfood 10002010 Lemon, peel 10002060 Lime 10002070 Lime, juice 10002071 Lime, juice- babyfood 10002400 Orange 10002410 Orange, juice 10002411 Orange, juice- babyfood 10002420 Orange, peel 10003070 Pummelo 10003690 Tangerine 10003700 Tangerine, juice 11000070 Apple, fruit with peel 11000080 Apple, peeled fruit 11000081 Apple, peeled fruit- babyfood 11000090 Apple, dried 11000091 Apple, dried - babyfood 11000100 Apple, juice 11000101 Apple, juice - babyfood 11000110 Apple, sauce 11000111 Apple, sauce - babyfood 11001290 Crabapple 11002100 Loquat 11003100 Quince
13021360 Currant 13021370 Currant, dried 13021490 Elderberry 13021740 Gooseberry 13021910 Huckleberry 14013200 Raspberry 14013201 Raspberry- babyfood 14013210 Raspberry, juice 14013211 Raspberry, juice - babyfood 95000010 Acerola 95000230 Banana 95000231 Banana- babyfood 95000240 Banana, dried 95000241 Banana, dried- babyfood 95000540 Belgium endive 95000600 Breadfruit 95000730 Cactus 95000740 Canistel 95000890 Cherimoya 95001300 Cranberry 95001301 Cranberry- babyfood 95001310 Cranberry, dried 95001320 Cranberry, juice 95001321 Cranberry, juice- babyfood 95001410 Date 95001510 Feijoa 95001530 Fig 95001540 Fig, dried 95001750 Grape 95001760 Grape, juice 95001761 Grape, juice- babyfood 95001770 Grape, leaves 95001780 Grape, raisin 95001790 Grape, wine and sherry 95001830 Guava 95001831 Guava- babyfood 95001920 Jaboticaba 95001930 Jackfruit 95001950 Kiwifruit
10

Table 2. EPA Commodity Codes, by Food Category(Continued)
Fruits (continued) Fruits (continued) 12000120 Apricot 12000121 Apricot- babyfood 12000130 Apricot, dried 12000140 Apricot, juice 12000141 Apricot, juice- babyfood 12000900 Cherry 12000901 Cherry- babyfood 12000910 Cherry, juice 12000911 Cherry, juice- babyfood 12002300 Nectarine 12002600 Peach 12002601 Peach- babyfood 12002610 Peach, dried 12002611 Peach, dried- babyfood 12002620 Peach, juice 12002621 Peach, juice- babyfood 12002660 Pear 12002661 Pear- babyfood 12002670 Pear, dried 12002680 Pear, juice 12002681 Pear, juice- babyfood 12002850 Plum 12002851 Plum- babyfood 12002860 Plum, prune, fresh 12002861 Plum, prune, fresh- babyfood 12002870 Plum, prune, dried 12002871 Plum, prune, dried- babyfood 12002880 Plum, prune, juice 12002881 Plum, prune, juice- babyfood 13010550 Blackberry 13010560 Blackberry, juice 13010561 Blackberry, juice - babyfood 13010580 Boysenberry 13011420 Dewberry 13012080 Loganberry 13020570 Blueberry 13020571 Blueberry- babyfood
95002090 Longan 95002110 Lychee 95002120 Lychee, dried 95002140 Mamey apple 95002150 Mango 95002151 Mango- babyfood 95002160 Mango, dried 95002170 Mango, juice 95002171 Mango, juice - babyfood 95002350 Olive 95002450 Papaya 95002451 Papaya- babyfood 95002460 Papaya, dried 95002470 Papaya, juice 95002520 Passionfruit 95002521 Passionfruit- babyfood 95002530 Passionfruit, juice 95002531 Passionfruit, juice- babyfood 95002540 Pawpaw 95002770 Persimmon 95002790 Pineapple 95002791 Pineapple- babyfood 95002800 Pineapple, dried 95002810 Pineapple, juice 95002811 Pineapple, juice- babyfood 95002830 Plantain 95002840 Plantain, dried 95002890 Pomegranate 95003330 Sapote, Mamey 95003460 Soursop 95003510 Spanish lime 95003580 Starfruit 95003590 Strawberry 95003591 Strawberry- babyfood 95003600 Strawberry, juice 95003601 Strawberry, juice - babyfood 95003610 Sugar apple 95003680 Tamarind
11

not included in the analysis. Some EPA commodity codes are listed under more than one food
category. For example, the code for beef fat, which represents only the nutrient fat from beef, is
included in the Fats category as well as the Meats category because the nutrient fat in beef would
be a part of any prepared food product containing beef. Soybean oil appears in the Fats category
as well as in the Soy Products category. For this reason, in the results tables, the intakes for each
individual food category do not necessarily add up to the figure given for total food intake.
Some food products were classified on the basis of their pattern of use in the human diet
rather than on a strict horticultural definition. For example, tomatoes and avocados meet the
biological definition of a fruit, but were classified as vegetables, based on their customary use.
3. DATA ANALYSIS
3.1. PREPARATION OF DATA
CSFII 1994–96, 1998 contains 3,173,197 records of food consumption for 21,662
individuals. This database was subjected to a series of filters to produce an operating data set for
use in calculating food consumption.
The full database contains three types of food consumption data: Day 1 consumption, Day
2 consumption, and average consumption (the arithmetic mean consumption for days 1 and 2.) If
an individual completed the food consumption survey for both days, an average consumption was
calculated for each food item consumed by each individual, whether the item was consumed on
Day 1, Day 2, or both days. An average was not calculated if the individual completed the food
consumption survey for only one day. The consumption of any given food code by any given
survey respondent may therefore appear in one, two, or three records in the database. For
example, if an individual ate a food item on one day of the survey and did not complete the
survey for the second day, only one record was added to the database. If an individual ate a food
item on only one of the two days and completed the survey for both days, the consumption
appears as a Day 1 or Day 2 consumption and as an average consumption. If an individual ate a
food item on both days, the consumption appears as one Day 1 consumption, one Day 2
consumption, and one average consumption. An example based on two individuals from the
database is provided in Table 3.
12

Table 3. Listing of Food Consumption Events in Database
Person’s ID
code
Day Code:
1=day 1
2=day 2
4=2-day avg.
EPA
commodity
code consumed
Amount
Consumed
g/day Comments
Indi
vidu
al th
at c
ompl
eted
both
day
s of s
urve
y
1000101 1 1010520 0.505403 Food was consumed on both
days; two daily records and an
average are recorded
1000101 2 1010520 0.240405
1000101 4 1010520 0.372904
1000101 2 1031660 0.106792 Food was consumed on day 2
only; one daily record and an
average are recorded1000101 4 1031660 0.053396
1000101 2 1031670 0.00032 Food was consumed on day 2
only; one daily record and an
average are recorded1000101 4 1031670 0.00016
1000101 1 3001640 0.008441 Food was consumed on both
days; two daily records and an
average are recorded
1000101 2 3001640 0.083154
1000101 4 3001640 0.045797 1000101 1 3001650 0.004568 Food was consumed on day 1
only; one daily record and an
average are recorded 1000101 4 3001650 0.002284
1000101 1 3002370 0.429241 Food was consumed on both
days; two daily records and an
average are recorded 1000101 2 3002370 0.120856
1000101 4 3002370 0.275048
Indi
vidu
al th
at c
ompl
eted
day
1 on
ly
1010801 1 1010520 0.047479 Only one day of data; no Day
2 or Average recorded
1010801 1 1010780 0.144031 Only one day of data; no Day
2 or Average recorded
1010801 1 1012980 0.071958
Only one day of data; no Day
2 or Average recorded
13

The first person listed in Table 3 (ID code 1000101) completed surveys for both days, so
EPA commodity codes are listed for the day the food was consumed and are listed as a two-day
average (even if the commodity was consumed on only one of the two days). The second person
in Table 3 (ID code 1010801) only completed the survey for Day 1, so all the commodities
consumed are listed only as Day 1 records.
In this analysis, only two-day average consumption records were used. This was done
because the sample person weighting factors for each survey respondent were different for Day 1
consumption, Day 2 consumption, and average consumption. Because average consumption
represented a larger data set for each survey respondent, it was used in the analysis. By removing
all the Day 1 and Day 2 records, the 3,173,197 records in the CSFII were reduced to 1,286,953
two-day average consumption records. Note that in the example above, the second individual in
Table 3 (ID Code 1010801) would be removed from the analysis because no Day 2 data were
available.
The decision to use only complete, two-day records for the analysis resulted in the
removal from the database of 1,055 persons who completed only the first day of the food
consumption survey. In addition, 808 persons were flagged for removal from the study because
they did not provide a body weight on their survey form. Without a body weight, the weight-
normalized intake values in this study cannot be calculated. Fifty-one of the individuals in the
survey had both an invalid body weight and only one day of food consumption data. Therefore,
these two selection criteria reduced the number of persons in the database by 1,812, leaving an
operating survey population of 19,850 individuals who submitted complete intake data for both
days and provided a valid body weight. This population of 19,850 was the starting point for all
demographic cohorts discussed in this study and presented in the data tables.
When the database of 1,286,953 two-day average consumption records was filtered to
include only the 19,850 individuals in the demographic database, 45,772 records were removed,
leaving 1,241,181 consumption records in the consumption database. These records contain
consumption data for 19,731 individuals.
The remaining 119 individuals in the total cohort of 19,850 were valid persons (in the
sense that they provided a body weight and completed the survey for both days), but they do not
appear in the consumption database because they did not consume any food items that have valid
EPA commodity codes. This is not an error, but rather a reflection of a population segment that
14

consumed only human milk during the survey period. All 119 individuals were 7 months old or
younger, and 107 were 4 months old or younger. All 119 had a data element in their survey
indicating that they were breastfeeding. Because the EPA commodity code list did not include
human milk, these individuals have no entries in the food consumption database. At the other
end of the spectrum, there were several individuals in CSFII 1994-96, 1998 whose food
consumption data were unusually high. The highest reported food consumption was 8,840 g/day
from a 19-year-old white male from the rural Midwest. The 99th percentile of total food
consumption among the entire survey population was 2,650 grams.
Because challenging or verifying reported food consumption in CSFII 1994-96, 1998 was
beyond the scope of this project, data were assumed to be correct as presented in the CSFII, even
in the case of these extremely high food consumption rates.
3.2. IDENTIFICATION OF DEMOGRAPHIC COHORTS
The 19,850 individuals in the working database were divided into cohorts on the basis of
four demographic characteristics included in the surveys completed by the study participants
(Table 4). Individuals were grouped on the basis of age, race, urbanization, and geographic
region. Except in the case of age, the level of detail in identifying the demographic categories
was determined by the constraints of the source data and is the same as in CSFII 1994-96, 1998.
Age. The selection of age categories was based on previous food consumption studies.
For the calculation of total food intake, there were eight age categories: less than 1 year, 1–2
years, 3–5 years, 6–11 years, 12–19 years, 20–39 years, 40–69 years, and greater than 70 years.
For the analysis of low-end, mid-range, and high-end consumers, the oldest three categories were
combined into a single category containing all individuals aged 20 years or older.
Race. Survey respondents were asked to indicate their race from a list of five choices:
White, Black, Asian/Pacific Islander, American Indian, or Other.
Urbanization. Survey respondents were asked to indicate whether they lived in the
central part of a Metropolitan Statistical Area (MSA), the outer portions of an MSA, or not in any
MSA. These designations are listed in the study results as Central City, Suburban, and
Nonmetropolitan, respectively
Geographic region. Survey respondents were asked to identify their geographic region
(Northeast, Midwest, South, or West, as defined in Figure 1).
15

Table 4. Definition and Size of Demographic Cohorts
Age Tables
1A & 1B All Other Tables
<1 yr 1422 1422 1-2 yr 1996 1996 3-5 yr 4112 4112
6-11 yr 1786 1786 12-19 yr 1373 1373 20-39 yr 2950
9161*40-69 yr 4818 70+ yr 1393
Race n
White 15130 Black 2615
Asian/Pacific 522 American Indian 149
Other 1434
Geographic Region n
Northeast 3563 Midwest 4722
South 7037 West 4528
Urbanization n
MSA†, city 5879 MSA†, outside city 9348
Non-MSA† 4623
* For tables 2A-2M…8A-8N, all persons aged 20 years and older were combined into a single category.
†MSA - Metropolitan Statistical Area.
16

Figure 1. Geographic regions as defined in CSFII.
3.3. USE OF WEIGHTING FACTORS
Weighting factors (see Section 2.2) for the two-day average consumption values were
provided in CSFII 1994–96, 1998. These weighting factors are based on a population of 20,607
individuals who provided two days of food consumption data. This number of individuals is
slightly higher than the 19,850 used in the present study because 757 individuals with two days
of consumption data were removed from the present study because they did not provide a body
weight (see Preparation of Data, Section 3.1). The effect of this discrepancy was expected to be
minor relative to the other variables in the study, such as estimation of an individual’s portion
size based on a survey and conversion of food items to individual commodities.
17

4. RESULTS
4.1. TOTAL DIETARY INTAKE: WHOLE POPULATION AND POPULATION
SUBGROUPS
Total dietary intake was calculated for the whole population and for each of the
demographic categories. For the purposes of this study, total dietary intake is defined as
consumption of food that corresponds to any of the EPA commodity codes in Table 2, except
those listed as “other/not classified.” Percent consuming, mean, standard error, and a range of
percentile values were calculated for each demographic group. The calculations were performed
on the basis of grams of food per kilogram of body weight per day (Table 5A) and on the basis
of grams per day (Table 5B.)
4.2. INTAKE OF INDIVIDUAL FOOD GROUPS, CATEGORIZED BY AGE
Total intake of each of the 10 food categories listed in Table 1 and total dietary intake
were calculated for the whole population and for five age categories: 0–1 years, 1–2 years, 3–5
years, 6–11 years, and 12–19 years, and 20 years old and above. Percent consuming, mean,
standard error, and a range of percentile values were calculated for each food type. Table
numbers for each age group and type of intake are presented in Table 6. Tables 7A through 7N
present the results. For each age category, two tables are presented: one with intakes on the
basis of grams of food per kilogram of body weight per day, and one with intakes on the basis of
grams per day.
4.3. IDENTIFICATION OF HIGH-END, MID-RANGE, AND LOW-END DECILES OF
FOOD INTAKE
In order to compare patterns of food intake among groups with unusually high or low
rates of intake of certain foods, subgroups were isolated from the total survey population of
19,850 individuals. The bottom, middle, and upper deciles of consumption were identified for
six decile target foods: total foods, meats, meat and dairy, fish, fruits and vegetables, and dairy.
The calculation of food intake by age group for each of the 10 food categories was repeated for
each decile.
18

19
Table 5A. Per Capita Total Dietary Intake (g/kg/day)
Population Group
Population Sample Size
Percent Consuming Mean Standard
Error 0th 5th 10th 25th 50th 75th 90th 95th 99th 100th
Whole Population
Age (years) Age < 1 Age 1-2 Age 3-5 Age 6-11 Age 12-19 Age 20-39 Age 40-69 Age 70+
Urbanization Central City Suburban Nonmetropolitan
Race White Black Asian Native American Other/NA
Region Northeast Midwest South West
19850
1422 1996 4112 1786 1373 2950 4818 1393
5879 9348 4623
15130 2615 522 149
1434
3563 4722 7037 4528
99.4%
91.6% 100.0% 100.0% 100.0% 100.0% 100.0% 100.0% 100.0%
99.5% 99.3% 99.5%
99.4% 99.7% 99.0% 99.3% 99.3%
99.5% 99.6% 99.6% 98.9%
2.2E+01
3.9E+01 8.2E+01 6.1E+01 3.8E+01 2.1E+01 1.6E+01 1.4E+01 1.5E+01
2.2E+01 2.3E+01 2.1E+01
2.2E+01 2.1E+01 2.5E+01 2.4E+01 2.7E+01
2.3E+01 2.3E+01 2.1E+01 2.3E+01
3.10E+01
3.27E+01 3.42E+01 2.39E+01 1.72E+01 1.05E+01 7.31E+00 6.45E+00 6.36E+00
3.10E+01 3.15E+01 2.95E+01
3.06E+01 3.03E+01 3.00E+01 3.76E+01 3.40E+01
3.19E+01 3.15E+01 3.03E+01 3.05E+01
0.00E+00
0.00E+00 5.32E+00 1.12E+01 5.96E+00 2.55E+00 1.25E+00 8.70E-01 2.09E+00
0.00E+00 0.00E+00 0.00E+00
0.00E+00 0.00E+00 0.00E+00 0.00E+00 0.00E+00
0.00E+00 0.00E+00 0.00E+00 0.00E+00
6.45E+00
0.00E+00 3.51E+01 2.98E+01 1.56E+01 7.14E+00 6.06E+00 6.01E+00 6.24E+00
6.44E+00 6.74E+00 6.15E+00
6.71E+00 5.33E+00 9.30E+00 6.31E+00 6.45E+00
7.11E+00 6.68E+00 6.00E+00 6.62E+00
8.14E+00
1.32E+00 4.15E+01 3.41E+01 1.91E+01 9.22E+00 7.79E+00 7.23E+00 7.70E+00
8.03E+00 8.44E+00 7.75E+00
8.39E+00 6.61E+00 1.11E+01 6.79E+00 8.39E+00
8.75E+00 8.45E+00 7.35E+00 8.71E+00
1.14E+01
1.87E+01 5.85E+01 4.37E+01 2.63E+01 1.31E+01 1.07E+01 9.92E+00 1.04E+01
1.14E+01 1.16E+01 1.06E+01
1.15E+01 9.47E+00 1.51E+01 1.02E+01 1.25E+01
1.20E+01 1.18E+01 1.04E+01 1.24E+01
1.62E+01
3.22E+01 7.75E+01 5.72E+01 3.55E+01 1.87E+01 1.46E+01 1.35E+01 1.41E+01
1.65E+01 1.67E+01 1.50E+01
1.61E+01 1.46E+01 2.07E+01 1.50E+01 1.94E+01
1.67E+01 1.68E+01 1.47E+01 1.77E+01
2.45E+01
5.04E+01 1.01E+02 7.34E+01 4.71E+01 2.61E+01 1.98E+01 1.79E+01 1.86E+01
2.49E+01 2.52E+01 2.24E+01
2.40E+01 2.49E+01 2.85E+01 2.99E+01 3.21E+01
2.55E+01 2.49E+01 2.22E+01 2.65E+01
4.36E+01
7.41E+01 1.25E+02 9.10E+01 5.95E+01 3.43E+01 2.53E+01 2.27E+01 2.35E+01
4.35E+01 4.52E+01 3.94E+01
4.20E+01 4.54E+01 4.42E+01 4.82E+01 6.07E+01
4.47E+01 4.57E+01 4.03E+01 4.48E+01
6.20E+01
1.01E+02 1.44E+02 1.02E+02 6.78E+01 4.08E+01 2.99E+01 2.60E+01 2.66E+01
6.21E+01 6.35E+01 5.76E+01
6.02E+01 6.29E+01 6.10E+01 7.36E+01 7.88E+01
6.24E+01 6.35E+01 5.94E+01 6.34E+01
1.04E+02
2.00E+02 1.83E+02 1.32E+02 8.55E+01 5.44E+01 3.83E+01 3.36E+01 3.54E+01
1.01E+02 1.06E+02 1.05E+02
1.02E+02 1.02E+02 9.86E+01 1.71E+02 1.22E+02
1.06E+02 1.08E+02 1.01E+02 1.02E+02
2.65E+02
2.33E+02 2.65E+02 2.39E+02 1.22E+02 1.15E+02 6.99E+01 7.48E+01 4.67E+01
2.46E+02 2.65E+02 2.33E+02
2.65E+02 2.46E+02 1.82E+02 1.98E+02 1.92E+02
2.46E+02 2.39E+02 2.65E+02 2.38E+02

20
Table 5B. Per Capita Total Dietary Intake (g/day)
Population Group
Population Sample Size
Percent Consuming Mean Standard
Error 0th 5th 10th 25th 50th 75th 90th 95th 99th 100th
Whole Population
Age (years) Age < 1 Age 1-2 Age 3-5 Age 6-11 Age 12-19 Age 20-39 Age 40-69 Age 70+
Urbanization Central City Suburban Nonmetropolitan
Race White Black Asian Native American Other/NA
Region Northeast Midwest South West
19850
1422 1996 4112 1786 1373 2950 4818 1393
5879 9348 4623
15130 2615 522 149
1434
3563 4722 7037 4528
99.4%
91.6% 100.0% 100.0% 100.0% 100.0% 100.0% 100.0% 100.0%
99.5% 99.3% 99.5%
99.4% 99.7% 99.0% 99.3% 99.3%
99.5% 99.6% 99.6% 98.9%
1.1E+03
3.2E+02 1.0E+03 1.1E+03 1.1E+03 1.2E+03 1.1E+03 1.1E+03 1.0E+03
1.1E+03 1.1E+03 1.1E+03
1.1E+03 1.0E+03 1.2E+03 1.1E+03 1.1E+03
1.1E+03 1.2E+03 1.0E+03 1.2E+03
4.87E+02
3.13E+02 3.92E+02 3.80E+02 3.71E+02 5.89E+02 5.18E+02 4.68E+02 4.30E+02
4.92E+02 4.77E+02 4.97E+02
4.88E+02 4.47E+02 5.09E+02 4.87E+02 5.04E+02
4.69E+02 5.23E+02 4.46E+02 5.10E+02
0.00E+00
0.00E+00 5.06E+01 1.77E+02 3.42E+02 1.73E+02 5.68E+01 4.81E+01 1.76E+02
0.00E+00 0.00E+00 0.00E+00
0.00E+00 0.00E+00 0.00E+00 0.00E+00 0.00E+00
0.00E+00 0.00E+00 0.00E+00 0.00E+00
4.58E+02
0.00E+00 4.61E+02 5.48E+02 6.04E+02 4.80E+02 4.93E+02 4.72E+02 4.49E+02
4.63E+02 4.67E+02 4.34E+02
4.74E+02 3.70E+02 5.07E+02 4.36E+02 4.08E+02
5.14E+02 4.79E+02 4.23E+02 4.66E+02
5.65E+02
6.73E+00 5.75E+02 6.29E+02 6.86E+02 5.85E+02 5.79E+02 5.67E+02 5.49E+02
5.69E+02 5.84E+02 5.35E+02
5.86E+02 4.87E+02 5.92E+02 5.01E+02 5.66E+02
6.06E+02 5.97E+02 5.27E+02 5.83E+02
7.71E+02
1.09E+02 7.59E+02 8.05E+02 8.47E+02 8.17E+02 7.78E+02 7.66E+02 7.41E+02
7.76E+02 7.93E+02 7.27E+02
7.87E+02 6.65E+02 8.06E+02 6.92E+02 7.86E+02
8.08E+02 8.03E+02 7.10E+02 8.09E+02
1.03E+03
2.27E+02 9.95E+02 1.02E+03 1.06E+03 1.10E+03 1.04E+03 1.03E+03 9.82E+02
1.02E+03 1.06E+03 9.86E+02
1.04E+03 9.17E+02 1.09E+03 9.86E+02 1.09E+03
1.05E+03 1.06E+03 9.62E+02 1.09E+03
1.36E+03
4.25E+02 1.25E+03 1.28E+03 1.34E+03 1.50E+03 1.39E+03 1.35E+03 1.28E+03
1.36E+03 1.38E+03 1.33E+03
1.38E+03 1.22E+03 1.40E+03 1.45E+03 1.41E+03
1.39E+03 1.41E+03 1.26E+03 1.42E+03
1.72E+03
6.70E+02 1.53E+03 1.55E+03 1.63E+03 1.93E+03 1.78E+03 1.71E+03 1.56E+03
1.73E+03 1.73E+03 1.69E+03
1.73E+03 1.61E+03 1.96E+03 1.71E+03 1.74E+03
1.73E+03 1.80E+03 1.61E+03 1.78E+03
2.00E+03
9.20E+02 1.70E+03 1.75E+03 1.82E+03 2.29E+03 2.11E+03 1.93E+03 1.82E+03
2.06E+03 1.97E+03 1.92E+03
1.99E+03 1.88E+03 2.08E+03 2.08E+03 2.03E+03
2.06E+03 2.07E+03 1.85E+03 2.11E+03
2.65E+03
1.63E+03 2.18E+03 2.17E+03 2.20E+03 3.09E+03 3.12E+03 2.48E+03 2.26E+03
3.26E+03 2.52E+03 2.59E+03
2.59E+03 3.28E+03 2.67E+03 2.21E+03 2.63E+03
3.09E+03 2.76E+03 2.41E+03 2.59E+03
8.84E+03
2.46E+03 3.60E+03 4.89E+03 3.60E+03 8.84E+03 5.64E+03 4.32E+03 3.09E+03
5.64E+03 4.71E+03 8.84E+03
8.84E+03 3.94E+03 3.34E+03 2.41E+03 3.38E+03
4.71E+03 8.84E+03 4.32E+03 4.55E+03

Table 6. Table Numbers for Each Age Group and Type of Intake
Age
(years)
Intakes
(g/kg/d)
Intakes
(g/d)
All ages
combined
7A 7B
20+ 7C 7D
<1 7E 7F
1-2 7G 7H
3-5 7I 7J
6-11 7K 7L
12-19 7M 7N
Deciles were identified as follows. For each of the six age groups, consumption of the
decile target food was calculated for each individual. The individuals were sorted by
consumption, and a weighted percentile value was calculated for each individual using the
weighting factors described in Section 2.2, with the lowest consumption approximately equal to
zero and the highest equal to one. The low-consuming decile was defined as all persons with a
consumption less than the 10th percentile. The mid-range decile was defined as all persons with
a consumption falling between the 45th and 55th percentile. The high-consuming decile was
defined as all persons with a consumption greater than the 90th percentile. This identification
was repeated for each age category and for the entire survey population. The identification of
deciles resulted in lists of high-, mid-range-, and low-consuming individuals for each age group
for each of the six target foods. Note that due to differences in weighting factors, the high, mid-
range, or low decile for a given age group does not necessarily contain exactly 10% of the
individuals in the group.
As an aid to the reader, the table numbers are listed in Table 8. The results of the decile
analysis are presented in Tables 9A through 14N. In each of these tables, the number denotes the
decile target food, and the letter denotes the age group and the basis of the intake calculation
(g/kg/day or g/day).
21

22
Table 7A. Per Capita Intake of Major Food Groups, All Ages Combined (g/kg/day)
Food Group
Population Sample Size
Percent Consuming Mean Standard
Error
Percentile Values
0th 5th 10th 25th 50th 75th 90th 95th 99th 100th
Total Dietary Intake 19850 99.4% 2.22E+01 3.10E+01 0.00E+00 6.45E+00 8.14E+00 1.14E+01 1.62E+01 2.45E+01 4.36E+01 6.20E+01 1.04E+02 2.65E+02 Total Dairy Intake 19850 98.4% 6.27E+00 1.67E+01 0.00E+00 1.47E-01 3.24E-01 1.05E+00 3.00E+00 6.90E+00 1.53E+01 2.41E+01 5.00E+01 2.16E+02 Total Meat Intake 19850 94.1% 2.06E+00 2.35E+00 0.00E+00 1.74E-01 4.84E-01 9.60E-01 1.66E+00 2.67E+00 3.97E+00 5.23E+00 8.68E+00 3.04E+01 Total Egg Intake 19850 89.6% 3.92E-01 1.01E+00 0.00E+00 0.00E+00 9.80E-04 2.98E-02 1.52E-01 5.17E-01 1.02E+00 1.43E+00 3.14E+00 1.46E+01 Total Fish Intake 19850 22.2% 2.08E-01 6.43E-01 0.00E+00 0.00E+00 0.00E+00 0.00E+00 0.00E+00 1.69E-03 7.62E-01 1.23E+00 2.52E+00 1.21E+01 Total Grain Intake 19850 97.7% 2.41E+00 2.63E+00 0.00E+00 5.81E-01 7.75E-01 1.21E+00 1.87E+00 3.01E+00 4.73E+00 6.08E+00 9.17E+00 2.77E+01 Total Vegetable Intake 19850 98.1% 5.05E+00 5.08E+00 0.00E+00 1.27E+00 1.81E+00 2.81E+00 4.24E+00 6.34E+00 9.00E+00 1.14E+01 1.82E+01 6.65E+01 Total Fruit Intake 19850 92.9% 4.28E+00 1.18E+01 0.00E+00 0.00E+00 1.48E-03 3.52E-01 2.12E+00 5.16E+00 1.03E+01 1.62E+01 3.49E+01 1.44E+02 Total Fat Intake 19850 99.1% 1.20E+00 1.56E+00 0.00E+00 2.98E-01 3.97E-01 6.06E-01 9.31E-01 1.43E+00 2.34E+00 3.14E+00 5.01E+00 1.99E+01 Total Soy Intake 19850 98.8% 4.32E-01 5.25E-01 0.00E+00 7.14E-02 1.10E-01 2.00E-01 3.41E-01 5.52E-01 8.48E-01 1.12E+00 1.76E+00 5.95E+00 Total Nut Intake 19850 40.0% 8.40E-02 3.71E-01 0.00E+00 0.00E+00 0.00E+00 0.00E+00 0.00E+00 5.02E-02 2.48E-01 4.79E-01 1.20E+00 8.79E+00
Table 7B. Per Capita Intake of Major Food Groups, All Ages Combined (g/day)
Food Group
Population Sample Size
Percent Consuming Mean Standard
Error
Percentile Values
0th 5th 10th 25th 50th 75th 90th 95th 99th 100th
Total Dietary Intake 19850 99.4% 1.11E+03 4.87E+02 0.00E+00 4.58E+02 5.65E+02 7.71E+02 1.03E+03 1.36E+03 1.72E+03 2.00E+03 2.65E+03 8.84E+03 Total Dairy Intake 19850 98.4% 2.62E+02 2.65E+02 0.00E+00 1.01E+01 2.29E+01 7.34E+01 1.92E+02 3.79E+02 5.97E+02 7.38E+02 1.12E+03 3.98E+03 Total Meat Intake 19850 94.1% 1.20E+02 8.23E+01 0.00E+00 9.08E+00 2.58E+01 5.69E+01 1.01E+02 1.59E+02 2.32E+02 2.84E+02 4.36E+02 2.34E+03 Total Egg Intake 19850 89.6% 2.16E+01 2.79E+01 0.00E+00 0.00E+00 5.02E-02 1.74E+00 8.67E+00 3.12E+01 5.88E+01 8.22E+01 1.25E+02 4.45E+02 Total Fish Intake 19850 22.2% 1.28E+01 2.78E+01 0.00E+00 0.00E+00 0.00E+00 0.00E+00 0.00E+00 9.01E-02 4.83E+01 7.84E+01 1.52E+02 4.34E+02 Total Grain Intake 19850 97.7% 1.30E+02 7.39E+01 0.00E+00 3.80E+01 5.17E+01 7.75E+01 1.13E+02 1.61E+02 2.26E+02 2.80E+02 4.29E+02 1.11E+03 Total Vegetable Intake 19850 98.1% 2.85E+02 1.62E+02 0.00E+00 7.17E+01 1.05E+02 1.67E+02 2.56E+02 3.70E+02 4.98E+02 5.95E+02 8.27E+02 2.50E+03 Total Fruit Intake 19850 92.9% 1.93E+02 2.18E+02 0.00E+00 0.00E+00 1.03E-01 2.27E+01 1.29E+02 2.80E+02 4.72E+02 6.23E+02 9.87E+02 2.69E+03 Total Fat Intake 19850 99.1% 6.26E+01 3.05E+01 0.00E+00 2.02E+01 2.67E+01 3.87E+01 5.61E+01 7.86E+01 1.07E+02 1.25E+02 1.75E+02 3.91E+02 Total Soy Intake 19850 98.8% 2.34E+01 1.44E+01 0.00E+00 4.53E+00 6.89E+00 1.21E+01 2.01E+01 3.11E+01 4.39E+01 5.36E+01 7.83E+01 1.67E+02 Total Nut Intake 19850 40.0% 4.25E+00 1.10E+01 0.00E+00 0.00E+00 0.00E+00 0.00E+00 0.00E+00 2.82E+00 1.29E+01 2.25E+01 6.01E+01 2.10E+02

23
Table 7C. Per Capita Intake of Major Food Groups, Age 20+ Years (g/kg/day)
Food Group
Population Sample Size
Percent Consuming Mean Standard
Error
Percentile Values
0th 5th 10th 25th 50th 75th 90th 95th 99th 100th
Total Dietary Intake 9161 100.0% 1.52E+01 6.76E+00 8.70E-01 6.06E+00 7.50E+00 1.03E+01 1.41E+01 1.88E+01 2.39E+01 2.80E+01 3.71E+01 7.48E+01 Total Dairy Intake 9161 99.8% 3.04E+00 3.09E+00 0.00E+00 1.24E-01 2.60E-01 8.08E-01 2.11E+00 4.27E+00 6.96E+00 9.12E+00 1.39E+01 4.10E+01 Total Meat Intake 9161 98.3% 1.74E+00 1.18E+00 0.00E+00 2.15E-01 4.81E-01 8.93E-01 1.50E+00 2.28E+00 3.25E+00 3.94E+00 6.26E+00 1.34E+01 Total Egg Intake 9161 94.1% 3.18E-01 4.27E-01 0.00E+00 0.00E+00 1.64E-03 2.83E-02 1.44E-01 4.85E-01 8.64E-01 1.14E+00 1.82E+00 7.53E+00 Total Fish Intake 9161 28.9% 2.12E-01 4.95E-01 0.00E+00 0.00E+00 0.00E+00 0.00E+00 0.00E+00 1.53E-01 7.83E-01 1.20E+00 2.32E+00 8.05E+00 Total Grain Intake 9161 99.9% 1.85E+00 1.12E+00 0.00E+00 5.46E-01 7.14E-01 1.07E+00 1.58E+00 2.30E+00 3.27E+00 4.04E+00 6.04E+00 1.61E+01 Total Vegetable Intake 9161 100.0% 4.22E+00 2.38E+00 0.00E+00 1.21E+00 1.68E+00 2.55E+00 3.80E+00 5.41E+00 7.22E+00 8.51E+00 1.17E+01 2.82E+01 Total Fruit Intake 9161 93.5% 2.68E+00 3.19E+00 0.00E+00 0.00E+00 1.23E-03 2.38E-01 1.70E+00 3.92E+00 6.77E+00 8.91E+00 1.46E+01 5.16E+01 Total Fat Intake 9161 100.0% 8.59E-01 4.40E-01 0.00E+00 2.75E-01 3.56E-01 5.31E-01 7.82E-01 1.09E+00 1.44E+00 1.68E+00 2.42E+00 4.24E+00 Total Soy Intake 9161 99.7% 3.28E-01 2.10E-01 0.00E+00 6.30E-02 9.77E-02 1.72E-01 2.84E-01 4.38E-01 6.02E-01 7.26E-01 1.08E+00 2.15E+00 Total Nut Intake 9161 36.9% 5.78E-02 1.71E-01 0.00E+00 0.00E+00 0.00E+00 0.00E+00 0.00E+00 3.33E-02 1.67E-01 3.36E-01 8.02E-01 2.72E+00
Table 7D. Per Capita Intake of Major Food Groups, Age 20+ Years (g/day)
Food Group
Population Sample Size
Percent Consuming Mean Standard
Error
Percentile Values
0th 5th 10th 25th 50th 75th 90th 95th 99th 100th
Total Dietary Intake 9161 100.0% 1.11E+03 4.81E+02 4.81E+01 4.77E+02 5.70E+02 7.69E+02 1.03E+03 1.36E+03 1.73E+03 2.01E+03 2.65E+03 5.64E+03 Total Dairy Intake 9161 99.8% 2.21E+02 2.28E+02 0.00E+00 8.76E+00 1.99E+01 5.96E+01 1.53E+02 3.12E+02 5.09E+02 6.43E+02 1.02E+03 3.72E+03 Total Meat Intake 9161 98.3% 1.30E+02 8.95E+01 0.00E+00 1.51E+01 3.45E+01 6.49E+01 1.11E+02 1.71E+02 2.46E+02 2.99E+02 4.57E+02 1.01E+03 Total Egg Intake 9161 94.1% 2.35E+01 3.16E+01 0.00E+00 0.00E+00 1.26E-01 2.07E+00 1.04E+01 3.64E+01 6.28E+01 8.70E+01 1.29E+02 4.45E+02 Total Fish Intake 9161 28.9% 1.53E+01 3.60E+01 0.00E+00 0.00E+00 0.00E+00 0.00E+00 0.00E+00 1.16E+01 5.63E+01 8.62E+01 1.62E+02 4.34E+02 Total Grain Intake 9161 99.9% 1.36E+02 8.44E+01 0.00E+00 4.16E+01 5.33E+01 7.91E+01 1.16E+02 1.67E+02 2.38E+02 2.97E+02 4.62E+02 1.11E+03 Total Vegetable Intake 9161 100.0% 3.09E+02 1.71E+02 0.00E+00 9.05E+01 1.24E+02 1.91E+02 2.81E+02 3.94E+02 5.25E+02 6.26E+02 8.50E+02 1.81E+03 Total Fruit Intake 9161 93.5% 1.91E+02 2.24E+02 0.00E+00 0.00E+00 9.90E-02 1.82E+01 1.25E+02 2.80E+02 4.73E+02 6.25E+02 9.96E+02 2.69E+03 Total Fat Intake 9161 100.0% 6.38E+01 3.39E+01 0.00E+00 1.97E+01 2.63E+01 3.87E+01 5.71E+01 8.11E+01 1.09E+02 1.27E+02 1.78E+02 3.59E+02 Total Soy Intake 9161 99.7% 2.43E+01 1.59E+01 0.00E+00 4.73E+00 7.13E+00 1.26E+01 2.09E+01 3.25E+01 4.56E+01 5.49E+01 7.87E+01 1.67E+02 Total Nut Intake 9161 36.9% 4.29E+00 1.29E+01 0.00E+00 0.00E+00 0.00E+00 0.00E+00 0.00E+00 2.42E+00 1.18E+01 2.35E+01 6.46E+01 2.10E+02

24
Table 7E. Per Capita Intake of Major Food Groups, Age <1 Year (g/kg/day)
Food Group
Population Sample Size
Percent Consuming Mean Standard
Error
Percentile Values
0th 5th 10th 25th 50th 75th 90th 95th 99th 100th
Total Dietary Intake 1422 91.6% 3.88E+01 3.27E+01 0.00E+00 0.00E+00 1.32E+00 1.87E+01 3.22E+01 5.04E+01 7.41E+01 1.01E+02 2.00E+02 2.33E+02 Total Dairy Intake 1422 79.7% 1.22E+01 1.93E+01 0.00E+00 0.00E+00 0.00E+00 7.42E-01 7.76E+00 1.38E+01 2.33E+01 4.34E+01 1.24E+02 1.80E+02 Total Meat Intake 1422 38.3% 1.20E+00 2.39E+00 0.00E+00 0.00E+00 0.00E+00 0.00E+00 0.00E+00 1.54E+00 4.06E+00 6.35E+00 1.03E+01 2.96E+01 Total Egg Intake 1422 26.7% 2.87E-01 9.78E-01 0.00E+00 0.00E+00 0.00E+00 0.00E+00 0.00E+00 2.89E-02 4.46E-01 2.08E+00 6.09E+00 1.13E+01 Total Fish Intake 1422 2.5% 3.25E-02 2.49E-01 0.00E+00 0.00E+00 0.00E+00 0.00E+00 0.00E+00 0.00E+00 0.00E+00 0.00E+00 1.18E+00 4.44E+00 Total Grain Intake 1422 69.3% 2.11E+00 2.73E+00 0.00E+00 0.00E+00 0.00E+00 0.00E+00 1.26E+00 3.22E+00 5.43E+00 7.37E+00 1.16E+01 2.60E+01 Total Vegetable Intake 1422 73.1% 6.82E+00 7.73E+00 0.00E+00 0.00E+00 0.00E+00 0.00E+00 4.43E+00 1.13E+01 1.74E+01 2.15E+01 3.30E+01 6.65E+01 Total Fruit Intake 1422 62.0% 1.20E+01 1.56E+01 0.00E+00 0.00E+00 0.00E+00 0.00E+00 6.94E+00 1.93E+01 3.19E+01 4.00E+01 7.16E+01 1.38E+02 Total Fat Intake 1422 88.0% 3.90E+00 2.76E+00 0.00E+00 0.00E+00 0.00E+00 2.10E+00 3.82E+00 5.37E+00 7.11E+00 8.81E+00 1.32E+01 1.99E+01 Total Soy Intake 1422 86.9% 1.02E+00 8.50E-01 0.00E+00 0.00E+00 0.00E+00 4.19E-01 8.99E-01 1.41E+00 2.07E+00 2.66E+00 3.93E+00 5.95E+00 Total Nut Intake 1422 3.7% 1.08E-02 9.96E-02 0.00E+00 0.00E+00 0.00E+00 0.00E+00 0.00E+00 0.00E+00 0.00E+00 0.00E+00 3.05E-01 2.34E+00
Table 7F. Per Capita Intake of Major Food Groups, Age <1 Year (g/day)
Food Group
Population Sample Size
Percent Consuming Mean Standard
Error
Percentile Values
0th 5th 10th 25th 50th 75th 90th 95th 99th 100th
Total Dietary Intake 1422 91.6% 3.18E+02 3.13E+02 0.00E+00 0.00E+00 6.73E+00 1.09E+02 2.27E+02 4.25E+02 6.70E+02 9.20E+02 1.63E+03 2.46E+03 Total Dairy Intake 1422 79.7% 9.76E+01 1.81E+02 0.00E+00 0.00E+00 0.00E+00 5.41E+00 6.21E+01 9.06E+01 1.60E+02 3.91E+02 1.14E+03 1.87E+03 Total Meat Intake 1422 38.3% 1.10E+01 2.16E+01 0.00E+00 0.00E+00 0.00E+00 0.00E+00 0.00E+00 1.41E+01 3.78E+01 5.91E+01 1.03E+02 2.69E+02 Total Egg Intake 1422 26.7% 2.78E+00 9.45E+00 0.00E+00 0.00E+00 0.00E+00 0.00E+00 0.00E+00 2.82E-01 3.87E+00 2.03E+01 5.11E+01 1.03E+02 Total Fish Intake 1422 2.5% 3.10E-01 2.32E+00 0.00E+00 0.00E+00 0.00E+00 0.00E+00 0.00E+00 0.00E+00 0.00E+00 0.00E+00 1.19E+01 4.22E+01 Total Grain Intake 1422 69.3% 1.85E+01 2.45E+01 0.00E+00 0.00E+00 0.00E+00 0.00E+00 1.00E+01 2.85E+01 5.12E+01 6.58E+01 1.09E+02 2.60E+02 Total Vegetable Intake 1422 73.1% 5.66E+01 6.38E+01 0.00E+00 0.00E+00 0.00E+00 0.00E+00 3.69E+01 9.42E+01 1.44E+02 1.83E+02 2.64E+02 4.52E+02 Total Fruit Intake 1422 62.0% 1.02E+02 1.33E+02 0.00E+00 0.00E+00 0.00E+00 0.00E+00 5.59E+01 1.66E+02 2.67E+02 3.47E+02 5.77E+02 1.25E+03 Total Fat Intake 1422 88.0% 2.76E+01 1.69E+01 0.00E+00 0.00E+00 0.00E+00 1.72E+01 2.96E+01 3.78E+01 4.69E+01 5.59E+01 7.36E+01 1.06E+02 Total Soy Intake 1422 86.9% 7.18E+00 5.29E+00 0.00E+00 0.00E+00 0.00E+00 3.71E+00 6.79E+00 1.00E+01 1.36E+01 1.72E+01 2.58E+01 3.67E+01 Total Nut Intake 1422 3.7% 1.02E-01 9.03E-01 0.00E+00 0.00E+00 0.00E+00 0.00E+00 0.00E+00 0.00E+00 0.00E+00 0.00E+00 3.75E+00 2.01E+01

25
Table 7G. Per Capita Intake of Major Food Groups, Age 1-2 Years (g/kg/day)
Food Group
Population Sample Size
Percent Consuming Mean Standard
Error
Percentile Values
0th 5th 10th 25th 50th 75th 90th 95th 99th 100th
Total Dietary Intake 1996 100.0% 8.20E+01 3.42E+01 5.32E+00 3.51E+01 4.15E+01 5.85E+01 7.75E+01 1.01E+02 1.25E+02 1.44E+02 1.83E+02 2.65E+02 Total Dairy Intake 1996 99.8% 3.53E+01 2.61E+01 0.00E+00 3.66E+00 7.19E+00 1.66E+01 2.97E+01 4.81E+01 6.96E+01 8.54E+01 1.21E+02 2.16E+02 Total Meat Intake 1996 97.5% 4.13E+00 3.06E+00 0.00E+00 2.19E-01 7.96E-01 1.91E+00 3.56E+00 5.65E+00 7.97E+00 9.71E+00 1.39E+01 2.07E+01 Total Egg Intake 1996 92.6% 1.25E+00 1.73E+00 0.00E+00 0.00E+00 1.80E-03 9.29E-02 4.23E-01 1.97E+00 3.67E+00 4.64E+00 6.90E+00 1.46E+01 Total Fish Intake 1996 18.9% 2.69E-01 8.85E-01 0.00E+00 0.00E+00 0.00E+00 0.00E+00 0.00E+00 0.00E+00 9.69E-01 1.69E+00 4.00E+00 1.20E+01 Total Grain Intake 1996 99.7% 5.74E+00 2.82E+00 0.00E+00 1.93E+00 2.56E+00 3.85E+00 5.32E+00 7.25E+00 9.27E+00 1.09E+01 1.43E+01 2.77E+01 Total Vegetable Intake 1996 99.9% 1.04E+01 6.57E+00 0.00E+00 2.70E+00 3.61E+00 6.03E+00 9.03E+00 1.34E+01 1.83E+01 2.19E+01 3.34E+01 6.41E+01 Total Fruit Intake 1996 98.0% 2.11E+01 1.76E+01 0.00E+00 2.83E-01 2.10E+00 8.43E+00 1.73E+01 2.91E+01 4.40E+01 5.64E+01 7.94E+01 1.44E+02 Total Fat Intake 1996 100.0% 3.21E+00 1.43E+00 1.84E-02 1.29E+00 1.59E+00 2.23E+00 3.01E+00 3.93E+00 5.06E+00 5.80E+00 7.47E+00 1.09E+01 Total Soy Intake 1996 99.0% 8.89E-01 5.79E-01 0.00E+00 1.58E-01 2.62E-01 4.71E-01 7.80E-01 1.18E+00 1.63E+00 2.03E+00 2.77E+00 5.38E+00 Total Nut Intake 1996 43.1% 2.35E-01 5.62E-01 0.00E+00 0.00E+00 0.00E+00 0.00E+00 0.00E+00 2.46E-01 7.75E-01 1.18E+00 2.25E+00 7.81E+00
Table 7H. Per Capita Intake of Major Food Groups, Age 1-2 Years (g/day)
Food Group
Population Sample Size
Percent Consuming Mean Standard
Error
Percentile Values
0th 5th 10th 25th 50th 75th 90th 95th 99th 100th
Total Dietary Intake 1996 100.0% 1.03E+03 3.92E+02 5.06E+01 4.61E+02 5.75E+02 7.59E+02 9.95E+02 1.25E+03 1.53E+03 1.70E+03 2.18E+03 3.60E+03 Total Dairy Intake 1996 99.8% 4.37E+02 2.96E+02 0.00E+00 4.18E+01 1.02E+02 2.18E+02 3.93E+02 5.94E+02 8.30E+02 9.86E+02 1.36E+03 2.94E+03 Total Meat Intake 1996 97.5% 5.33E+01 3.97E+01 0.00E+00 2.70E+00 9.71E+00 2.47E+01 4.56E+01 7.32E+01 1.06E+02 1.30E+02 1.84E+02 2.80E+02 Total Egg Intake 1996 92.6% 1.61E+01 2.25E+01 0.00E+00 0.00E+00 2.48E-02 1.12E+00 5.57E+00 2.52E+01 4.73E+01 5.91E+01 9.27E+01 2.12E+02 Total Fish Intake 1996 18.9% 3.44E+00 1.11E+01 0.00E+00 0.00E+00 0.00E+00 0.00E+00 0.00E+00 0.00E+00 1.22E+01 2.38E+01 5.06E+01 1.35E+02 Total Grain Intake 1996 99.7% 7.33E+01 3.55E+01 0.00E+00 2.33E+01 3.24E+01 4.79E+01 6.85E+01 9.30E+01 1.19E+02 1.39E+02 1.76E+02 2.63E+02 Total Vegetable Intake 1996 99.9% 1.32E+02 8.35E+01 0.00E+00 3.12E+01 4.55E+01 7.65E+01 1.18E+02 1.67E+02 2.34E+02 2.76E+02 4.12E+02 8.46E+02 Total Fruit Intake 1996 98.0% 2.66E+02 2.18E+02 0.00E+00 3.29E+00 2.84E+01 1.07E+02 2.19E+02 3.65E+02 5.67E+02 7.06E+02 9.28E+02 2.04E+03 Total Fat Intake 1996 100.0% 4.06E+01 1.75E+01 1.91E-01 1.61E+01 2.06E+01 2.87E+01 3.88E+01 4.95E+01 6.40E+01 7.17E+01 9.64E+01 1.46E+02 Total Soy Intake 1996 99.0% 1.14E+01 7.48E+00 0.00E+00 2.00E+00 3.25E+00 6.07E+00 1.01E+01 1.53E+01 2.13E+01 2.50E+01 3.62E+01 6.35E+01 Total Nut Intake 1996 43.1% 3.03E+00 7.50E+00 0.00E+00 0.00E+00 0.00E+00 0.00E+00 0.00E+00 3.26E+00 9.18E+00 1.50E+01 3.05E+01 1.06E+02

26
Table 7I. Per Capita Intake of Major Food Groups, Age 3-5 Years (g/kg/day)
Food Group
Population Sample Size
Percent Consuming Mean Standard
Error
Percentile Values
0th 5th 10th 25th 50th 75th 90th 95th 99th 100th
Total Dietary Intake 4112 100.0% 6.05E+01 2.39E+01 1.12E+01 2.98E+01 3.41E+01 4.37E+01 5.72E+01 7.34E+01 9.10E+01 1.02E+02 1.32E+02 2.39E+02 Total Dairy Intake 4112 100.0% 2.23E+01 1.49E+01 4.22E-03 3.72E+00 6.52E+00 1.23E+01 1.97E+01 3.01E+01 4.07E+01 4.75E+01 6.56E+01 1.95E+02 Total Meat Intake 4112 98.8% 4.07E+00 2.82E+00 0.00E+00 6.10E-01 1.15E+00 2.14E+00 3.55E+00 5.41E+00 7.52E+00 9.37E+00 1.27E+01 2.34E+01 Total Egg Intake 4112 95.1% 8.91E-01 1.33E+00 0.00E+00 2.20E-05 3.53E-03 8.13E-02 3.19E-01 1.32E+00 2.67E+00 3.43E+00 5.43E+00 1.28E+01 Total Fish Intake 4112 19.5% 2.93E-01 8.83E-01 0.00E+00 0.00E+00 0.00E+00 0.00E+00 0.00E+00 0.00E+00 1.06E+00 2.00E+00 4.10E+00 1.21E+01 Total Grain Intake 4112 100.0% 5.71E+00 2.54E+00 0.00E+00 2.42E+00 2.92E+00 3.97E+00 5.29E+00 7.03E+00 8.84E+00 1.01E+01 1.36E+01 2.68E+01 Total Vegetable Intake 4112 100.0% 9.61E+00 5.31E+00 0.00E+00 3.14E+00 4.16E+00 6.10E+00 8.72E+00 1.20E+01 1.59E+01 1.91E+01 2.59E+01 6.02E+01 Total Fruit Intake 4112 97.8% 1.39E+01 1.35E+01 0.00E+00 1.27E-01 9.37E-01 4.70E+00 1.08E+01 1.97E+01 3.04E+01 3.88E+01 5.74E+01 1.24E+02 Total Fat Intake 4112 100.0% 2.81E+00 1.18E+00 3.91E-01 1.27E+00 1.51E+00 2.00E+00 2.65E+00 3.39E+00 4.32E+00 4.92E+00 6.40E+00 9.60E+00 Total Soy Intake 4112 99.8% 9.38E-01 5.48E-01 0.00E+00 2.49E-01 3.59E-01 5.64E-01 8.42E-01 1.19E+00 1.63E+00 1.97E+00 2.69E+00 5.33E+00 Total Nut Intake 4112 52.7% 2.88E-01 5.67E-01 0.00E+00 0.00E+00 0.00E+00 0.00E+00 7.98E-03 4.06E-01 9.17E-01 1.30E+00 2.44E+00 8.79E+00
Table 7J. Per Capita Intake of Major Food Groups, Age 3-5 Years (g/day)
Food Group
Population Sample Size
Percent Consuming Mean Standard
Error
Percentile Values
0th 5th 10th 25th 50th 75th 90th 95th 99th 100th
Total Dietary Intake 4112 100.0% 1.07E+03 3.80E+02 1.77E+02 5.48E+02 6.29E+02 8.05E+02 1.02E+03 1.28E+03 1.55E+03 1.75E+03 2.17E+03 4.89E+03 Total Dairy Intake 4112 100.0% 3.92E+02 2.49E+02 8.60E-02 6.85E+01 1.21E+02 2.24E+02 3.56E+02 5.22E+02 7.06E+02 8.05E+02 1.15E+03 3.98E+03 Total Meat Intake 4112 98.8% 7.26E+01 4.85E+01 0.00E+00 1.09E+01 1.98E+01 3.81E+01 6.52E+01 9.69E+01 1.33E+02 1.63E+02 2.30E+02 4.33E+02 Total Egg Intake 4112 95.1% 1.57E+01 2.33E+01 0.00E+00 3.19E-04 6.50E-02 1.47E+00 5.63E+00 2.39E+01 4.70E+01 5.85E+01 9.87E+01 2.90E+02 Total Fish Intake 4112 19.5% 5.20E+00 1.56E+01 0.00E+00 0.00E+00 0.00E+00 0.00E+00 0.00E+00 0.00E+00 1.91E+01 3.62E+01 7.09E+01 1.92E+02 Total Grain Intake 4112 100.0% 1.01E+02 4.12E+01 0.00E+00 4.42E+01 5.39E+01 7.20E+01 9.46E+01 1.22E+02 1.55E+02 1.75E+02 2.30E+02 4.10E+02 Total Vegetable Intake 4112 100.0% 1.70E+02 8.90E+01 0.00E+00 5.58E+01 7.52E+01 1.09E+02 1.56E+02 2.13E+02 2.80E+02 3.29E+02 4.54E+02 9.15E+02 Total Fruit Intake 4112 97.8% 2.43E+02 2.20E+02 0.00E+00 2.39E+00 1.56E+01 8.49E+01 1.96E+02 3.44E+02 5.16E+02 6.42E+02 1.00E+03 2.25E+03 Total Fat Intake 4112 100.0% 4.96E+01 1.94E+01 6.98E+00 2.27E+01 2.72E+01 3.61E+01 4.71E+01 6.00E+01 7.42E+01 8.49E+01 1.13E+02 1.67E+02 Total Soy Intake 4112 99.8% 1.66E+01 9.15E+00 0.00E+00 4.74E+00 6.48E+00 1.02E+01 1.51E+01 2.14E+01 2.83E+01 3.37E+01 4.60E+01 8.03E+01 Total Nut Intake 4112 52.7% 5.10E+00 9.68E+00 0.00E+00 0.00E+00 0.00E+00 0.00E+00 1.35E-01 7.51E+00 1.50E+01 2.25E+01 4.43E+01 1.43E+02
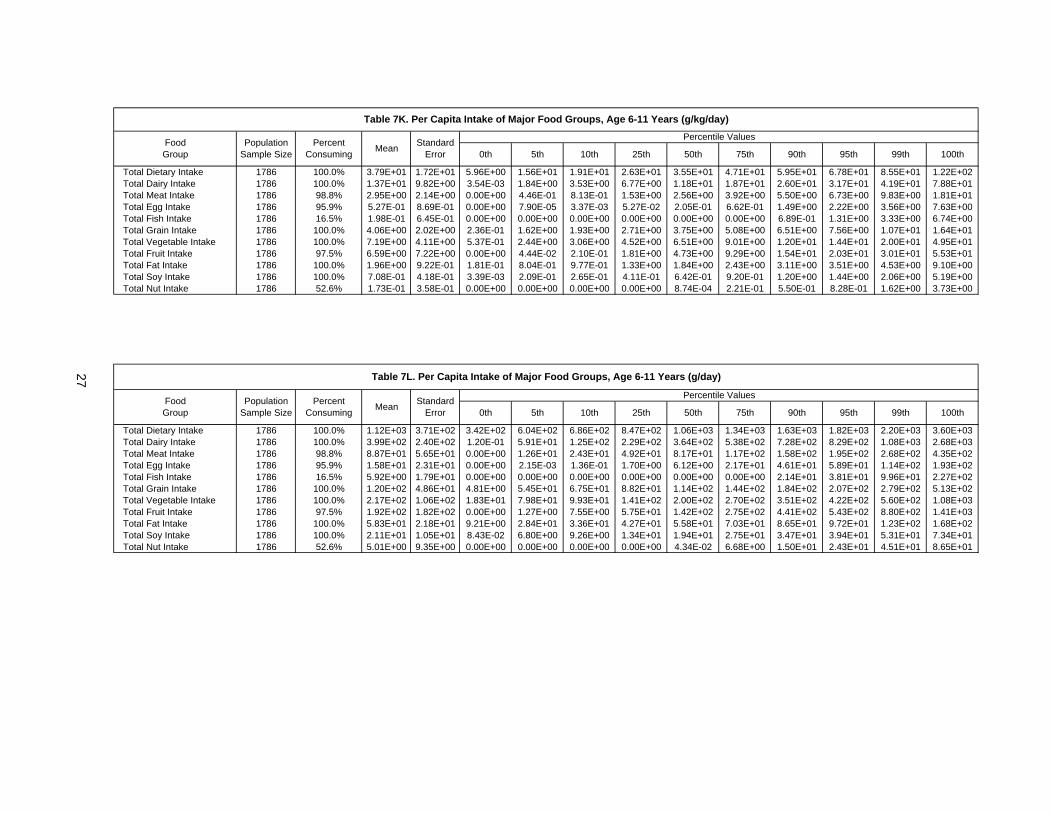
27
Table 7K. Per Capita Intake of Major Food Groups, Age 6-11 Years (g/kg/day)
Food Group
Population Sample Size
Percent Consuming Mean Standard
Error
Percentile Values
0th 5th 10th 25th 50th 75th 90th 95th 99th 100th
Total Dietary Intake 1786 100.0% 3.79E+01 1.72E+01 5.96E+00 1.56E+01 1.91E+01 2.63E+01 3.55E+01 4.71E+01 5.95E+01 6.78E+01 8.55E+01 1.22E+02 Total Dairy Intake 1786 100.0% 1.37E+01 9.82E+00 3.54E-03 1.84E+00 3.53E+00 6.77E+00 1.18E+01 1.87E+01 2.60E+01 3.17E+01 4.19E+01 7.88E+01 Total Meat Intake 1786 98.8% 2.95E+00 2.14E+00 0.00E+00 4.46E-01 8.13E-01 1.53E+00 2.56E+00 3.92E+00 5.50E+00 6.73E+00 9.83E+00 1.81E+01 Total Egg Intake 1786 95.9% 5.27E-01 8.69E-01 0.00E+00 7.90E-05 3.37E-03 5.27E-02 2.05E-01 6.62E-01 1.49E+00 2.22E+00 3.56E+00 7.63E+00 Total Fish Intake 1786 16.5% 1.98E-01 6.45E-01 0.00E+00 0.00E+00 0.00E+00 0.00E+00 0.00E+00 0.00E+00 6.89E-01 1.31E+00 3.33E+00 6.74E+00 Total Grain Intake 1786 100.0% 4.06E+00 2.02E+00 2.36E-01 1.62E+00 1.93E+00 2.71E+00 3.75E+00 5.08E+00 6.51E+00 7.56E+00 1.07E+01 1.64E+01 Total Vegetable Intake 1786 100.0% 7.19E+00 4.11E+00 5.37E-01 2.44E+00 3.06E+00 4.52E+00 6.51E+00 9.01E+00 1.20E+01 1.44E+01 2.00E+01 4.95E+01 Total Fruit Intake 1786 97.5% 6.59E+00 7.22E+00 0.00E+00 4.44E-02 2.10E-01 1.81E+00 4.73E+00 9.29E+00 1.54E+01 2.03E+01 3.01E+01 5.53E+01 Total Fat Intake 1786 100.0% 1.96E+00 9.22E-01 1.81E-01 8.04E-01 9.77E-01 1.33E+00 1.84E+00 2.43E+00 3.11E+00 3.51E+00 4.53E+00 9.10E+00 Total Soy Intake 1786 100.0% 7.08E-01 4.18E-01 3.39E-03 2.09E-01 2.65E-01 4.11E-01 6.42E-01 9.20E-01 1.20E+00 1.44E+00 2.06E+00 5.19E+00 Total Nut Intake 1786 52.6% 1.73E-01 3.58E-01 0.00E+00 0.00E+00 0.00E+00 0.00E+00 8.74E-04 2.21E-01 5.50E-01 8.28E-01 1.62E+00 3.73E+00
Table 7L. Per Capita Intake of Major Food Groups, Age 6-11 Years (g/day)
Food Group
Population Sample Size
Percent Consuming Mean Standard
Error
Percentile Values
0th 5th 10th 25th 50th 75th 90th 95th 99th 100th
Total Dietary Intake 1786 100.0% 1.12E+03 3.71E+02 3.42E+02 6.04E+02 6.86E+02 8.47E+02 1.06E+03 1.34E+03 1.63E+03 1.82E+03 2.20E+03 3.60E+03 Total Dairy Intake 1786 100.0% 3.99E+02 2.40E+02 1.20E-01 5.91E+01 1.25E+02 2.29E+02 3.64E+02 5.38E+02 7.28E+02 8.29E+02 1.08E+03 2.68E+03 Total Meat Intake 1786 98.8% 8.87E+01 5.65E+01 0.00E+00 1.26E+01 2.43E+01 4.92E+01 8.17E+01 1.17E+02 1.58E+02 1.95E+02 2.68E+02 4.35E+02 Total Egg Intake 1786 95.9% 1.58E+01 2.31E+01 0.00E+00 2.15E-03 1.36E-01 1.70E+00 6.12E+00 2.17E+01 4.61E+01 5.89E+01 1.14E+02 1.93E+02 Total Fish Intake 1786 16.5% 5.92E+00 1.79E+01 0.00E+00 0.00E+00 0.00E+00 0.00E+00 0.00E+00 0.00E+00 2.14E+01 3.81E+01 9.96E+01 2.27E+02 Total Grain Intake 1786 100.0% 1.20E+02 4.86E+01 4.81E+00 5.45E+01 6.75E+01 8.82E+01 1.14E+02 1.44E+02 1.84E+02 2.07E+02 2.79E+02 5.13E+02 Total Vegetable Intake 1786 100.0% 2.17E+02 1.06E+02 1.83E+01 7.98E+01 9.93E+01 1.41E+02 2.00E+02 2.70E+02 3.51E+02 4.22E+02 5.60E+02 1.08E+03 Total Fruit Intake 1786 97.5% 1.92E+02 1.82E+02 0.00E+00 1.27E+00 7.55E+00 5.75E+01 1.42E+02 2.75E+02 4.41E+02 5.43E+02 8.80E+02 1.41E+03 Total Fat Intake 1786 100.0% 5.83E+01 2.18E+01 9.21E+00 2.84E+01 3.36E+01 4.27E+01 5.58E+01 7.03E+01 8.65E+01 9.72E+01 1.23E+02 1.68E+02 Total Soy Intake 1786 100.0% 2.11E+01 1.05E+01 8.43E-02 6.80E+00 9.26E+00 1.34E+01 1.94E+01 2.75E+01 3.47E+01 3.94E+01 5.31E+01 7.34E+01 Total Nut Intake 1786 52.6% 5.01E+00 9.35E+00 0.00E+00 0.00E+00 0.00E+00 0.00E+00 4.34E-02 6.68E+00 1.50E+01 2.43E+01 4.51E+01 8.65E+01

28
Table 7M. Per Capita Intake of Major Food Groups, Age 12-19 Years (g/kg/day)
Food Group
Population Sample Size
Percent Consuming Mean Standard
Error
Percentile Values
0th 5th 10th 25th 50th 75th 90th 95th 99th 100th
Total Dietary Intake 1373 100.0% 2.06E+01 1.05E+01 2.55E+00 7.14E+00 9.22E+00 1.31E+01 1.87E+01 2.61E+01 3.43E+01 4.08E+01 5.44E+01 1.15E+02 Total Dairy Intake 1373 99.9% 5.77E+00 5.54E+00 0.00E+00 1.97E-01 4.31E-01 1.48E+00 4.23E+00 8.32E+00 1.32E+01 1.62E+01 2.53E+01 3.78E+01 Total Meat Intake 1373 98.9% 2.12E+00 1.61E+00 0.00E+00 2.38E-01 5.08E-01 1.06E+00 1.88E+00 2.77E+00 3.82E+00 4.79E+00 7.07E+00 3.04E+01 Total Egg Intake 1373 95.3% 3.30E-01 4.71E-01 0.00E+00 2.40E-05 1.79E-03 2.67E-02 1.21E-01 4.58E-01 1.00E+00 1.30E+00 1.90E+00 3.99E+00 Total Fish Intake 1373 18.1% 1.56E-01 4.51E-01 0.00E+00 0.00E+00 0.00E+00 0.00E+00 0.00E+00 0.00E+00 5.27E-01 1.15E+00 2.48E+00 3.71E+00 Total Grain Intake 1373 100.0% 2.44E+00 1.33E+00 3.60E-05 8.27E-01 1.02E+00 1.51E+00 2.17E+00 3.05E+00 4.22E+00 4.90E+00 6.92E+00 1.24E+01 Total Vegetable Intake 1373 100.0% 5.13E+00 2.97E+00 1.05E-01 1.50E+00 2.06E+00 3.07E+00 4.63E+00 6.51E+00 8.97E+00 1.03E+01 1.40E+01 3.24E+01 Total Fruit Intake 1373 92.4% 3.17E+00 3.89E+00 0.00E+00 0.00E+00 5.32E-04 1.54E-01 1.84E+00 4.54E+00 8.57E+00 1.16E+01 1.74E+01 3.22E+01 Total Fat Intake 1373 100.0% 1.23E+00 6.39E-01 1.24E-01 4.19E-01 5.30E-01 7.84E-01 1.13E+00 1.55E+00 2.04E+00 2.47E+00 3.34E+00 5.07E+00 Total Soy Intake 1373 100.0% 4.69E-01 3.03E-01 4.13E-03 1.02E-01 1.59E-01 2.60E-01 4.19E-01 6.01E-01 8.50E-01 1.06E+00 1.44E+00 2.38E+00 Total Nut Intake 1373 39.6% 6.62E-02 1.94E-01 0.00E+00 0.00E+00 0.00E+00 0.00E+00 0.00E+00 4.34E-02 2.11E-01 3.54E-01 8.83E-01 3.07E+00
Table 7N. Per Capita Intake of Major Food Groups, Age 12-19 Years (g/day)
Food Group
Population Sample Size
Percent Consuming Mean Standard
Error
Percentile Values
0th 5th 10th 25th 50th 75th 90th 95th 99th 100th
Total Dietary Intake 1373 100.0% 1.22E+03 5.89E+02 1.73E+02 4.80E+02 5.85E+02 8.17E+02 1.10E+03 1.50E+03 1.93E+03 2.29E+03 3.09E+03 8.84E+03 Total Dairy Intake 1373 99.9% 3.36E+02 3.04E+02 0.00E+00 1.27E+01 2.71E+01 9.50E+01 2.58E+02 4.81E+02 7.48E+02 9.65E+02 1.41E+03 1.97E+03 Total Meat Intake 1373 98.9% 1.29E+02 1.05E+02 0.00E+00 1.58E+01 2.97E+01 6.49E+01 1.10E+02 1.71E+02 2.40E+02 2.86E+02 4.05E+02 2.34E+03 Total Egg Intake 1373 95.3% 2.01E+01 2.88E+01 0.00E+00 1.58E-03 9.92E-02 1.51E+00 7.35E+00 2.67E+01 5.76E+01 8.22E+01 1.26E+02 2.44E+02 Total Fish Intake 1373 18.1% 9.40E+00 2.72E+01 0.00E+00 0.00E+00 0.00E+00 0.00E+00 0.00E+00 0.00E+00 3.11E+01 7.50E+01 1.33E+02 2.52E+02 Total Grain Intake 1373 100.0% 1.44E+02 7.65E+01 2.97E-03 5.16E+01 6.53E+01 9.25E+01 1.31E+02 1.80E+02 2.35E+02 2.80E+02 4.22E+02 6.83E+02 Total Vegetable Intake 1373 100.0% 3.06E+02 1.76E+02 6.68E+00 9.53E+01 1.29E+02 1.85E+02 2.72E+02 3.85E+02 5.19E+02 6.05E+02 8.79E+02 2.50E+03 Total Fruit Intake 1373 92.4% 1.82E+02 2.24E+02 0.00E+00 0.00E+00 3.30E-02 9.87E+00 1.12E+02 2.54E+02 4.67E+02 6.61E+02 9.94E+02 2.27E+03 Total Fat Intake 1373 100.0% 7.37E+01 3.81E+01 7.64E+00 2.61E+01 3.20E+01 4.80E+01 6.75E+01 9.08E+01 1.23E+02 1.46E+02 1.98E+02 3.91E+02 Total Soy Intake 1373 100.0% 2.80E+01 1.79E+01 1.69E-01 6.74E+00 9.82E+00 1.59E+01 2.50E+01 3.55E+01 5.03E+01 5.97E+01 8.79E+01 1.44E+02 Total Nut Intake 1373 39.6% 3.87E+00 1.12E+01 0.00E+00 0.00E+00 0.00E+00 0.00E+00 0.00E+00 2.56E+00 1.25E+01 2.16E+01 4.86E+01 1.77E+02

Table 8. Guide to Table Numbers
Decile All ages 20+ yrs <1 yrs 1!2 yrs 3!5 yrs 6!11 yrs 12!19 yrs
target food g/d g/kg/d g/d g/kg/d g/d g/kg/d g/d g/kg/d g/d g/kg/d g/d g/kg/d g/d g/kg/d
Total foods 9A 9B 9C 9D 9E 9F 9G 9H 9I 9J 9K 9L 9M 9N
Meat 10A 10B 10C 10D 105E 10F 10G 10H 10I 10J 10K 10L 10M 10N
Meat and
dairy 11A 11B 11C 11D 11E 11F 11G 11H 11I 11J 11K 11L 11M 11N
Fish 12A 12B 12C 12D 12E 12F 12G 12H 12I 12J 12K 12L 12M 12N
Fruits and
vegetables 13A 13B 13C 13D 13E 13F 13G 13H 13I 13J 13K 13L 13M 13N
Dairy 14A 14B 14C 14D 14E 14F 14G 14H 14I 14J 14K 14L 14M 14N
29

30
Table 9A. Per Capita Intake of Total Foods and Major Food Groups and Percent of Total Food Intake for Individuals with Low-End, Mid-Range, and High-end Total Food Intake
All Age Groups Combined (g/kg/day)
Food Group Low-end Total Food consumers Mid-range Total Food consumers High-end Total Food consumers
Sample Size = 1531 Sample Size = 1359 Sample Size = 6178 Intake Percent Intake Percent Intake Percent
Total Foods Total Dairy Total Meats Total Fish Total Eggs Total Grains Total Vegetables Total Fruits Total Fats Total Soy Total Nuts
6.14E+00 100.0% 7.86E-01 12.8% 1.01E+00 16.4% 1.04E-01 1.7% 1.93E-01 3.1% 9.42E-01 15.3% 1.99E+00 32.5% 5.36E-01 8.7% 4.67E-01 7.6% 1.82E-01 3.0% 2.09E-02 0.3%
1.62E+01 100.0% 3.45E+00 21.3% 1.83E+00 11.3% 2.23E-01 1.4% 3.36E-01 2.1% 1.98E+00 12.2% 4.56E+00 28.1% 2.60E+00 16.0% 9.67E-01 6.0% 3.69E-01 2.3% 6.65E-02 0.4%
7.00E+01 100.0% 2.77E+01 39.5% 4.05E+00 5.8% 2.98E-01 0.4% 9.31E-01 1.3% 5.69E+00 8.1% 1.04E+01 14.9% 1.70E+01 24.3% 3.02E+00 4.3% 9.31E-01 1.3% 2.59E-01 0.4%
Table 9B. Per Capita Intake of Total Foods and Major Food Groups and Percent of Total Food Intake for Individuals with Low-End, Mid-Range, and High-end Total Food Intake
All Age Groups Combined (g/day)
Food Group Low-end Total Food consumers Mid-range Total Food consumers High-end Total Food consumers
Sample Size = 798 Sample Size = 2036 Sample Size = 1532 Intake Percent Intake Percent Intake Percent
Total Foods Total Dairy Total Meats Total Fish Total Eggs Total Grains Total Vegetables Total Fruits Total Fats Total Soy Total Nuts
1.26E+02 100.0% 3.62E+01 28.8% 1.03E+01 8.2% 9.22E-01 0.7% 1.32E+00 1.0% 1.18E+01 9.4% 3.10E+01 24.6% 1.23E+01 9.8% 2.04E+01 16.2% 5.94E+00 4.7% 5.99E-02 0.0%
1.03E+03 100.0% 2.37E+02 23.0% 1.17E+02 11.4% 1.08E+01 1.1% 2.11E+01 2.0% 1.25E+02 12.2% 2.68E+02 26.0% 1.74E+02 16.8% 6.00E+01 5.8% 2.27E+01 2.2% 4.18E+00 0.4%
2.14E+03 100.0% 5.92E+02 27.7% 1.97E+02 9.2% 2.15E+01 1.0% 3.18E+01 1.5% 2.18E+02 10.2% 4.87E+02 22.8% 4.53E+02 21.2% 1.04E+02 4.9% 3.65E+01 1.7% 8.04E+00 0.4%

31
Table 9C. Per Capita Intake of Total Foods and Major Food Groups and Percent of Total Food Intake for Individuals with Low-End, Mid-Range, and High-end Total Food Intake
Age 20+ Years (g/kg/day)
Food Group Low-end Total Food consumers Mid-range Total Food consumers High-end Total Food consumers
Sample Size = 976 Sample Size = 927 Sample Size = 819 Intake Percent Intake Percent Intake Percent
Total Foods Total Dairy Total Meats Total Fish Total Eggs Total Grains Total Vegetables Total Fruits Total Fats Total Soy Total Nuts
5.80E+00 100.0% 7.28E-01 12.5% 1.00E+00 17.3% 9.25E-02 1.6% 2.03E-01 3.5% 9.03E-01 15.6% 1.86E+00 32.1% 4.59E-01 7.9% 4.49E-01 7.7% 1.73E-01 3.0% 2.21E-02 0.4%
1.41E+01 100.0% 2.74E+00 19.4% 1.72E+00 12.2% 1.92E-01 1.4% 3.19E-01 2.3% 1.84E+00 13.1% 4.07E+00 28.9% 2.10E+00 14.9% 8.57E-01 6.1% 3.26E-01 2.3% 5.41E-02 0.4%
2.97E+01 100.0% 7.40E+00 24.9% 2.45E+00 8.2% 2.63E-01 0.9% 4.46E-01 1.5% 3.00E+00 10.1% 6.98E+00 23.5% 7.01E+00 23.6% 1.36E+00 4.6% 4.91E-01 1.7% 8.33E-02 0.3%
Table 9D. Per Capita Intake of Total Foods and Major Food Groups and Percent of Total Food Intake for Individuals with Low-End, Mid-Range, and High-end Total Food Intake
Age 20+ Years (g/day)
Food Group Low-end Total Food consumers Mid-range Total Food consumers High-end Total Food consumers
Sample Size = 948 Sample Size = 948 Sample Size = 872 Intake Percent Intake Percent Intake Percent
Total Foods Total Dairy Total Meats Total Fish Total Eggs Total Grains Total Vegetables Total Fruits Total Fats Total Soy Total Nuts
4.51E+02 100.0% 5.46E+01 12.1% 7.43E+01 16.5% 7.32E+00 1.6% 1.45E+01 3.2% 6.90E+01 15.3% 1.47E+02 32.6% 4.01E+01 8.9% 3.42E+01 7.6% 1.34E+01 3.0% 1.65E+00 0.4%
1.03E+03 100.0% 1.88E+02 18.3% 1.28E+02 12.5% 1.27E+01 1.2% 2.34E+01 2.3% 1.30E+02 12.7% 2.91E+02 28.4% 1.74E+02 17.0% 6.03E+01 5.9% 2.33E+01 2.3% 4.14E+00 0.4%
2.14E+03 100.0% 5.20E+02 24.3% 2.10E+02 9.8% 2.51E+01 1.2% 3.35E+01 1.6% 2.30E+02 10.8% 5.16E+02 24.2% 4.66E+02 21.8% 1.05E+02 4.9% 3.72E+01 1.7% 8.00E+00 0.4%

32
Table 9E. Per Capita Intake of Total Foods and Major Food Groups and Percent of Total Food Intake for Individuals with Low-End, Mid-Range, and High-end Total Food Intake
Age <1 Year (g/kg/day)
Food Group Low-end Total Food consumers Mid-range Total Food consumers High-end Total Food consumers
Sample Size = 139 Sample Size = 143 Sample Size = 134 Intake Percent Intake Percent Intake Percent
Total Foods Total Dairy Total Meats Total Fish Total Eggs Total Grains Total Vegetables Total Fruits Total Fats Total Soy Total Nuts
5.63E-02 100.0% 4.25E-03 7.5% 0.00E+00 0.0% 0.00E+00 0.0% 0.00E+00 0.0% 2.44E-02 43.3% 1.07E-02 19.1% 1.41E-02 25.0% 1.79E-03 3.2% 5.39E-04 1.0% 0.00E+00 0.0%
3.20E+01 100.0% 9.78E+00 30.6% 8.60E-01 2.7% 5.36E-02 0.2% 2.51E-01 0.8% 1.58E+00 4.9% 6.61E+00 20.7% 7.53E+00 23.6% 5.01E+00 15.7% 1.42E+00 4.4% 4.81E-04 0.0%
8.65E+01 100.0% 2.90E+01 33.5% 3.06E+00 3.5% 2.44E-02 0.0% 3.37E-01 0.4% 4.48E+00 5.2% 9.45E+00 10.9% 2.47E+01 28.6% 3.23E+00 3.7% 7.06E-01 0.8% 2.01E-02 0.0%
Table 9F. Per Capita Intake of Total Foods and Major Food Groups and Percent of Total Food Intake for Individuals with Low-End, Mid-Range, and High-end Total Food Intake
Age <1 Year (g/day)
Food Group Low-end Total Food consumers Mid-range Total Food consumers High-end Total Food consumers
Sample Size = 138 Sample Size = 150 Sample Size = 142 Intake Percent Intake Percent Intake Percent
Total Foods Total Dairy Total Meats Total Fish Total Eggs Total Grains Total Vegetables Total Fruits Total Fats Total Soy Total Nuts
3.88E-01 100.0% 9.59E-02 24.7% 0.00E+00 0.0% 0.00E+00 0.0% 0.00E+00 0.0% 1.69E-01 43.7% 5.43E-02 14.0% 2.36E-02 6.1% 4.01E-02 10.4% 1.21E-02 3.1% 0.00E+00 0.0%
2.31E+02 100.0% 6.39E+01 27.7% 4.93E+00 2.1% 2.39E-02 0.0% 1.75E+00 0.8% 1.58E+01 6.8% 4.72E+01 20.4% 6.13E+01 26.6% 3.34E+01 14.5% 9.12E+00 4.0% 1.12E-02 0.0%
1.06E+03 100.0% 4.86E+02 45.8% 3.92E+01 3.7% 4.03E-01 0.0% 1.04E+01 1.0% 5.24E+01 4.9% 1.25E+02 11.7% 3.05E+02 28.7% 3.95E+01 3.7% 7.00E+00 0.7% 4.31E-01 0.0%

33
Table 9G. Per Capita Intake of Total Foods and Major Food Groups and Percent of Total Food Intake for Individuals with Low-End, Mid-Range, and High-end Total Food Intake
Age 1-2 Years (g/kg/day)
Food Group Low-end Total Food consumers Mid-range Total Food consumers High-end Total Food consumers
Sample Size = 184 Sample Size = 210 Sample Size = 146 Intake Percent Intake Percent Intake Percent
Total Foods Total Dairy Total Meats Total Fish Total Eggs Total Grains Total Vegetables Total Fruits Total Fats Total Soy Total Nuts
3.27E+01 100.0% 9.05E+00 27.7% 3.05E+00 9.3% 1.28E-01 0.4% 8.85E-01 2.7% 4.12E+00 12.6% 6.74E+00 20.6% 6.04E+00 18.5% 2.22E+00 6.8% 7.60E-01 2.3% 1.11E-01 0.3%
7.76E+01 100.0% 3.11E+01 40.1% 3.97E+00 5.1% 2.78E-01 0.4% 1.16E+00 1.5% 5.71E+00 7.4% 1.04E+01 13.5% 2.12E+01 27.3% 2.98E+00 3.8% 8.94E-01 1.2% 1.97E-01 0.3%
9.45E+01 100.0% 4.42E+01 46.8% 4.03E+00 4.3% 1.61E-01 0.2% 8.88E-01 0.9% 5.54E+00 5.9% 1.05E+01 11.1% 2.49E+01 26.3% 3.40E+00 3.6% 7.86E-01 0.8% 1.71E-01 0.2%
Table 9H. Per Capita Intake of Total Foods and Major Food Groups and Percent of Total Food Intake for Individuals with Low-End, Mid-Range, and High-end Total Food Intake
Age 1-2 Years (g/day)
Food Group Low-end Total Food consumers Mid-range Total Food consumers High-end Total Food consumers
Sample Size = 195 Sample Size = 191 Sample Size = 200 Intake Percent Intake Percent Intake Percent
Total Foods Total Dairy Total Meats Total Fish Total Eggs Total Grains Total Vegetables Total Fruits Total Fats Total Soy Total Nuts
4.28E+02 100.0% 1.16E+02 27.2% 3.89E+01 9.1% 1.41E+00 0.3% 1.06E+01 2.5% 5.23E+01 12.2% 9.01E+01 21.0% 8.54E+01 19.9% 2.71E+01 6.3% 9.23E+00 2.2% 1.53E+00 0.4%
9.94E+02 100.0% 4.17E+02 41.9% 5.45E+01 5.5% 3.69E+00 0.4% 1.55E+01 1.6% 7.56E+01 7.6% 1.30E+02 13.0% 2.49E+02 25.1% 4.05E+01 4.1% 1.17E+01 1.2% 3.34E+00 0.3%
1.81E+03 100.0% 8.70E+02 47.9% 6.84E+01 3.8% 5.28E+00 0.3% 2.26E+01 1.2% 8.79E+01 4.8% 1.76E+02 9.7% 5.18E+02 28.5% 5.88E+01 3.2% 1.37E+01 0.8% 4.41E+00 0.2%

34
Table 9I. Per Capita Intake of Total Foods and Major Food Groups and Percent of Total Food Intake for Individuals with Low-End, Mid-Range, and High-end Total Food Intake
Age 3-5 Years (g/kg/day)
Food Group Low-end Total Food consumers Mid-range Total Food consumers High-end Total Food consumers
Sample Size = 362 Sample Size = 384 Sample Size = 478 Intake Percent Intake Percent Intake Percent
Total Foods Total Dairy Total Meats Total Fish Total Eggs Total Grains Total Vegetables Total Fruits Total Fats Total Soy Total Nuts
2.84E+01 100.0% 7.76E+00 27.3% 2.96E+00 10.4% 1.44E-01 0.5% 5.87E-01 2.1% 3.98E+00 14.0% 6.25E+00 22.0% 4.33E+00 15.2% 1.81E+00 6.4% 6.76E-01 2.4% 1.99E-01 0.7%
5.72E+01 100.0% 2.09E+01 36.6% 4.04E+00 7.1% 2.70E-01 0.5% 9.16E-01 1.6% 5.64E+00 9.9% 9.16E+00 16.0% 1.26E+01 22.1% 2.72E+00 4.8% 9.00E-01 1.6% 3.16E-01 0.6%
1.04E+02 100.0% 4.11E+01 39.7% 3.99E+00 3.9% 1.58E-01 0.2% 8.68E-01 0.8% 6.14E+00 5.9% 1.15E+01 11.2% 2.59E+01 25.0% 3.52E+00 3.4% 9.23E-01 0.9% 2.64E-01 0.3%
Table 9J. Per Capita Intake of Total Foods and Major Food Groups and Percent of Total Food Intake for Individuals with Low-End, Mid-Range, and High-end Total Food Intake
Age 3-5 Years (g/day)
Food Group Low-end Total Food consumers Mid-range Total Food consumers High-end Total Food consumers
Sample Size = 406 Sample Size = 406 Sample Size = 433 Intake Percent Intake Percent Intake Percent
Total Foods Total Dairy Total Meats Total Fish Total Eggs Total Grains Total Vegetables Total Fruits Total Fats Total Soy Total Nuts
5.27E+02 100.0% 1.44E+02 27.3% 5.29E+01 10.0% 3.38E+00 0.6% 1.08E+01 2.0% 7.58E+01 14.4% 1.17E+02 22.3% 7.60E+01 14.4% 3.41E+01 6.5% 1.28E+01 2.4% 3.07E+00 0.6%
1.02E+03 100.0% 3.78E+02 37.0% 7.18E+01 7.0% 4.93E+00 0.5% 1.51E+01 1.5% 1.03E+02 10.1% 1.63E+02 16.0% 2.16E+02 21.2% 4.99E+01 4.9% 1.67E+01 1.6% 6.28E+00 0.6%
1.82E+03 100.0% 7.28E+02 40.1% 9.43E+01 5.2% 8.90E+00 0.5% 2.38E+01 1.3% 1.32E+02 7.3% 2.33E+02 12.8% 5.09E+02 28.0% 6.80E+01 3.7% 2.12E+01 1.2% 7.63E+00 0.4%

35
Table 9K. Per Capita Intake of Total Foods and Major Food Groups and Percent of Total Food Intake for Individuals with Low-End, Mid-Range, and High-end Total Food Intake
Age 6-11 Years (g/kg/day)
Food Group Low-end Total Food consumers Mid-range Total Food consumers High-end Total Food consumers
Sample Size = 156 Sample Size = 176 Sample Size = 228 Intake Percent Intake Percent Intake Percent
Total Foods Total Dairy Total Meats Total Fish Total Eggs Total Grains Total Vegetables Total Fruits Total Fats Total Soy Total Nuts
1.49E+01 100.0% 3.87E+00 26.0% 1.81E+00 12.2% 7.63E-02 0.5% 2.89E-01 1.9% 2.20E+00 14.7% 3.65E+00 24.5% 1.67E+00 11.2% 1.09E+00 7.3% 4.19E-01 2.8% 6.90E-02 0.5%
3.55E+01 100.0% 1.25E+01 35.1% 3.09E+00 8.7% 7.32E-02 0.2% 4.53E-01 1.3% 4.11E+00 11.6% 6.77E+00 19.1% 5.80E+00 16.3% 1.93E+00 5.4% 6.90E-01 1.9% 1.56E-01 0.4%
7.06E+01 100.0% 2.89E+01 40.9% 3.83E+00 5.4% 1.47E-01 0.2% 6.92E-01 1.0% 5.89E+00 8.4% 1.04E+01 14.8% 1.47E+01 20.8% 2.96E+00 4.2% 9.05E-01 1.3% 1.67E-01 0.2%
Table 9L. Per Capita Intake of Total Foods and Major Food Groups and Percent of Total Food Intake for Individuals with Low-End, Mid-Range, and High-end Total Food Intake
Age 6-11 Years (g/day)
Food Group Low-end Total Food consumers Mid-range Total Food consumers High-end Total Food consumers
Sample Size = 183 Sample Size = 173 Sample Size = 164 Intake Percent Intake Percent Intake Percent
Total Foods Total Dairy Total Meats Total Fish Total Eggs Total Grains Total Vegetables Total Fruits Total Fats Total Soy Total Nuts
5.74E+02 100.0% 1.51E+02 26.4% 6.66E+01 11.6% 1.73E+00 0.3% 1.15E+01 2.0% 9.06E+01 15.8% 1.38E+02 24.1% 6.22E+01 10.8% 3.95E+01 6.9% 1.57E+01 2.7% 3.52E+00 0.6%
1.06E+03 100.0% 3.66E+02 34.4% 9.56E+01 9.0% 5.83E+00 0.5% 1.56E+01 1.5% 1.17E+02 11.0% 2.15E+02 20.2% 1.70E+02 16.0% 5.90E+01 5.6% 2.14E+01 2.0% 4.63E+00 0.4%
1.88E+03 100.0% 7.52E+02 40.1% 1.06E+02 5.7% 8.94E+00 0.5% 2.13E+01 1.1% 1.62E+02 8.7% 3.03E+02 16.2% 4.12E+02 22.0% 7.66E+01 4.1% 2.47E+01 1.3% 8.11E+00 0.4%

36
Table 9M. Per Capita Intake of Total Foods and Major Food Groups and Percent of Total Food Intake for Individuals with Low-End, Mid-Range, and High-end Total Food Intake
Age 12-19 Years (g/kg/day)
Food Group Low-end Total Food consumers Mid-range Total Food consumers High-end Total Food consumers
Sample Size = 140 Sample Size = 141 Sample Size = 128 Intake Percent Intake Percent Intake Percent
Total Foods Total Dairy Total Meats Total Fish Total Eggs Total Grains Total Vegetables Total Fruits Total Fats Total Soy Total Nuts
6.94E+00 100.0% 9.86E-01 14.2% 1.13E+00 16.3% 7.41E-02 1.1% 1.53E-01 2.2% 1.18E+00 17.0% 2.25E+00 32.4% 5.36E-01 7.7% 5.86E-01 8.4% 2.33E-01 3.4% 1.59E-02 0.2%
1.87E+01 100.0% 4.71E+00 25.2% 2.20E+00 11.8% 1.02E-01 0.5% 3.65E-01 2.0% 2.32E+00 12.4% 5.04E+00 26.9% 2.52E+00 13.5% 1.20E+00 6.4% 4.49E-01 2.4% 7.45E-02 0.4%
4.33E+01 100.0% 1.56E+01 36.0% 3.13E+00 7.2% 1.55E-01 0.4% 4.79E-01 1.1% 3.98E+00 9.2% 8.10E+00 18.7% 7.98E+00 18.4% 2.11E+00 4.9% 7.02E-01 1.6% 1.37E-01 0.3%
Table 9N. Per Capita Intake of Total Foods and Major Food Groups and Percent of Total Food Intake for Individuals with Low-End, Mid-Range, and High-end Total Food Intake
Age 12-19 Years (g/day)
Food Group Low-end Total Food consumers Mid-range Total Food consumers High-end Total Food consumers
Sample Size = 142 Sample Size = 139 Sample Size = 122 Intake Percent Intake Percent Intake Percent
Total Foods Total Dairy Total Meats Total Fish Total Eggs Total Grains Total Vegetables Total Fruits Total Fats Total Soy Total Nuts
4.55E+02 100.0% 5.97E+01 13.1% 6.78E+01 14.9% 5.75E+00 1.3% 9.92E+00 2.2% 7.61E+01 16.7% 1.50E+02 33.0% 4.25E+01 9.4% 3.60E+01 7.9% 1.52E+01 3.3% 1.26E+00 0.3%
1.11E+03 100.0% 2.71E+02 24.5% 1.25E+02 11.3% 9.93E+00 0.9% 1.98E+01 1.8% 1.38E+02 12.4% 2.89E+02 26.1% 1.66E+02 15.0% 7.03E+01 6.4% 2.84E+01 2.6% 3.87E+00 0.3%
2.49E+03 100.0% 8.34E+02 33.5% 2.19E+02 8.8% 1.52E+01 0.6% 3.05E+01 1.2% 2.23E+02 9.0% 5.40E+02 21.7% 4.69E+02 18.9% 1.27E+02 5.1% 4.49E+01 1.8% 9.40E+00 0.4%

37
Table 10A. Per Capita Intake of Total Foods and Major Food Groups and Percent of Total Food Intake for Individuals with Low-End, Mid-Range, and High-end Total Meat Intake
All Age Groups Combined (g/kg/day)
Food Group Low-end Total Meat consumers Mid-range Total Meat consumers High-end Total Meat consumers
Sample Size = 2424 Sample Size = 1556 Sample Size = 3875 Intake Percent Intake Percent Intake Percent
Total Foods Total Dairy Total Meats Total Fish Total Eggs Total Grains Total Vegetables Total Fruits Total Fats Total Soy Total Nuts
1.84E+01 100.0% 5.53E+00 30.0% 1.91E-01 1.0% 3.10E-01 1.7% 2.50E-01 1.4% 1.90E+00 10.3% 4.08E+00 22.1% 4.68E+00 25.4% 1.00E+00 5.4% 3.76E-01 2.0% 7.89E-02 0.4%
1.81E+01 100.0% 4.73E+00 26.1% 1.67E+00 9.2% 1.81E-01 1.0% 3.29E-01 1.8% 2.03E+00 11.2% 4.39E+00 24.2% 3.48E+00 19.2% 9.62E-01 5.3% 3.70E-01 2.0% 7.75E-02 0.4%
4.68E+01 100.0% 1.48E+01 31.5% 5.92E+00 12.6% 1.94E-01 0.4% 7.66E-01 1.6% 4.43E+00 9.5% 9.04E+00 19.3% 8.85E+00 18.9% 2.59E+00 5.5% 7.85E-01 1.7% 1.35E-01 0.3%
Table 10B. Per Capita Intake of Total Foods and Major Food Groups and Percent of Total Food Intake for Individuals with Low-End, Mid-Range, and High-end Total Meat Intake
All Age Groups Combined (g/day)
Food Group Low-end Total Meat consumers Mid-range Total Meat consumers High-end Total Meat consumers
Sample Size = 3349 Sample Size = 1817 Sample Size = 1233 Intake Percent Intake Percent Intake Percent
Total Foods Total Dairy Total Meats Total Fish Total Eggs Total Grains Total Vegetables Total Fruits Total Fats Total Soy Total Nuts
8.87E+02 100.0% 2.61E+02 29.4% 1.01E+01 1.1% 1.66E+01 1.9% 1.33E+01 1.5% 9.87E+01 11.1% 2.02E+02 22.7% 2.24E+02 25.3% 3.61E+01 4.1% 1.56E+01 1.8% 4.28E+00 0.5%
1.05E+03 100.0% 2.56E+02 24.5% 1.01E+02 9.6% 1.08E+01 1.0% 2.04E+01 1.9% 1.20E+02 11.5% 2.69E+02 25.7% 1.93E+02 18.4% 5.76E+01 5.5% 2.24E+01 2.1% 3.83E+00 0.4%
1.55E+03 100.0% 2.72E+02 17.5% 3.21E+02 20.6% 1.23E+01 0.8% 3.11E+01 2.0% 1.93E+02 12.4% 4.40E+02 28.3% 1.72E+02 11.0% 1.13E+02 7.2% 3.59E+01 2.3% 4.39E+00 0.3%

38
Table 10C. Per Capita Intake of Total Foods and Major Food Groups and Percent of Total Food Intake for Individuals with Low-End, Mid-Range, and High-end Total Meat Intake
Age 20+ Years (g/kg/day)
Food Group Low-end Total Meat consumers Mid-range Total Meat consumers High-end Total Meat consumers
Sample Size = 928 Sample Size = 895 Sample Size = 810 Intake Percent Intake Percent Intake Percent
Total Foods Total Dairy Total Meats Total Fish Total Eggs Total Grains Total Vegetables Total Fruits Total Fats Total Soy Total Nuts
1.36E+01 100.0% 3.08E+00 22.6% 2.13E-01 1.6% 3.49E-01 2.6% 2.44E-01 1.8% 1.62E+00 11.9% 3.73E+00 27.3% 3.45E+00 25.3% 5.49E-01 4.0% 2.63E-01 1.9% 5.95E-02 0.4%
1.45E+01 100.0% 3.00E+00 20.7% 1.50E+00 10.3% 1.86E-01 1.3% 3.09E-01 2.1% 1.77E+00 12.2% 3.99E+00 27.6% 2.63E+00 18.2% 7.96E-01 5.5% 3.21E-01 2.2% 5.92E-02 0.4%
2.10E+01 100.0% 3.34E+00 15.9% 4.47E+00 21.3% 1.93E-01 0.9% 4.26E-01 2.0% 2.56E+00 12.2% 5.93E+00 28.2% 2.59E+00 12.3% 1.48E+00 7.0% 4.60E-01 2.2% 4.54E-02 0.2%
Table 10D. Per Capita Intake of Total Foods and Major Food Groups and Percent of Total Food Intake for Individuals with Low-End, Mid-Range, and High-end Total Meat Intake
Age 20+ Years (g/day)
Food Group Low-end Total Meat consumers Mid-range Total Meat consumers High-end Total Meat consumers
Sample Size = 917 Sample Size = 915 Sample Size = 837 Intake Percent Intake Percent Intake Percent
Total Foods Total Dairy Total Meats Total Fish Total Eggs Total Grains Total Vegetables Total Fruits Total Fats Total Soy Total Nuts
9.43E+02 100.0% 2.13E+02 22.6% 1.49E+01 1.6% 2.47E+01 2.6% 1.70E+01 1.8% 1.13E+02 12.0% 2.59E+02 27.4% 2.34E+02 24.9% 3.82E+01 4.1% 1.82E+01 1.9% 4.22E+00 0.4%
1.03E+03 100.0% 2.11E+02 20.4% 1.11E+02 10.8% 1.22E+01 1.2% 2.10E+01 2.0% 1.24E+02 12.0% 2.82E+02 27.2% 1.92E+02 18.6% 5.85E+01 5.7% 2.28E+01 2.2% 4.69E+00 0.5%
1.56E+03 100.0% 2.54E+02 16.3% 3.38E+02 21.7% 1.28E+01 0.8% 3.26E+01 2.1% 1.96E+02 12.5% 4.46E+02 28.5% 1.65E+02 10.5% 1.15E+02 7.4% 3.66E+01 2.3% 4.37E+00 0.3%

39
Table 10E. Per Capita Intake of Total Foods and Major Food Groups and Percent of Total Food Intake for Individuals with Low-End, Mid-Range, and High-end Total Meat Intake
Age <1 Year (g/kg/day)
Food Group Low-end Total Meat consumers Mid-range Total Meat consumers High-end Total Meat consumers
Sample Size = 173 Sample Size = 147 Sample Size = 130 Intake Percent Intake Percent Intake Percent
Total Foods Total Dairy Total Meats Total Fish Total Eggs Total Grains Total Vegetables Total Fruits Total Fats Total Soy Total Nuts
2.26E+01 100.0% 7.87E+00 34.9% 0.00E+00 0.0% 0.00E+00 0.0% 1.18E-02 0.1% 1.13E+00 5.0% 4.06E+00 18.0% 5.82E+00 25.8% 3.48E+00 15.4% 8.88E-01 3.9% 0.00E+00 0.0%
2.64E+01 100.0% 9.49E+00 35.9% 0.00E+00 0.0% 9.46E-04 0.0% 9.34E-02 0.4% 1.03E+00 3.9% 4.88E+00 18.4% 6.56E+00 24.8% 4.22E+00 16.0% 1.05E+00 4.0% 1.04E-04 0.0%
8.05E+01 100.0% 2.79E+01 34.6% 7.05E+00 8.8% 3.68E-02 0.0% 1.10E+00 1.4% 4.83E+00 6.0% 1.25E+01 15.5% 2.31E+01 28.7% 4.15E+00 5.2% 9.03E-01 1.1% 2.29E-02 0.0%
Table 10F. Per Capita Intake of Total Foods and Major Food Groups and Percent of Total Food Intake for Individuals with Low-End, Mid-Range, and High-end Total Meat In take
Age <1 Year (g/day)
Food Group Low-end Total Meat consumers Mid-range Total Meat consumers High-end Total Meat consumers
Sample Size = 160 Sample Size = 146 Sample Size = 131 Intake Percent Intake Percent Intake Percent
Total Foods Total Dairy Total Meats Total Fish Total Eggs Total Grains Total Vegetables Total Fruits Total Fats Total Soy Total Nuts
1.46E+02 100.0% 4.84E+01 33.1% 0.00E+00 0.0% 0.00E+00 0.0% 9.23E-02 0.1% 9.57E+00 6.5% 2.55E+01 17.5% 3.95E+01 27.0% 2.14E+01 14.7% 5.69E+00 3.9% 0.00E+00 0.0%
1.86E+02 100.0% 6.25E+01 33.5% 0.00E+00 0.0% 8.51E-03 0.0% 8.60E-01 0.5% 8.21E+00 4.4% 3.53E+01 18.9% 5.27E+01 28.3% 2.58E+01 13.9% 6.36E+00 3.4% 9.74E-04 0.0%
7.77E+02 100.0% 2.85E+02 36.7% 6.61E+01 8.5% 4.55E-01 0.1% 1.14E+01 1.5% 4.60E+01 5.9% 1.17E+02 15.1% 2.12E+02 27.3% 3.97E+01 5.1% 8.60E+00 1.1% 2.35E-01 0.0%

40
Table 10G. Per Capita Intake of Total Foods and Major Food Groups and Percent of Total Food Intake for Individuals with Low-End, Mid-Range, and High-end Total Meat Intake
Age 1-2 Years (g/kg/day)
Food Group Low-end Total Meat consumers Mid-range Total Meat consumers High-end Total Meat consumers
Sample Size = 195 Sample Size = 215 Sample Size = 215 Intake Percent Intake Percent Intake Percent
Total Foods Total Dairy Total Meats Total Fish Total Eggs Total Grains Total Vegetables Total Fruits Total Fats Total Soy Total Nuts
7.96E+01 100.0% 3.96E+01 49.7% 2.89E-01 0.4% 2.25E-01 0.3% 7.89E-01 1.0% 4.94E+00 6.2% 8.41E+00 10.6% 2.18E+01 27.4% 2.48E+00 3.1% 5.82E-01 0.7% 2.47E-01 0.3%
7.67E+01 100.0% 3.23E+01 42.1% 3.57E+00 4.6% 2.06E-01 0.3% 1.19E+00 1.6% 5.50E+00 7.2% 9.53E+00 12.4% 2.07E+01 27.1% 2.96E+00 3.9% 8.64E-01 1.1% 2.34E-01 0.3%
9.66E+01 100.0% 3.58E+01 37.0% 1.06E+01 10.9% 3.53E-01 0.4% 1.84E+00 1.9% 7.11E+00 7.4% 1.53E+01 15.8% 2.09E+01 21.7% 4.71E+00 4.9% 1.21E+00 1.2% 1.99E-01 0.2%
Table 10H. Per Capita Intake of Total Foods and Major Food Groups and Percent of Total Food Intake for Individuals with Low-End, Mid-Range, and High-end Total Meat Intake
Age 1-2 Years (g/day)
Food Group Low-end Total Meat consumers Mid-range Total Meat consumers High-end Total Meat consumers
Sample Size = 195 Sample Size = 203 Sample Size = 200 Intake Percent Intake Percent Intake Percent
Total Foods Total Dairy Total Meats Total Fish Total Eggs Total Grains Total Vegetables Total Fruits Total Fats Total Soy Total Nuts
9.27E+02 100.0% 4.69E+02 50.6% 3.48E+00 0.4% 3.01E+00 0.3% 9.68E+00 1.0% 5.70E+01 6.1% 9.40E+01 10.1% 2.50E+02 27.0% 2.86E+01 3.1% 6.58E+00 0.7% 2.90E+00 0.3%
1.01E+03 100.0% 4.41E+02 43.6% 4.54E+01 4.5% 2.63E+00 0.3% 1.62E+01 1.6% 7.01E+01 6.9% 1.26E+02 12.4% 2.60E+02 25.8% 3.89E+01 3.9% 1.18E+01 1.2% 2.88E+00 0.3%
1.17E+03 100.0% 3.93E+02 33.5% 1.39E+02 11.8% 4.06E+00 0.3% 2.35E+01 2.0% 8.76E+01 7.5% 1.98E+02 16.9% 2.67E+02 22.8% 5.98E+01 5.1% 1.62E+01 1.4% 2.43E+00 0.2%

41
Table 10I. Per Capita Intake of Total Foods and Major Food Groups and Percent of Total Food Intake for Individuals with Low-End, Mid-Range, and High-end Total Meat Intake
Age 3-5 Years (g/kg/day)
Food Group Low-end Total Meat consumers Mid-range Total Meat consumers High-end Total Meat consumers
Sample Size = 431 Sample Size = 368 Sample Size = 449 Intake Percent Intake Percent Intake Percent
Total Foods Total Dairy Total Meats Total Fish Total Eggs Total Grains Total Vegetables Total Fruits Total Fats Total Soy Total Nuts
5.67E+01 100.0% 2.38E+01 42.1% 5.61E-01 1.0% 3.45E-01 0.6% 5.60E-01 1.0% 5.63E+00 9.9% 7.36E+00 13.0% 1.48E+01 26.1% 2.06E+00 3.6% 7.96E-01 1.4% 4.57E-01 0.8%
5.91E+01 100.0% 2.26E+01 38.2% 3.57E+00 6.0% 2.93E-01 0.5% 8.09E-01 1.4% 5.62E+00 9.5% 9.32E+00 15.8% 1.30E+01 22.0% 2.82E+00 4.8% 9.56E-01 1.6% 2.72E-01 0.5%
7.41E+01 100.0% 2.32E+01 31.3% 9.94E+00 13.4% 2.08E-01 0.3% 1.45E+00 2.0% 6.95E+00 9.4% 1.30E+01 17.5% 1.49E+01 20.1% 4.26E+00 5.7% 1.26E+00 1.7% 2.65E-01 0.4%
Table 10J. Per Capita Intake of Total Foods and Major Food Groups and Percent of Total Food Intake for Individuals with Low-End, Mid-Range, and High-end Total Meat Intake
Age 3-5 Years (g/day)
Food Group Low-end Total Meat consumers Mid-range Total Meat consumers High-end Total Meat consumers
Sample Size = 436 Sample Size = 396 Sample Size = 403 Intake Percent Intake Percent Intake Percent
Total Foods Total Dairy Total Meats Total Fish Total Eggs Total Grains Total Vegetables Total Fruits Total Fats Total Soy Total Nuts
9.91E+02 100.0% 4.19E+02 42.3% 9.67E+00 1.0% 7.08E+00 0.7% 9.90E+00 1.0% 9.80E+01 9.9% 1.28E+02 13.0% 2.57E+02 25.9% 3.54E+01 3.6% 1.38E+01 1.4% 7.98E+00 0.8%
1.04E+03 100.0% 3.76E+02 36.3% 6.51E+01 6.3% 5.57E+00 0.5% 1.60E+01 1.5% 1.01E+02 9.8% 1.70E+02 16.4% 2.38E+02 22.9% 4.83E+01 4.7% 1.72E+01 1.7% 4.91E+00 0.5%
1.25E+03 100.0% 3.89E+02 31.2% 1.76E+02 14.1% 4.09E+00 0.3% 2.38E+01 1.9% 1.17E+02 9.4% 2.17E+02 17.4% 2.43E+02 19.5% 7.35E+01 5.9% 2.21E+01 1.8% 4.35E+00 0.3%

42
Table 10K. Per Capita Intake of Total Foods and Major Food Groups and Percent of Total Food Intake for Individuals with Low-End, Mid-Range, and High-end Total Meat Intake
Age 6-11 Years (g/kg/day)
Food Group Low-end Total Meat consumers Mid-range Total Meat consumers High-end Total Meat consumers
Sample Size = 164 Sample Size = 179 Sample Size = 223 Intake Percent Intake Percent Intake Percent
Total Foods Total Dairy Total Meats Total Fish Total Eggs Total Grains Total Vegetables Total Fruits Total Fats Total Soy Total Nuts
3.40E+01 100.0% 1.36E+01 39.9% 3.87E-01 1.1% 2.40E-01 0.7% 4.21E-01 1.2% 3.85E+00 11.3% 5.37E+00 15.8% 7.73E+00 22.8% 1.28E+00 3.8% 5.19E-01 1.5% 2.86E-01 0.8%
3.58E+01 100.0% 1.32E+01 37.0% 2.59E+00 7.2% 2.77E-01 0.8% 5.14E-01 1.4% 4.02E+00 11.2% 7.26E+00 20.3% 5.11E+00 14.3% 1.91E+00 5.3% 6.68E-01 1.9% 1.33E-01 0.4%
5.04E+01 100.0% 1.53E+01 30.4% 7.25E+00 14.4% 1.64E-01 0.3% 6.89E-01 1.4% 5.19E+00 10.3% 9.99E+00 19.8% 8.41E+00 16.7% 2.99E+00 5.9% 9.42E-01 1.9% 1.54E-01 0.3%
Table 10L. Per Capita Intake of Total Foods and Major Food Groups and Percent of Total Food Intake for Individuals with Low-End, Mid-Range, and High-end Total Meat Intake
Age 6-11 Years (g/day)
Food Group Low-end Total Meat consumers Mid-range Total Meat consumers High-end Total Meat consumers
Sample Size = 175 Sample Size = 176 Sample Size = 191 Intake Percent Intake Percent Intake Percent
Total Foods Total Dairy Total Meats Total Fish Total Eggs Total Grains Total Vegetables Total Fruits Total Fats Total Soy Total Nuts
1.01E+03 100.0% 3.97E+02 39.2% 1.23E+01 1.2% 8.04E+00 0.8% 1.49E+01 1.5% 1.20E+02 11.9% 1.58E+02 15.6% 2.30E+02 22.7% 4.03E+01 4.0% 1.69E+01 1.7% 7.77E+00 0.8%
1.10E+03 100.0% 3.88E+02 35.2% 8.14E+01 7.4% 3.10E+00 0.3% 1.53E+01 1.4% 1.17E+02 10.6% 2.23E+02 20.2% 1.91E+02 17.3% 5.87E+01 5.3% 2.21E+01 2.0% 3.47E+00 0.3%
1.29E+03 100.0% 3.80E+02 29.5% 2.07E+02 16.1% 4.28E+00 0.3% 1.74E+01 1.4% 1.35E+02 10.5% 2.73E+02 21.2% 1.83E+02 14.3% 8.13E+01 6.3% 2.48E+01 1.9% 2.73E+00 0.2%

43
Table 10M. Per Capita Intake of Total Foods and Major Food Groups and Percent of Total Food Intake for Individuals with Low-End, Mid-Range, and High-end Total Meat Intake
Age 12-19 Years (g/kg/day)
Food Group Low-end Total Meat consumers Mid-range Total Meat consumers High-end Total Meat consumers
Sample Size = 130 Sample Size = 142 Sample Size = 138 Intake Percent Intake Percent Intake Percent
Total Foods Total Dairy Total Meats Total Fish Total Eggs Total Grains Total Vegetables Total Fruits Total Fats Total Soy Total Nuts
1.67E+01 100.0% 5.28E+00 31.6% 2.32E-01 1.4% 2.80E-01 1.7% 2.50E-01 1.5% 2.20E+00 13.2% 3.94E+00 23.6% 3.30E+00 19.7% 7.51E-01 4.5% 3.43E-01 2.1% 9.55E-02 0.6%
1.92E+01 100.0% 4.79E+00 25.0% 1.88E+00 9.8% 1.92E-01 1.0% 3.69E-01 1.9% 2.24E+00 11.7% 4.86E+00 25.3% 3.39E+00 17.7% 1.16E+00 6.0% 4.75E-01 2.5% 5.55E-02 0.3%
3.09E+01 100.0% 7.66E+00 24.8% 5.36E+00 17.4% 1.02E-01 0.3% 4.33E-01 1.4% 3.33E+00 10.8% 7.90E+00 25.6% 4.09E+00 13.2% 2.01E+00 6.5% 6.11E-01 2.0% 5.16E-02 0.2%
Table 10N. Per Capita Intake of Total Foods and Major Food Groups and Percent of Total Food Intake for Individuals with Low-End, Mid-Range, and High-end Total Meat Intake
Age 12-19 Years (g/day)
Food Group Low-end Total Meat consumers Mid-range Total Meat consumers High-end Total Meat consumers
Sample Size = 130 Sample Size = 128 Sample Size = 137 Intake Percent Intake Percent Intake Percent
Total Foods Total Dairy Total Meats Total Fish Total Eggs Total Grains Total Vegetables Total Fruits Total Fats Total Soy Total Nuts
9.93E+02 100.0% 3.30E+02 33.2% 1.37E+01 1.4% 1.58E+01 1.6% 1.56E+01 1.6% 1.31E+02 13.2% 2.26E+02 22.7% 1.87E+02 18.8% 4.44E+01 4.5% 2.02E+01 2.0% 6.52E+00 0.7%
1.21E+03 100.0% 3.53E+02 29.0% 1.11E+02 9.1% 7.59E+00 0.6% 1.86E+01 1.5% 1.47E+02 12.1% 2.87E+02 23.7% 2.00E+02 16.4% 7.09E+01 5.8% 2.75E+01 2.3% 4.34E+00 0.4%
1.76E+03 100.0% 4.00E+02 22.7% 3.30E+02 18.7% 8.38E+00 0.5% 2.86E+01 1.6% 2.00E+02 11.4% 4.77E+02 27.0% 1.96E+02 11.1% 1.26E+02 7.2% 4.05E+01 2.3% 4.30E+00 0.2%

44
Table 11A. Per Capita Intake of Total Foods and Major Food Groups and Percent of Total Food Intake for Individuals with Low-End, Mid-Range, and High-end Total Meat and Dairy Intake
All Age Groups Combined (g/kg/day)
Food Group Low-end Total Meat and Dairy consumers Mid-range Total Meat and Dairy consumers High-end Total Meat and Dairy consumers
Sample Size = 1632 Sample Size = 1381 Sample Size = 5584 Intake Percent Intake Percent Intake Percent
Total Foods Total Dairy Total Meats Total Fish Total Eggs Total Grains Total Vegetables Total Fruits Total Fats Total Soy Total Nuts
9.81E+00 100.0% 3.87E-01 3.9% 6.73E-01 6.9% 2.49E-01 2.5% 2.56E-01 2.6% 1.33E+00 13.6% 3.45E+00 35.2% 2.63E+00 26.8% 5.57E-01 5.7% 2.66E-01 2.7% 4.69E-02 0.5%
1.64E+01 100.0% 3.00E+00 18.3% 1.94E+00 11.8% 1.71E-01 1.0% 3.36E-01 2.0% 2.02E+00 12.3% 4.60E+00 28.0% 3.13E+00 19.0% 9.55E-01 5.8% 3.58E-01 2.2% 6.51E-02 0.4%
6.60E+01 100.0% 2.98E+01 45.1% 3.93E+00 6.0% 2.64E-01 0.4% 8.32E-01 1.3% 5.33E+00 8.1% 9.07E+00 13.7% 1.31E+01 19.8% 2.92E+00 4.4% 8.66E-01 1.3% 2.41E-01 0.4%
Table 11B. Per Capita Intake of Total Foods and Major Food Groups and Percent of Total Food Intake for Individuals with Low-End, Mid-Range, and High-end Total Meat and Dairy Intake
All Age Groups Combined (g/day)
Food Group Low-end Total Meat and Dairy consumers Mid-range Total Meat and Dairy consumers High-end Total Meat and Dairy consumers
Sample Size = 2502 Sample Size = 1818 Sample Size = 2148 Intake Percent Intake Percent Intake Percent
Total Foods Total Dairy Total Meats Total Fish Total Eggs Total Grains Total Vegetables Total Fruits Total Fats Total Soy Total Nuts
6.23E+02 100.0% 2.99E+01 4.8% 4.06E+01 6.5% 1.66E+01 2.7% 1.68E+01 2.7% 8.79E+01 14.1% 2.09E+02 33.5% 1.73E+02 27.7% 3.32E+01 5.3% 1.62E+01 2.6% 2.79E+00 0.4%
1.06E+03 100.0% 1.96E+02 18.5% 1.27E+02 12.0% 1.24E+01 1.2% 2.15E+01 2.0% 1.31E+02 12.3% 2.99E+02 28.2% 1.93E+02 18.2% 6.29E+01 5.9% 2.40E+01 2.3% 4.33E+00 0.4%
1.86E+03 100.0% 7.97E+02 42.7% 1.77E+02 9.5% 1.33E+01 0.7% 2.48E+01 1.3% 1.72E+02 9.2% 3.41E+02 18.3% 2.22E+02 11.9% 9.43E+01 5.1% 2.94E+01 1.6% 6.15E+00 0.3%

45
Table 11C. Per Capita Intake of Total Foods and Major Food Groups and Percent of Total Food Intake for Individuals with Low-End, Mid-Range, and High-end Total Meat and Dairy Intake
Age 20+ Years (g/kg/day)
Food Group Low-end Total Meat and Dairy consumers Mid-range Total Meat and Dairy consumers High-end Total Meat and Dairy consumers
Sample Size = 947 Sample Size = 931 Sample Size = 833 Intake Percent Intake Percent Intake Percent
Total Foods Total Dairy Total Meats Total Fish Total Eggs Total Grains Total Vegetables Total Fruits Total Fats Total Soy Total Nuts
9.16E+00 100.0% 3.54E-01 3.9% 6.22E-01 6.8% 2.82E-01 3.1% 2.55E-01 2.8% 1.33E+00 14.5% 3.21E+00 35.0% 2.39E+00 26.1% 4.63E-01 5.1% 2.32E-01 2.5% 4.47E-02 0.5%
1.42E+01 100.0% 2.15E+00 15.2% 1.80E+00 12.7% 1.95E-01 1.4% 3.02E-01 2.1% 1.83E+00 12.9% 4.25E+00 29.9% 2.57E+00 18.1% 8.55E-01 6.0% 3.30E-01 2.3% 5.87E-02 0.4%
2.59E+01 100.0% 9.71E+00 37.6% 2.69E+00 10.4% 2.49E-01 1.0% 3.95E-01 1.5% 2.54E+00 9.8% 5.25E+00 20.3% 3.38E+00 13.1% 1.31E+00 5.1% 4.22E-01 1.6% 7.23E-02 0.3%
Table 11D. Per Capita Intake of Total Foods and Major Food Groups and Percent of Total Food Intake for Individuals with Low-End, Mid-Range, and High-end Total Meat and Dairy Intake
Age 20+ Years (g/day)
Food Group Low-end Total Meat and Dairy consumers Mid-range Total Meat and Dairy consumers High-end Total Meat and Dairy consumers
Sample Size = 902 Sample Size = 909 Sample Size = 875 Intake Percent Intake Percent Intake Percent
Total Foods Total Dairy Total Meats Total Fish Total Eggs Total Grains Total Vegetables Total Fruits Total Fats Total Soy Total Nuts
6.79E+02 100.0% 2.75E+01 4.1% 4.47E+01 6.6% 2.08E+01 3.1% 1.90E+01 2.8% 9.92E+01 14.6% 2.36E+02 34.7% 1.79E+02 26.3% 3.38E+01 5.0% 1.73E+01 2.6% 3.01E+00 0.4%
1.05E+03 100.0% 1.57E+02 14.9% 1.36E+02 12.9% 1.36E+01 1.3% 2.23E+01 2.1% 1.31E+02 12.5% 3.19E+02 30.3% 1.90E+02 18.1% 6.47E+01 6.1% 2.53E+01 2.4% 4.12E+00 0.4%
1.86E+03 100.0% 6.96E+02 37.5% 2.08E+02 11.2% 1.69E+01 0.9% 2.85E+01 1.5% 1.85E+02 10.0% 3.85E+02 20.7% 2.15E+02 11.6% 9.95E+01 5.4% 3.20E+01 1.7% 6.23E+00 0.3%

46
Table 11E. Per Capita Intake of Total Foods and Major Food Groups and Percent of Total Food Intake for Individuals with Low-End, Mid-Range, and High-end Total Meat and Dairy Intake
Age <1 Year (g/kg/day)
Food Group Low-end Total Meat and Dairy consumers Mid-range Total Meat and Dairy consumers High-end Total Meat and Dairy consumers
Sample Size = 142 Sample Size = 148 Sample Size = 137 Intake Percent Intake Percent Intake Percent
Total Foods Total Dairy Total Meats Total Fish Total Eggs Total Grains Total Vegetables Total Fruits Total Fats Total Soy Total Nuts
1.38E+01 100.0% 0.00E+00 0.0% 0.00E+00 0.0% 0.00E+00 0.0% 0.00E+00 0.0% 5.03E-01 3.6% 5.60E+00 40.6% 5.05E+00 36.6% 1.99E+00 14.4% 7.80E-01 5.7% 0.00E+00 0.0%
3.39E+01 100.0% 7.95E+00 23.4% 1.07E+00 3.2% 3.10E-02 0.1% 2.19E-01 0.6% 2.29E+00 6.7% 5.61E+00 16.5% 1.31E+01 38.6% 3.55E+00 10.5% 9.37E-01 2.8% 3.50E-02 0.1%
1.00E+02 100.0% 5.79E+01 57.8% 3.58E+00 3.6% 3.09E-02 0.0% 7.33E-01 0.7% 4.13E+00 4.1% 8.94E+00 8.9% 1.85E+01 18.4% 6.06E+00 6.0% 1.12E+00 1.1% 3.46E-02 0.0%
Table 11F. Per Capita Intake of Total Foods and Major Food Groups and Percent of Total Food Intake for Individuals with Low-End, Mid-Range, and High-end Total Meat and Dairy Intake
Age <1 Year (g/day)
Food Group Low-end Total Meat and Dairy consumers Mid-range Total Meat and Dairy consumers High-end Total Meat and Dairy consumers
Sample Size = 142 Sample Size = 148 Sample Size = 138 Intake Percent Intake Percent Intake Percent
Total Foods Total Dairy Total Meats Total Fish Total Eggs Total Grains Total Vegetables Total Fruits Total Fats Total Soy Total Nuts
9.47E+01 100.0% 0.00E+00 0.0% 0.00E+00 0.0% 0.00E+00 0.0% 0.00E+00 0.0% 3.74E+00 4.0% 3.70E+01 39.1% 3.73E+01 39.4% 1.26E+01 13.3% 4.84E+00 5.1% 0.00E+00 0.0%
2.24E+02 100.0% 6.36E+01 28.4% 5.43E+00 2.4% 2.66E-02 0.0% 9.87E-01 0.4% 1.11E+01 5.0% 3.61E+01 16.1% 7.76E+01 34.7% 2.85E+01 12.7% 7.46E+00 3.3% 2.63E-02 0.0%
9.87E+02 100.0% 5.28E+02 53.5% 3.99E+01 4.0% 6.42E-01 0.1% 1.12E+01 1.1% 4.73E+01 4.8% 1.06E+02 10.7% 2.08E+02 21.1% 4.21E+01 4.3% 7.70E+00 0.8% 3.44E-01 0.0%

47
Table 11G. Per Capita Intake of Total Foods and Major Food Groups and Percent of Total Food Intake for Individuals with Low-End, Mid-Range, and High-end Total Meat and Dairy Intake
Age 1-2 Years (g/kg/day)
Food Group Low-end Total Meat and Dairy consumers Mid-range Total Meat and Dairy consumers High-end Total Meat and Dairy consumers
Sample Size = 184 Sample Size = 197 Sample Size = 201 Intake Percent Intake Percent Intake Percent
Total Foods Total Dairy Total Meats Total Fish Total Eggs Total Grains Total Vegetables Total Fruits Total Fats Total Soy Total Nuts
4.90E+01 100.0% 3.92E+00 8.0% 3.07E+00 6.3% 1.57E-01 0.3% 1.31E+00 2.7% 5.19E+00 10.6% 1.12E+01 22.9% 2.10E+01 42.9% 2.33E+00 4.8% 9.43E-01 1.9% 2.31E-01 0.5%
7.81E+01 100.0% 3.02E+01 38.7% 4.25E+00 5.4% 2.25E-01 0.3% 1.15E+00 1.5% 5.94E+00 7.6% 1.02E+01 13.1% 2.23E+01 28.6% 3.04E+00 3.9% 9.05E-01 1.2% 2.04E-01 0.3%
1.38E+02 100.0% 9.17E+01 66.4% 4.47E+00 3.2% 2.74E-01 0.2% 1.27E+00 0.9% 5.65E+00 4.1% 1.02E+01 7.4% 1.94E+01 14.0% 4.76E+00 3.4% 7.99E-01 0.6% 1.41E-01 0.1%
Table 11H. Per Capita Intake of Total Foods and Major Food Groups and Percent of Total Food Intake for Individuals with Low-End, Mid-Range, and High-end Total Meat and Dairy Intake
Age 1-2 Years (g/day)
Food Group Low-end Total Meat and Dairy consumers Mid-range Total Meat and Dairy consumers High-end Total Meat and Dairy consumers
Sample Size = 191 Sample Size = 205 Sample Size = 199 Intake Percent Intake Percent Intake Percent
Total Foods Total Dairy Total Meats Total Fish Total Eggs Total Grains Total Vegetables Total Fruits Total Fats Total Soy Total Nuts
6.09E+02 100.0% 5.18E+01 8.5% 3.64E+01 6.0% 2.87E+00 0.5% 1.62E+01 2.7% 6.58E+01 10.8% 1.38E+02 22.6% 2.59E+02 42.6% 2.89E+01 4.8% 1.17E+01 1.9% 2.83E+00 0.5%
1.02E+03 100.0% 3.94E+02 38.5% 5.40E+01 5.3% 4.03E+00 0.4% 1.62E+01 1.6% 7.77E+01 7.6% 1.35E+02 13.1% 2.91E+02 28.5% 3.95E+01 3.9% 1.21E+01 1.2% 3.33E+00 0.3%
1.62E+03 100.0% 1.06E+03 65.1% 5.36E+01 3.3% 2.94E+00 0.2% 1.65E+01 1.0% 6.93E+01 4.3% 1.22E+02 7.5% 2.39E+02 14.8% 5.63E+01 3.5% 1.02E+01 0.6% 2.48E+00 0.2%

48
Table 11I. Per Capita Intake of Total Foods and Major Food Groups and Percent of Total Food Intake for Individuals with Low-End, Mid-Range, and High-end Total Meat and Dairy Intake
Age 3-5 Years (g/kg/day)
Food Group Low-end Total Meat and Dairy consumers Mid-range Total Meat and Dairy consumers High-end Total Meat and Dairy consumers
Sample Size = 371 Sample Size = 439 Sample Size = 453 Intake Percent Intake Percent Intake Percent
Total Foods Total Dairy Total Meats Total Fish Total Eggs Total Grains Total Vegetables Total Fruits Total Fats Total Soy Total Nuts
3.89E+01 100.0% 4.22E+00 10.8% 2.97E+00 7.6% 3.28E-01 0.8% 8.72E-01 2.2% 4.67E+00 12.0% 8.83E+00 22.7% 1.41E+01 36.1% 1.98E+00 5.1% 8.44E-01 2.2% 2.43E-01 0.6%
5.90E+01 100.0% 1.98E+01 33.6% 4.19E+00 7.1% 2.20E-01 0.4% 9.34E-01 1.6% 5.91E+00 10.0% 9.51E+00 16.1% 1.48E+01 25.0% 2.80E+00 4.7% 9.56E-01 1.6% 2.79E-01 0.5%
9.74E+01 100.0% 5.17E+01 53.1% 5.11E+00 5.2% 2.77E-01 0.3% 9.69E-01 1.0% 7.06E+00 7.2% 1.14E+01 11.7% 1.58E+01 16.2% 3.98E+00 4.1% 1.06E+00 1.1% 4.17E-01 0.4%
Table 11J. Per Capita Intake of Total Foods and Major Food Groups and Percent of Total Food Intake for Individuals with Low-End, Mid-Range, and High-end Total Meat and Dairy Intake
Age 3-5 Years (g/day)
Food Group Low-end Total Meat and Dairy consumers Mid-range Total Meat and Dairy consumers High-end Total Meat and Dairy consumers
Sample Size = 391 Sample Size = 414 Sample Size = 419 Intake Percent Intake Percent Intake Percent
Total Foods Total Dairy Total Meats Total Fish Total Eggs Total Grains Total Vegetables Total Fruits Total Fats Total Soy Total Nuts
7.02E+02 100.0% 7.52E+01 10.7% 5.23E+01 7.5% 5.03E+00 0.7% 1.55E+01 2.2% 8.46E+01 12.0% 1.59E+02 22.6% 2.58E+02 36.7% 3.53E+01 5.0% 1.53E+01 2.2% 4.18E+00 0.6%
1.04E+03 100.0% 3.52E+02 33.8% 7.89E+01 7.6% 5.37E+00 0.5% 1.61E+01 1.5% 1.07E+02 10.2% 1.67E+02 16.0% 2.51E+02 24.1% 5.12E+01 4.9% 1.67E+01 1.6% 4.85E+00 0.5%
1.65E+03 100.0% 8.78E+02 53.3% 8.82E+01 5.4% 5.10E+00 0.3% 1.90E+01 1.2% 1.21E+02 7.3% 1.91E+02 11.6% 2.59E+02 15.8% 6.75E+01 4.1% 1.86E+01 1.1% 7.12E+00 0.4%

49
Table 11K. Per Capita Intake of Total Foods and Major Food Groups and Percent of Total Food Intake for Individuals with Low-End, Mid-Range, and High-end Total Meat and Dairy Intake
Age 6-11 Years (g/kg/day)
Food Group Low-end Total Meat and Dairy consumers Mid-range Total Meat and Dairy consumers High-end Total Meat and Dairy consumers
Sample Size = 147 Sample Size = 183 Sample Size = 221 Intake Percent Intake Percent Intake Percent
Total Foods Total Dairy Total Meats Total Fish Total Eggs Total Grains Total Vegetables Total Fruits Total Fats Total Soy Total Nuts
2.05E+01 100.0% 2.28E+00 11.1% 1.82E+00 8.9% 1.74E-01 0.8% 5.32E-01 2.6% 2.81E+00 13.7% 5.72E+00 27.8% 5.54E+00 27.0% 1.22E+00 5.9% 5.40E-01 2.6% 1.20E-01 0.6%
3.59E+01 100.0% 1.17E+01 32.6% 3.19E+00 8.9% 1.98E-01 0.6% 6.59E-01 1.8% 4.10E+00 11.4% 7.10E+00 19.8% 6.26E+00 17.4% 2.00E+00 5.6% 6.82E-01 1.9% 1.30E-01 0.4%
6.59E+01 100.0% 3.32E+01 50.4% 3.99E+00 6.1% 2.21E-01 0.3% 6.35E-01 1.0% 6.06E+00 9.2% 9.49E+00 14.4% 8.32E+00 12.6% 2.95E+00 4.5% 9.12E-01 1.4% 2.71E-01 0.4%
Table 11L. Per Capita Intake of Total Foods and Major Food Groups and Percent of Total Food Intake for Individuals with Low-End, Mid-Range, and High-end Total Meat and Dairy Intake
Age 6-11 Years (g/day)
Food Group Low-end Total Meat and Dairy consumers Mid-range Total Meat and Dairy consumers High-end Total Meat and Dairy consumers
Sample Size = 166 Sample Size = 194 Sample Size = 167 Intake Percent Intake Percent Intake Percent
Total Foods Total Dairy Total Meats Total Fish Total Eggs Total Grains Total Vegetables Total Fruits Total Fats Total Soy Total Nuts
7.52E+02 100.0% 7.31E+01 9.7% 6.59E+01 8.8% 5.47E+00 0.7% 1.74E+01 2.3% 1.03E+02 13.6% 2.09E+02 27.8% 2.18E+02 29.0% 4.39E+01 5.8% 2.00E+01 2.7% 4.00E+00 0.5%
1.06E+03 100.0% 3.55E+02 33.4% 9.52E+01 9.0% 6.77E+00 0.6% 1.55E+01 1.5% 1.20E+02 11.3% 2.09E+02 19.7% 1.81E+02 17.0% 5.88E+01 5.5% 1.94E+01 1.8% 4.68E+00 0.4%
1.72E+03 100.0% 8.69E+02 50.5% 1.07E+02 6.2% 6.06E+00 0.4% 1.82E+01 1.1% 1.53E+02 8.9% 2.46E+02 14.3% 2.21E+02 12.8% 7.35E+01 4.3% 2.31E+01 1.3% 5.82E+00 0.3%
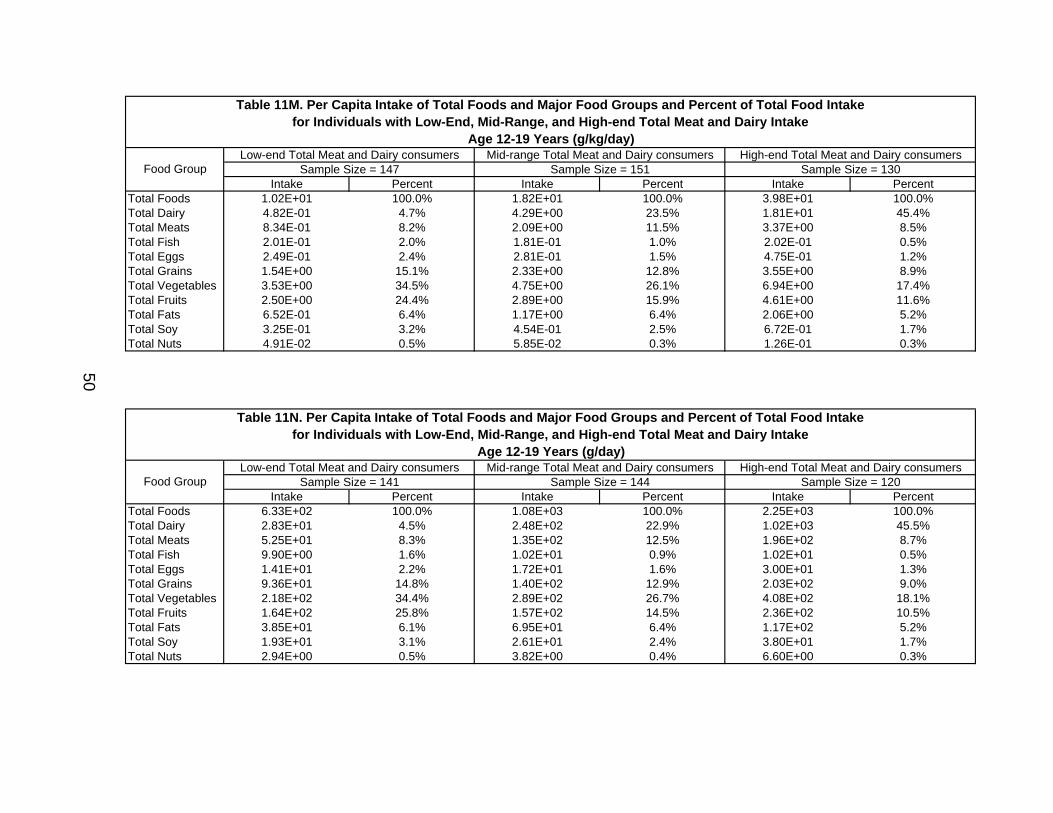
50
Table 11M. Per Capita Intake of Total Foods and Major Food Groups and Percent of Total Food Intake for Individuals with Low-End, Mid-Range, and High-end Total Meat and Dairy Intake
Age 12-19 Years (g/kg/day)
Food Group Low-end Total Meat and Dairy consumers Mid-range Total Meat and Dairy consumers High-end Total Meat and Dairy consumers
Sample Size = 147 Sample Size = 151 Sample Size = 130 Intake Percent Intake Percent Intake Percent
Total Foods Total Dairy Total Meats Total Fish Total Eggs Total Grains Total Vegetables Total Fruits Total Fats Total Soy Total Nuts
1.02E+01 100.0% 4.82E-01 4.7% 8.34E-01 8.2% 2.01E-01 2.0% 2.49E-01 2.4% 1.54E+00 15.1% 3.53E+00 34.5% 2.50E+00 24.4% 6.52E-01 6.4% 3.25E-01 3.2% 4.91E-02 0.5%
1.82E+01 100.0% 4.29E+00 23.5% 2.09E+00 11.5% 1.81E-01 1.0% 2.81E-01 1.5% 2.33E+00 12.8% 4.75E+00 26.1% 2.89E+00 15.9% 1.17E+00 6.4% 4.54E-01 2.5% 5.85E-02 0.3%
3.98E+01 100.0% 1.81E+01 45.4% 3.37E+00 8.5% 2.02E-01 0.5% 4.75E-01 1.2% 3.55E+00 8.9% 6.94E+00 17.4% 4.61E+00 11.6% 2.06E+00 5.2% 6.72E-01 1.7% 1.26E-01 0.3%
Table 11N. Per Capita Intake of Total Foods and Major Food Groups and Percent of Total Food Intake for Individuals with Low-End, Mid-Range, and High-end Total Meat and Dairy Intake
Age 12-19 Years (g/day)
Food Group Low-end Total Meat and Dairy consumers Mid-range Total Meat and Dairy consumers High-end Total Meat and Dairy consumers
Sample Size = 141 Sample Size = 144 Sample Size = 120 Intake Percent Intake Percent Intake Percent
Total Foods Total Dairy Total Meats Total Fish Total Eggs Total Grains Total Vegetables Total Fruits Total Fats Total Soy Total Nuts
6.33E+02 100.0% 2.83E+01 4.5% 5.25E+01 8.3% 9.90E+00 1.6% 1.41E+01 2.2% 9.36E+01 14.8% 2.18E+02 34.4% 1.64E+02 25.8% 3.85E+01 6.1% 1.93E+01 3.1% 2.94E+00 0.5%
1.08E+03 100.0% 2.48E+02 22.9% 1.35E+02 12.5% 1.02E+01 0.9% 1.72E+01 1.6% 1.40E+02 12.9% 2.89E+02 26.7% 1.57E+02 14.5% 6.95E+01 6.4% 2.61E+01 2.4% 3.82E+00 0.4%
2.25E+03 100.0% 1.02E+03 45.5% 1.96E+02 8.7% 1.02E+01 0.5% 3.00E+01 1.3% 2.03E+02 9.0% 4.08E+02 18.1% 2.36E+02 10.5% 1.17E+02 5.2% 3.80E+01 1.7% 6.60E+00 0.3%

51
Table 12A. Per Capita Intake of Total Foods and Major Food Groups and Percent of Total Food Intake for Individuals with Low-End, Mid-Range, and High-end Total Fish Intake
All Age Groups Combined (g/kg/day)
Food Group Low-end Total Fish consumers Mid-range Total Fish consumers High-end Total Fish consumers
Sample Size = 2106 Sample Size = 2217 Sample Size = 1968 Intake Percent Intake Percent Intake Percent
Total Foods Total Dairy Total Meats Total Fish Total Eggs Total Grains Total Vegetables Total Fruits Total Fats Total Soy Total Nuts
2.39E+01 100.0% 6.82E+00 28.5% 2.34E+00 9.8% 0.00E+00 0.0% 4.65E-01 1.9% 2.56E+00 10.7% 5.29E+00 22.1% 4.86E+00 20.3% 1.30E+00 5.4% 4.38E-01 1.8% 7.47E-02 0.3%
2.09E+01 100.0% 5.92E+00 28.4% 2.28E+00 10.9% 0.00E+00 0.0% 3.97E-01 1.9% 2.17E+00 10.4% 5.05E+00 24.2% 3.49E+00 16.7% 1.22E+00 5.8% 4.20E-01 2.0% 8.77E-02 0.4%
2.63E+01 100.0% 7.06E+00 26.8% 1.90E+00 7.2% 1.51E+00 5.7% 4.70E-01 1.8% 2.70E+00 10.3% 5.72E+00 21.7% 5.22E+00 19.8% 1.31E+00 5.0% 5.34E-01 2.0% 8.28E-02 0.3%
Table 12B. Per Capita Intake of Total Foods and Major Food Groups and Percent of Total Food Intake for Individuals with Low-End, Mid-Range, and High-end Total Fish Intake
All Age Groups Combined (g/day)
Food Group Low-end Total Fish consumers Mid-range Total Fish consumers High-end Total Fish consumers
Sample Size = 2115 Sample Size = 2262 Sample Size = 1414 Intake Percent Intake Percent Intake Percent
Total Foods Total Dairy Total Meats Total Fish Total Eggs Total Grains Total Vegetables Total Fruits Total Fats Total Soy Total Nuts
1.11E+03 100.0% 2.60E+02 23.4% 1.30E+02 11.7% 0.00E+00 0.0% 2.39E+01 2.1% 1.31E+02 11.7% 2.82E+02 25.3% 2.09E+02 18.8% 6.21E+01 5.6% 2.19E+01 2.0% 3.61E+00 0.3%
1.05E+03 100.0% 2.49E+02 23.7% 1.33E+02 12.7% 0.00E+00 0.0% 2.21E+01 2.1% 1.20E+02 11.4% 2.86E+02 27.3% 1.58E+02 15.0% 6.38E+01 6.1% 2.30E+01 2.2% 5.02E+00 0.5%
1.32E+03 100.0% 2.64E+02 20.0% 1.17E+02 8.9% 9.28E+01 7.0% 2.64E+01 2.0% 1.47E+02 11.2% 3.38E+02 25.7% 2.36E+02 17.9% 7.23E+01 5.5% 3.11E+01 2.4% 3.95E+00 0.3%

52
Table 12C. Per Capita Intake of Total Foods and Major Food Groups and Percent of Total Food Intake for Individuals with Low-End, Mid-Range, and High-end Total Fish Intake
Age 20+ Years (g/kg/day)
Food Group Low-end Total Fish consumers Mid-range Total Fish consumers High-end Total Fish consumers
Sample Size = 879 Sample Size = 971 Sample Size = 906 Intake Percent Intake Percent Intake Percent
Total Foods Total Dairy Total Meats Total Fish Total Eggs Total Grains Total Vegetables Total Fruits Total Fats Total Soy Total Nuts
1.44E+01 100.0% 2.91E+00 20.2% 1.72E+00 11.9% 0.00E+00 0.0% 2.91E-01 2.0% 1.87E+00 13.0% 4.20E+00 29.1% 2.32E+00 16.1% 8.49E-01 5.9% 3.31E-01 2.3% 6.37E-02 0.4%
1.50E+01 100.0% 2.85E+00 19.1% 1.90E+00 12.7% 0.00E+00 0.0% 3.02E-01 2.0% 1.84E+00 12.3% 4.23E+00 28.3% 2.73E+00 18.2% 8.68E-01 5.8% 3.09E-01 2.1% 5.97E-02 0.4%
1.88E+01 100.0% 3.57E+00 19.0% 1.60E+00 8.5% 1.43E+00 7.6% 3.58E-01 1.9% 2.10E+00 11.2% 4.88E+00 26.0% 3.50E+00 18.7% 9.80E-01 5.2% 4.20E-01 2.2% 5.58E-02 0.3%
Table 12D. Per Capita Intake of Total Foods and Major Food Groups and Percent of Total Food Intake for Individuals with Low-End, Mid-Range, and High-end Total Fish Intake
Age 20+ Years (g/day)
Food Group Low-end Total Fish consumers Mid-range Total Fish consumers High-end Total Fish consumers
Sample Size = 878 Sample Size = 946 Sample Size = 915 Intake Percent Intake Percent Intake Percent
Total Foods Total Dairy Total Meats Total Fish Total Eggs Total Grains Total Vegetables Total Fruits Total Fats Total Soy Total Nuts
1.04E+03 100.0% 2.07E+02 20.0% 1.26E+02 12.1% 0.00E+00 0.0% 2.15E+01 2.1% 1.34E+02 12.9% 3.03E+02 29.2% 1.65E+02 15.9% 6.19E+01 6.0% 2.41E+01 2.3% 4.65E+00 0.4%
1.06E+03 100.0% 2.05E+02 19.3% 1.43E+02 13.4% 0.00E+00 0.0% 2.39E+01 2.2% 1.33E+02 12.5% 3.00E+02 28.3% 1.80E+02 16.9% 6.36E+01 6.0% 2.19E+01 2.1% 4.21E+00 0.4%
1.34E+03 100.0% 2.50E+02 18.7% 1.21E+02 9.1% 1.02E+02 7.7% 2.73E+01 2.0% 1.52E+02 11.4% 3.48E+02 26.0% 2.38E+02 17.8% 7.35E+01 5.5% 3.13E+01 2.3% 4.16E+00 0.3%

53
Table 12E. Per Capita Intake of Total Foods and Major Food Groups and Percent of Total Food Intake for Individuals with Low-End, Mid-Range, and High-end Total Fish Intake
Age <1 Year (g/kg/day)
Food Group Low-end Total Fish consumers Mid-range Total Fish consumers High-end Total Fish consumers
Sample Size = 141 Sample Size = 131 Sample Size = 151 Intake Percent Intake Percent Intake Percent
Total Foods Total Dairy Total Meats Total Fish Total Eggs Total Grains Total Vegetables Total Fruits Total Fats Total Soy Total Nuts
3.63E+01 100.0% 1.01E+01 27.9% 9.65E-01 2.7% 0.00E+00 0.0% 1.75E-01 0.5% 1.96E+00 5.4% 6.52E+00 18.0% 1.26E+01 34.6% 3.73E+00 10.3% 9.44E-01 2.6% 1.36E-02 0.0%
4.20E+01 100.0% 1.54E+01 36.7% 1.08E+00 2.6% 0.00E+00 0.0% 2.16E-01 0.5% 2.12E+00 5.0% 6.68E+00 15.9% 1.16E+01 27.6% 4.54E+00 10.8% 1.22E+00 2.9% 0.00E+00 0.0%
4.01E+01 100.0% 1.19E+01 29.5% 1.24E+00 3.1% 3.24E-01 0.8% 5.50E-01 1.4% 2.67E+00 6.7% 7.48E+00 18.6% 1.17E+01 29.1% 4.02E+00 10.0% 1.07E+00 2.7% 2.05E-02 0.1%
Table 12F. Per Capita Intake of Total Foods and Major Food Groups and Percent of Total Food Intake for Individuals with Low-End, Mid-Range, and High-end Total Fish Intake
Age <1 Year (g/day)
Food Group Low-end Total Fish consumers Mid-range Total Fish consumers High-end Total Fish consumers
Sample Size = 141 Sample Size = 145 Sample Size = 151 Intake Percent Intake Percent Intake Percent
Total Foods Total Dairy Total Meats Total Fish Total Eggs Total Grains Total Vegetables Total Fruits Total Fats Total Soy Total Nuts
2.99E+02 100.0% 7.83E+01 26.2% 9.19E+00 3.1% 0.00E+00 0.0% 1.85E+00 0.6% 1.82E+01 6.1% 5.39E+01 18.0% 1.09E+02 36.5% 2.64E+01 8.8% 6.85E+00 2.3% 1.22E-01 0.0%
3.20E+02 100.0% 1.12E+02 35.1% 9.57E+00 3.0% 0.00E+00 0.0% 2.15E+00 0.7% 1.79E+01 5.6% 5.53E+01 17.3% 9.17E+01 28.6% 2.80E+01 8.7% 7.78E+00 2.4% 0.00E+00 0.0%
3.39E+02 100.0% 1.02E+02 30.2% 1.16E+01 3.4% 3.09E+00 0.9% 5.08E+00 1.5% 2.34E+01 6.9% 6.06E+01 17.9% 1.01E+02 29.7% 3.00E+01 8.9% 8.05E+00 2.4% 1.87E-01 0.1%

54
Table 12G. Per Capita Intake of Total Foods and Major Food Groups and Percent of Total Food Intake for Individuals with Low-End, Mid-Range, and High-end Total Fish Intake
Age 1-2 Years (g/kg/day)
Food Group Low-end Total Fish consumers Mid-range Total Fish consumers High-end Total Fish consumers
Sample Size = 200 Sample Size = 188 Sample Size = 204 Intake Percent Intake Percent Intake Percent
Total Foods Total Dairy Total Meats Total Fish Total Eggs Total Grains Total Vegetables Total Fruits Total Fats Total Soy Total Nuts
8.24E+01 100.0% 3.73E+01 45.2% 4.29E+00 5.2% 0.00E+00 0.0% 1.21E+00 1.5% 5.78E+00 7.0% 1.04E+01 12.6% 1.95E+01 23.7% 3.38E+00 4.1% 8.60E-01 1.0% 2.62E-01 0.3%
8.60E+01 100.0% 3.88E+01 45.1% 4.14E+00 4.8% 0.00E+00 0.0% 1.34E+00 1.6% 5.97E+00 6.9% 9.93E+00 11.5% 2.19E+01 25.4% 3.36E+00 3.9% 8.32E-01 1.0% 2.20E-01 0.3%
8.99E+01 100.0% 3.63E+01 40.3% 4.31E+00 4.8% 2.26E+00 2.5% 1.42E+00 1.6% 6.31E+00 7.0% 1.13E+01 12.6% 2.39E+01 26.5% 3.50E+00 3.9% 1.09E+00 1.2% 2.36E-01 0.3%
Table 12H. Per Capita Intake of Total Foods and Major Food Groups and Percent of Total Food Intake for Individuals with Low-End, Mid-Range, and High-end Total Fish Intake
Age 1-2 Years (g/day)
Food Group Low-end Total Fish consumers Mid-range Total Fish consumers High-end Total Fish consumers
Sample Size = 200 Sample Size = 192 Sample Size = 207 Intake Percent Intake Percent Intake Percent
Total Foods Total Dairy Total Meats Total Fish Total Eggs Total Grains Total Vegetables Total Fruits Total Fats Total Soy Total Nuts
1.00E+03 100.0% 4.46E+02 44.4% 5.32E+01 5.3% 0.00E+00 0.0% 1.48E+01 1.5% 7.25E+01 7.2% 1.28E+02 12.8% 2.41E+02 24.0% 4.17E+01 4.2% 1.09E+01 1.1% 3.47E+00 0.3%
1.07E+03 100.0% 4.77E+02 44.7% 5.38E+01 5.0% 0.00E+00 0.0% 1.77E+01 1.7% 7.41E+01 6.9% 1.25E+02 11.7% 2.70E+02 25.3% 4.21E+01 3.9% 1.03E+01 1.0% 2.31E+00 0.2%
1.14E+03 100.0% 4.46E+02 39.2% 5.52E+01 4.9% 2.88E+01 2.5% 1.81E+01 1.6% 7.95E+01 7.0% 1.49E+02 13.1% 3.08E+02 27.1% 4.38E+01 3.8% 1.38E+01 1.2% 3.43E+00 0.3%

55
Table 12I. Per Capita Intake of Total Foods and Major Food Groups and Percent of Total Food Intake for Individuals with Low-End, Mid-Range, and High-end Total Fish Intake
Age 3-5 Years (g/kg/day)
Food Group Low-end Total Fish consumers Mid-range Total Fish consumers High-end Total Fish consumers
Sample Size = 397 Sample Size = 399 Sample Size = 409 Intake Percent Intake Percent Intake Percent
Total Foods Total Dairy Total Meats Total Fish Total Eggs Total Grains Total Vegetables Total Fruits Total Fats Total Soy Total Nuts
5.54E+01 100.0% 2.08E+01 37.5% 3.90E+00 7.0% 0.00E+00 0.0% 8.47E-01 1.5% 5.46E+00 9.8% 9.35E+00 16.9% 1.16E+01 21.0% 2.64E+00 4.8% 8.78E-01 1.6% 2.99E-01 0.5%
6.22E+01 100.0% 2.33E+01 37.4% 4.51E+00 7.2% 0.00E+00 0.0% 9.60E-01 1.5% 5.82E+00 9.4% 9.33E+00 15.0% 1.47E+01 23.6% 2.88E+00 4.6% 8.68E-01 1.4% 2.77E-01 0.4%
6.62E+01 100.0% 2.25E+01 33.9% 3.48E+00 5.3% 2.43E+00 3.7% 1.04E+00 1.6% 5.98E+00 9.0% 1.12E+01 16.9% 1.57E+01 23.8% 2.85E+00 4.3% 1.12E+00 1.7% 2.36E-01 0.4%
Table 12J. Per Capita Intake of Total Foods and Major Food Groups and Percent of Total Food Intake for Individuals with Low-End, Mid-Range, and High-end Total Fish Intake
Age 3-5 Years (g/day)
Food Group Low-end Total Fish consumers Mid-range Total Fish consumers High-end Total Fish consumers
Sample Size = 397 Sample Size = 399 Sample Size = 399 Intake Percent Intake Percent Intake Percent
Total Foods Total Dairy Total Meats Total Fish Total Eggs Total Grains Total Vegetables Total Fruits Total Fats Total Soy Total Nuts
9.96E+02 100.0% 3.74E+02 37.5% 7.15E+01 7.2% 0.00E+00 0.0% 1.54E+01 1.5% 9.85E+01 9.9% 1.69E+02 17.0% 2.04E+02 20.5% 4.75E+01 4.8% 1.58E+01 1.6% 5.54E+00 0.6%
1.10E+03 100.0% 4.15E+02 37.6% 8.03E+01 7.3% 0.00E+00 0.0% 1.67E+01 1.5% 1.04E+02 9.4% 1.66E+02 15.0% 2.58E+02 23.4% 5.10E+01 4.6% 1.52E+01 1.4% 4.83E+00 0.4%
1.16E+03 100.0% 3.99E+02 34.5% 6.16E+01 5.3% 4.32E+01 3.7% 1.67E+01 1.4% 1.03E+02 8.9% 1.93E+02 16.7% 2.73E+02 23.6% 4.95E+01 4.3% 1.95E+01 1.7% 4.06E+00 0.4%

56
Table 12K. Per Capita Intake of Total Foods and Major Food Groups and Percent of Total Food Intake for Individuals with Low-End, Mid-Range, and High-end Total Fish Intake
Age 6-11 Years (g/kg/day)
Food Group Low-end Total Fish consumers Mid-range Total Fish consumers High-end Total Fish consumers
Sample Size = 183 Sample Size = 190 Sample Size = 183 Intake Percent Intake Percent Intake Percent
Total Foods Total Dairy Total Meats Total Fish Total Eggs Total Grains Total Vegetables Total Fruits Total Fats Total Soy Total Nuts
3.73E+01 100.0% 1.39E+01 37.3% 2.76E+00 7.4% 0.00E+00 0.0% 4.25E-01 1.1% 3.85E+00 10.3% 7.52E+00 20.2% 6.05E+00 16.2% 1.91E+00 5.1% 6.71E-01 1.8% 2.22E-01 0.6%
3.98E+01 100.0% 1.36E+01 34.2% 2.95E+00 7.4% 0.00E+00 0.0% 7.52E-01 1.9% 4.63E+00 11.6% 7.49E+00 18.8% 7.39E+00 18.6% 2.06E+00 5.2% 7.21E-01 1.8% 1.97E-01 0.5%
4.23E+01 100.0% 1.49E+01 35.3% 2.62E+00 6.2% 1.73E+00 4.1% 7.13E-01 1.7% 4.28E+00 10.1% 7.83E+00 18.5% 7.42E+00 17.5% 2.09E+00 4.9% 8.22E-01 1.9% 1.24E-01 0.3%
Table 12L. Per Capita Intake of Total Foods and Major Food Groups and Percent of Total Food Intake for Individuals with Low-End, Mid-Range, and High-end Total Fish Intake
Age 6-11 Years (g/day)
Food Group Low-end Total Fish consumers Mid-range Total Fish consumers High-end Total Fish consumers
Sample Size = 183 Sample Size = 190 Sample Size = 174 Intake Percent Intake Percent Intake Percent
Total Foods Total Dairy Total Meats Total Fish Total Eggs Total Grains Total Vegetables Total Fruits Total Fats Total Soy Total Nuts
1.06E+03 100.0% 3.88E+02 36.6% 8.01E+01 7.6% 0.00E+00 0.0% 1.22E+01 1.2% 1.10E+02 10.4% 2.18E+02 20.6% 1.70E+02 16.1% 5.52E+01 5.2% 1.95E+01 1.8% 6.14E+00 0.6%
1.13E+03 100.0% 3.78E+02 33.4% 8.51E+01 7.5% 0.00E+00 0.0% 2.22E+01 2.0% 1.33E+02 11.8% 2.13E+02 18.8% 2.16E+02 19.1% 5.90E+01 5.2% 2.09E+01 1.8% 5.47E+00 0.5%
1.22E+03 100.0% 4.20E+02 34.5% 7.53E+01 6.2% 5.15E+01 4.2% 2.17E+01 1.8% 1.23E+02 10.1% 2.32E+02 19.1% 2.13E+02 17.5% 6.02E+01 4.9% 2.40E+01 2.0% 3.31E+00 0.3%

57
Table 12M. Per Capita Intake of Total Foods and Major Food Groups and Percent of Total Food Intake for Individuals with Low-End, Mid-Range, and High-end Total Fish Intake
Age 12-19 Years (g/kg/day)
Food Group Low-end Total Fish consumers Mid-range Total Fish consumers High-end Total Fish consumers
Sample Size = 140 Sample Size = 123 Sample Size = 127 Intake Percent Intake Percent Intake Percent
Total Foods Total Dairy Total Meats Total Fish Total Eggs Total Grains Total Vegetables Total Fruits Total Fats Total Soy Total Nuts
1.91E+01 100.0% 5.35E+00 28.0% 2.05E+00 10.7% 0.00E+00 0.0% 2.93E-01 1.5% 2.26E+00 11.8% 5.05E+00 26.4% 2.67E+00 13.9% 1.17E+00 6.1% 4.58E-01 2.4% 5.05E-02 0.3%
2.10E+01 100.0% 5.34E+00 25.5% 2.21E+00 10.5% 0.00E+00 0.0% 3.85E-01 1.8% 2.55E+00 12.2% 5.26E+00 25.1% 3.61E+00 17.2% 1.28E+00 6.1% 4.71E-01 2.2% 7.83E-02 0.4%
2.39E+01 100.0% 6.52E+00 27.3% 1.83E+00 7.6% 1.32E+00 5.5% 4.18E-01 1.8% 2.67E+00 11.2% 5.48E+00 22.9% 3.97E+00 16.6% 1.35E+00 5.7% 6.05E-01 2.5% 6.99E-02 0.3%
Table 12N. Per Capita Intake of Total Foods and Major Food Groups and Percent of Total Food Intake for Individuals with Low-End, Mid-Range, and High-end Total Fish Intake
Age 12-19 Years (g/day)
Food Group Low-end Total Fish consumers Mid-range Total Fish consumers High-end Total Fish consumers
Sample Size = 140 Sample Size = 123 Sample Size = 124 Intake Percent Intake Percent Intake Percent
Total Foods Total Dairy Total Meats Total Fish Total Eggs Total Grains Total Vegetables Total Fruits Total Fats Total Soy Total Nuts
1.11E+03 100.0% 3.06E+02 27.6% 1.23E+02 11.1% 0.00E+00 0.0% 1.74E+01 1.6% 1.31E+02 11.8% 2.98E+02 26.9% 1.50E+02 13.5% 6.85E+01 6.2% 2.67E+01 2.4% 2.83E+00 0.3%
1.15E+03 100.0% 2.87E+02 24.9% 1.22E+02 10.6% 0.00E+00 0.0% 2.11E+01 1.8% 1.41E+02 12.2% 2.96E+02 25.7% 1.96E+02 17.1% 6.98E+01 6.1% 2.58E+01 2.2% 4.61E+00 0.4%
1.37E+03 100.0% 3.54E+02 25.8% 1.17E+02 8.5% 7.91E+01 5.8% 2.47E+01 1.8% 1.58E+02 11.5% 3.30E+02 24.0% 2.13E+02 15.5% 8.03E+01 5.8% 3.57E+01 2.6% 3.59E+00 0.3%
58
Table 13A. Per Capita Intake of Total Foods and Major Food Groups and Percent of Total Food Intake for Individuals with Low-End, Mid-Range, and High-end Total Fruit and Vegetable Intake
All Age Groups Combined (g/kg/day)
Food Group Low-end Total Fruit and Vegetable consumers Mid-range Total Fruit and Vegetable consumers High-end Total Fruit and Vegetable consumers
Sample Size = 1754 Sample Size = 1437 Sample Size = 5394 Intake Percent Intake Percent Intake Percent
Total Foods Total Dairy Total Meats Total Fish Total Eggs Total Grains Total Vegetables Total Fruits Total Fats Total Soy Total Nuts
8.66E+00 100.0% 2.95E+00 34.0% 1.25E+00 14.4% 1.37E-01 1.6% 2.54E-01 2.9% 1.36E+00 15.8% 1.57E+00 18.2% 2.13E-01 2.5% 7.78E-01 9.0% 2.54E-01 2.9% 2.85E-02 0.3%
1.71E+01 100.0% 4.32E+00 25.3% 1.88E+00 11.0% 2.33E-01 1.4% 3.25E-01 1.9% 2.07E+00 12.1% 4.62E+00 27.1% 2.28E+00 13.4% 1.02E+00 6.0% 3.89E-01 2.3% 7.73E-02 0.5%
6.29E+01 100.0% 1.99E+01 31.6% 3.58E+00 5.7% 2.96E-01 0.5% 8.33E-01 1.3% 4.91E+00 7.8% 1.06E+01 16.9% 1.94E+01 30.9% 2.58E+00 4.1% 8.27E-01 1.3% 8.27E-01 1.3%
Table 13B. Per Capita Intake of Total Foods and Major Food Groups and Percent of Total Food Intake for Individuals with Low-End, Mid-Range, and High-end Total Fruit and Vegetable Intake
All Age Groups Combined (g/day)
Food Group Low-end Total Fruit and Vegetable consumers Mid-range Total Fruit and Vegetable consumers High-end Total Fruit and Vegetable consumers
Sample Size = 2886 Sample Size = 1978 Sample Size = 1546 Intake Percent Intake Percent Intake Percent
Total Foods Total Dairy Total Meats Total Fish Total Eggs Total Grains Total Vegetables Total Fruits Total Fats Total Soy Total Nuts
5.95E+02 100.0% 2.24E+02 37.7% 8.14E+01 13.7% 7.71E+00 1.3% 1.75E+01 2.9% 9.36E+01 15.7% 9.93E+01 16.7% 1.78E+01 3.0% 4.32E+01 7.3% 1.45E+01 2.4% 1.87E+00 0.3%
1.04E+03 100.0% 2.55E+02 24.5% 1.21E+02 11.6% 1.12E+01 1.1% 2.14E+01 2.1% 1.27E+02 12.2% 2.82E+02 27.1% 1.41E+02 13.6% 6.23E+01 6.0% 2.37E+01 2.3% 4.62E+00 0.4%
1.90E+03 100.0% 3.08E+02 16.2% 1.63E+02 8.6% 2.10E+01 1.1% 2.76E+01 1.4% 1.72E+02 9.0% 5.02E+02 26.3% 6.04E+02 31.7% 8.27E+01 4.3% 3.15E+01 1.7% 6.19E+00 0.3%

59
Table 13C. Per Capita Intake of Total Foods and Major Food Groups and Percent of Total Food Intake for Individuals with Low-End, Mid-Range, and High-end Total Fruit and Vegetable Intake
Age 20+ Years (g/kg/day)
Food Group Low-end Total Fruit and Vegetable consumers Mid-range Total Fruit and Vegetable consumers High-end Total Fruit and Vegetable consumers
Sample Size = 991 Sample Size = 931 Sample Size = 871 Intake Percent Intake Percent Intake Percent
Total Foods Total Dairy Total Meats Total Fish Total Eggs Total Grains Total Vegetables Total Fruits Total Fats Total Soy Total Nuts
7.72E+00 100.0% 2.21E+00 28.6% 1.30E+00 16.9% 1.37E-01 1.8% 2.60E-01 3.4% 1.37E+00 17.8% 1.51E+00 19.6% 1.97E-01 2.5% 5.91E-01 7.7% 2.03E-01 2.6% 2.34E-02 0.3%
1.41E+01 100.0% 2.86E+00 20.3% 1.84E+00 13.0% 1.68E-01 1.2% 3.01E-01 2.1% 1.86E+00 13.2% 4.19E+00 29.7% 1.77E+00 12.5% 8.87E-01 6.3% 3.41E-01 2.4% 5.81E-02 0.4%
2.66E+01 100.0% 3.92E+00 14.7% 2.00E+00 7.5% 3.44E-01 1.3% 3.45E-01 1.3% 2.38E+00 9.0% 7.24E+00 27.2% 9.00E+00 33.9% 1.02E+00 3.8% 3.98E-01 1.5% 3.98E-01 1.5%
Table 13D. Per Capita Intake of Total Foods and Major Food Groups and Percent of Total Food Intake for Individuals with Low-End, Mid-Range, and High-end Total Fruit and Vegetable Intake
Age 20+ Years (g/day)
Food Group Low-end Total Fruit and Vegetable consumers Mid-range Total Fruit and Vegetable consumers High-end Total Fruit and Vegetable consumers
Sample Size = 976 Sample Size = 880 Sample Size = 890 Intake Percent Intake Percent Intake Percent
Total Foods Total Dairy Total Meats Total Fish Total Eggs Total Grains Total Vegetables Total Fruits Total Fats Total Soy Total Nuts
6.02E+02 100.0% 1.78E+02 29.6% 9.88E+01 16.4% 1.11E+01 1.8% 2.09E+01 3.5% 1.05E+02 17.5% 1.15E+02 19.1% 1.56E+01 2.6% 4.54E+01 7.5% 1.56E+01 2.6% 1.98E+00 0.3%
1.04E+03 100.0% 2.15E+02 20.6% 1.29E+02 12.4% 1.48E+01 1.4% 2.30E+01 2.2% 1.31E+02 12.6% 3.06E+02 29.4% 1.38E+02 13.3% 6.41E+01 6.2% 2.51E+01 2.4% 4.33E+00 0.4%
1.92E+03 100.0% 2.82E+02 14.7% 1.68E+02 8.7% 2.33E+01 1.2% 2.80E+01 1.5% 1.77E+02 9.2% 5.27E+02 27.4% 6.10E+02 31.7% 8.31E+01 4.3% 3.17E+01 1.6% 6.08E+00 0.3%

60
Table 13E. Per Capita Intake of Total Foods and Major Food Groups and Percent of Total Food Intake for Individuals with Low-End, Mid-Range, and High-end Total Fruit and Vegetable Intake
Age <1 Year (g/kg/day)
Food Group Low-end Total Fruit and Vegetable consumers Mid-range Total Fruit and Vegetable consumers High-end Total Fruit and Vegetable consumers
Sample Size = 138 Sample Size = 143 Sample Size = 135 Intake Percent Intake Percent Intake Percent
Total Foods Total Dairy Total Meats Total Fish Total Eggs Total Grains Total Vegetables Total Fruits Total Fats Total Soy Total Nuts
1.11E+01 100.0% 7.69E+00 69.2% 0.00E+00 0.0% 0.00E+00 0.0% 0.00E+00 0.0% 2.06E-01 1.9% 0.00E+00 0.0% 0.00E+00 0.0% 3.21E+00 28.9% 9.23E-01 8.3% 0.00E+00 0.0%
3.83E+01 100.0% 1.51E+01 39.4% 1.26E+00 3.3% 1.07E-01 0.3% 4.24E-01 1.1% 2.12E+00 5.5% 7.82E+00 20.4% 6.56E+00 17.1% 4.16E+00 10.9% 1.23E+00 3.2% 7.90E-03 0.0%
8.83E+01 100.0% 1.54E+01 17.4% 2.92E+00 3.3% 3.05E-02 0.0% 4.99E-01 0.6% 4.00E+00 4.5% 1.66E+01 18.8% 4.44E+01 50.3% 3.92E+00 4.4% 9.96E-01 1.1% 9.96E-01 1.1%
Table 13F. Per Capita Intake of Total Foods and Major Food Groups and Percent of Total Food Intake for Individuals with Low-End, Mid-Range, and High-end Total Fruit and Vegetable Intake
Age <1 Year (g/day)
Food Group Low-end Total Fruit and Vegetable consumers Mid-range Total Fruit and Vegetable consumers High-end Total Fruit and Vegetable consumers
Sample Size = 136 Sample Size = 147 Sample Size = 145 Intake Percent Intake Percent Intake Percent
Total Foods Total Dairy Total Meats Total Fish Total Eggs Total Grains Total Vegetables Total Fruits Total Fats Total Soy Total Nuts
5.09E+01 100.0% 3.55E+01 69.8% 0.00E+00 0.0% 0.00E+00 0.0% 0.00E+00 0.0% 5.30E-01 1.0% 0.00E+00 0.0% 0.00E+00 0.0% 1.48E+01 29.2% 4.10E+00 8.1% 0.00E+00 0.0%
2.96E+02 100.0% 1.19E+02 40.2% 9.80E+00 3.3% 5.99E-01 0.2% 2.58E+00 0.9% 1.89E+01 6.4% 5.91E+01 20.0% 5.28E+01 17.8% 3.09E+01 10.4% 7.73E+00 2.6% 1.18E-01 0.0%
8.66E+02 100.0% 2.29E+02 26.5% 3.30E+01 3.8% 3.91E-01 0.0% 5.78E+00 0.7% 3.82E+01 4.4% 1.41E+02 16.3% 3.80E+02 43.9% 3.51E+01 4.1% 7.97E+00 0.9% 2.35E-01 0.0%

61
Table 13G. Per Capita Intake of Total Foods and Major Food Groups and Percent of Total Food Intake for Individuals with Low-End, Mid-Range, and High-end Total Fruit and Vegetable Intake
Age 1-2 Years (g/kg/day)
Food Group Low-end Total Fruit and Vegetable consumers Mid-range Total Fruit and Vegetable consumers High-end Total Fruit and Vegetable consumers
Sample Size = 196 Sample Size = 203 Sample Size = 202 Intake Percent Intake Percent Intake Percent
Total Foods Total Dairy Total Meats Total Fish Total Eggs Total Grains Total Vegetables Total Fruits Total Fats Total Soy Total Nuts
5.52E+01 100.0% 3.51E+01 63.5% 3.50E+00 6.3% 1.55E-01 0.3% 8.88E-01 1.6% 4.75E+00 8.6% 5.42E+00 9.8% 1.92E+00 3.5% 2.96E+00 5.4% 7.55E-01 1.4% 1.83E-01 0.3%
7.81E+01 100.0% 3.49E+01 44.7% 4.05E+00 5.2% 2.40E-01 0.3% 1.32E+00 1.7% 5.90E+00 7.6% 1.05E+01 13.5% 1.74E+01 22.3% 3.08E+00 3.9% 8.91E-01 1.1% 2.11E-01 0.3%
1.23E+02 100.0% 3.30E+01 26.8% 4.70E+00 3.8% 3.83E-01 0.3% 1.60E+00 1.3% 6.57E+00 5.3% 1.50E+01 12.1% 5.79E+01 46.9% 3.44E+00 2.8% 1.06E+00 0.9% 1.06E+00 0.9%
Table 13H. Per Capita Intake of Total Foods and Major Food Groups and Percent of Total Food Intake for Individuals with Low-End, Mid-Range, and High-end Total Fruit and Vegetable Intake
Age 1-2 Years (g/day)
Food Group Low-end Total Fruit and Vegetable consumers Mid-range Total Fruit and Vegetable consumers High-end Total Fruit and Vegetable consumers
Sample Size = 200 Sample Size = 188 Sample Size = 197 Intake Percent Intake Percent Intake Percent
Total Foods Total Dairy Total Meats Total Fish Total Eggs Total Grains Total Vegetables Total Fruits Total Fats Total Soy Total Nuts
7.14E+02 100.0% 4.66E+02 65.2% 4.13E+01 5.8% 2.45E+00 0.3% 1.05E+01 1.5% 5.78E+01 8.1% 6.63E+01 9.3% 2.62E+01 3.7% 3.65E+01 5.1% 9.02E+00 1.3% 2.29E+00 0.3%
9.93E+02 100.0% 4.40E+02 44.3% 5.53E+01 5.6% 2.80E+00 0.3% 1.73E+01 1.7% 7.47E+01 7.5% 1.26E+02 12.7% 2.27E+02 22.9% 4.08E+01 4.1% 1.13E+01 1.1% 2.70E+00 0.3%
1.55E+03 100.0% 4.02E+02 25.9% 6.43E+01 4.1% 5.52E+00 0.4% 1.86E+01 1.2% 8.66E+01 5.6% 1.93E+02 12.4% 7.29E+02 47.0% 4.33E+01 2.8% 1.37E+01 0.9% 4.96E+00 0.3%

62
Table 13I. Per Capita Intake of Total Foods and Major Food Groups and Percent of Total Food Intake for Individuals with Low-End, Mid-Range, and High-end Total Fruit and Vegetable Intake
Age 3-5 Years (g/kg/day)
Food Group Low-end Total Fruit and Vegetable consumers Mid-range Total Fruit and Vegetable consumers High-end Total Fruit and Vegetable consumers
Sample Size = 380 Sample Size = 409 Sample Size = 504 Intake Percent Intake Percent Intake Percent
Total Foods Total Dairy Total Meats Total Fish Total Eggs Total Grains Total Vegetables Total Fruits Total Fats Total Soy Total Nuts
3.99E+01 100.0% 2.10E+01 52.7% 3.44E+00 8.6% 1.69E-01 0.4% 6.35E-01 1.6% 4.95E+00 12.4% 5.20E+00 13.0% 1.36E+00 3.4% 2.44E+00 6.1% 7.31E-01 1.8% 2.18E-01 0.5%
5.79E+01 100.0% 2.22E+01 38.2% 4.04E+00 7.0% 3.24E-01 0.6% 8.09E-01 1.4% 5.95E+00 10.3% 9.56E+00 16.5% 1.12E+01 19.4% 2.83E+00 4.9% 9.69E-01 1.7% 3.03E-01 0.5%
9.54E+01 100.0% 2.46E+01 25.8% 4.60E+00 4.8% 4.55E-01 0.5% 1.10E+00 1.1% 6.53E+00 6.8% 1.33E+01 13.9% 4.06E+01 42.5% 3.10E+00 3.3% 1.04E+00 1.1% 1.04E+00 1.1%
Table 13J. Per Capita Intake of Total Foods and Major Food Groups and Percent of Total Food Intake for Individuals with Low-End, Mid-Range, and High-end Total Fruit and Vegetable Intake
Age 3-5 Years (g/day)
Food Group Low-end Total Fruit and Vegetable consumers Mid-range Total Fruit and Vegetable consumers High-end Total Fruit and Vegetable consumers
Sample Size = 408 Sample Size = 398 Sample Size = 464 Intake Percent Intake Percent Intake Percent
Total Foods Total Dairy Total Meats Total Fish Total Eggs Total Grains Total Vegetables Total Fruits Total Fats Total Soy Total Nuts
7.31E+02 100.0% 3.88E+02 53.1% 5.97E+01 8.2% 3.86E+00 0.5% 1.27E+01 1.7% 9.17E+01 12.5% 9.16E+01 12.5% 2.65E+01 3.6% 4.45E+01 6.1% 1.37E+01 1.9% 4.20E+00 0.6%
1.01E+03 100.0% 3.85E+02 38.0% 7.42E+01 7.3% 7.03E+00 0.7% 1.43E+01 1.4% 9.55E+01 9.4% 1.74E+02 17.1% 1.99E+02 19.6% 4.92E+01 4.9% 1.66E+01 1.6% 5.42E+00 0.5%
1.59E+03 100.0% 4.01E+02 25.1% 8.07E+01 5.1% 9.23E+00 0.6% 2.09E+01 1.3% 1.13E+02 7.1% 2.31E+02 14.5% 6.68E+02 41.9% 5.32E+01 3.3% 1.82E+01 1.1% 6.33E+00 0.4%

63
Table 13K. Per Capita Intake of Total Foods and Major Food Groups and Percent of Total Food Intake for Individuals with Low-End, Mid-Range, and High-end Total Fruit and Vegetable Intake
Age 6-11 Years (g/kg/day)
Food Group Low-end Total Fruit and Vegetable consumers Mid-range Total Fruit and Vegetable consumers High-end Total Fruit and Vegetable consumers
Sample Size = 163 Sample Size = 178 Sample Size = 202 Intake Percent Intake Percent Intake Percent
Total Foods Total Dairy Total Meats Total Fish Total Eggs Total Grains Total Vegetables Total Fruits Total Fats Total Soy Total Nuts
2.11E+01 100.0% 9.76E+00 46.2% 2.28E+00 10.8% 1.48E-01 0.7% 4.47E-01 2.1% 2.91E+00 13.8% 3.11E+00 14.7% 6.90E-01 3.3% 1.37E+00 6.5% 4.68E-01 2.2% 8.04E-02 0.4%
3.63E+01 100.0% 1.34E+01 37.0% 3.15E+00 8.7% 1.27E-01 0.3% 4.77E-01 1.3% 4.47E+00 12.3% 7.09E+00 19.5% 4.76E+00 13.1% 1.95E+00 5.4% 7.11E-01 2.0% 1.92E-01 0.5%
6.20E+01 100.0% 1.70E+01 27.4% 3.47E+00 5.6% 3.11E-01 0.5% 7.46E-01 1.2% 5.16E+00 8.3% 1.10E+01 17.8% 2.08E+01 33.5% 2.46E+00 4.0% 8.81E-01 1.4% 8.81E-01 1.4%
Table 13L. Per Capita Intake of Total Foods and Major Food Groups and Percent of Total Food Intake for Individuals with Low-End, Mid-Range, and High-end Total Fruit and Vegetable Intake
Age 6-11 Years (g/day)
Food Group Low-end Total Fruit and Vegetable consumers Mid-range Total Fruit and Vegetable consumers High-end Total Fruit and Vegetable consumers
Sample Size = 187 Sample Size = 186 Sample Size = 167 Intake Percent Intake Percent Intake Percent
Total Foods Total Dairy Total Meats Total Fish Total Eggs Total Grains Total Vegetables Total Fruits Total Fats Total Soy Total Nuts
7.69E+02 100.0% 3.69E+02 48.0% 7.72E+01 10.0% 4.13E+00 0.5% 1.55E+01 2.0% 1.06E+02 13.8% 1.06E+02 13.8% 2.48E+01 3.2% 4.80E+01 6.2% 1.64E+01 2.1% 3.26E+00 0.4%
1.09E+03 100.0% 4.10E+02 37.6% 9.13E+01 8.4% 7.08E+00 0.7% 1.64E+01 1.5% 1.23E+02 11.3% 2.22E+02 20.4% 1.42E+02 13.0% 6.16E+01 5.7% 2.19E+01 2.0% 4.86E+00 0.4%
1.65E+03 100.0% 4.35E+02 26.3% 9.41E+01 5.7% 8.98E+00 0.5% 1.73E+01 1.0% 1.32E+02 8.0% 3.29E+02 19.9% 5.40E+02 32.7% 6.40E+01 3.9% 2.35E+01 1.4% 7.39E+00 0.4%

64
Table 13M. Per Capita Intake of Total Foods and Major Food Groups and Percent of Total Food Intake for Individuals with Low-End, Mid-Range, and High-end Total Fruit and Vegetable Intake
Age 12-19 Years (g/kg/day)
Food Group Low-end Total Fruit and Vegetable consumers Mid-range Total Fruit and Vegetable consumers High-end Total Fruit and Vegetable consumers
Sample Size = 138 Sample Size = 133 Sample Size = 124 Intake Percent Intake Percent Intake Percent
Total Foods Total Dairy Total Meats Total Fish Total Eggs Total Grains Total Vegetables Total Fruits Total Fats Total Soy Total Nuts
1.01E+01 100.0% 3.89E+00 38.6% 1.26E+00 12.5% 9.69E-02 1.0% 2.86E-01 2.8% 1.65E+00 16.4% 1.80E+00 17.9% 2.31E-01 2.3% 7.35E-01 7.3% 2.74E-01 2.7% 3.25E-02 0.3%
1.96E+01 100.0% 5.69E+00 29.0% 2.26E+00 11.5% 2.33E-01 1.2% 2.74E-01 1.4% 2.42E+00 12.3% 5.14E+00 26.2% 2.02E+00 10.3% 1.29E+00 6.6% 5.19E-01 2.6% 6.24E-02 0.3%
3.68E+01 100.0% 7.18E+00 19.5% 2.96E+00 8.1% 2.19E-01 0.6% 4.78E-01 1.3% 3.43E+00 9.3% 8.96E+00 24.4% 1.15E+01 31.2% 1.63E+00 4.4% 6.03E-01 1.6% 6.03E-01 1.6%
Table 13N. Per Capita Intake of Total Foods and Major Food Groups and Percent of Total Food Intake for Individuals with Low-End, Mid-Range, and High-end Total Fruit and Vegetable Intake
Age 12-19 Years (g/day)
Food Group Low-end Total Fruit and Vegetable consumers Mid-range Total Fruit and Vegetable consumers High-end Total Fruit and Vegetable consumers
Sample Size = 141 Sample Size = 142 Sample Size = 125 Intake Percent Intake Percent Intake Percent
Total Foods Total Dairy Total Meats Total Fish Total Eggs Total Grains Total Vegetables Total Fruits Total Fats Total Soy Total Nuts
6.55E+02 100.0% 2.58E+02 39.4% 8.37E+01 12.8% 5.36E+00 0.8% 1.75E+01 2.7% 1.03E+02 15.7% 1.15E+02 17.6% 1.65E+01 2.5% 4.82E+01 7.4% 1.83E+01 2.8% 1.31E+00 0.2%
1.07E+03 100.0% 2.92E+02 27.2% 1.19E+02 11.1% 1.03E+01 1.0% 1.70E+01 1.6% 1.37E+02 12.8% 2.92E+02 27.2% 1.21E+02 11.3% 6.58E+01 6.1% 2.75E+01 2.6% 4.06E+00 0.4%
2.20E+03 100.0% 4.67E+02 21.3% 1.94E+02 8.8% 1.23E+01 0.6% 2.91E+01 1.3% 1.88E+02 8.6% 5.46E+02 24.9% 6.29E+02 28.6% 1.06E+02 4.8% 4.03E+01 1.8% 7.14E+00 0.3%

65
Table 14A. Per Capita Intake of Total Foods and Major Food Groups and Percent of Total Food Intake for Individuals with Low-End, Mid-Range, and High-end Total Dairy Intake
All Age Groups Combined (g/kg/day)
Food Group Low-end Total Dairy consumers Mid-range Total Dairy consumers High-end Total Dairy consumers
Sample Size = 1608 Sample Size = 1436 Sample Size = 5473 Intake Percent Intake Percent Intake Percent
Total Foods Total Dairy Total Meats Total Fish Total Eggs Total Grains Total Vegetables Total Fruits Total Fats Total Soy Total Nuts
1.09E+01 100.0% 1.44E-01 1.3% 1.65E+00 15.0% 1.91E-01 1.7% 2.78E-01 2.5% 1.57E+00 14.3% 3.81E+00 34.8% 2.51E+00 22.9% 6.67E-01 6.1% 2.82E-01 2.6% 4.23E-02 0.4%
1.63E+01 100.0% 3.01E+00 18.5% 1.79E+00 11.0% 2.06E-01 1.3% 3.33E-01 2.0% 1.98E+00 12.1% 4.57E+00 28.0% 3.18E+00 19.5% 9.35E-01 5.7% 3.61E-01 2.2% 6.88E-02 0.4%
6.51E+01 100.0% 3.00E+01 46.1% 3.50E+00 5.4% 2.67E-01 0.4% 7.96E-01 1.2% 5.24E+00 8.1% 8.75E+00 13.4% 1.28E+01 19.7% 2.86E+00 4.4% 8.53E-01 1.3% 2.39E-01 0.4%
Table 14B. Per Capita Intake of Total Foods and Major Food Groups and Percent of Total Food Intake for Individuals with Low-End, Mid-Range, and High-end Total Dairy Intake
All Age Groups Combined (g/day)
Food Group Low-end Total Dairy consumers Mid-range Total Dairy consumers High-end Total Dairy consumers
Sample Size = 1790 Sample Size = 1803 Sample Size = 2425 Intake Percent Intake Percent Intake Percent
Total Foods Total Dairy Total Meats Total Fish Total Eggs Total Grains Total Vegetables Total Fruits Total Fats Total Soy Total Nuts
7.21E+02 100.0% 1.03E+01 1.4% 1.15E+02 16.0% 1.31E+01 1.8% 1.91E+01 2.6% 1.07E+02 14.9% 2.46E+02 34.1% 1.60E+02 22.2% 4.25E+01 5.9% 1.79E+01 2.5% 2.89E+00 0.4%
1.05E+03 100.0% 1.93E+02 18.4% 1.16E+02 11.1% 1.25E+01 1.2% 2.16E+01 2.1% 1.31E+02 12.5% 2.96E+02 28.3% 1.96E+02 18.7% 6.19E+01 5.9% 2.41E+01 2.3% 3.97E+00 0.4%
1.80E+03 100.0% 8.22E+02 45.7% 1.32E+02 7.4% 1.38E+01 0.8% 2.15E+01 1.2% 1.61E+02 8.9% 3.06E+02 17.0% 2.29E+02 12.7% 8.49E+01 4.7% 2.72E+01 1.5% 6.15E+00 0.3%

66
Table 14C. Per Capita Intake of Total Foods and Major Food Groups and Percent of Total Food Intake for Individuals with Low-End, Mid-Range, and High-end Total Dairy Intake
Age 20+ Years (g/kg/day)
Food Group Low-end Total Dairy consumers Mid-range Total Dairy consumers High-end Total Dairy consumers
Sample Size = 910 Sample Size = 935 Sample Size = 862 Intake Percent Intake Percent Intake Percent
Total Foods Total Dairy Total Meats Total Fish Total Eggs Total Grains Total Vegetables Total Fruits Total Fats Total Soy Total Nuts
1.02E+01 100.0% 1.19E-01 1.2% 1.62E+00 15.8% 2.18E-01 2.1% 2.79E-01 2.7% 1.53E+00 15.0% 3.52E+00 34.5% 2.23E+00 21.9% 5.66E-01 5.5% 2.39E-01 2.3% 4.19E-02 0.4%
1.42E+01 100.0% 2.10E+00 14.8% 1.75E+00 12.3% 2.22E-01 1.6% 3.22E-01 2.3% 1.78E+00 12.5% 4.20E+00 29.5% 2.76E+00 19.4% 8.35E-01 5.9% 3.23E-01 2.3% 5.14E-02 0.4%
2.46E+01 100.0% 1.01E+01 41.0% 1.80E+00 7.3% 2.53E-01 1.0% 3.42E-01 1.4% 2.34E+00 9.5% 4.78E+00 19.4% 3.49E+00 14.2% 1.10E+00 4.5% 3.74E-01 1.5% 7.45E-02 0.3%
Table 14D. Per Capita Intake of Total Foods and Major Food Groups and Percent of Total Food Intake for Individuals with Low-End, Mid-Range, and High-end Total Dairy Intake
Age 20+ Years (g/day)
Food Group Low-end Total Dairy consumers Mid-range Total Dairy consumers High-end Total Dairy consumers
Sample Size = 924 Sample Size = 911 Sample Size = 877 Intake Percent Intake Percent Intake Percent
Total Foods Total Dairy Total Meats Total Fish Total Eggs Total Grains Total Vegetables Total Fruits Total Fats Total Soy Total Nuts
7.41E+02 100.0% 8.88E+00 1.2% 1.17E+02 15.8% 1.60E+01 2.2% 1.97E+01 2.7% 1.13E+02 15.2% 2.58E+02 34.8% 1.59E+02 21.4% 4.18E+01 5.6% 1.81E+01 2.4% 2.82E+00 0.4%
1.03E+03 100.0% 1.55E+02 15.1% 1.29E+02 12.6% 1.60E+01 1.6% 2.34E+01 2.3% 1.30E+02 12.6% 3.04E+02 29.6% 1.89E+02 18.4% 6.19E+01 6.0% 2.41E+01 2.3% 4.45E+00 0.4%
1.81E+03 100.0% 7.25E+02 40.1% 1.56E+02 8.6% 1.92E+01 1.1% 2.60E+01 1.4% 1.76E+02 9.7% 3.61E+02 20.0% 2.26E+02 12.5% 8.90E+01 4.9% 2.98E+01 1.7% 5.91E+00 0.3%

67
Table 14E. Per Capita Intake of Total Foods and Major Food Groups and Percent of Total Food Intake for Individuals with Low-End, Mid-Range, and High-end Total Dairy Intake
Age <1 Year (g/kg/day)
Food Group Low-end Total Dairy consumers Mid-range Total Dairy consumers High-end Total Dairy consumers
Sample Size = 141 Sample Size = 147 Sample Size = 134 Intake Percent Intake Percent Intake Percent
Total Foods Total Dairy Total Meats Total Fish Total Eggs Total Grains Total Vegetables Total Fruits Total Fats Total Soy Total Nuts
1.72E+01 100.0% 0.00E+00 0.0% 2.58E-01 1.5% 0.00E+00 0.0% 1.92E-02 0.1% 9.13E-01 5.3% 6.51E+00 38.0% 6.99E+00 40.8% 1.90E+00 11.1% 7.07E-01 4.1% 0.00E+00 0.0%
3.82E+01 100.0% 7.66E+00 20.0% 1.43E+00 3.7% 1.02E-01 0.3% 5.88E-01 1.5% 2.56E+00 6.7% 6.90E+00 18.1% 1.54E+01 40.2% 3.51E+00 9.2% 9.14E-01 2.4% 2.44E-02 0.1%
9.67E+01 100.0% 5.83E+01 60.3% 2.90E+00 3.0% 3.10E-02 0.0% 6.39E-01 0.7% 3.77E+00 3.9% 7.70E+00 8.0% 1.65E+01 17.1% 6.54E+00 6.8% 1.26E+00 1.3% 3.47E-02 0.0%
Table 14F. Per Capita Intake of Total Foods and Major Food Groups and Percent of Total Food Intake for Individuals with Low-End, Mid-Range, and High-end Total Dairy Intake
Age <1 Year (g/day)
Food Group Low-end Total Dairy consumers Mid-range Total Dairy consumers High-end Total Dairy consumers
Sample Size = 141 Sample Size = 150 Sample Size = 138 Intake Percent Intake Percent Intake Percent
Total Foods Total Dairy Total Meats Total Fish Total Eggs Total Grains Total Vegetables Total Fruits Total Fats Total Soy Total Nuts
1.27E+02 100.0% 0.00E+00 0.0% 2.18E+00 1.7% 0.00E+00 0.0% 1.82E-01 0.1% 7.37E+00 5.8% 4.75E+01 37.4% 5.33E+01 42.0% 1.29E+01 10.1% 4.64E+00 3.7% 0.00E+00 0.0%
2.76E+02 100.0% 6.14E+01 22.2% 9.99E+00 3.6% 4.34E-02 0.0% 2.25E+00 0.8% 1.62E+01 5.9% 4.85E+01 17.5% 1.11E+02 40.0% 2.71E+01 9.8% 7.07E+00 2.6% 5.80E-02 0.0%
9.79E+02 100.0% 5.28E+02 53.9% 3.74E+01 3.8% 3.55E-01 0.0% 1.07E+01 1.1% 4.59E+01 4.7% 1.04E+02 10.6% 2.08E+02 21.2% 4.16E+01 4.2% 7.50E+00 0.8% 3.68E-01 0.0%

68
Table 14G. Per Capita Intake of Total Foods and Major Food Groups and Percent of Total Food Intake for Individuals with Low-End, Mid-Range, and High-end Total Dairy Intake
Age 1-2 Years (g/kg/day)
Food Group Low-end Total Dairy consumers Mid-range Total Dairy consumers High-end Total Dairy consumers
Sample Size = 190 Sample Size = 204 Sample Size = 201 Intake Percent Intake Percent Intake Percent
Total Foods Total Dairy Total Meats Total Fish Total Eggs Total Grains Total Vegetables Total Fruits Total Fats Total Soy Total Nuts
5.10E+01 100.0% 3.41E+00 6.7% 4.16E+00 8.2% 1.42E-01 0.3% 1.51E+00 3.0% 5.34E+00 10.5% 1.16E+01 22.8% 2.15E+01 42.2% 2.58E+00 5.1% 1.04E+00 2.0% 2.34E-01 0.5%
7.90E+01 100.0% 2.98E+01 37.8% 4.74E+00 6.0% 3.02E-01 0.4% 1.27E+00 1.6% 5.75E+00 7.3% 1.07E+01 13.5% 2.26E+01 28.6% 3.12E+00 4.0% 8.90E-01 1.1% 2.38E-01 0.3%
1.38E+02 100.0% 9.20E+01 66.7% 3.86E+00 2.8% 2.84E-01 0.2% 1.22E+00 0.9% 5.48E+00 4.0% 9.76E+00 7.1% 2.03E+01 14.7% 4.62E+00 3.4% 7.62E-01 0.6% 1.35E-01 0.1%
Table 14H. Per Capita Intake of Total Foods and Major Food Groups and Percent of Total Food Intake for Individuals with Low-End, Mid-Range, and High-end Total Dairy Intake
Age 1-2 Years (g/day)
Food Group Low-end Total Dairy consumers Mid-range Total Dairy consumers High-end Total Dairy consumers
Sample Size = 214 Sample Size = 207 Sample Size = 199 Intake Percent Intake Percent Intake Percent
Total Foods Total Dairy Total Meats Total Fish Total Eggs Total Grains Total Vegetables Total Fruits Total Fats Total Soy Total Nuts
6.38E+02 100.0% 5.00E+01 7.8% 5.30E+01 8.3% 3.01E+00 0.5% 1.91E+01 3.0% 6.75E+01 10.6% 1.53E+02 23.9% 2.51E+02 39.4% 3.31E+01 5.2% 1.31E+01 2.0% 2.89E+00 0.5%
1.05E+03 100.0% 3.92E+02 37.3% 5.99E+01 5.7% 5.11E+00 0.5% 1.52E+01 1.4% 7.66E+01 7.3% 1.36E+02 12.9% 3.16E+02 30.1% 4.02E+01 3.8% 1.20E+01 1.1% 2.55E+00 0.2%
1.60E+03 100.0% 1.06E+03 66.1% 4.76E+01 3.0% 3.14E+00 0.2% 1.58E+01 1.0% 6.84E+01 4.3% 1.18E+02 7.4% 2.29E+02 14.3% 5.53E+01 3.5% 9.89E+00 0.6% 2.50E+00 0.2%

69
Table 14I. Per Capita Intake of Total Foods and Major Food Groups and Percent of Total Food Intake for Individuals with Low-End, Mid-Range, and High-end Total Dairy Intake
Age 3-5 Years (g/kg/day)
Food Group Low-end Total Dairy consumers Mid-range Total Dairy consumers High-end Total Dairy consumers
Sample Size = 371 Sample Size = 423 Sample Size = 455 Intake Percent Intake Percent Intake Percent
Total Foods Total Dairy Total Meats Total Fish Total Eggs Total Grains Total Vegetables Total Fruits Total Fats Total Soy Total Nuts
4.08E+01 100.0% 3.58E+00 8.8% 4.33E+00 10.6% 2.20E-01 0.5% 1.08E+00 2.6% 4.93E+00 12.1% 9.72E+00 23.8% 1.39E+01 34.0% 2.32E+00 5.7% 9.31E-01 2.3% 2.02E-01 0.5%
5.79E+01 100.0% 1.98E+01 34.2% 3.80E+00 6.6% 2.87E-01 0.5% 8.71E-01 1.5% 5.75E+00 9.9% 9.43E+00 16.3% 1.43E+01 24.7% 2.73E+00 4.7% 9.48E-01 1.6% 2.72E-01 0.5%
9.65E+01 100.0% 5.21E+01 54.0% 4.22E+00 4.4% 3.02E-01 0.3% 9.88E-01 1.0% 6.97E+00 7.2% 1.10E+01 11.3% 1.59E+01 16.5% 3.83E+00 4.0% 1.03E+00 1.1% 4.16E-01 0.4%
Table 14J. Per Capita Intake of Total Foods and Major Food Groups and Percent of Total Food Intake for Individuals with Low-End, Mid-Range, and High-end Total Dairy Intake
Age 3-5 Years (g/day)
Food Group Low-end Total Dairy consumers Mid-range Total Dairy consumers High-end Total Dairy consumers
Sample Size = 385 Sample Size = 418 Sample Size = 426 Intake Percent Intake Percent Intake Percent
Total Foods Total Dairy Total Meats Total Fish Total Eggs Total Grains Total Vegetables Total Fruits Total Fats Total Soy Total Nuts
7.25E+02 100.0% 6.44E+01 8.9% 7.53E+01 10.4% 4.00E+00 0.6% 1.91E+01 2.6% 8.74E+01 12.1% 1.68E+02 23.2% 2.53E+02 34.9% 4.03E+01 5.6% 1.60E+01 2.2% 3.47E+00 0.5%
1.05E+03 100.0% 3.55E+02 33.9% 7.21E+01 6.9% 5.66E+00 0.5% 1.51E+01 1.4% 1.04E+02 9.9% 1.73E+02 16.5% 2.57E+02 24.5% 4.87E+01 4.7% 1.62E+01 1.6% 5.38E+00 0.5%
1.61E+03 100.0% 8.86E+02 55.0% 6.96E+01 4.3% 5.74E+00 0.4% 1.76E+01 1.1% 1.16E+02 7.2% 1.83E+02 11.3% 2.51E+02 15.6% 6.32E+01 3.9% 1.78E+01 1.1% 7.24E+00 0.4%

70
Table 14K. Per Capita Intake of Total Foods and Major Food Groups and Percent of Total Food Intake for Individuals with Low-End, Mid-Range, and High-end Total Dairy Intake
Age 6-11 Years (g/kg/day)
Food Group Low-end Total Dairy consumers Mid-range Total Dairy consumers High-end Total Dairy consumers
Sample Size = 162 Sample Size = 171 Sample Size = 217 Intake Percent Intake Percent Intake Percent
Total Foods Total Dairy Total Meats Total Fish Total Eggs Total Grains Total Vegetables Total Fruits Total Fats Total Soy Total Nuts
2.36E+01 100.0% 1.78E+00 7.6% 3.01E+00 12.8% 1.62E-01 0.7% 5.24E-01 2.2% 3.11E+00 13.2% 6.81E+00 28.9% 6.31E+00 26.7% 1.50E+00 6.4% 6.40E-01 2.7% 1.14E-01 0.5%
3.55E+01 100.0% 1.18E+01 33.4% 2.93E+00 8.3% 1.28E-01 0.4% 5.49E-01 1.5% 3.94E+00 11.1% 6.82E+00 19.2% 6.65E+00 18.7% 1.82E+00 5.1% 6.71E-01 1.9% 1.49E-01 0.4%
6.53E+01 100.0% 3.35E+01 51.3% 3.34E+00 5.1% 2.65E-01 0.4% 5.77E-01 0.9% 5.93E+00 9.1% 9.14E+00 14.0% 8.65E+00 13.2% 2.79E+00 4.3% 8.73E-01 1.3% 2.70E-01 0.4%
Table 14L. Per Capita Intake of Total Foods and Major Food Groups and Percent of Total Food Intake for Individuals with Low-End, Mid-Range, and High-end Total Dairy Intake
Age 6-11 Years (g/day)
Food Group Low-end Total Dairy consumers Mid-range Total Dairy consumers High-end Total Dairy consumers
Sample Size = 169 Sample Size = 197 Sample Size = 168 Intake Percent Intake Percent Intake Percent
Total Foods Total Dairy Total Meats Total Fish Total Eggs Total Grains Total Vegetables Total Fruits Total Fats Total Soy Total Nuts
7.89E+02 100.0% 6.03E+01 7.6% 9.50E+01 12.0% 5.12E+00 0.6% 1.74E+01 2.2% 1.06E+02 13.4% 2.28E+02 28.9% 2.15E+02 27.3% 4.90E+01 6.2% 2.09E+01 2.6% 3.63E+00 0.5%
1.05E+03 100.0% 3.63E+02 34.6% 8.29E+01 7.9% 5.93E+00 0.6% 1.36E+01 1.3% 1.15E+02 10.9% 2.15E+02 20.5% 1.74E+02 16.6% 5.66E+01 5.4% 2.01E+01 1.9% 3.65E+00 0.3%
1.71E+03 100.0% 8.79E+02 51.4% 8.72E+01 5.1% 6.09E+00 0.4% 1.65E+01 1.0% 1.51E+02 8.8% 2.41E+02 14.1% 2.32E+02 13.6% 6.94E+01 4.1% 2.17E+01 1.3% 5.63E+00 0.3%

71
Table 14M. Per Capita Intake of Total Foods and Major Food Groups and Percent of Total Food Intake for Individuals with Low-End, Mid-Range, and High-end Total Dairy Intake
Age 12-19 Years (g/kg/day)
Food Group Low-end Total Dairy consumers Mid-range Total Dairy consumers High-end Total Dairy consumers
Sample Size = 137 Sample Size = 150 Sample Size = 128 Intake Percent Intake Percent Intake Percent
Total Foods Total Dairy Total Meats Total Fish Total Eggs Total Grains Total Vegetables Total Fruits Total Fats Total Soy Total Nuts
1.18E+01 100.0% 1.94E-01 1.6% 1.94E+00 16.5% 1.09E-01 0.9% 2.18E-01 1.8% 1.73E+00 14.7% 4.00E+00 34.0% 2.78E+00 23.6% 7.17E-01 6.1% 3.19E-01 2.7% 4.24E-02 0.4%
1.79E+01 100.0% 4.25E+00 23.7% 2.04E+00 11.4% 1.07E-01 0.6% 3.95E-01 2.2% 2.27E+00 12.7% 4.49E+00 25.0% 2.99E+00 16.7% 1.16E+00 6.5% 4.46E-01 2.5% 7.41E-02 0.4%
3.81E+01 100.0% 1.84E+01 48.3% 2.46E+00 6.4% 2.22E-01 0.6% 4.06E-01 1.1% 3.49E+00 9.1% 6.29E+00 16.5% 4.30E+00 11.3% 1.88E+00 4.9% 6.44E-01 1.7% 1.35E-01 0.4%
Table 14N. Per Capita Intake of Total Foods and Major Food Groups and Percent of Total Food Intake for Individuals with Low-End, Mid-Range, and High-end Total Dairy Intake
Age 12-19 Years (g/day)
Food Group Low-end Total Dairy consumers Mid-range Total Dairy consumers High-end Total Dairy consumers
Sample Size = 140 Sample Size = 149 Sample Size = 121 Intake Percent Intake Percent Intake Percent
Total Foods Total Dairy Total Meats Total Fish Total Eggs Total Grains Total Vegetables Total Fruits Total Fats Total Soy Total Nuts
7.17E+02 100.0% 1.26E+01 1.8% 1.18E+02 16.5% 8.47E+00 1.2% 1.40E+01 2.0% 1.03E+02 14.3% 2.46E+02 34.4% 1.65E+02 23.0% 4.50E+01 6.3% 2.04E+01 2.8% 2.31E+00 0.3%
1.09E+03 100.0% 2.58E+02 23.7% 1.22E+02 11.2% 9.99E+00 0.9% 2.06E+01 1.9% 1.29E+02 11.9% 2.79E+02 25.7% 1.91E+02 17.6% 6.51E+01 6.0% 2.55E+01 2.4% 2.55E+00 0.2%
2.22E+03 100.0% 1.04E+03 46.9% 1.69E+02 7.6% 1.09E+01 0.5% 2.71E+01 1.2% 2.03E+02 9.2% 3.95E+02 17.8% 2.33E+02 10.5% 1.12E+02 5.0% 3.71E+01 1.7% 7.22E+00 0.3%

REFERENCES
USDA (U.S. Department of Agriculture). (2000) 1994–96, 1998 continuing survey of food intakes by individuals (CSFII). CD-ROM. Agricultural Research Service, Beltsville Human Nutrition Research Center, Beltsville, MD. Available from the National Technical Information Service, Springfield, VA; PB-2000!500027.
U.S. EPA (Environmental Protection Agency). (1997) Exposure factors handbook. National Center for Environmental Assessment, Office of Research and Development, Washington, DC; EPA/600/P-95/002F (a-c). Available from the National Technical Information Service, Springfield, VA; PB98-124217, and online at http://www/epa.gov/ncea.
U.S. EPA (Environmental Protection Agency). (2000) Food commodity intake database [FCID raw data file]. Office of Pesticide Programs, Washington, DC. Available from the National Technical Information Service, Springfield, VA; PB2000-5000101.
U.S. EPA (Environmental Protection Agency). (2002) Child-specific exposure factors handbook. National Center for Environmental Assessment, Office of Research and Development, Washington, DC; EPA/600/P-00/002B. Available from the National Technical Information Service, Springfield, VA, and online at http://www/epa.gov/ncea.
U.S. EPA (Environmental Protection Agency). (2003) CSFII analysis of food intake distributions. National Center for Environmental Assessment, Washington, DC; EPA/600/R-03/029. Available from the National Technical Information Service, Springfield, VA, and online at http://www/epa.gov/ncea.
U.S. EPA (Environmental Protection Agency). (2005) Selecting Age Groups for Monitoring and Assessing Childhood Exposures to Environmental Contaminants. Office of Research and Development, Washington, DC;EPA/630/P-03/003F. Available from the National Technical Information Service, Springfield, VA, and online at http://www/epa.gov/ncea.
72