Food & groceries
11
Google Confidential and Proprietary 1 Google Confidential and Proprietary 1 Food & Groceries Russian Federation Quarterly Update Last Quarter: Q3 2015 November 2015
Transcript of Food & groceries
Google Confidential and Proprietary 1 Google Confidential and Proprietary 1
Food & Groceries Russian Federation
Quarterly Update
Last Quarter: Q3 2015
November 2015

Google Confidential and Proprietary 2 Google Confidential and Proprietary 2
Desktop queries grew by 18%, while Mobile queries grew
by 126% and Tablet searches grew by 52% YoY in the
same period
Queries grew by 60% in Q3 2015 in the
Food & Groceries Category

Google Confidential and Proprietary 3 Google Confidential and Proprietary 3
Food & Groceries:
Q3 2015 Auction Metrics Update
Source: Google internal search data, based on pre-categorised queries for the Food & Groceries. Note: In-quarter metrics for Query
Volume and Ad Depth are only available.
1 2 3 4 5 6 7 8 9 10 11 12Months
2012 2013 2014 2015
Queries (Q3 2015 Y/Y: 59.65%)
1 2 3 4 5 6 7 8 9 10 11 12Months
2012 2013 2014 2015
1 2 3 4 5 6 7 8 9 10 11 12Months
2012 2013 2014 2015
$0,00
$0,05
$0,10
$0,15
$0,20
$0,25
$0,30
1 2 3 4 5 6 7 8 9 10 11 12Months
2012 2013 2014 2015
Impressions (Q3 2015 Y/Y: -2.97%)
Clicks (Q3 2015 Y/Y: 29.46%) Actual CPC (Q3 2015 Y/Y: -32.07%,
Avg:$0.16)

Google Confidential and Proprietary 4 Google Confidential and Proprietary 4
Food & Groceries:
Q3 2015 Auction metrics update
Source: Google internal search data, based on pre-categorised queries for the Food & Groceries. Note: In-quarter metrics for Query
Volume and Ad Depth are only available.
Auction Stats by Platform: Q3 2015 YoY and Averages (where applicable)
Platform Queries Impressions Clicks Ad CTR YoY Ad CTR Avg CPC YoY CPC Avg Ad Depth YoY Ad Depth
Overall 59.65% -2.97% 29.46% 33.43% 3.46% -32.07% $0.16 -9.48% 2.41
Desktop 18.18% -15.21% -1.07% 16.67% 2.77% -25.68% $0.19 -5.57% 2.72
Mobile 126.28% 26.82% 98.87% 56.81% 5.02% -29.69% $0.12 -8.12% 1.99
Tablet 51.78% 8.76% 25.75% 15.63% 3.06% -37.21% $0.16 -12.62% 2.31
0,00%
0,50%
1,00%
1,50%
2,00%
2,50%
3,00%
3,50%
4,00%
1 2 3 4 5 6 7 8 9 10 11 12Months
2012 2013 2014 2015
0
1
1
2
2
3
3
4
1 2 3 4 5 6 7 8 9 10 11 12Months
2012 2013 2014 2015
Ad Depth (Q3 2015 Y/Y: -9.48%,
Avg:2.41)
Ad CTR(vQ3 2015 Y/Y: 33.43%,
Avg:3.46%)

Google Confidential and Proprietary 5 Google Confidential and Proprietary 5
Food & Groceries:
All Devices Auction metrics evolution
Source: Google internal search data, based on pre-categorised queries for the Food & Groceries. Note: In-quarter metrics for Query
Volume and Ad Depth are only available.
$0,00
$0,05
$0,10
$0,15
$0,20
$0,25
$0,30
0%
5%
10%
15%
20%
25%
30%
35%
40%
45%
Qu
eri
es,
Imp
ressio
ns,
Clicks a
nd
Ad
CT
R In
dex
Queries Index Clicks Index Ad CTR Impressions Index CPC
Queries Y/Y
59.65%
Impressions Y/Y
-2.97%
Clicks Y/Y
29.46%
Ad CTR Y/Y
33.43%
(3.46%)
CPC Y/Y
-32.07%
($0.16)
Google Confidential and Proprietary 6 Google Confidential and Proprietary 6
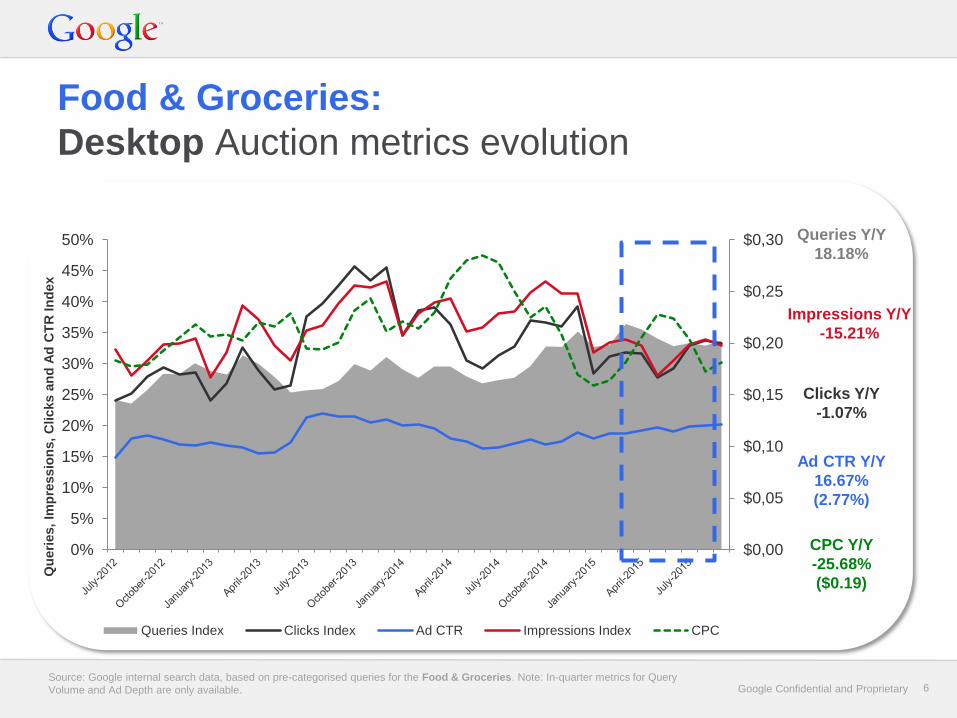
Food & Groceries:
Desktop Auction metrics evolution
Source: Google internal search data, based on pre-categorised queries for the Food & Groceries. Note: In-quarter metrics for Query
Volume and Ad Depth are only available.
$0,00
$0,05
$0,10
$0,15
$0,20
$0,25
$0,30
0%
5%
10%
15%
20%
25%
30%
35%
40%
45%
50%
Qu
eri
es,
Imp
ressio
ns,
Clicks a
nd
Ad
CT
R In
dex
Queries Index Clicks Index Ad CTR Impressions Index CPC
Queries Y/Y
18.18%
Impressions Y/Y
-15.21%
Clicks Y/Y
-1.07%
Ad CTR Y/Y
16.67%
(2.77%)
CPC Y/Y
-25.68%
($0.19)
Google Confidential and Proprietary 7 Google Confidential and Proprietary 7
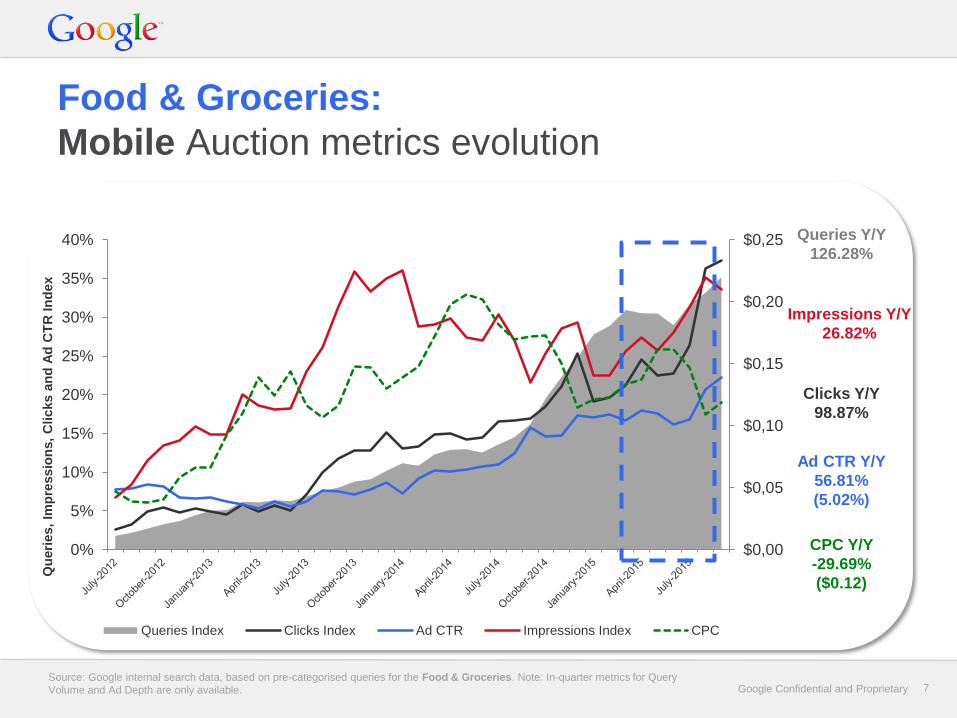
Food & Groceries:
Mobile Auction metrics evolution
Source: Google internal search data, based on pre-categorised queries for the Food & Groceries. Note: In-quarter metrics for Query
Volume and Ad Depth are only available.
$0,00
$0,05
$0,10
$0,15
$0,20
$0,25
0%
5%
10%
15%
20%
25%
30%
35%
40%
Qu
eri
es,
Imp
ressio
ns,
Clicks a
nd
Ad
CT
R In
dex
Queries Index Clicks Index Ad CTR Impressions Index CPC
Queries Y/Y
126.28%
Impressions Y/Y
26.82%
Clicks Y/Y
98.87%
Ad CTR Y/Y
56.81%
(5.02%)
CPC Y/Y
-29.69%
($0.12)
Google Confidential and Proprietary 8 Google Confidential and Proprietary 8
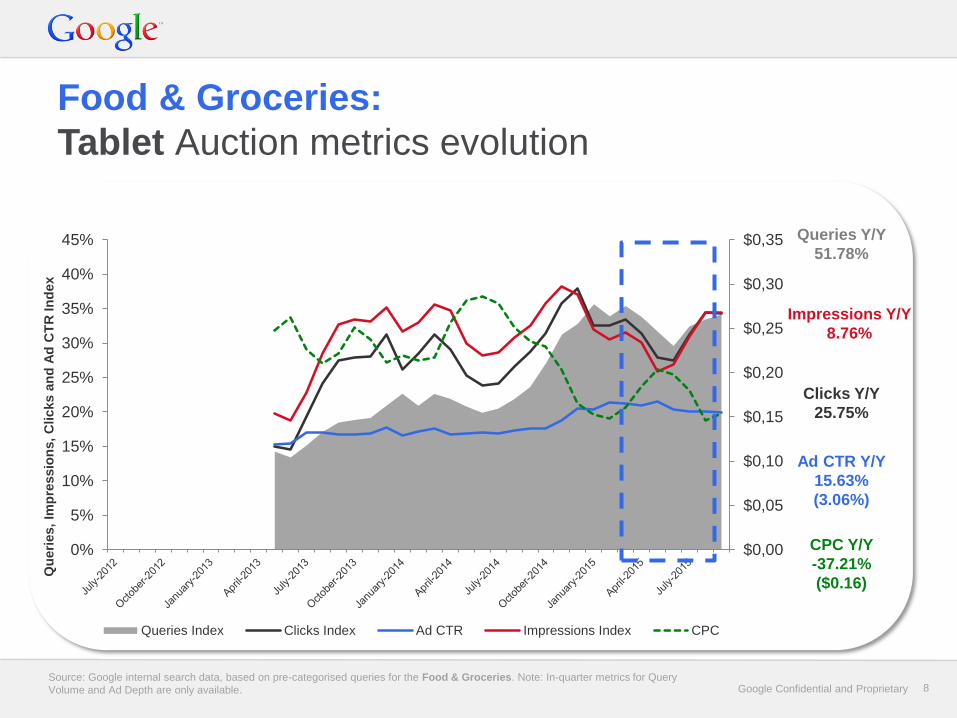
Food & Groceries:
Tablet Auction metrics evolution
Source: Google internal search data, based on pre-categorised queries for the Food & Groceries. Note: In-quarter metrics for Query
Volume and Ad Depth are only available.
$0,00
$0,05
$0,10
$0,15
$0,20
$0,25
$0,30
$0,35
0%
5%
10%
15%
20%
25%
30%
35%
40%
45%
Qu
eri
es,
Imp
ressio
ns,
Clicks a
nd
Ad
CT
R In
dex
Queries Index Clicks Index Ad CTR Impressions Index CPC
Queries Y/Y
51.78%
Impressions Y/Y
8.76%
Clicks Y/Y
25.75%
Ad CTR Y/Y
15.63%
(3.06%)
CPC Y/Y
-37.21%
($0.16)
Google Confidential and Proprietary 9 Google Confidential and Proprietary 9
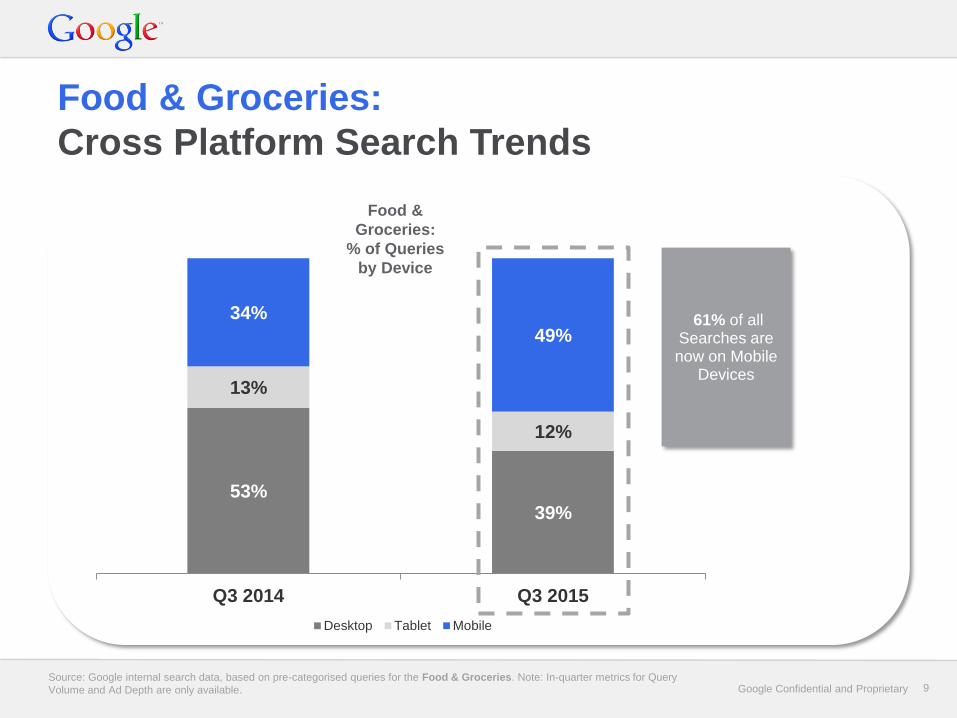
53% 39%
13%
12%
34%
49%
Q3 2014 Q3 2015
Desktop Tablet Mobile
Food & Groceries:
Cross Platform Search Trends
Source: Google internal search data, based on pre-categorised queries for the Food & Groceries. Note: In-quarter metrics for Query
Volume and Ad Depth are only available.
61% of all Searches are now on Mobile
Devices
Food &
Groceries:
% of Queries
by Device
Google Confidential and Proprietary 10 Google Confidential and Proprietary 10
Thank You!

Google Confidential and Proprietary 11 Google Confidential and Proprietary 11
Definitions
• Devices:
– Overall: Devices across Google Search(Desktop, Mobile, Tablet)
– Mobile = Overall – (Computers + Tablet)
– Tablet = Overall – (Mobile + Computers)
– Mobile is Mobile High End devices with a full browser
– Tablet is Tablet devices with a full browser
• Metrics
– Queries: Searches by users on Google Search
– Impressions: AdWords ads shown against search queries on Google Search
– Clicks: Clicks on AdWords ads
– CPC: Cost per Click (Cost ÷ Clicks)
– Ad CTR: Click-through Rate (Clicks ÷ Impressions)