Food & Beverage Report Q2 2016 - SDR Ventures · PDF fileFOOD & BEVERAGE REPORT Q2 2016 ......
12
720.221.9220 | SDRVENTURES.COM Investment Banking & Securities Offered Through SDR Capital Markets, Inc., Member FINRA & SIPC. FOOD & BEVERAGE REPORT Q2 2016 Explore M&A Activity, Capital Market Conditions and Current Trends for the Food & Beverage Industry
-
Upload
phungquynh -
Category
Documents
-
view
223 -
download
0
Transcript of Food & Beverage Report Q2 2016 - SDR Ventures · PDF fileFOOD & BEVERAGE REPORT Q2 2016 ......
720.221.9220 | SDRVENTURES.COMInvestment Banking & Securities Offered Through SDR Capital Markets, Inc., Member FINRA & SIPC.
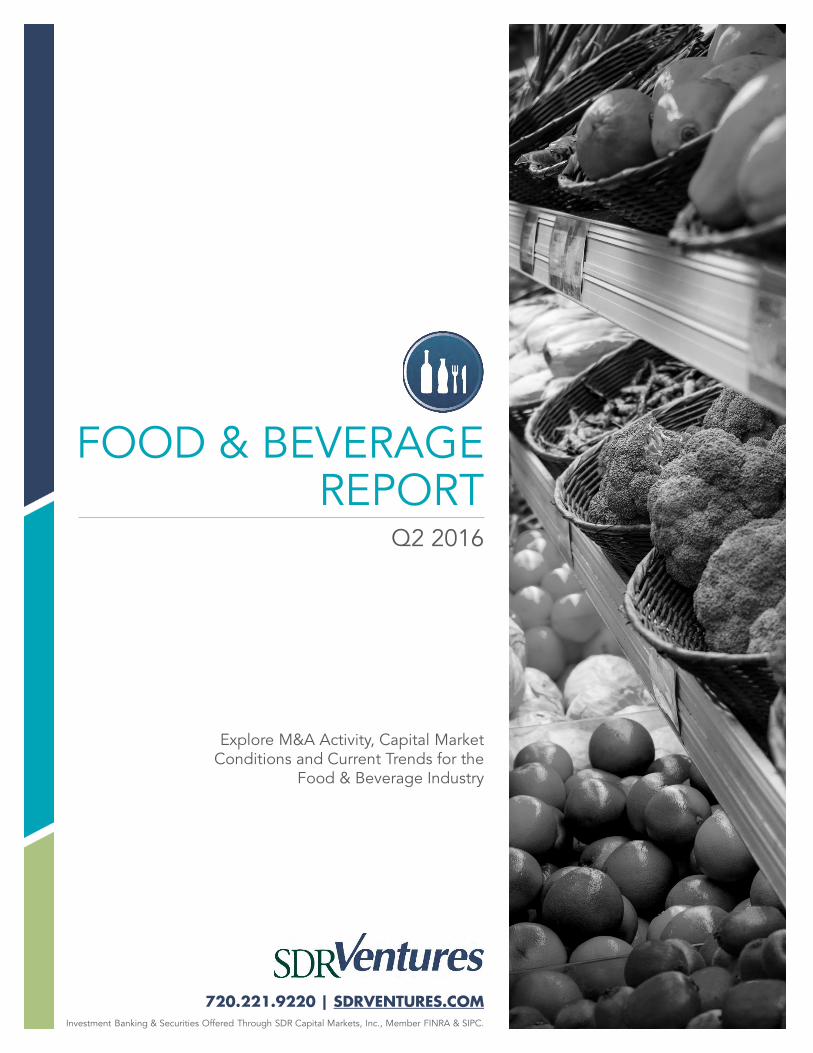
FOOD & BEVERAGE REPORT
Q2 2016
Explore M&A Activity, Capital Market Conditions and Current Trends for the
Food & Beverage Industry

720.221.9220 | SDRVENTURES.COMInvestment Banking and Securities Offered Through SDR Capital Markets, Inc., Member FINRA and SIPC.
FOOD & BEVERAGE REPORTQ2 2016 | VOL 4 | ISSUE 2
Q2 INDUSTRY UPDATEIn 1957, applied mathematician and UCLA marketing professor Igor Ansoffintroduced a concept called the Ansoff Matrix. The Ansoff Matrix was designedto visualize the strategy in which companies formulate products to entermarkets. The purpose of the matrix was to give management teams the abilityto think strategically about the potential risks and returns on various growthstrategies.
The characteristics of each quality are explained below:
2
The information contained herein is based on sources we believe reliable but is not guaranteed by us and is not to be considered all-inclusive. It is notto be construed as an offer or consultation of an offer to sell or buy any securities.
Established in 2002, SDR Ventures hasdeveloped deep M&A and capitaltransaction knowledge and expertise.SDR offers transaction advisory, privatecapital formation and businessconsulting services across a wide rangeof industries. We serve business ownersand operators of privately heldcompanies and provide them with aprofessional-class experience.
ABOUT SDR
Transaction ActivityActive BuyersPublic BasketM&A Market ActivityAbout SDR Ventures
FOOD & BEVERAGE CONTACTS
CONTENTS
Travis ConwayManaging Director –Food & Beverage [email protected]
Ben RudmanDirector –Food & Beverage [email protected]
Eric BosveldDirector –Food & Beverage [email protected]
Market Penetration Quadrant:Least risky because product andmarket fit already have beenproven/established. Least returnbecause the lack of risk creates alow barrier to entry, meaninglots of competition. Usually acommodity/price-driven marketwhere players who compete onprice and capitalization win.
Market Development and Product Development Quadrants: Incrementally more
Over the past five years, we have observed rapid venture capital investment and M&A activity in the diversification and product development quadrants, where innovation is derived from the conscious consumer demand for healthier, more functional, simpler, and allergen-free ingredients. These innovations started in many cases 25 years ago, but the rate at which consumer demand has accelerated toward these product features has rapidly outpaced the innovation cycles at large for food & beverage companies. This has created fertile ground for M&A activity.
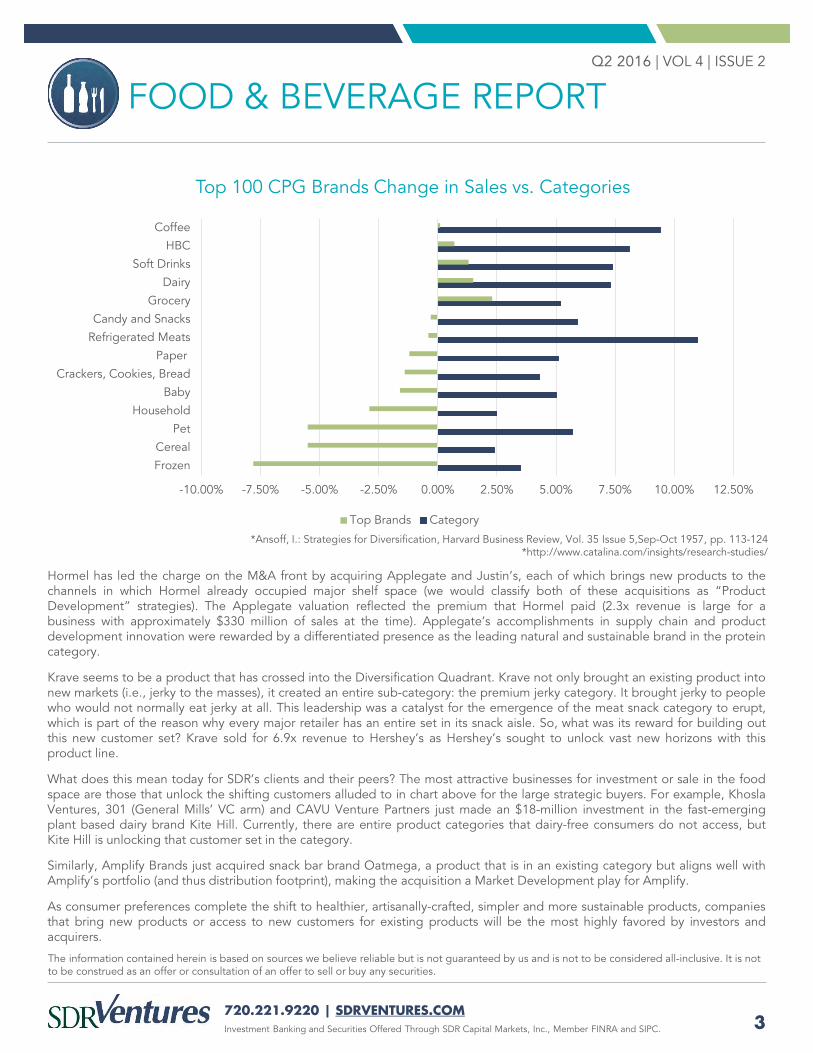
Catalina’s 2015 mid-year review revealed a dramatic loss in share across nearly all categories by top 100 CPG brands. It is clear that the strategy for large entities in this $1.2-trillion industry has shifted from “Market Penetration” to the other three quadrants. Consumers rapidly are shifting to new markets, and to keep up the large players must either innovate quickly or acquire companies that are doing so.
risk and return because either the product or the channel has been proven,but not both. Incrementally more return because something special orinnovative must be done to create a new product or enter a new market.
The Diversification Quadrant: Riskiest because the company is not justtrying to acquire market share, but it’s also trying to create a new marketaltogether. There is no proof that existing channels for the product evenexist.
720.221.9220 | SDRVENTURES.COMInvestment Banking and Securities Offered Through SDR Capital Markets, Inc., Member FINRA and SIPC.
FOOD & BEVERAGE REPORTQ2 2016 | VOL 4 | ISSUE 2
Hormel has led the charge on the M&A front by acquiring Applegate and Justin’s, each of which brings new products to thechannels in which Hormel already occupied major shelf space (we would classify both of these acquisitions as “ProductDevelopment” strategies). The Applegate valuation reflected the premium that Hormel paid (2.3x revenue is large for abusiness with approximately $330 million of sales at the time). Applegate’s accomplishments in supply chain and productdevelopment innovation were rewarded by a differentiated presence as the leading natural and sustainable brand in the proteincategory.
Krave seems to be a product that has crossed into the Diversification Quadrant. Krave not only brought an existing product intonew markets (i.e., jerky to the masses), it created an entire sub-category: the premium jerky category. It brought jerky to peoplewho would not normally eat jerky at all. This leadership was a catalyst for the emergence of the meat snack category to erupt,which is part of the reason why every major retailer has an entire set in its snack aisle. So, what was its reward for building outthis new customer set? Krave sold for 6.9x revenue to Hershey’s as Hershey’s sought to unlock vast new horizons with thisproduct line.
What does this mean today for SDR’s clients and their peers? The most attractive businesses for investment or sale in the foodspace are those that unlock the shifting customers alluded to in chart above for the large strategic buyers. For example, KhoslaVentures, 301 (General Mills’ VC arm) and CAVU Venture Partners just made an $18-million investment in the fast-emergingplant based dairy brand Kite Hill. Currently, there are entire product categories that dairy-free consumers do not access, butKite Hill is unlocking that customer set in the category.
Similarly, Amplify Brands just acquired snack bar brand Oatmega, a product that is in an existing category but aligns well withAmplify’s portfolio (and thus distribution footprint), making the acquisition a Market Development play for Amplify.
As consumer preferences complete the shift to healthier, artisanally-crafted, simpler and more sustainable products, companiesthat bring new products or access to new customers for existing products will be the most highly favored by investors andacquirers.
3
The information contained herein is based on sources we believe reliable but is not guaranteed by us and is not to be considered all-inclusive. It is not to be construed as an offer or consultation of an offer to sell or buy any securities.
-10.00% -7.50% -5.00% -2.50% 0.00% 2.50% 5.00% 7.50% 10.00% 12.50%
Frozen
Cereal
Pet
Household
Baby
Crackers, Cookies, Bread
Paper
Refrigerated Meats
Candy and Snacks
Grocery
Dairy
Soft Drinks
HBC
Coffee
Top 100 CPG Brands Change in Sales vs. Categories
Top Brands Category
*Ansoff, I.: Strategies for Diversification, Harvard Business Review, Vol. 35 Issue 5,Sep-Oct 1957, pp. 113-124*http://www.catalina.com/insights/research-studies/
720.221.9220 | SDRVENTURES.COM
FOOD & BEVERAGE REPORTQ2 2016 | VOL 4 | ISSUE 2
Investment Banking and Securities Offered Through SDR Capital Markets, Inc., Member FINRA and SIPC.
Date Target Buyer(s) SegmentAmount($ in Mil)
TEV/Rev
TEV/EBITDA
6/30/2016 The Hershey Company Mondelez International, Inc.
CPG Foods 25,471 3.46 15.09
6/27/2016 Milk Specialties Company American Securities Dairy - - -
6/17/2016 Ceres, Inc. Land O Lakes Inc. Dairy 11 1.64 -
6/14/2016 Wm. Wrigley Jr. Company Mars, Incorporated CPG Foods 50 - -
6/9/2016 Brooks Peanut Company, Inc. Olam International Limited Produce 85 - -
6/2/2016 The Ridgefield's Brand Corporation Country Pure Foods, Inc. CPG Foods 14 1.07 -
5/23/2016 Conagra Foods Food Ingredients Company, Inc.
Givaudan SA Ingredients & Flavors 340 - -
5/23/2016 B.T.T.R Ventures LLC Red Sea Ventures; S2G Ventures; Acre Venture Partners
Produce 10 - -
5/18/2016 Monsanto Company Bayer AG Ingredients & Flavors 62,322 4.48 15.32
5/18/2016 Justin's, LLC Hormel Foods Corporation Natural & Organic Foods 286 - -
4
ACCESS FULL LISTNote: These data represent recorded transactions only, and are not all-inclusive. Nevertheless, they are typically representative of the industry.
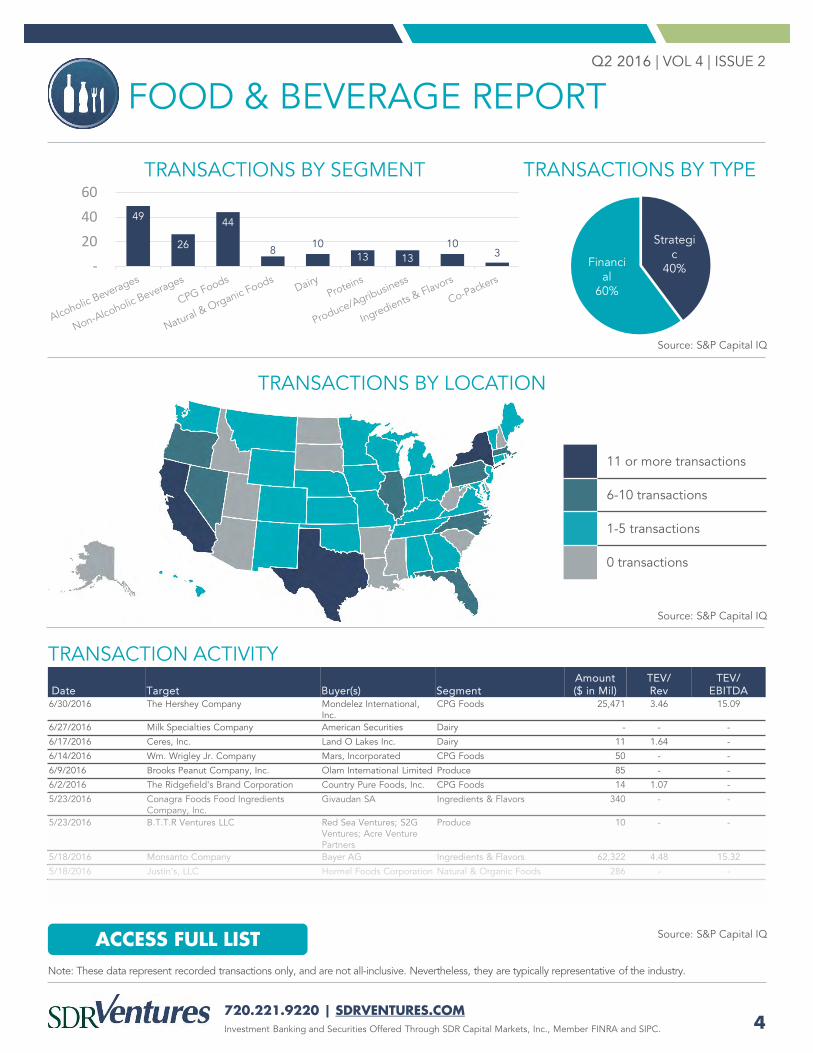
49
26
44
8 10
13 13 10
3 -
20 40 60
11 or more transactions
6-10 transactions
1-5 transactions
0 transactions
TRANSACTIONS BY SEGMENT TRANSACTIONS BY TYPE
TRANSACTIONS BY LOCATION
TRANSACTION ACTIVITY
Source: S&P Capital IQ
Source: S&P Capital IQ
Source: S&P Capital IQ
Strategic
40%Financial
60%
720.221.9220 | SDRVENTURES.COM
FOOD & BEVERAGE REPORTQ2 2016 | VOL 4 | ISSUE 2
Investment Banking and Securities Offered Through SDR Capital Markets, Inc., Member FINRA and SIPC. 5
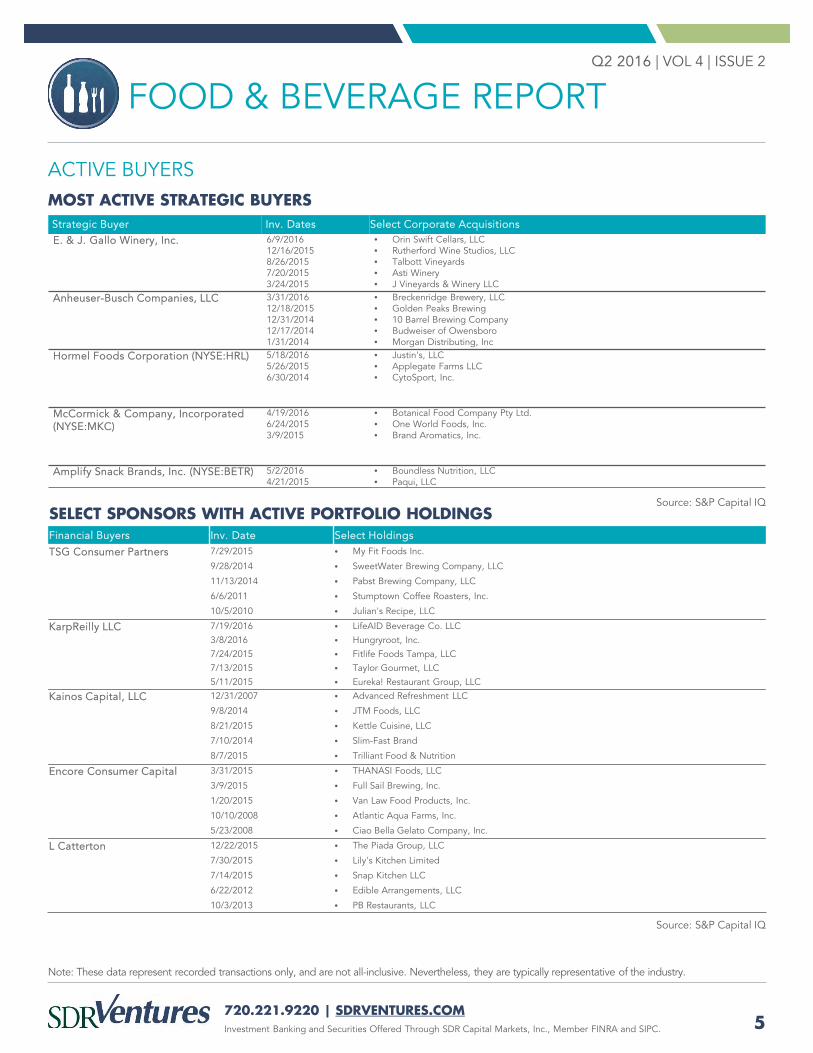
ACTIVE BUYERSMOST ACTIVE STRATEGIC BUYERS
Note: These data represent recorded transactions only, and are not all-inclusive. Nevertheless, they are typically representative of the industry.
SELECT SPONSORS WITH ACTIVE PORTFOLIO HOLDINGS
Strategic Buyer Inv. Dates Select Corporate AcquisitionsE. & J. Gallo Winery, Inc. 6/9/2016
12/16/20158/26/20157/20/20153/24/2015
• Orin Swift Cellars, LLC• Rutherford Wine Studios, LLC• Talbott Vineyards• Asti Winery• J Vineyards & Winery LLC
Anheuser-Busch Companies, LLC 3/31/201612/18/201512/31/201412/17/20141/31/2014
• Breckenridge Brewery, LLC• Golden Peaks Brewing • 10 Barrel Brewing Company• Budweiser of Owensboro• Morgan Distributing, Inc
Hormel Foods Corporation (NYSE:HRL) 5/18/20165/26/20156/30/2014
• Justin's, LLC• Applegate Farms LLC• CytoSport, Inc.
McCormick & Company, Incorporated (NYSE:MKC)
4/19/20166/24/20153/9/2015
• Botanical Food Company Pty Ltd.• One World Foods, Inc.• Brand Aromatics, Inc.
Amplify Snack Brands, Inc. (NYSE:BETR) 5/2/20164/21/2015
• Boundless Nutrition, LLC• Paqui, LLC
Source: S&P Capital IQ
Source: S&P Capital IQ
Financial Buyers Inv. Date Select Holdings
TSG Consumer Partners 7/29/2015 • My Fit Foods Inc.
9/28/2014 • SweetWater Brewing Company, LLC
11/13/2014 • Pabst Brewing Company, LLC
6/6/2011 • Stumptown Coffee Roasters, Inc.
10/5/2010 • Julian's Recipe, LLC
KarpReilly LLC 7/19/2016 • LifeAID Beverage Co. LLC3/8/2016 • Hungryroot, Inc. 7/24/2015 • Fitlife Foods Tampa, LLC7/13/2015 • Taylor Gourmet, LLC5/11/2015 • Eureka! Restaurant Group, LLC
Kainos Capital, LLC 12/31/2007 • Advanced Refreshment LLC
9/8/2014 • JTM Foods, LLC
8/21/2015 • Kettle Cuisine, LLC
7/10/2014 • Slim-Fast Brand
8/7/2015 • Trilliant Food & Nutrition
Encore Consumer Capital 3/31/2015 • THANASI Foods, LLC
3/9/2015 • Full Sail Brewing, Inc.
1/20/2015 • Van Law Food Products, Inc.
10/10/2008 • Atlantic Aqua Farms, Inc.
5/23/2008 • Ciao Bella Gelato Company, Inc.
L Catterton 12/22/2015 • The Piada Group, LLC
7/30/2015 • Lily's Kitchen Limited
7/14/2015 • Snap Kitchen LLC
6/22/2012 • Edible Arrangements, LLC
10/3/2013 • PB Restaurants, LLC
720.221.9220 | SDRVENTURES.COM
FOOD & BEVERAGE REPORTQ2 2016 | VOL 4 | ISSUE 2
Investment Banking and Securities Offered Through SDR Capital Markets, Inc., Member FINRA and SIPC.
PUBLIC BASKET
6
ALCOHOLIC BEVERAGES
Note: These data represent recorded transactions only, and are not all-inclusive. Nevertheless, they are typically representative of the industry.
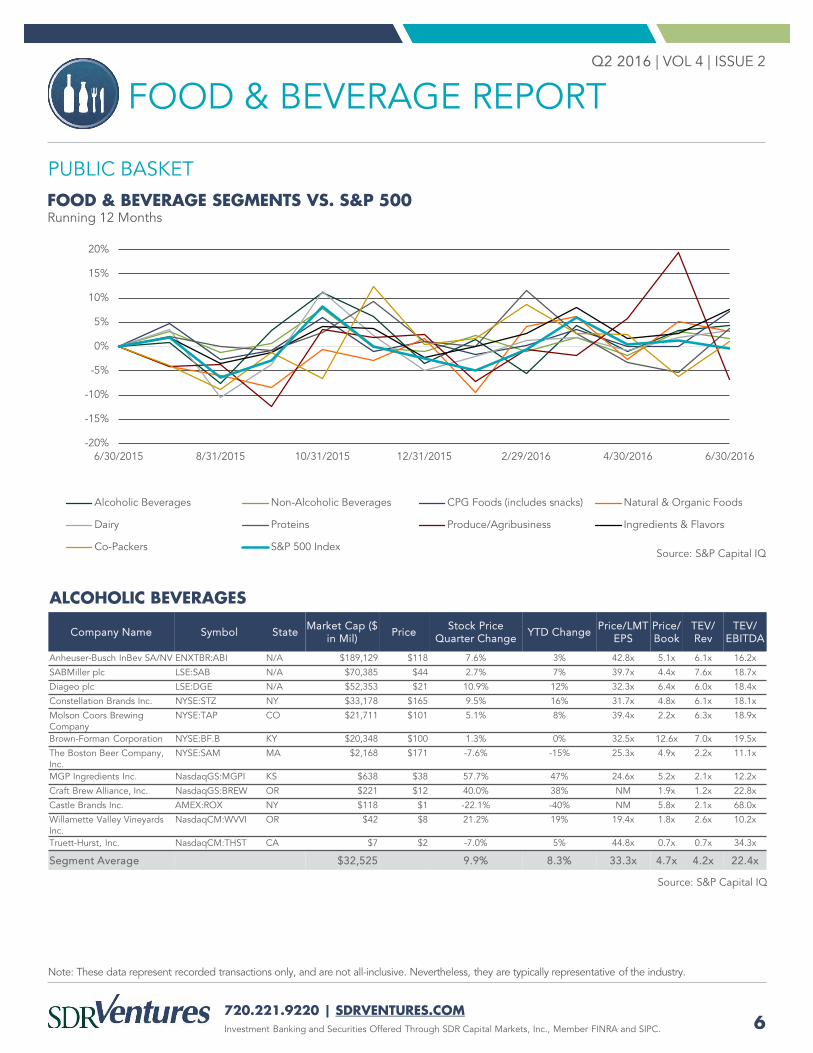
FOOD & BEVERAGE SEGMENTS VS. S&P 500Running 12 Months
-20%
-15%
-10%
-5%
0%
5%
10%
15%
20%
6/30/2015 8/31/2015 10/31/2015 12/31/2015 2/29/2016 4/30/2016 6/30/2016
Alcoholic Beverages Non-Alcoholic Beverages CPG Foods (includes snacks) Natural & Organic Foods
Dairy Proteins Produce/Agribusiness Ingredients & Flavors
Co-Packers S&P 500 Index
Company Name Symbol State Market Cap ($ in Mil) Price Stock Price
Quarter Change YTD Change Price/LMT EPS
Price/ Book
TEV/ Rev
TEV/ EBITDA
Anheuser-Busch InBev SA/NV ENXTBR:ABI N/A $189,129 $118 7.6% 3% 42.8x 5.1x 6.1x 16.2x
SABMiller plc LSE:SAB N/A $70,385 $44 2.7% 7% 39.7x 4.4x 7.6x 18.7x
Diageo plc LSE:DGE N/A $52,353 $21 10.9% 12% 32.3x 6.4x 6.0x 18.4x
Constellation Brands Inc. NYSE:STZ NY $33,178 $165 9.5% 16% 31.7x 4.8x 6.1x 18.1x
Molson Coors Brewing Company
NYSE:TAP CO $21,711 $101 5.1% 8% 39.4x 2.2x 6.3x 18.9x
Brown-Forman Corporation NYSE:BF.B KY $20,348 $100 1.3% 0% 32.5x 12.6x 7.0x 19.5x
The Boston Beer Company, Inc.
NYSE:SAM MA $2,168 $171 -7.6% -15% 25.3x 4.9x 2.2x 11.1x
MGP Ingredients Inc. NasdaqGS:MGPI KS $638 $38 57.7% 47% 24.6x 5.2x 2.1x 12.2x
Craft Brew Alliance, Inc. NasdaqGS:BREW OR $221 $12 40.0% 38% NM 1.9x 1.2x 22.8x
Castle Brands Inc. AMEX:ROX NY $118 $1 -22.1% -40% NM 5.8x 2.1x 68.0x
Willamette Valley Vineyards Inc.
NasdaqCM:WVVI OR $42 $8 21.2% 19% 19.4x 1.8x 2.6x 10.2x
Truett-Hurst, Inc. NasdaqCM:THST CA $7 $2 -7.0% 5% 44.8x 0.7x 0.7x 34.3x
Segment Average $32,525 9.9% 8.3% 33.3x 4.7x 4.2x 22.4x
Source: S&P Capital IQ
Source: S&P Capital IQ
720.221.9220 | SDRVENTURES.COM
FOOD & BEVERAGE REPORTQ2 2016 | VOL 4 | ISSUE 2
Investment Banking and Securities Offered Through SDR Capital Markets, Inc., Member FINRA and SIPC. 7
Note: These data represent recorded transactions only, and are not all-inclusive. Nevertheless, they are typically representative of the industry.
PUBLIC BASKET (CONTINUED)
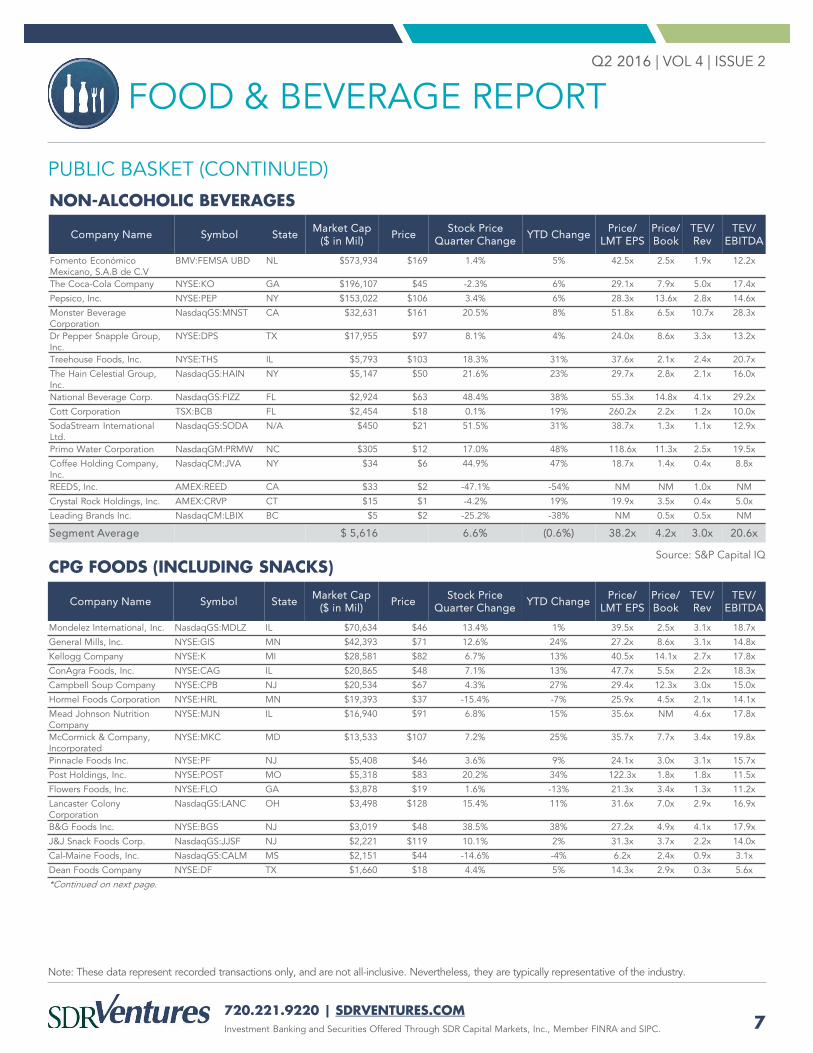
NON-ALCOHOLIC BEVERAGES
Company Name Symbol State Market Cap($ in Mil) Price Stock Price
Quarter Change YTD Change Price/LMT EPS
Price/ Book
TEV/ Rev
TEV/ EBITDA
Fomento Económico Mexicano, S.A.B de C.V
BMV:FEMSA UBD NL $573,934 $169 1.4% 5% 42.5x 2.5x 1.9x 12.2x
The Coca-Cola Company NYSE:KO GA $196,107 $45 -2.3% 6% 29.1x 7.9x 5.0x 17.4x
Pepsico, Inc. NYSE:PEP NY $153,022 $106 3.4% 6% 28.3x 13.6x 2.8x 14.6x
Monster Beverage Corporation
NasdaqGS:MNST CA $32,631 $161 20.5% 8% 51.8x 6.5x 10.7x 28.3x
Dr Pepper Snapple Group, Inc.
NYSE:DPS TX $17,955 $97 8.1% 4% 24.0x 8.6x 3.3x 13.2x
Treehouse Foods, Inc. NYSE:THS IL $5,793 $103 18.3% 31% 37.6x 2.1x 2.4x 20.7x
The Hain Celestial Group, Inc.
NasdaqGS:HAIN NY $5,147 $50 21.6% 23% 29.7x 2.8x 2.1x 16.0x
National Beverage Corp. NasdaqGS:FIZZ FL $2,924 $63 48.4% 38% 55.3x 14.8x 4.1x 29.2x
Cott Corporation TSX:BCB FL $2,454 $18 0.1% 19% 260.2x 2.2x 1.2x 10.0x
SodaStream International Ltd.
NasdaqGS:SODA N/A $450 $21 51.5% 31% 38.7x 1.3x 1.1x 12.9x
Primo Water Corporation NasdaqGM:PRMW NC $305 $12 17.0% 48% 118.6x 11.3x 2.5x 19.5x
Coffee Holding Company, Inc.
NasdaqCM:JVA NY $34 $6 44.9% 47% 18.7x 1.4x 0.4x 8.8x
REEDS, Inc. AMEX:REED CA $33 $2 -47.1% -54% NM NM 1.0x NM
Crystal Rock Holdings, Inc. AMEX:CRVP CT $15 $1 -4.2% 19% 19.9x 3.5x 0.4x 5.0x
Leading Brands Inc. NasdaqCM:LBIX BC $5 $2 -25.2% -38% NM 0.5x 0.5x NM
Segment Average $ 5,616 6.6% (0.6%) 38.2x 4.2x 3.0x 20.6x
Source: S&P Capital IQCPG FOODS (INCLUDING SNACKS)
Company Name Symbol State Market Cap($ in Mil) Price Stock Price
Quarter Change YTD Change Price/LMT EPS
Price/ Book
TEV/ Rev
TEV/ EBITDA
Mondelez International, Inc. NasdaqGS:MDLZ IL $70,634 $46 13.4% 1% 39.5x 2.5x 3.1x 18.7x
General Mills, Inc. NYSE:GIS MN $42,393 $71 12.6% 24% 27.2x 8.6x 3.1x 14.8x
Kellogg Company NYSE:K MI $28,581 $82 6.7% 13% 40.5x 14.1x 2.7x 17.8x
ConAgra Foods, Inc. NYSE:CAG IL $20,865 $48 7.1% 13% 47.7x 5.5x 2.2x 18.3x
Campbell Soup Company NYSE:CPB NJ $20,534 $67 4.3% 27% 29.4x 12.3x 3.0x 15.0x
Hormel Foods Corporation NYSE:HRL MN $19,393 $37 -15.4% -7% 25.9x 4.5x 2.1x 14.1x
Mead Johnson Nutrition Company
NYSE:MJN IL $16,940 $91 6.8% 15% 35.6x NM 4.6x 17.8x
McCormick & Company, Incorporated
NYSE:MKC MD $13,533 $107 7.2% 25% 35.7x 7.7x 3.4x 19.8x
Pinnacle Foods Inc. NYSE:PF NJ $5,408 $46 3.6% 9% 24.1x 3.0x 3.1x 15.7x
Post Holdings, Inc. NYSE:POST MO $5,318 $83 20.2% 34% 122.3x 1.8x 1.8x 11.5x
Flowers Foods, Inc. NYSE:FLO GA $3,878 $19 1.6% -13% 21.3x 3.4x 1.3x 11.2x
Lancaster Colony Corporation
NasdaqGS:LANC OH $3,498 $128 15.4% 11% 31.6x 7.0x 2.9x 16.9x
B&G Foods Inc. NYSE:BGS NJ $3,019 $48 38.5% 38% 27.2x 4.9x 4.1x 17.9x
J&J Snack Foods Corp. NasdaqGS:JJSF NJ $2,221 $119 10.1% 2% 31.3x 3.7x 2.2x 14.0x
Cal-Maine Foods, Inc. NasdaqGS:CALM MS $2,151 $44 -14.6% -4% 6.2x 2.4x 0.9x 3.1x
Dean Foods Company NYSE:DF TX $1,660 $18 4.4% 5% 14.3x 2.9x 0.3x 5.6x
*Continued on next page.
720.221.9220 | SDRVENTURES.COM
FOOD & BEVERAGE REPORTQ2 2016 | VOL 4 | ISSUE 2
Investment Banking and Securities Offered Through SDR Capital Markets, Inc., Member FINRA and SIPC. 8
Note: These data represent recorded transactions only, and are not all-inclusive. Nevertheless, they are typically representative of the industry.
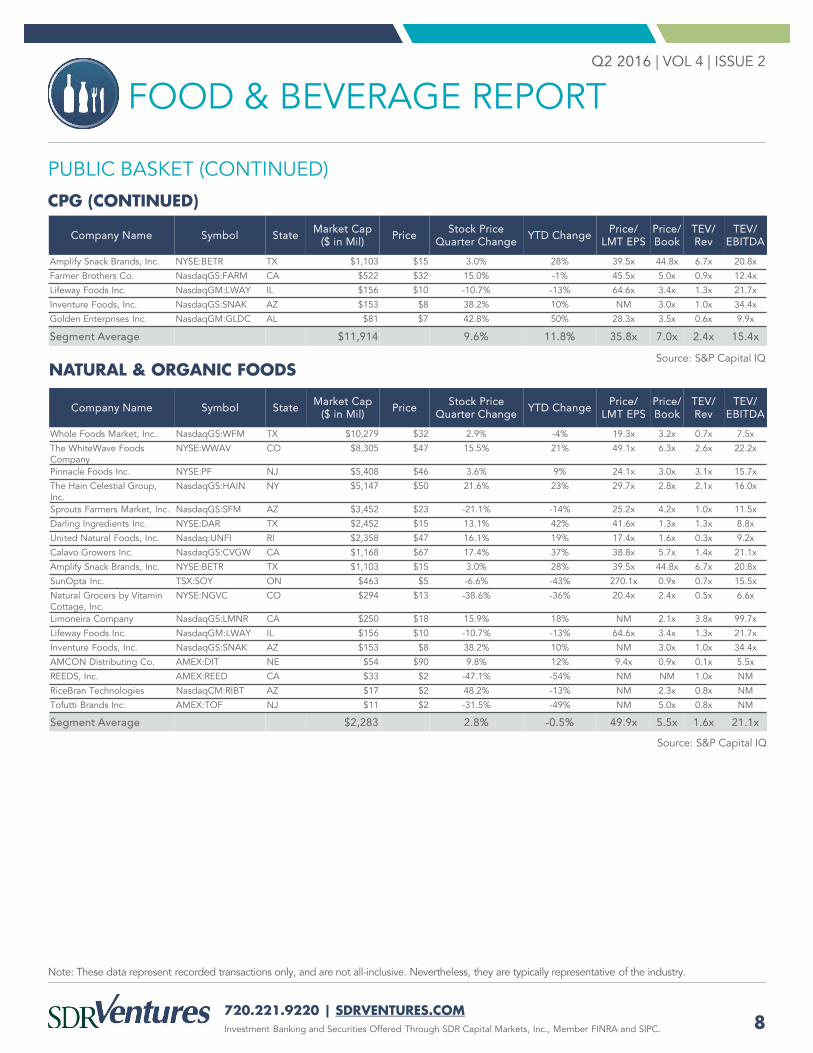
PUBLIC BASKET (CONTINUED)
CPG (CONTINUED)
Company Name Symbol State Market Cap($ in Mil) Price Stock Price
Quarter Change YTD Change Price/LMT EPS
Price/ Book
TEV/ Rev
TEV/ EBITDA
Amplify Snack Brands, Inc. NYSE:BETR TX $1,103 $15 3.0% 28% 39.5x 44.8x 6.7x 20.8x
Farmer Brothers Co. NasdaqGS:FARM CA $522 $32 15.0% -1% 45.5x 5.0x 0.9x 12.4x
Lifeway Foods Inc. NasdaqGM:LWAY IL $156 $10 -10.7% -13% 64.6x 3.4x 1.3x 21.7x
Inventure Foods, Inc. NasdaqGS:SNAK AZ $153 $8 38.2% 10% NM 3.0x 1.0x 34.4x
Golden Enterprises Inc. NasdaqGM:GLDC AL $81 $7 42.8% 50% 28.3x 3.5x 0.6x 9.9x
Segment Average $11,914 9.6% 11.8% 35.8x 7.0x 2.4x 15.4x
Source: S&P Capital IQNATURAL & ORGANIC FOODS
Company Name Symbol State Market Cap($ in Mil) Price Stock Price
Quarter Change YTD Change Price/LMT EPS
Price/ Book
TEV/ Rev
TEV/ EBITDA
Whole Foods Market, Inc. NasdaqGS:WFM TX $10,279 $32 2.9% -4% 19.3x 3.2x 0.7x 7.5x
The WhiteWave Foods Company
NYSE:WWAV CO $8,305 $47 15.5% 21% 49.1x 6.3x 2.6x 22.2x
Pinnacle Foods Inc. NYSE:PF NJ $5,408 $46 3.6% 9% 24.1x 3.0x 3.1x 15.7x
The Hain Celestial Group, Inc.
NasdaqGS:HAIN NY $5,147 $50 21.6% 23% 29.7x 2.8x 2.1x 16.0x
Sprouts Farmers Market, Inc. NasdaqGS:SFM AZ $3,452 $23 -21.1% -14% 25.2x 4.2x 1.0x 11.5x
Darling Ingredients Inc. NYSE:DAR TX $2,452 $15 13.1% 42% 41.6x 1.3x 1.3x 8.8x
United Natural Foods, Inc. Nasdaq:UNFI RI $2,358 $47 16.1% 19% 17.4x 1.6x 0.3x 9.2x
Calavo Growers Inc. NasdaqGS:CVGW CA $1,168 $67 17.4% 37% 38.8x 5.7x 1.4x 21.1x
Amplify Snack Brands, Inc. NYSE:BETR TX $1,103 $15 3.0% 28% 39.5x 44.8x 6.7x 20.8x
SunOpta Inc. TSX:SOY ON $463 $5 -6.6% -43% 270.1x 0.9x 0.7x 15.5x
Natural Grocers by Vitamin Cottage, Inc.
NYSE:NGVC CO $294 $13 -38.6% -36% 20.4x 2.4x 0.5x 6.6x
Limoneira Company NasdaqGS:LMNR CA $250 $18 15.9% 18% NM 2.1x 3.8x 99.7x
Lifeway Foods Inc. NasdaqGM:LWAY IL $156 $10 -10.7% -13% 64.6x 3.4x 1.3x 21.7x
Inventure Foods, Inc. NasdaqGS:SNAK AZ $153 $8 38.2% 10% NM 3.0x 1.0x 34.4x
AMCON Distributing Co. AMEX:DIT NE $54 $90 9.8% 12% 9.4x 0.9x 0.1x 5.5x
REEDS, Inc. AMEX:REED CA $33 $2 -47.1% -54% NM NM 1.0x NM
RiceBran Technologies NasdaqCM:RIBT AZ $17 $2 48.2% -13% NM 2.3x 0.8x NM
Tofutti Brands Inc. AMEX:TOF NJ $11 $2 -31.5% -49% NM 5.0x 0.8x NM
Segment Average $2,283 2.8% -0.5% 49.9x 5.5x 1.6x 21.1x
Source: S&P Capital IQ
720.221.9220 | SDRVENTURES.COM
FOOD & BEVERAGE REPORTQ2 2016 | VOL 4 | ISSUE 2
Investment Banking and Securities Offered Through SDR Capital Markets, Inc., Member FINRA and SIPC. 9
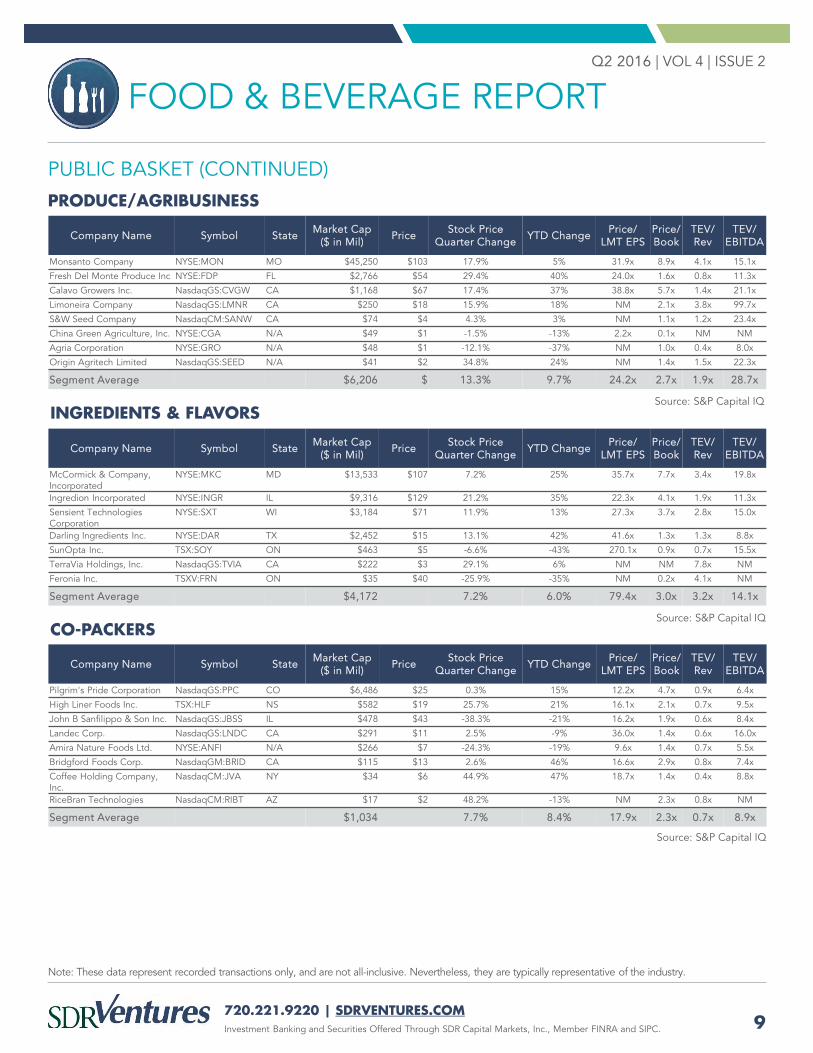
INGREDIENTS & FLAVORS
Note: These data represent recorded transactions only, and are not all-inclusive. Nevertheless, they are typically representative of the industry.
PUBLIC BASKET (CONTINUED)
Company Name Symbol State Market Cap($ in Mil) Price Stock Price
Quarter Change YTD Change Price/LMT EPS
Price/ Book
TEV/ Rev
TEV/ EBITDA
McCormick & Company, Incorporated
NYSE:MKC MD $13,533 $107 7.2% 25% 35.7x 7.7x 3.4x 19.8x
Ingredion Incorporated NYSE:INGR IL $9,316 $129 21.2% 35% 22.3x 4.1x 1.9x 11.3x
Sensient Technologies Corporation
NYSE:SXT WI $3,184 $71 11.9% 13% 27.3x 3.7x 2.8x 15.0x
Darling Ingredients Inc. NYSE:DAR TX $2,452 $15 13.1% 42% 41.6x 1.3x 1.3x 8.8x
SunOpta Inc. TSX:SOY ON $463 $5 -6.6% -43% 270.1x 0.9x 0.7x 15.5x
TerraVia Holdings, Inc. NasdaqGS:TVIA CA $222 $3 29.1% 6% NM NM 7.8x NM
Feronia Inc. TSXV:FRN ON $35 $40 -25.9% -35% NM 0.2x 4.1x NM
Segment Average $4,172 7.2% 6.0% 79.4x 3.0x 3.2x 14.1x
Source: S&P Capital IQ
Source: S&P Capital IQCO-PACKERS
Company Name Symbol State Market Cap($ in Mil) Price Stock Price
Quarter Change YTD Change Price/LMT EPS
Price/ Book
TEV/ Rev
TEV/ EBITDA
Pilgrim's Pride Corporation NasdaqGS:PPC CO $6,486 $25 0.3% 15% 12.2x 4.7x 0.9x 6.4x
High Liner Foods Inc. TSX:HLF NS $582 $19 25.7% 21% 16.1x 2.1x 0.7x 9.5x
John B Sanfilippo & Son Inc. NasdaqGS:JBSS IL $478 $43 -38.3% -21% 16.2x 1.9x 0.6x 8.4x
Landec Corp. NasdaqGS:LNDC CA $291 $11 2.5% -9% 36.0x 1.4x 0.6x 16.0x
Amira Nature Foods Ltd. NYSE:ANFI N/A $266 $7 -24.3% -19% 9.6x 1.4x 0.7x 5.5x
Bridgford Foods Corp. NasdaqGM:BRID CA $115 $13 2.6% 46% 16.6x 2.9x 0.8x 7.4x
Coffee Holding Company, Inc.
NasdaqCM:JVA NY $34 $6 44.9% 47% 18.7x 1.4x 0.4x 8.8x
RiceBran Technologies NasdaqCM:RIBT AZ $17 $2 48.2% -13% NM 2.3x 0.8x NM
Segment Average $1,034 7.7% 8.4% 17.9x 2.3x 0.7x 8.9x
PRODUCE/AGRIBUSINESS
Company Name Symbol State Market Cap($ in Mil) Price Stock Price
Quarter Change YTD Change Price/LMT EPS
Price/ Book
TEV/ Rev
TEV/ EBITDA
Monsanto Company NYSE:MON MO $45,250 $103 17.9% 5% 31.9x 8.9x 4.1x 15.1x
Fresh Del Monte Produce Inc NYSE:FDP FL $2,766 $54 29.4% 40% 24.0x 1.6x 0.8x 11.3x
Calavo Growers Inc. NasdaqGS:CVGW CA $1,168 $67 17.4% 37% 38.8x 5.7x 1.4x 21.1x
Limoneira Company NasdaqGS:LMNR CA $250 $18 15.9% 18% NM 2.1x 3.8x 99.7x
S&W Seed Company NasdaqCM:SANW CA $74 $4 4.3% 3% NM 1.1x 1.2x 23.4x
China Green Agriculture, Inc. NYSE:CGA N/A $49 $1 -1.5% -13% 2.2x 0.1x NM NM
Agria Corporation NYSE:GRO N/A $48 $1 -12.1% -37% NM 1.0x 0.4x 8.0x
Origin Agritech Limited NasdaqGS:SEED N/A $41 $2 34.8% 24% NM 1.4x 1.5x 22.3x
Segment Average $6,206 $ 13.3% 9.7% 24.2x 2.7x 1.9x 28.7x
Source: S&P Capital IQ
720.221.9220 | SDRVENTURES.COM
FOOD & BEVERAGE REPORTQ2 2016 | VOL 4 | ISSUE 2
Investment Banking and Securities Offered Through SDR Capital Markets, Inc., Member FINRA and SIPC. 10
Note: These data represent recorded transactions only, and are not all-inclusive. Nevertheless, they are typically representative of the industry.
PUBLIC BASKET (CONTINUED)
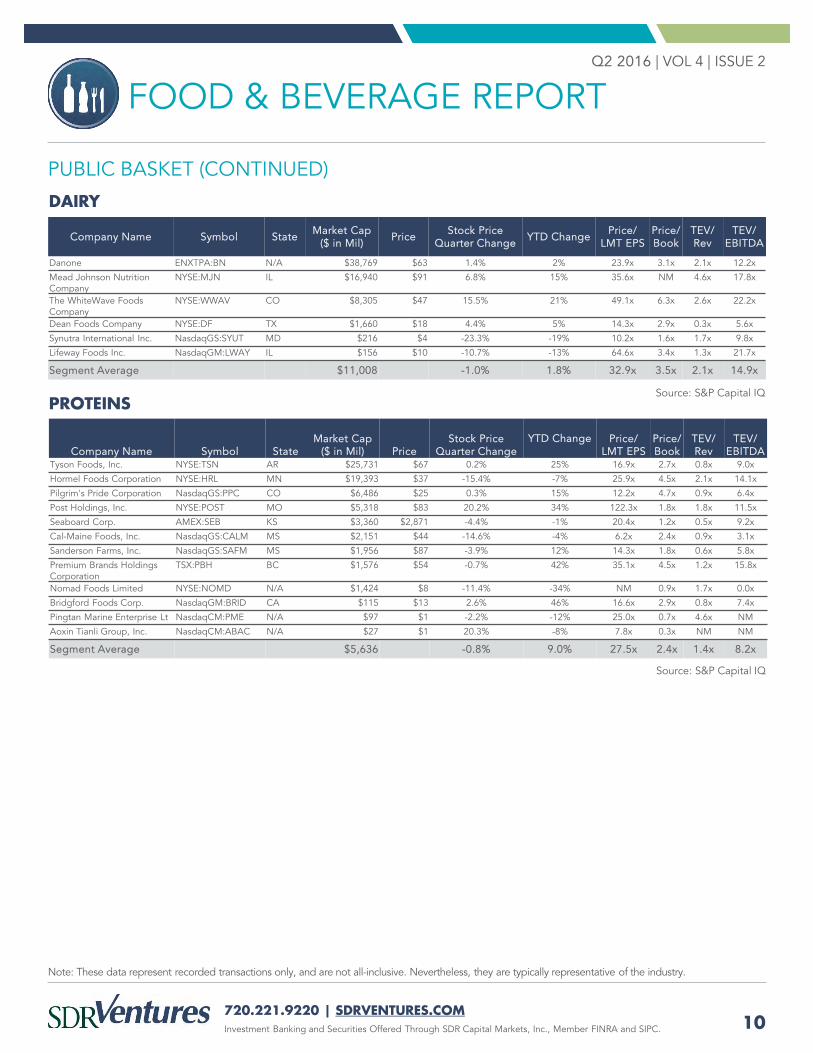
DAIRY
Source: S&P Capital IQ
Company Name Symbol State Market Cap($ in Mil) Price Stock Price
Quarter Change YTD Change Price/LMT EPS
Price/ Book
TEV/ Rev
TEV/ EBITDA
Danone ENXTPA:BN N/A $38,769 $63 1.4% 2% 23.9x 3.1x 2.1x 12.2x
Mead Johnson Nutrition Company
NYSE:MJN IL $16,940 $91 6.8% 15% 35.6x NM 4.6x 17.8x
The WhiteWave Foods Company
NYSE:WWAV CO $8,305 $47 15.5% 21% 49.1x 6.3x 2.6x 22.2x
Dean Foods Company NYSE:DF TX $1,660 $18 4.4% 5% 14.3x 2.9x 0.3x 5.6x
Synutra International Inc. NasdaqGS:SYUT MD $216 $4 -23.3% -19% 10.2x 1.6x 1.7x 9.8x
Lifeway Foods Inc. NasdaqGM:LWAY IL $156 $10 -10.7% -13% 64.6x 3.4x 1.3x 21.7x
Segment Average $11,008 -1.0% 1.8% 32.9x 3.5x 2.1x 14.9x
PROTEINS
Company Name Symbol StateMarket Cap
($ in Mil) PriceStock Price
Quarter ChangeYTD Change Price/
LMT EPSPrice/ Book
TEV/ Rev
TEV/ EBITDA
Tyson Foods, Inc. NYSE:TSN AR $25,731 $67 0.2% 25% 16.9x 2.7x 0.8x 9.0x
Hormel Foods Corporation NYSE:HRL MN $19,393 $37 -15.4% -7% 25.9x 4.5x 2.1x 14.1x
Pilgrim's Pride Corporation NasdaqGS:PPC CO $6,486 $25 0.3% 15% 12.2x 4.7x 0.9x 6.4x
Post Holdings, Inc. NYSE:POST MO $5,318 $83 20.2% 34% 122.3x 1.8x 1.8x 11.5x
Seaboard Corp. AMEX:SEB KS $3,360 $2,871 -4.4% -1% 20.4x 1.2x 0.5x 9.2x
Cal-Maine Foods, Inc. NasdaqGS:CALM MS $2,151 $44 -14.6% -4% 6.2x 2.4x 0.9x 3.1x
Sanderson Farms, Inc. NasdaqGS:SAFM MS $1,956 $87 -3.9% 12% 14.3x 1.8x 0.6x 5.8x
Premium Brands Holdings Corporation
TSX:PBH BC $1,576 $54 -0.7% 42% 35.1x 4.5x 1.2x 15.8x
Nomad Foods Limited NYSE:NOMD N/A $1,424 $8 -11.4% -34% NM 0.9x 1.7x 0.0x
Bridgford Foods Corp. NasdaqGM:BRID CA $115 $13 2.6% 46% 16.6x 2.9x 0.8x 7.4x
Pingtan Marine Enterprise Lt NasdaqCM:PME N/A $97 $1 -2.2% -12% 25.0x 0.7x 4.6x NM
Aoxin Tianli Group, Inc. NasdaqCM:ABAC N/A $27 $1 20.3% -8% 7.8x 0.3x NM NM
Segment Average $5,636 -0.8% 9.0% 27.5x 2.4x 1.4x 8.2x
Source: S&P Capital IQ
720.221.9220 | SDRVENTURES.COM
FOOD & BEVERAGE REPORTQ2 2016 | VOL 4 | ISSUE 2
Investment Banking and Securities Offered Through SDR Capital Markets, Inc., Member FINRA and SIPC. 11
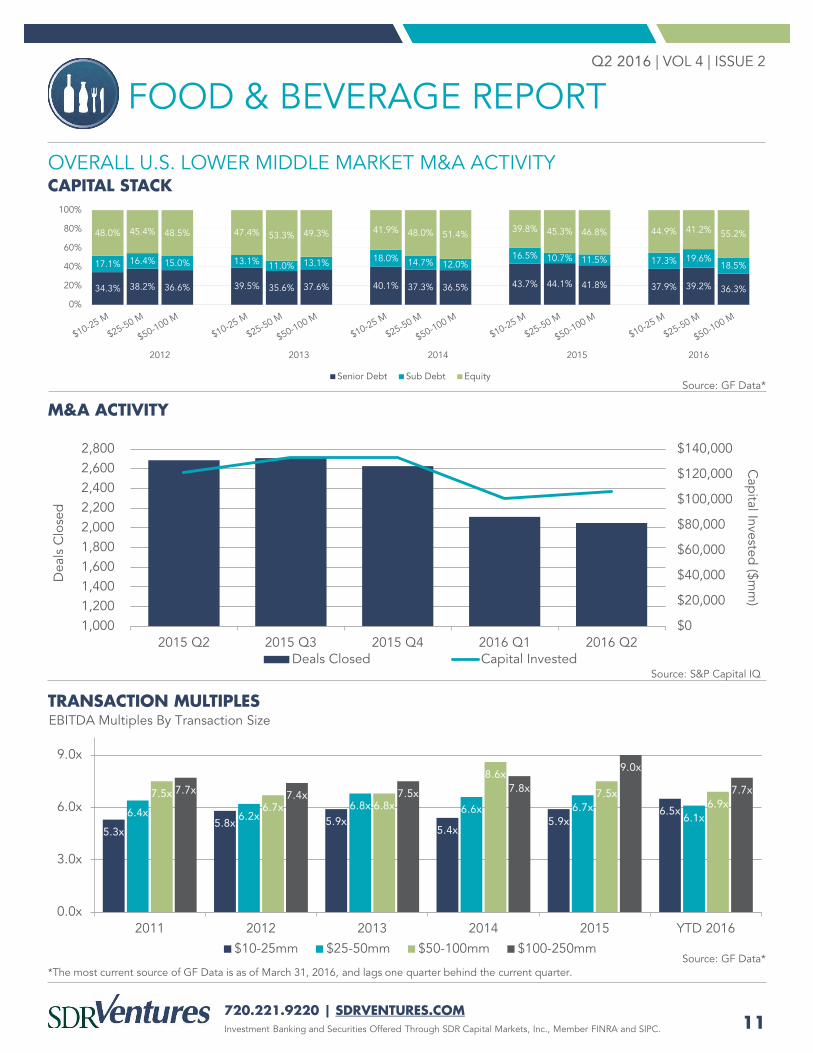
Source: GF Data*
*The most current source of GF Data is as of March 31, 2016, and lags one quarter behind the current quarter.Source: GF Data*
Source: S&P Capital IQ
CAPITAL STACKOVERALL U.S. LOWER MIDDLE MARKET M&A ACTIVITY
M&A ACTIVITY
TRANSACTION MULTIPLESEBITDA Multiples By Transaction Size
34.3% 39.5% 40.1% 43.7% 37.9%
17.1% 13.1% 18.0% 16.5% 17.3%
48.0% 47.4% 41.9% 39.8% 44.9%
38.2% 35.6% 37.3% 44.1% 39.2%
16.4% 11.0% 14.7% 10.7% 19.6%
45.4% 53.3% 48.0% 45.3% 41.2%
36.6% 37.6% 36.5% 41.8% 36.3%
15.0% 13.1% 12.0% 11.5%18.5%
48.5% 49.3% 51.4% 46.8% 55.2%
0%
20%
40%
60%
80%
100%
2012 2013 2014 2015 2016
Senior Debt Sub Debt Equity
$0
$20,000
$40,000
$60,000
$80,000
$100,000
$120,000
$140,000
1,000 1,200 1,400 1,600 1,800 2,000 2,200 2,400 2,600 2,800
2015 Q2 2015 Q3 2015 Q4 2016 Q1 2016 Q2
Cap
ital Invested ($m
m)
Dea
ls C
lose
d
Deals Closed Capital Invested
5.3x5.8x 5.9x
5.4x5.9x
6.5x6.4x 6.2x6.8x 6.6x 6.7x
6.1x
7.5x6.7x 6.8x
8.6x
7.5x6.9x
7.7x 7.4x 7.5x 7.8x
9.0x
7.7x
0.0x
3.0x
6.0x
9.0x
2011 2012 2013 2014 2015 YTD 2016
$10-25mm $25-50mm $50-100mm $100-250mm
720.221.9220 | SDRVENTURES.COM
FOOD & BEVERAGE REPORTQ2 2016 | VOL 4 | ISSUE 2
Investment Banking and Securities Offered Through SDR Capital Markets, Inc., Member FINRA and SIPC. 12
SDR SERVICE OFFERINGS
COMPREHENSIVE FOOD & BEVERAGEEXPERTISE
FEATURED M&A CASE STUDYSDR has completed numerous transactions types throughout the Food & Beverage industry, including:
CONTACT USTravis ConwayManaging Director –Food & Beverage [email protected]
Ben RudmanDirector –Food & Beverage [email protected]
The food & beverage industry may have stolen the national spotlight in recentyears, but we have been involved in the food & beverage industry for well overa decade. Our experience and drive puts us at the leading edge of informationin the market, giving you the advantage when the time comes to buy, sell orseek investments to grow your business.
Our food & beverage industry investment banking expertise includes the following segments:
Eric BosveldDirector –Food & Beverage [email protected]
PRIVATE CAPITAL FORMATIONSELL-SIDE ADVISORY
BUY-SIDE ADVISORY STRATEGIC CONSULTING
Alcoholic Beverages Non-Alcoholic Beverages CPG Foods Natural & Organic Foods Dairy
Proteins Produce/Agribusiness Ingredients & Flavors Co-Packers
Hollandia Produce, L.P. (“Hollandia Produce” or “Hollandia”) has implemented an Employee Stock Ownership Plan (“ESOP”), with structuring and funding co-led by Mosaic Capital Partners, LLC (“Mosaic Capital Partners” or “Mosaic”) and The SEAM Fund (“SEAM”). SDR Ventures served as Hollandia’s transaction advisor throughout the process.
California-based Hollandia Produce is a leading producer of greenhouse-grown leafy greens, and has built a strong reputation around its production of Live Gourmet® brand butter lettuce as well as Grower Pete’s Certified Organic brand butter lettuce and watercress. As Hollandia’sexclusive transaction advisor, SDR Ventures was able to help Hollandia capitalize on its unique growing and packaging process and its high growth potential. SDR utilized its extensive consumer-products network to locate two qualified investors in Mosaic Capital and The SEAM Fund, each of which fit the financial and ESOP-related goals of Hollandia.