Food and Health (400:104) Lecture 9 - February 19, 2015 ENERGY AND CALORIES Dr. Quadro.
54
Food and Health (400:104) Lecture 9 - February 19, 2015 ENERGY AND CALORIES Dr. Quadro
-
Upload
andra-green -
Category
Documents
-
view
213 -
download
0
Transcript of Food and Health (400:104) Lecture 9 - February 19, 2015 ENERGY AND CALORIES Dr. Quadro.

Food and Health (400:104) Lecture 9 - February 19, 2015
ENERGY AND CALORIES
Dr. Quadro

Department of Food Science
Lecture 9 – February 19, 2015
Energy
• How we generate Energy from Food• Energy In and Energy Out
– Input = Food and Calories– Output = Metabolism (BMR) and Physical
Activity• Balance
– Weight Maintenance– Weight Increase– Weight Loss

Department of Food Science
Lecture 9 – February 19, 2015
The Nutrients in Foods
• Nutrients: substances obtained from food and used in the body to promote growth, maintenance, and repair.
• Essential nutrients: nutrients that must be obtained from food because the body cannot make them for itself.
• Nonessential nutrients: nutrients that the body needs, but is able to make in sufficient quantities when needed; do not need to be obtained from food.

Department of Food Science
Lecture 9 – February 19, 2015
The Nutrients in Foods
• The energy-yielding nutrients:– Carbohydrate– Fat– Protein
• Energy: the capacity to do work, such as moving or heating something– Calorie: the unit used to measure energy
• Alcohol also provides calories but it is a not considered a nutrient because it is not needed to support life

Department of Food Science
Lecture 9 – February 19, 2015
Provide Energy?
-Carbohydrate-Protein-Fat-Vitamins -Minerals -Water
• YES• YES• YES• NO• NO• NO
The energy-yielding nutrients

Department of Food Science
Lecture 9 – February 19, 2015
Energy Input
Energy: the capacity to do work, such as moving or heating something
Calorie: the unit used to measure energy– a kilocalorie is a unit of energy– commonly used to express energy value of
food

Department of Food Science
Lecture 9 – February 19, 2015
Definition of calorie(in Physics)
calorie: the amount of energy necessary to raise the temperature of one gram of water by one degree Celsius
In Nutrition one uses Calorie=kcal (1000 calories)
Department of Food Science
Lecture 9 – February 19, 2015
Department of Food Science
Lecture 9 – February 19, 2015
Calorie Values
Calorie value of carbohydrate, fat, and protein…• If you know the number of grams of carbohydrate, fat, and
protein in a food, you can calculate the number of calories in it. For example, a deluxe fast-food hamburger contains about 45 grams of carbohydrate, 39 grams of fat and 27 grams of protein (see above).
Remember thisnumber…

Department of Food Science
Lecture 9 – February 19, 2015
Percentage of Total Energy Intake
The percentage of your total energy intake from carbohydrate, fat, and protein can then be determined by dividing the number of calories from each energy nutrient by the total calories, and then multiplying the result by 100.
Department of Food Science
Lecture 9 – February 19, 2015
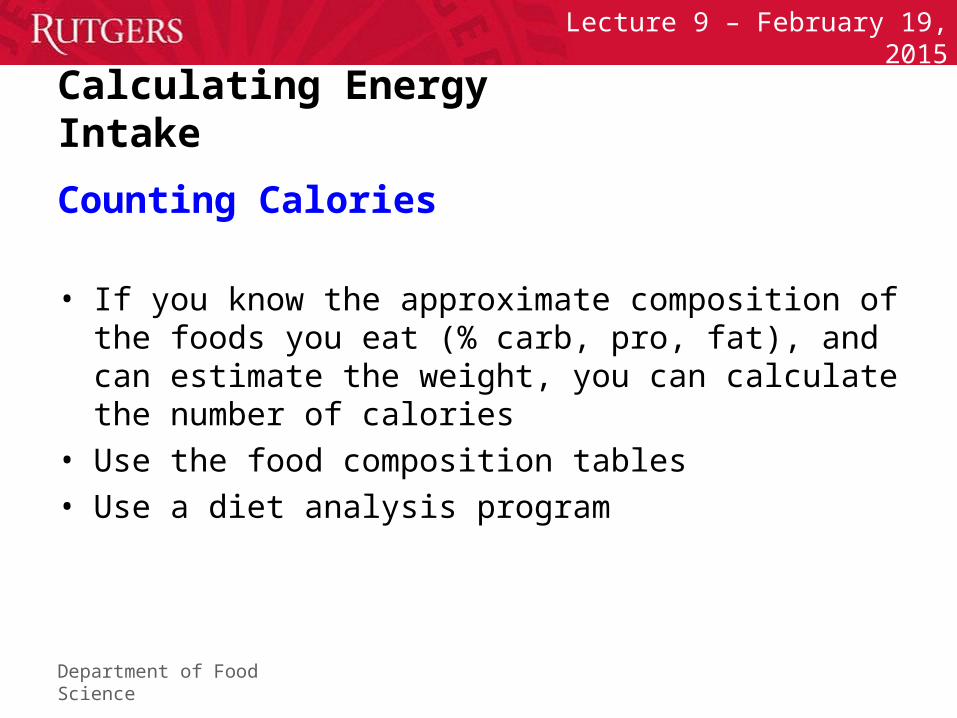
Calculating Energy Intake
Counting Calories
• If you know the approximate composition of the foods you eat (% carb, pro, fat), and can estimate the weight, you can calculate the number of calories
• Use the food composition tables• Use a diet analysis program

Department of Food Science
Lecture 9 – February 19, 2015
Calorie Calculation Exercise
Premium Crispy Chicken Ranch BLT Sandwich Serving Size: 8.6 oz (245 g)
Medium French Fries Serving Size: 4 oz (114 g)
Coca-Cola® Classic (Medium) Serving Size: 21 fl. oz

Department of Food Science
Lecture 9 – February 19, 2015
Calorie Calculation Exercise
grams FAT CARB PROSandwich (g) (g) (g)
Honey Wheat Roll 3 48 7
Crispy Chicken 9 13 19
Bacon 7 1 7
Ranch Sauce 2 2 0
Leaf Lettuce 0 0 0
Tomato Slice 0 1 0
Medium French Fries 16 47 4
Medium COKE 0 58 0

Department of Food Science
Lecture 9 – February 19, 2015
1161 kcal
Calorie Calculation Exercise
CALORIES from: FAT CARB PRO Total
Sandwich
Honey Wheat Roll 27 192 28 247
Crispy Chicken 81 52 76 209
Bacon 63 4 28 95
Ranch Sauce18 8 0 26
Leaf Lettuce 0 0 0 0
Tomato Slice 0 4 0 4
Medium Fries 144 188 16 348
Medium COKE 0 232 0 232

Department of Food Science
Lecture 9 – February 19, 2015
Components of Energy Output
We Need Energy for:
• Basal Metabolism – BMR = Basal Metabolic Rate
• Physical Activity
• Metabolizing Food

Department of Food Science
Lecture 9 – February 19, 2015
Calories and Energy Balance – NOT higher order math
Calories IN = Calories OUT Maintain WeightCalories IN > Calories OUT GAIN WeightCalories IN < Calories OUT LOSE Weight
To maintain a desirable weight, energy intakes should not exceed energy needs.
Department of Food Science
Lecture 9 – February 19, 2015
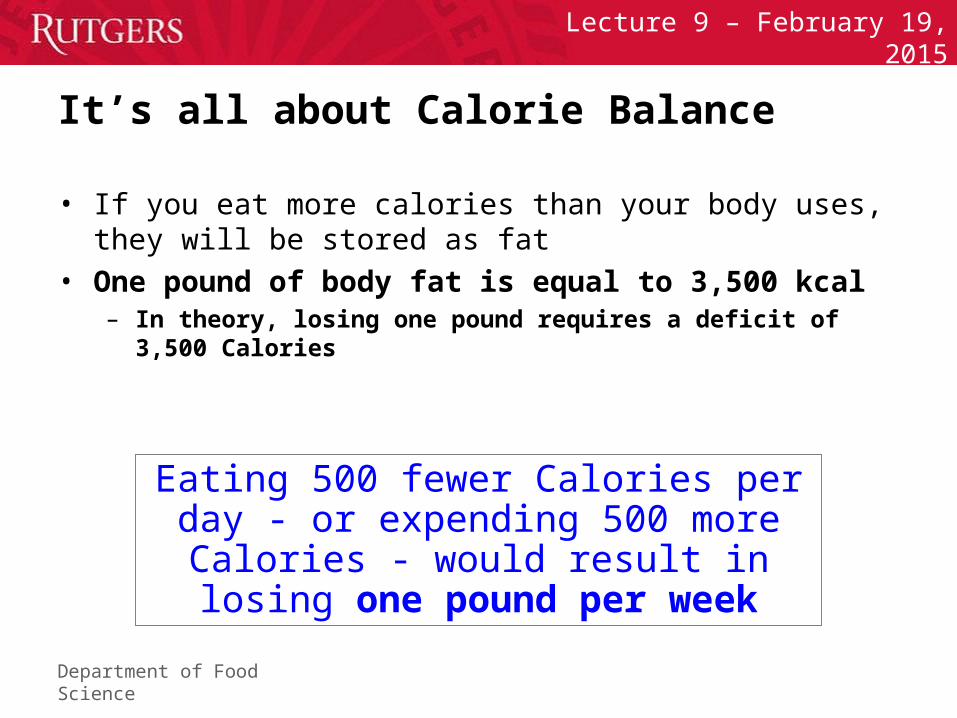
It’s all about Calorie Balance
• If you eat more calories than your body uses, they will be stored as fat
• One pound of body fat is equal to 3,500 kcal– In theory, losing one pound requires a deficit of 3,500
Calories
Eating 500 fewer Calories per day - or expending 500 more Calories - would result in losing one pound per week

Department of Food Science
Lecture 9 – February 19, 2015
REPEAT: Calorie Balance
No Loss or gain of weight occurs when:
Number of Calories Consumed EQUALS Number of Calories Expended
1 POUND = 3500 Calories
If you eat 500 calories MORE than you expend, every day for an entire week, you WILL gain 1 pound
Simple Math
Department of Food Science
Lecture 9 – February 19, 2015
Input & OutputExample
Intake:3,400 kcal
Output:3,005 kcal
IMBALANCE:395 kcal
Eating Breakfast20 min.
At the Gym40 min.
Coffee Break10 min.
Sitting in Class180 min.
Walking to Campus20 min.
Dressing/Washing20 min.
Walking on Campus30 min.
Snack10 min.
Lirary/Study180 min. Eating Lunch
30 min.
Walking Home20 min. Eating Dinner
30 min.
Check email30 min. Driving to-from
Date30 min.
Sleep 71/2 hours
Dancing40 min.Eating Snack
20 min
Hanging out with Date120 minEmailing/Texting
Studying120 min
Undress/Shower30 min
650
50
50
100270
210
25
150250
25 395700
75200
280100
75
1200 6555
400390
50180
260105
490
Walking to-fromCampus30 min.
A day in the life…

Department of Food Science
Lecture 9 – February 19, 2015
Weight Management
• To maintain body weight in a healthy range, balance calories from foods and beverages with calories expended
• To prevent gradual weight gain over time, make small decreases in food and beverage calories and increase physical activity

Department of Food Science
Lecture 9 – February 19, 2015
Energy Expenditure
• Calorie expenditure depends on:– Weight of person– Type of activity
• Length of activity• Speed of activity
• Metabolic rate
From: Ainsworth, BE, et. al. 1993. Compendium of physical activities: classification of energy costs of human physical activities. Medicine and Science in Sports and Exercise. 25 (1): 71-80.

Department of Food Science
Lecture 9 – February 19, 2015
How much exercise to offset breakfast?
Bagel with Cream CheeseCoffee with Cream
Dunkin Donuts Muffin
309 Calories
490 Calories
32 Minutes Running a 10 Minute Mile
=
25 Minutes Swimming Laps25 Minutes Cycling @ 15 mi/hr
1
2
125 pound (45kg woman)
=

Department of Food Science
Lecture 9 – February 19, 2015
How much exercise to cancel out lunch?
Turkey Sandwich12 oz. Soda1 oz. Potato Chips
585 Calories
366 Calories
9 Miles Walking Briskly@13 min/mile
=
1 Hour of Downhill Skiing
1
2 2 Slices of Cheese Pizza
125 pound (45kg woman)
=

Department of Food Science
Lecture 9 – February 19, 2015
The ABCs of Eating for Health
Adequacygetting all of the essential nutrients, fiber, and energy (calories) in amounts sufficient to maintain health
Balanceeating foods rich in one nutrient while not crowding out foods that are rich in another nutrient
Calorie controlcontrol of energy consumption
Moderationno unwanted constituent in excess
Varietydifferent foods, same purposes, different occasions

Department of Food Science
Lecture 9 – February 19, 2015
The ABCs of Eating for Health
Nutrient dense: refers to a food that supplies large amounts of nutrients relative to the number of calories it contains.
The higher the level of nutrients and the fewer the number of calories, the more nutrient dense the
food

Department of Food Science
Lecture 9 – February 19, 2015

Department of Food Science
Lecture 9 – February 19, 2015

Department of Food Science
Lecture 9 – February 19, 2015

Department of Food Science
Lecture 9 – February 19, 2015
Nutrient Recommendations
– Established by a committee of nutrition experts selected by the National Academy of Sciences (NAS)
– Based on latest scientific evidence regarding diet and health
– The first set, called the Recommended Dietary Allowances (RDA), was first published in 1943 and made for the intake of energy and nutrients at risk for deficiency (protein, vitamins and minerals); revised ten times
– In the mid-1990's, the DRIs replaced the Recommended Dietary Allowance (RDA) in the United States
Department of Food Science
Lecture 9 – February 19, 2015
Copyright 2010, John Wiley & Sons, Inc.
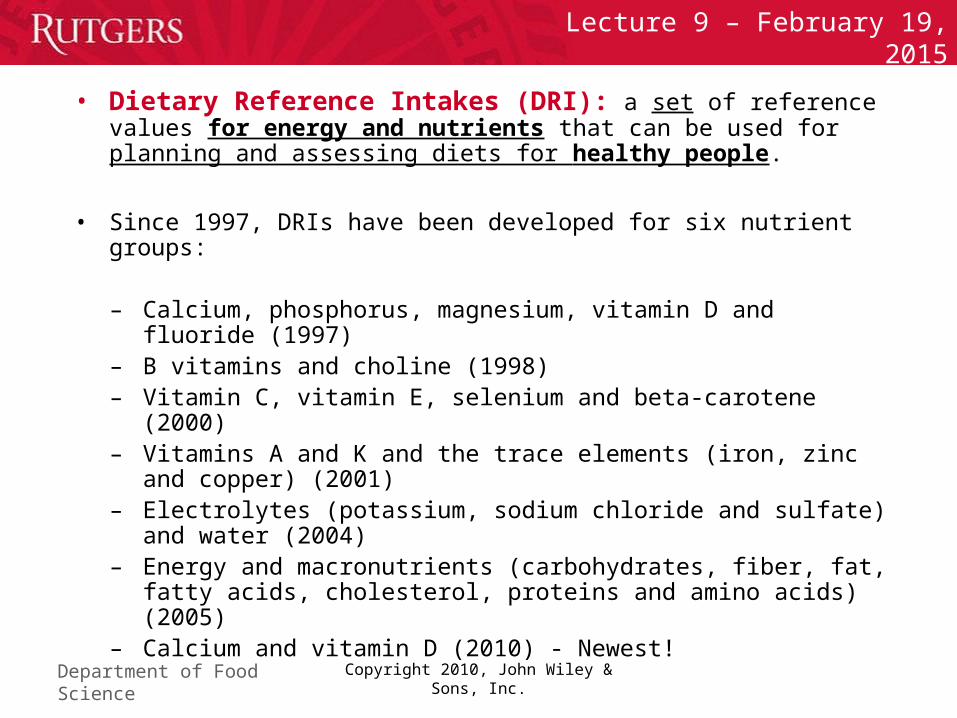
• Dietary Reference Intakes (DRI): a set of reference values for energy and nutrients that can be used for planning and assessing diets for healthy people.
• Since 1997, DRIs have been developed for six nutrient groups:
– Calcium, phosphorus, magnesium, vitamin D and fluoride (1997)
– B vitamins and choline (1998)– Vitamin C, vitamin E, selenium and beta-carotene (2000)– Vitamins A and K and the trace elements (iron, zinc and
copper) (2001)– Electrolytes (potassium, sodium chloride and sulfate) and
water (2004) – Energy and macronutrients (carbohydrates, fiber, fat, fatty
acids, cholesterol, proteins and amino acids) (2005)– Calcium and vitamin D (2010) - Newest!

Department of Food Science
Lecture 9 – February 19, 2015
Copyright 2010, John Wiley & Sons, Inc.
Dietary Reference Intakes
• DRIs are designed for planning and assessing diets of healthy people.
• Amounts recommended by DRIs are meant to promote good health and reduce incidence of chronic disease.
• The DRIs are not necessarily to be consumed every day but should be consumed on most days, as an average intake.
• DRIs include values for different life-stage groups.

Department of Food Science
Lecture 9 – February 19, 2015
Dietary Reference Intakes (DRIs)
For micro- and macro-nutrients include:- Estimated Average Requirement (EAR), used to
evaluate nutrient intake of populations- Recommended Daily Allowances (RDAs) also
recommend specific amounts of nutrients for individuals
- Adequate Intakes (AI) recommend specific amounts of nutrients for individuals
- Tolerable Upper Intake Limit (UL) helps individuals with the prevention of nutrient toxicities

Department of Food Science
Lecture 9 – February 19, 2015
Reference Value Definitions• Estimated Average Requirement (EAR)
– a daily nutrient intake value that is estimated to meet the requirements of half the healthy individuals in a certain life-stage group (same gender)
– intake at which the risk of inadequacy is 0.5 (50 percent) to an individual
• Recommended Daily Allowance (RDA)– Higher than EAR and based on EAR values– the average daily intake level that is sufficient to meet
the nutrient requirement of nearly all (97-98%) healthy individuals in a particular life stage and gender group
– the intake at which the risk of inadequacy is very small—only 0.02 to 0.03 (2 to 3 percent)

Department of Food Science
Lecture 9 – February 19, 2015
Reference Value Definitions (cont.)• Adequate intakes (AIs)
– Are not based on EAR values. Are used when there is insufficient scientific evidences to set an EAR and calculate the RDA. It indicates the need of more research on that specific nutrient.
– It averages nutrient intake by a healthy population. In order to set an AI a criterion of adequacy must be established.
• Tolerable Upper Limit (UL)– highest level of a daily nutrient that is likely to pose no
risk of adverse health effects to almost all healthy individuals.
– A specific adverse effect or indicator is considered.

Department of Food Science
Lecture 9 – February 19, 2015
• Tolerable upper intake level (UL): it is not intended to be a recommended level of intake.– The need for setting UL is the result of more
and more people using large doses of nutrient supplements and the increasing availability of fortified foods.
Reference Value Definitions (cont.)

Department of Food Science
Lecture 9 – February 19, 2015
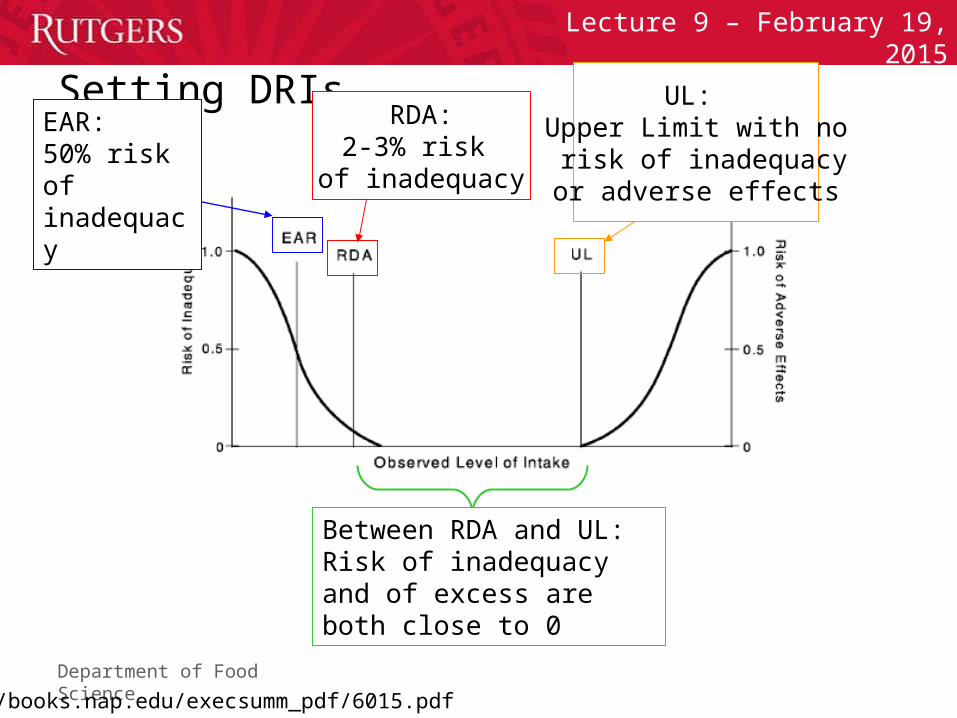
Setting DRIs
http://books.nap.edu/execsumm_pdf/6015.pdf
Risk of Effects Due to
Toxicity
Risk of Effects Due to
Deficiency
Consumed Amount
Department of Food Science
Lecture 9 – February 19, 2015
Setting DRIsEAR: 50% risk of inadequacy
Between RDA and UL:Risk of inadequacy and of excess are both close to 0
http://books.nap.edu/execsumm_pdf/6015.pdf
RDA:2-3% risk
of inadequacy
UL: Upper Limit with no risk of inadequacyor adverse effects

Department of Food Science
Lecture 9 – February 19, 2015
Setting DRIs
http://books.nap.edu/execsumm_pdf/6015.pdf
Goal for Daily Intake of Individuals

Department of Food Science
Lecture 9 – February 19, 2015
The DRIs make two types of energy intake recommendations:
• Estimated energy requirement: (EER): the average calorie intake that is predicted to maintain energy balance in a healthy adult of a defined age, gender, weight, height, and level of physical activity, consistent with good health. Used to maintain weight stable in a healthy individual.
• Acceptable macronutrient distribution range (AMDR): a range of intakes for a particular energy source (carbohydrates, fat, protein) that is associated with a reduced risk of chronic disease while providing adequate intakes of essential nutrients. AMDR have also been set for specific amino acids and fatty acids.

Department of Food Science
Lecture 9 – February 19, 2015
Recommended intake rangesfor energy nutrients
• Carbs 45 to 65% of total calories
• Fats 20 to 35% of total calories
• Proteins 10 to 35% of total calories

Department of Food Science
Lecture 9 – February 19, 2015
Why DRIs are improved over RDAs alone
• Reduction of risk of chronic disease is included in recommendation, rather than just absence of signs of deficiency
• Concepts of probability and risk used for determinations
• UL established where data for adverse effects exist
• Foods containing ‘nutrients’ with possible health benefit were reviewed and potential reference intakes established

Department of Food Science
Lecture 9 – February 19, 2015
The Correct View of the DRI

Department of Food Science
Lecture 9 – February 19, 2015
Copyright 2010, John Wiley & Sons, Inc.
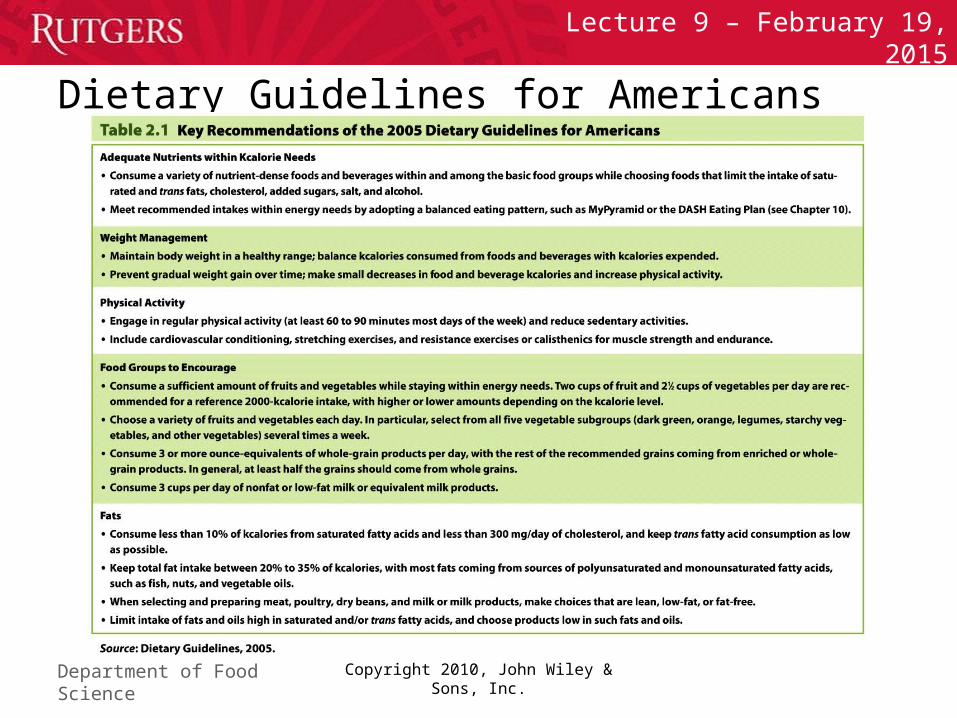
Dietary Guidelines for Americans
• The Dietary Guidelines for Americans is a set of diet and lifestyle recommendations designed to promote health and reduce chronic disease risks.
• Unlike the DRIs, which provide recommendations for specific amounts of nutrients and food components, they suggest overall diet and lifestyle that will promote health.
• 23 recommendations in 9 categories for all healthy Americans 2 years+
• Get more nutrients in fewer calories, improve balance between food intake and exercise, limit dietary components that contribute to chronic diseases, keep food safe
Department of Food Science
Lecture 9 – February 19, 2015
Copyright 2010, John Wiley & Sons, Inc.
Dietary Guidelines for Americans

Department of Food Science
Lecture 9 – February 19, 2015
Copyright 2010, John Wiley & Sons, Inc.
Dietary Guidelines for Americans

Department of Food Science
Lecture 9 – February 19, 2015
1992 Food Guide Pyramid

Department of Food Science
Lecture 9 – February 19, 2015
2005 MyPyramid
12 pyramids based on caloriesand physical activity

Department of Food Science
Lecture 9 – February 19, 2015

Department of Food Science
Lecture 9 – February 19, 2015
MyPyramid Key Components
• Activity– Regular physical activity
and reduced sedentary activities
• Variety– Eat foods from all groups
and subgroups
• Proportionality– Identifies proportions of
foods that should make a healthful diet
• Moderation– Consume less of solid fats and
added sugars– Consume more of nutrient-rich
foods
• Personalization– One size does not fit all– Customize your plan at
www.MyPyramid.gov
• Gradual improvement– Take small steps to improve diet
and lifestyle everyday– Visit www.smallstep.gov
Department of Food Science
Lecture 9 – February 19, 2015
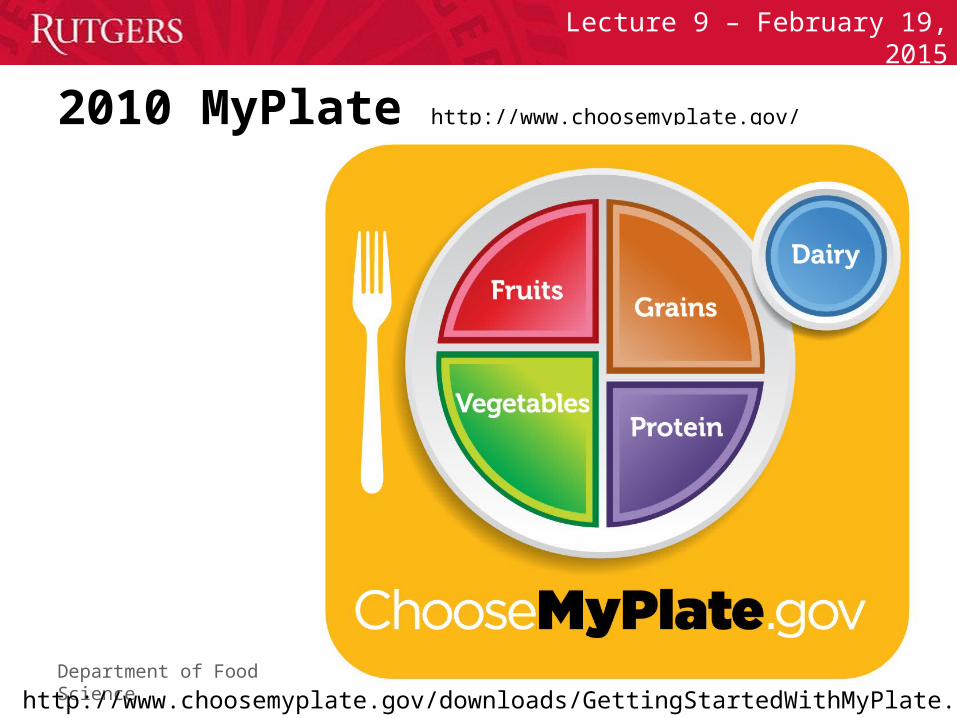
2010 MyPlate http://www.choosemyplate.gov/
http://www.choosemyplate.gov/downloads/GettingStartedWithMyPlate.pdf

Department of Food Science
Lecture 9 – February 19, 2015
MyPlate Key Components
• Variety– Eat foods from all groups
and subgroups
• Proportionality– Identifies proportions of
foods that should make a healthful diet
• Moderation– Consume less of solid fats and
added sugars– Consume more of nutrient-rich
foods
• Nutrient-dense food

Department of Food Science
Lecture 9 – February 19, 2015

Department of Food Science
Lecture 9 – February 19, 2015Food Label
http://vm.cfsan.fda.gov/~dms/foodlab.html

Department of Food Science
Lecture 9 – February 19, 2015
Making Better Food ChoicesDon’t supersizeThink grilled, not friedHold the mayoAvoid all-you-can-eat
restaurants “Just say no.”
690 calories
24 g fat
8 g saturated fat
1,350 calories
43 g fat
13 g saturated fat