Food and Beverage Pricing Chapter 7 Matakuliah: V0282 - Manajemen Akuntansi Hotel Tahun: 2009 -...
58
-
Upload
phoebe-gray -
Category
Documents
-
view
226 -
download
8
Transcript of Food and Beverage Pricing Chapter 7 Matakuliah: V0282 - Manajemen Akuntansi Hotel Tahun: 2009 -...


Food and Beverage Pricing Chapter 7
Matakuliah : V0282 - Manajemen Akuntansi HotelTahun : 2009 - 2010
• Factors Affecting Menu Pricing • Assigning Menu Prices• Menu Price Analysis
Chapter Outline
Learning Outcomes
• Identify the factors that affect a foodservice operation’s menu pricing strategy.
• Utilize the product cost percentage and contribution margin methods of menu pricing.
• Utilize matrix analysis and goal value analysis to evaluate menu pricing strategies.

Factors Affecting Menu Pricing• Perhaps no area of hospitality management is less well
understood than the area of pricing food and beverage products.
• Some of the most common factors affecting menu prices include one or more of the following.
• Local Competition. The price a competitor charges for his or her product can be useful information in helping you arrive at your own selling price.
• Service Levels. As the personal level of service increases, costs increase and thus prices must also be increased.
Factors Affecting Menu Pricing
• Guest Type. A thorough analysis of who your guests are and what they value most is critical to the success of any restaurant's pricing strategy.
• Product Quality. You should select the quality level that best represents your guests’ anticipated desires as well as your own operational goals, and then price your products accordingly.
• Portion Size. The effect of portion size on menu price is significant. It will be your job to establish and maintain strict control over portion size.

Factors Affecting Menu Pricing• Ambiance. Prices may be somewhat higher if the quality
of products and ambiance also support the price structure.
• Meal Period. In some cases, diners expect to pay more for an item served in the evening than for that same item served at a lunch period.
• Location. A location can be a good for business or bad for business. If it is good, menu prices may reflect that fact. If a location is indeed bad, menu prices may need to be lower.
• Sales Mix. Sales mix has the most influence on a manager’s menu pricing decisions. Sales mix refers to the frequency with which specific menu items are selected by guests.

Assigning Menu Prices
• There should be a clear and direct relationship between a restaurant’s profits and its menu prices.
• It is important to understand that revenue and price are not synonymous terms.
• Revenue refers to the amount spent by all guests, while price refers to the amount charged to one guest.
• Thus, total revenue is generated by the following formula:
Price x Number Sold = Total Revenue

Assigning Menu Prices
• The economic laws of supply and demand state that, for most products purchased by consumers, as the price of an item increases, the number of those items sold will generally decrease.
• Conversely, as the price of an item decreases, the number of those items sold will generally increase.
• For this reason, price increases must be evaluated based on their impact on total revenue and not on price alone.

Assigning Menu Prices
• Increasing prices without giving added value can result in higher prices but, frequently, lower revenues because of reduced guest counts.
• Guests demand a good price/value relationship when making a purchase.
• The price/value relationship reflects guests’ view of how much value they are receiving for the price they are paying.

Marketing Approaches to Pricing
• The prices of the items sold on a menu can represent a variety of concepts.
• For example, when Ruth Chris, the famous New Orleans steakhouse restaurant group, sets the price for a steak on its menu, it seeks to tell its customers, “Come here for quality!”
• When Wendy’s selects items for its 99 cent menu, it seeks to tell customers “Come here for value!”
Marketing Approaches to Pricing
• In a sales approach to marketing, the goal is to maximize volume (number of covers sold).
• Increased customer counts should result in maximized total operational revenues.
• This approach works best when service levels are limited, the products sold are easily produced, and the cost of providing the product can reliably and consistently be controlled.
Marketing Approaches to Pricing
• Other managers, usually in full-service restaurants, use the marketing philosophy of maintaining your current competitive position relative to the other restaurants in your market that target the same customers as you.
• Restaurateurs utilizing this approach feel that guests are primarily price conscious and will not pay “more” for the menu items at their restaurants than they would pay at competitive restaurants.

Cost Approaches to Pricing
• Another approach, which the authors believe is the best way to examine menu pricing, is to view it primarily from a cost approach to pricing.
• The best methods used by restaurateurs to set prices consider an operation’s costs and profit goals when determining menu prices.
• Currently, the two most popular pricing systems are those that are based upon:– Food cost percentage– Item contribution margin
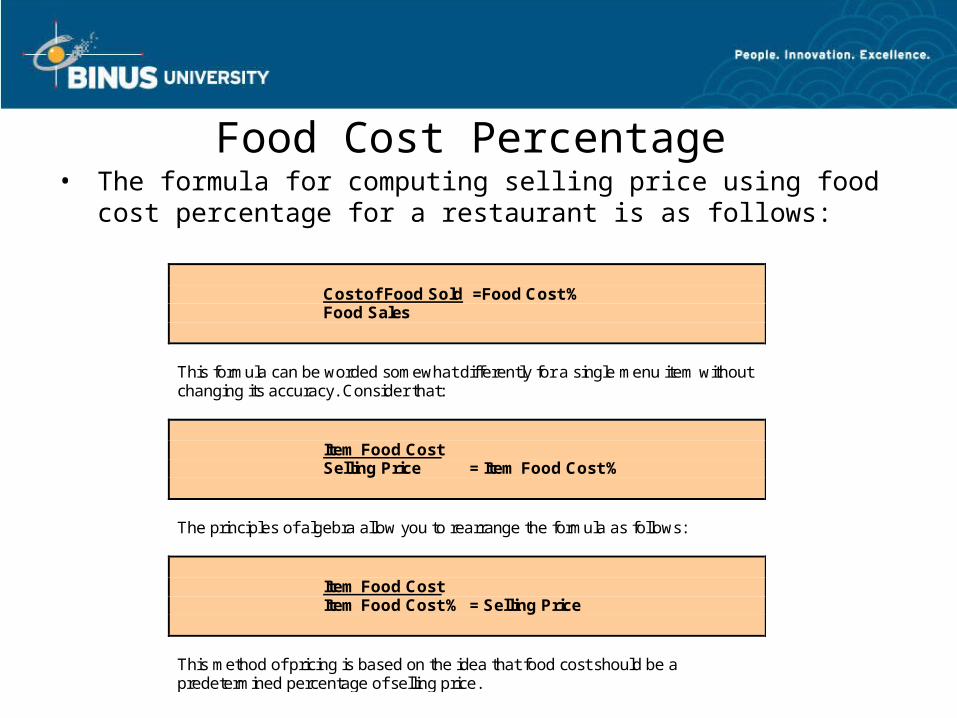
Food Cost Percentage• The formula for computing selling price using food
cost percentage for a restaurant is as follows:
Cost of Food Sold =Food Cost % Food Sales This formula can be worded somewhat differently for a single menu item without changing its accuracy. Consider that:
Item Food Cost Selling Price = Item Food Cost %
The principles of algebra allow you to rearrange the formula as follows: Item Food Cost Item Food Cost % = Selling Price This method of pricing is based on the idea that food cost should be a predetermined percentage of selling price.

go figure!
If you have a menu item that costs $1.50 to produce, and your desired food cost percentage for that item is 40%, the following formula is used to determine what the item’s menu price should be: Item Food Cost Item Food Cost % = Selling price or $1.50 .40 = $3.75 Thus, in this example, the recommended selling price, given a $1.50 item food cost, is $3.75. If the item is sold for $3.75, then a 40% food cost should be achieved for that item. A check on your work can also be done using the item food cost percentage formula: Item Food Cost Selling Price = Item Food Cost % or $1.50 $3.75 = 40% When you use a predetermined food cost percentage to price menu items, you are stating the belief that food cost in relationship to selling price is of vital importance.

Food Cost Percentage• A second method uses a cost factor or multiplier that
can be assigned to each desired food cost percentage.
(go figure! continued)
Experienced foodservice managers know that a second formula for arriving at appropriate selling prices based on predetermined food cost % goals can be employed. This method uses a cost factor or multiplier that can be assigned to each desired food cost percentage. For example, if you were attempting to price a product and achieve a food cost of 40%, the factor would be calculated using the following formula: 1.00 Desired Item Food Cost % = Pricing Factor or 1.00 0.40 = 2.5
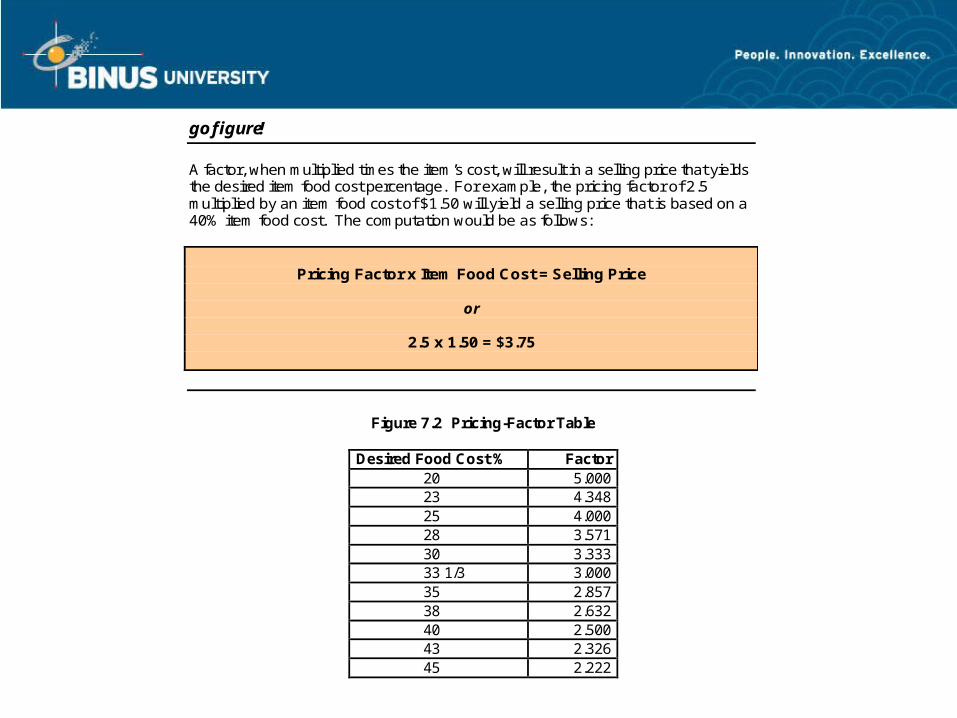
Figure 7.2 Pricing-Factor Table
Desired Food Cost % Factor 20 5.000 23 4.348 25 4.000 28 3.571 30 3.333 33 1/3 3.000 35 2.857 38 2.632 40 2.500 43 2.326 45 2.222
go figure!
A factor, when multiplied times the item’s cost, will result in a selling price that yields the desired item food cost percentage. For example, the pricing factor of 2.5 multiplied by an item food cost of $1.50 will yield a selling price that is based on a 40% item food cost. The computation would be as follows:
Pricing Factor x Item Food Cost = Selling Price
or
2.5 x 1.50 = $3.75
Item Contribution Margin• Some managers prefer an approach to menu pricing
that is focused on an item contribution margin, defined as the amount that remains after the food cost of a menu item is subtracted from that item’s selling price.
• Item contribution margin, then, is the money that “contributes” to paying for labor and other expenses and providing a profit.
• Some restaurateurs refer to item contribution margin as item gross profit margin (selling price minus item food cost).
• This term is sometimes used because it employs the same calculation as gross profit margin on the income statement (food sales minus food cost).
go figure!
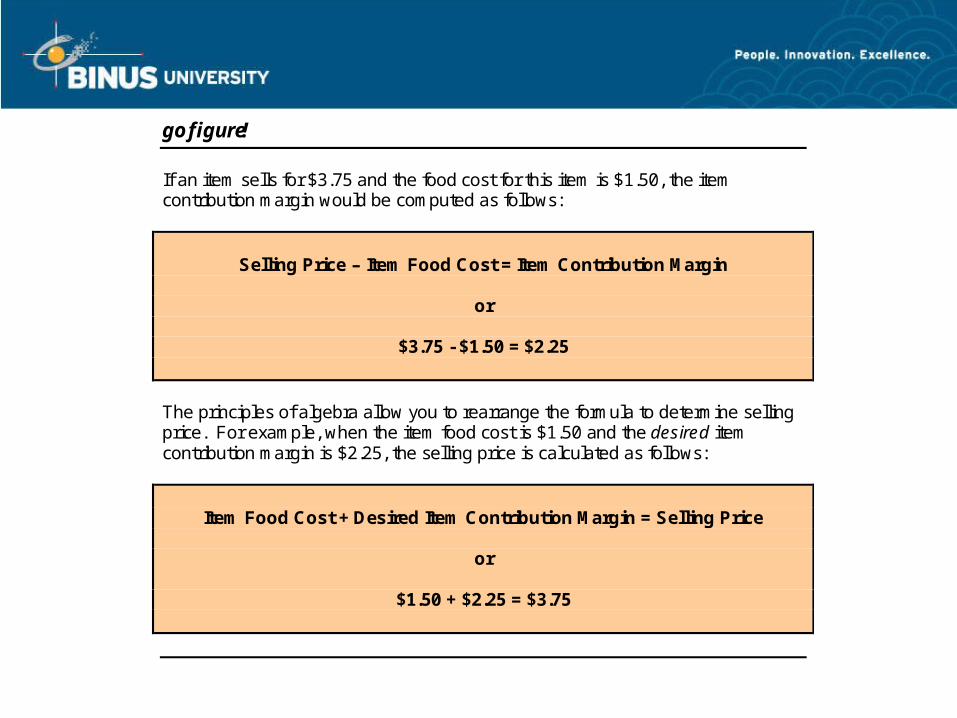
If an item sells for $3.75 and the food cost for this item is $1.50, the item contribution margin would be computed as follows:
Selling Price – Item Food Cost = Item Contribution Margin
or
$3.75 - $1.50 = $2.25
The principles of algebra allow you to rearrange the formula to determine selling price. For example, when the item food cost is $1.50 and the desired item contribution margin is $2.25, the selling price is calculated as follows:
Item Food Cost + Desired Item Contribution Margin = Selling Price
or
$1.50 + $2.25 = $3.75

Food Cost Percentage vs. Item Contribution Margin
• For the average managerial accountant, understanding the use of food cost percentage, item contribution margin, or a combination of both will enable him or her to arrive at appropriate pricing decisions.
• The end goal is to establish a good price/value relationship in the mind of your guest while achieving profits for your operation.
• The menu should not be priced so low that no profit is possible or so high that you will not be able to sell a sufficient number of items to make a profit.
Menu Analysis• Menu analysis addresses, “How does the sale of this
menu item contribute to the overall success of my operation?”
• Menu analysis involves marketing, imaging, sociology, psychology, and many times, the manager’s emotions.
• Guests respond not just to weighty financial analyses, but rather to menu design, the description of the menu item, the placement of items on the menu, their price, and their current popularity.

Menu Analysis
• The menu analysis methods that have been widely used each seek to perform the analysis using one or more of the following important operational variables:– Food cost percentage– Popularity (sales mix)– Contribution margin– Selling price– Variable costs
Menu Analysis
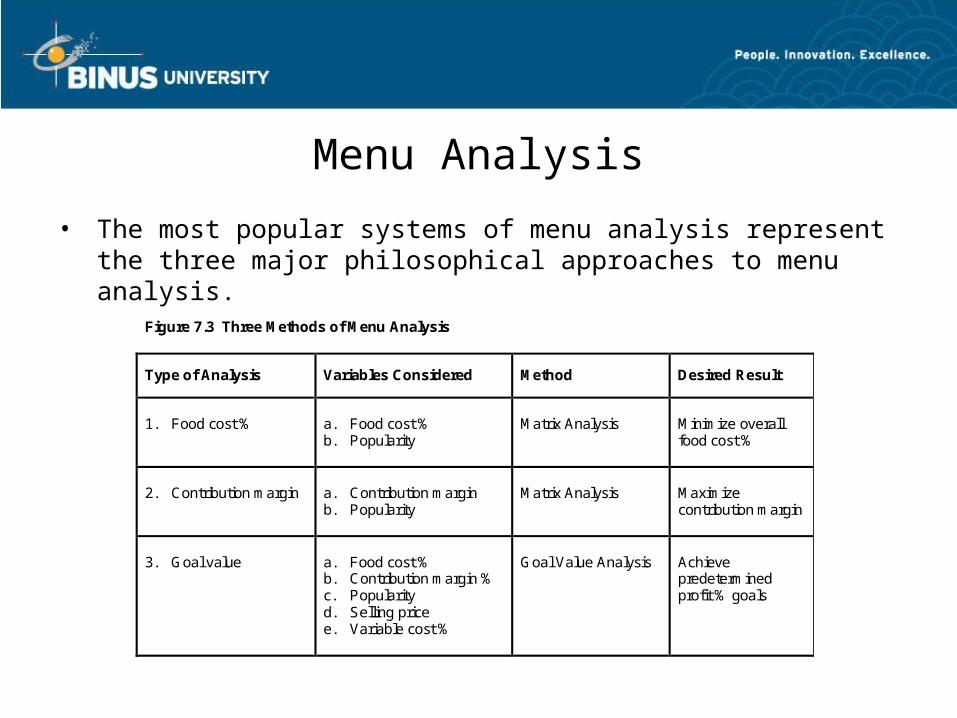
• The most popular systems of menu analysis represent the three major philosophical approaches to menu analysis.
Figure 7.3 Three Methods of Menu Analysis
Type of Analysis Variables Considered Method Desired Result
1. Food cost %
a. Food cost % b. Popularity
Matrix Analysis
Minimize overall food cost %
2. Contribution margin
a. Contribution margin b. Popularity
Matrix Analysis
Maximize contribution margin
3. Goal value
a. Food cost % b. Contribution margin % c. Popularity d. Selling price e. Variable cost %
Goal Value Analysis
Achieve predetermined profit % goals

Menu Analysis
• The items and information related to menu items’ cost, selling price, contribution margin, and popularity are compiled in a Menu Analysis Worksheet (refer to Figure 7.4).
• These figures can be used to illustrate the matrix analysis of food cost percentage and contribution margin, and goal value analysis.
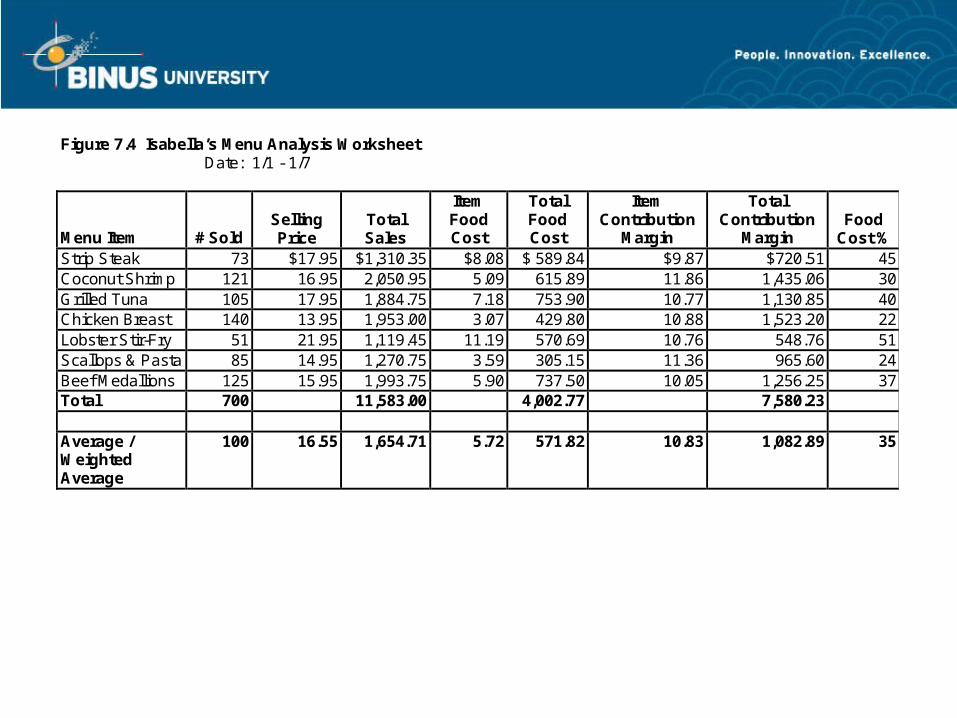
Figure 7.4 Isabella’s Menu Analysis Worksheet Date: 1/1 - 1/7
Menu Item # Sold Selling Price
Total Sales
Item Food Cost
Total Food Cost
Item Contribution
Margin
Total Contribution
Margin Food
Cost % Strip Steak 73 $17.95 $1,310.35 $8.08 $ 589.84 $9.87 $720.51 45 Coconut Shrimp 121 16.95 2,050.95 5.09 615.89 11.86 1,435.06 30 Grilled Tuna 105 17.95 1,884.75 7.18 753.90 10.77 1,130.85 40 Chicken Breast 140 13.95 1,953.00 3.07 429.80 10.88 1,523.20 22 Lobster Stir-Fry 51 21.95 1,119.45 11.19 570.69 10.76 548.76 51 Scallops & Pasta 85 14.95 1,270.75 3.59 305.15 11.36 965.60 24 Beef Medallions 125 15.95 1,993.75 5.90 737.50 10.05 1,256.25 37 Total 700 11,583.00 4,002.77 7,580.23 Average / Weighted Average
100 16.55 1,654.71 5.72 571.82 10.83 1,082.89 35
Matrix Analysis
• Matrix analysis is essentially an easy method used to make comparisons among menu items.
• A matrix allows menu items to be placed into categories based on their unique characteristics such as food cost %, popularity, and contribution margin.

Food Cost Percentage
• Matrix analysis that focuses on food cost percentage is the oldest and most traditional method used.
• When analyzing a menu using the food cost percentage method, you are seeking menu items that have the effect of minimizing your overall food cost percentage, since a lowered food cost percentage leaves more of the sales dollar to be spent for other operational expenses.

Food Cost Percentage
• A criticism of the food cost percentage approach is that items that have a higher food cost percentage may be removed from the menu in favor of items that have a lower food cost percentage but may also contribute fewer dollars to overall profit.
• To analyze a menu using the food cost percentage method, menu items must be segregated based on the following two variables:– Popularity (number sold)– Food cost percentage

Food Cost Percentage
• Refer to Figure 7.4, Menu Analysis Worksheet for the following examples.
• With an average popularity of 100 covers sold per menu item per week, any item which sold more than 100 times would be considered high in popularity, while any item selling less than 100 times would be considered low in popularity.
• Similarly, with an overall average food cost of 35%, any menu item with a food cost percentage above 35% would be considered high in food cost percentage, while any menu item with a food cost below 35% would be considered low.

Food Cost Percentage
• The food cost percentage matrix aligns these variables as follows:
Popularity 100 Low High
High Square 1
Strip Steak Lobster Stir-Fry
Square 2 Grilled Tuna
Beef Medallions
Low Square 3
Scallops & Pasta Square 4
Coconut Shrimp Chicken Breast
Food Cost % 35%

Food Cost Percentage • In matrix analysis, each menu item inhabits one, and
only one, square. • When developing a menu that seeks to minimize food
cost percentage, items in the fourth square are highly desirable.
• The characteristics of the menu items that fall into each of the four matrix squares are unique and, thus, should be managed differently.
• Each of the menu items that fall in the individual squares requires a special marketing strategy, depending on their square location.

Figure 7.5 Analysis of Food Cost Matrix Results
Square Characteristics Problem Marketing Strategy
1 High food cost %, low popularity
Marginal due to both high food cost and lack of sales
a. Remove item from the menu. b. Consider current food trends to
determine if the item itself is unpopular, or if its method of preparation is unpopular.
c. Survey guests to determine current wants regarding this item.
d. If this is a high contribution margin item, consider reducing price and/or portion size.
2 High food cost %, high popularity
Marginal due to high food cost
a. Increase price. b. Reduce prominence on the
menu. c. Reduce portion size. d. Combine the sale of this item
with one that has a lower cost and thus provides lower overall food cost %.
3 Low food cost %, low popularity
Marginal due to lack of sales
a. Relocate item on the menu for
greater visibility. b. Take off the regular menu and
run as specials. c. Reduce menu price. d. Eliminate other unpopular menu
items in order to increase demand for this one.
4 Low food cost %, high popularity
None
a. Promote well. b. Increase visibility on the menu.
Contribution Margin
• When analyzing a menu using the contribution margin approach (also widely known as menu engineering), the operator seeks to produce a menu that maximizes the menu’s overall contribution margin.
• Each menu item will have its own contribution margin, defined as the amount that remains after the food cost of the item is subtracted from the item’s selling price.
• Contribution margin is the amount that you will have available to pay for your labor and other expenses and to keep for your profit.

Contribution Margin
• A common criticism of the contribution margin approach is that it tends to favor high-priced menu items over low-priced ones, since higher priced menu items tend to have the highest contribution margins.
• Over the long term, this can result in sales techniques and menu placement decisions that tend to put in the guest’s mind a higher check average than the operation may warrant or desire.
• To analyze a menu using the contribution margin method, use the following two variables:– Popularity (number sold)– Contribution margin

Contribution Margin
• Refer to Figure 7.4, Menu Analysis Worksheet for the following examples.
• With an average popularity of 100 covers sold per menu item per week, any item which sold more than 100 times would be considered high in popularity, while any item selling less than 100 times would be considered low in popularity.
• Similarly, with a weighted average item contribution margin of $10.83, any menu item with a contribution margin above $10.83 would be considered high, while any menu item with a contribution margin below $10.83 would be considered low. (High is better.)
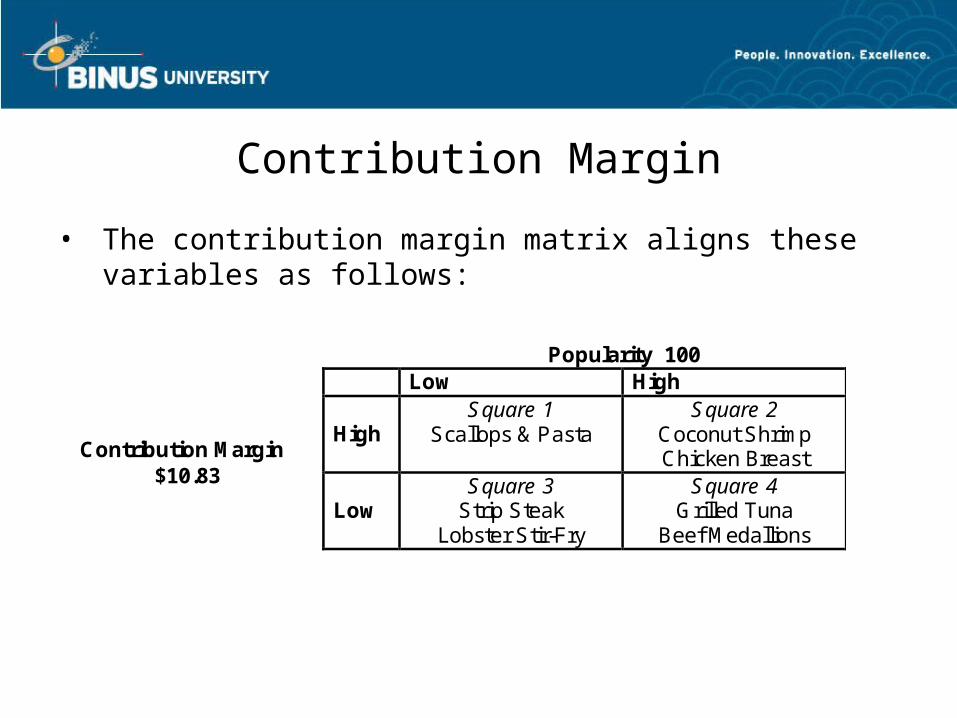
Contribution Margin
• The contribution margin matrix aligns these variables as follows:
Popularity 100 Low High High
Square 1 Scallops & Pasta
Square 2 Coconut Shrimp Chicken Breast
Low Square 3
Strip Steak Lobster Stir-Fry
Square 4 Grilled Tuna
Beef Medallions
Contribution Margin $10.83
Contribution Margin
• Again, each menu item finds itself in one, and only one, matrix square.
• Using the contribution margin method of menu analysis, it is desirable to have as many of the menu items as possible to fall within square 2, reflecting high contribution margin and high popularity.
• Each of the menu items that fall in the four squares requires a special marketing strategy, depending on its location.

Figure 7.6 Analysis of Contribution Margin Matrix Results
Square Characteristics Problem Marketing Strategy
1
High contribution margin, Low popularity
Marginal due to lack of sales
a. Relocate on menu for
greater visibility. b. Consider reducing selling
price.
2
High contribution margin, High popularity
None
a. Promote well. b. Increase prominence on
the menu.
3
Low contribution margin, Low popularity
Marginal due to both low contribution margin and lack of sales
a. Remove from menu. b. Consider offering as a
special occasionally, but at a higher menu price.
4
Low contribution margin, High popularity
Marginal due to low contribution margin
a. Increase price. b. Reduce prominence on
the menu. c. Consider reducing portion
size.

Contribution Margin• Some sophisticated observers feel that neither the
matrix food cost nor the matrix contribution margin approach is tremendously effective in analyzing menus.
• Because the axes on the matrix are determined by the average food cost percentage, contribution margin, or sales level (popularity), some menu items will always fall into the less desirable categories.
• Eliminating the poorest items only shifts other items into undesirable categories.
• One answer to address complex questions related to price, sales volume, and overall profit margin is to avoid the overly simplistic matrix analysis and employ a more effective method of menu analysis called Goal Value Analysis.

Goal Value Analysis
• Goal value analysis is a menu pricing and analysis system that compares goals of the foodservice operation to performance of individual menu items.
• It uses the power of an algebraic formula to replace less sophisticated menu averaging techniques.
• The advantages of goal value analysis include ease of use, accuracy, and the ability to simultaneously consider more variables than is possible with two-dimensional matrix analysis.

Goal Value Analysis
• How logical is it to utilize a menu analysis system that is based upon food costs or contribution margin alone, and that ignores labor costs?
• Goal value analysis evaluates each menu item’s food cost percentage, contribution margin, popularity, and, unlike the two previous analysis methods introduced, includes the analysis of the menu item’s nonfood variable (primarily labor) and fixed costs as well as its selling price.
• The formula for goal value analysis is as follows.
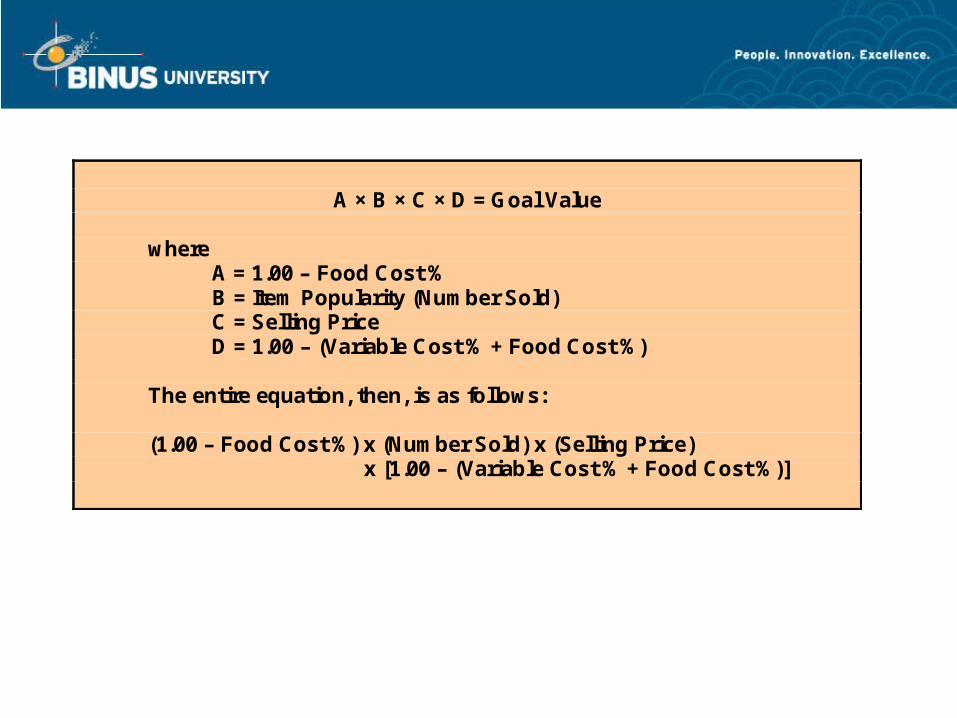
A × B × C × D = Goal Value
where A = 1.00 – Food Cost % B = Item Popularity (Number Sold) C = Selling Price D = 1.00 – (Variable Cost % + Food Cost %) The entire equation, then, is as follows: (1.00 – Food Cost %) x (Number Sold) x (Selling Price) x [1.00 – (Variable Cost % + Food Cost %)]

Goal Value Analysis
• Returning to the data in Figure 7.4, we see an overall food cost % of 35%.
• In addition, 700 guests were served at an entrée check average of $16.55.
• A variable cost (labor cost) of 30% of selling price is assigned to each menu item.
• For analysis purposes, most operators find it convenient to assign nonfood variable costs to individual menu items based on the overall restaurant’s nonfood variable costs.

go figure!
Using 30% for variable cost % and the average/ weighted average numbers from Figure 7.4 for # sold (100), selling price ($16.55), and food cost % (35%), Isabella calculates the formula to compute the goal value of her total menu as follows: A × B × C × D = Goal Value (1.00 – 0.35) × 100 × $16.55 × [1.00 – (0.30 + 0.35)] = Goal Value
or
0.65 × 100 × $16.55 × 0.35 = 376.5
According to this formula, any menu item whose goal value equals or exceeds 376.5 will achieve profitability that equals or exceeds that of Isabella’s overall menu.

Goal Value Analysis
• The algebraic goal value formula can be used to create a specific goal value for the entire menu, and the same formula can also be used to compute the goal value of each individual menu item.
• Menu items that achieve goal values higher than that of the overall menu goal value will contribute greater than average profit percentages.
• As the goal value for an item increases, so, too, does its profitability.

Goal Value Analysis
• The overall menu goal value can be used as a “target” in this way, assuming that the average food cost %, average number of items sold per menu item, average selling price (check average), and average variable cost % all meet the overall profitability goals of the restaurant.
• The computed goal value is neither a percentage nor a dollar figure because it is really a numerical target or score.
• Refer to Figure 7.8 for the results of the goal value analysis.

Figure 7.8 Goal Value Analysis Results Rank Item Food
Cost % Number
Sold Selling Price
Variable Cost %
Goal Value
1 Chicken Breast 0.22 140 $13.95 0.30 731.2 2 Coconut Shrimp 0.30 121 16.95 0.30 574.3 3 Scallops & Pasta 0.24 85 14.95 0.30 444.3 4 Beef Medallions 0.37 125 15.95 0.30 414.5 Overall menu
(Goal Value) 0.35 100 $16.55 0.30 376.5
5 Grilled Tuna 0.40 105 17.95 0.30 339.3 6 Strip Steak 0.45 73 17.95 0.30 180.2 7 Lobster Stir-Fry 0.51 51 21.95 0.30 104.2

Goal Value Analysis
• Should items that fall substantially below the overall goal value score be replaced?
• The answer, most likely, is no if the manager is satisfied with the current target food cost percentage, profit margin, check average, and guest count.
• Every menu will have items that are more (and less) profitable than others.
• Many operators develop and promote items called loss leaders.

Goal Value Analysis
• A loss leader is a menu item that is priced very low, sometimes even below total costs, for the purpose of drawing large numbers of guests to the operation, while their fellow diners may order items that are more profitable.
• The accuracy of goal value analysis is well documented. • Used properly, it is a convenient way for management
to make decisions regarding required profitability, sales volume, and pricing.
Goal Value Analysis
• Items that do not achieve the targeted goal value tend to be deficient in one or more of the key areas of food cost percentage, popularity, selling price, or variable cost percentage.
• In theory, all menu items have the potential of reaching the goal value.
• One problem could be that the item’s food cost % is too high. • This can be addressed by reducing portion size or changing
the item’s recipe since both of these actions have the effect of reducing the food cost % and, thus, increasing the A value.

Goal Value Analysis• A second approach to improving the goal value score is
to work on improving the B value, that is, the number of times the item is sold.
• This may be done through merchandising or incentives to service staff for upselling this item.
• Variable C, menu price, can also be adjusted upward; however, adjustments upward in C may well result in declines in the number of items sold (B value)!
• Increases in the menu price will also have the effect of decreasing the food cost % and the variable cost % of the menu item (and increasing the contribution margin).

Goal Value Analysis
• An easy way to determine the effects of changes made to goal values is to use an Excel spreadsheet.
• Sophisticated users of the Goal Value Analysis system can modify the formula to increase its accuracy and usefulness even more.
• Anytime you determine a desired goal value and when any three of the four variables contained in the formula are known, you can solve for the fourth unknown variable (see Figure 7.9).

Figure 7.9 Solving for Goal Value Unknowns Known Variables Unknown Variable Method to Find
Unknown A, B, C, D
Goal Value (GV) A x B x C x D
B, C, D, GV A
GV B x C x D
A, C, D, GV B
GV A x C x D
A, B, D, GV C
GV A x B x D
A, B, C, GV D
GV A x B x C

Goal Value Analysis• Goal value analysis is becoming increasingly linked to
break-even analysis because of their mathematical similarities (see Chapter 9).
• In addition to the ability to analyze multiple cost variables simultaneously, goal value analysis is valuable because it is not, as is matrix analysis, dependent on past operational performance to establish profitability.
• It can be used by management to establish future menu targets.
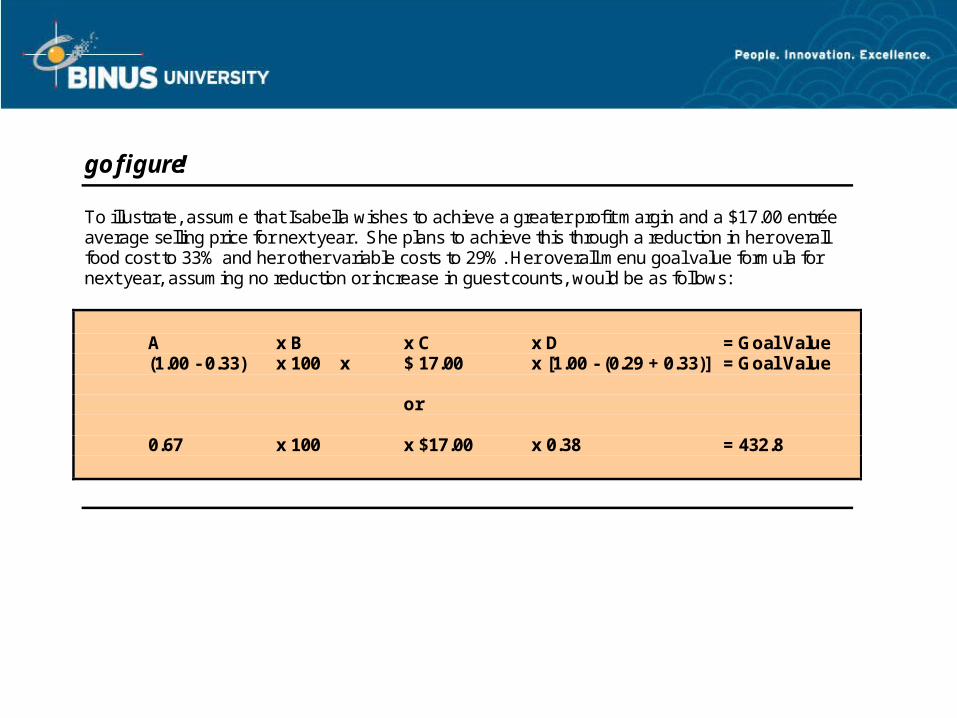
go figure!
To illustrate, assume that Isabella wishes to achieve a greater profit margin and a $17.00 entrée average selling price for next year. She plans to achieve this through a reduction in her overall food cost to 33% and her other variable costs to 29%. Her overall menu goal value formula for next year, assuming no reduction or increase in guest counts, would be as follows: A x B x C x D = Goal Value (1.00 - 0.33) x 100 x $ 17.00 x [1.00 - (0.29 + 0.33)] = Goal Value
or 0.67 x 100 x $17.00 x 0.38 = 432.8
Goal Value Analysis• Each item on next year’s menu should be evaluated
with the new goal value in mind. • Remember, however, that a purely quantitative
approach to menu analysis is neither practical nor desirable.
• Menu analysis and pricing decisions are always a matter of experience, skill, and educated predicting because it is difficult to know in advance how changing any one menu item may affect the sales mix of the remaining items.

Review of Learning Outcomes
• Identify the factors that affect a foodservice operation’s menu pricing strategy.
• Utilize the product cost percentage and contribution margin methods of menu pricing.
• Utilize matrix analysis and goal value analysis to evaluate menu pricing strategies.