Fonarow GC et al. Circulation. 2010;122:585-596
42
description
Improving Evidence-Based Care for Heart Failure in Outpatient Cardiology Practices: Primary Results of the Registry to Improve Heart Failure Therapies in the Outpatient Setting (IMPROVE HF). - PowerPoint PPT Presentation
Transcript of Fonarow GC et al. Circulation. 2010;122:585-596


Improving Evidence-Based Care for Heart Failure in Outpatient Cardiology Practices: Primary
Results of the Registry to Improve Heart Failure Therapies in the Outpatient Setting (IMPROVE HF)
Gregg C. Fonarow, Nancy M. Albert, Anne B. Curtis, Wendy Gattis Stough, Mihai Gheorghiade, J. Thomas Heywood, Mark L. McBride,
Patches Johnson Inge, Mandeep R. Mehra, Christopher M. O'Connor, Dwight Reynolds Mary N. Walsh , Clyde W. Yancy
Fonarow GC et al. Circulation. 2010;122:585-596
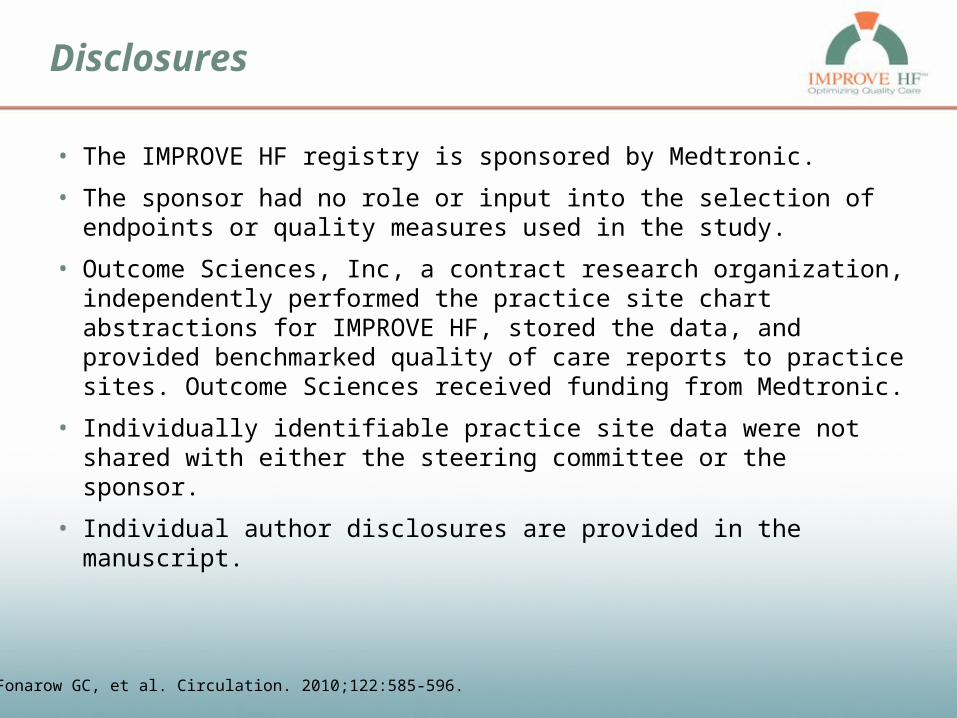
Disclosures
• The IMPROVE HF registry is sponsored by Medtronic.
• The sponsor had no role or input into the selection of endpoints or quality measures used in the study.
• Outcome Sciences, Inc, a contract research organization, independently performed the practice site chart abstractions for IMPROVE HF, stored the data, and provided benchmarked quality of care reports to practice sites. Outcome Sciences received funding from Medtronic.
• Individually identifiable practice site data were not shared with either the steering committee or the sponsor.
• Individual author disclosures are provided in the manuscript.
Fonarow GC, et al. Circulation. 2010;122:585-596.

Heart Failure Care in the Outpatient Cardiology Practice Setting
• There are well documented gaps, variations, and disparities in the use of evidence-based, guideline recommended therapies for heart failure in inpatient and outpatient care settings.
• As a result many heart failure patients may have hospitalizations and fatal events that might have been prevented.
• Hospital-based performance improvement programs have improved the quality of care for heart failure patients.
• Similar programs in the outpatient setting have not been tested.
Fonarow GC, et al. Circulation. 2010;122:585-596.

ACC/AHA 2005 HF Guidelines: Implementation of Guidelines
Academic detailing or educational outreach visits are useful to facilitate the implementation of practice guidelines
Chart audit and feedback of results can be effective to facilitate implementation of practice guidelines
The use of reminder systems can be effective to facilitate implementation of practice guidelines
The use of performance measures based on practice guidelines may be useful to improve quality of care
Hunt SA, et al. ACC/AHA 2005 Practice Guidelines. Available at http://www.acc.org.
I IIa IIb III
I IIa IIb III
I IIa IIb III
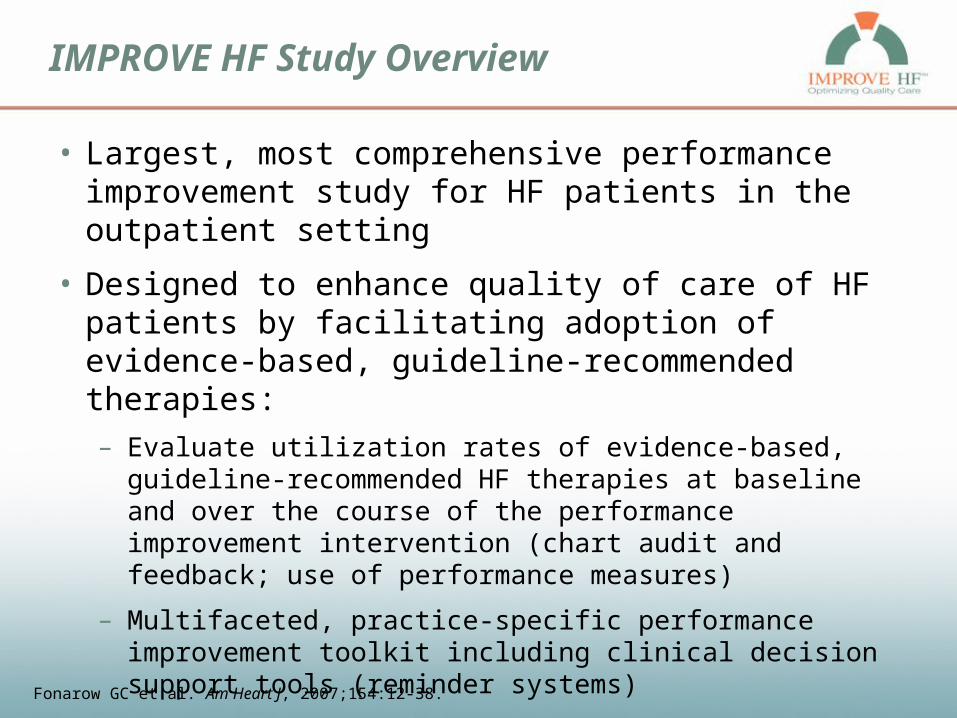
IMPROVE HF Study Overview
• Largest, most comprehensive performance improvement study for HF patients in the outpatient setting
• Designed to enhance quality of care of HF patients by facilitating adoption of evidence-based, guideline-recommended therapies:
– Evaluate utilization rates of evidence-based, guideline-recommended HF therapies at baseline and over the course of the performance improvement intervention (chart audit and feedback; use of performance measures)
– Multifaceted, practice-specific performance improvement toolkit including clinical decision support tools (reminder systems)
– Sites attended an educational workshop to set treatment goals and develop a customized clinical care pathway (educational outreach)
Fonarow GC et al. Am Heart J, 2007;154:12-38.

Methods: Guideline-Recommended Quality Measures
• Seven quality measures with strong evidence prospectively selected:– Angiotensin-converting enzyme inhibitor (ACEI) or angiotensin II receptor
blocker (ARB)*– ß-blocker*– Aldosterone antagonist– Anticoagulation therapy for atrial fibrillation/flutter (AF)*– Cardiac resynchronization therapy with or without ICD (CRT)– Implantable cardioverter defibrillator with or without CRT (ICD)– Heart failure (HF) education*
• Patients deemed eligible for individual quality measure based on meeting guideline criteria, without contraindications, intolerance, or other documented reasons for non-treatment.
• Steering committee selected quality measures based on potential to improve patient outcomes, definition precision, construct and content validity, feasibility.
* Included as ACC/AHA outpatient HF performance measure, endorsed by National Quality Forum.* Included as ACC/AHA outpatient HF performance measure, endorsed by National Quality Forum.
Fonarow GC, et al. Circulation. 2010;122:585-596.
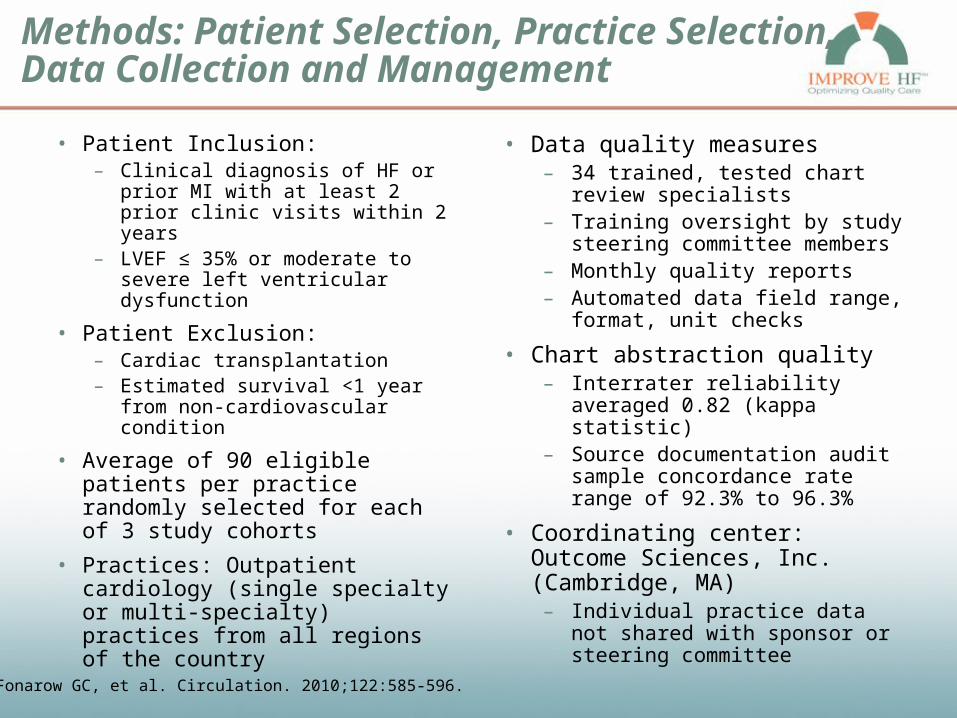
Methods: Patient Selection, Practice Selection, Data Collection and Management
• Patient Inclusion:– Clinical diagnosis of HF or prior MI
with at least 2 prior clinic visits within 2 years
– LVEF ≤ 35% or moderate to severe left ventricular dysfunction
• Patient Exclusion:– Cardiac transplantation– Estimated survival <1 year from
non-cardiovascular condition
• Average of 90 eligible patients per practice randomly selected for each of 3 study cohorts
• Practices: Outpatient cardiology (single specialty or multi-specialty) practices from all regions of the country
• Data quality measures– 34 trained, tested chart review
specialists– Training oversight by study
steering committee members– Monthly quality reports– Automated data field range, format,
unit checks
• Chart abstraction quality– Interrater reliability averaged 0.82
(kappa statistic)– Source documentation audit
sample concordance rate range of 92.3% to 96.3%
• Coordinating center: Outcome Sciences, Inc. (Cambridge, MA)
– Individual practice data not shared with sponsor or steering committee
Fonarow GC, et al. Circulation. 2010;122:585-596.

Methods: Study Objectives
Practice Level
Patient Level
Primary Analyses of Quality Measures:
Changes for each of the 7 quality measures at 24 months X X
≥ 20% relative improvement in 2 or more quality measures at 24 months
X Xa
Changes in 7 quality measures patients with both baseline and 24 month data
X X
Other Analyses:
Changes in 2 summary care measures at 24 months X X
Changes in 7 quality measures in single-time point cohorts compared with baseline
X X
Practice level analysis: proportion of eligible patients receiving therapy for each practicePatient level analysis: proportion of eligible patients receiving therapy for aggregate of all practicesPractice level analysis: proportion of eligible patients receiving therapy for each practicePatient level analysis: proportion of eligible patients receiving therapy for aggregate of all practices
Fonarow GC, et al. Circulation. 2010;122:585-596.
a Pre-specified primary objectivea Pre-specified primary objective

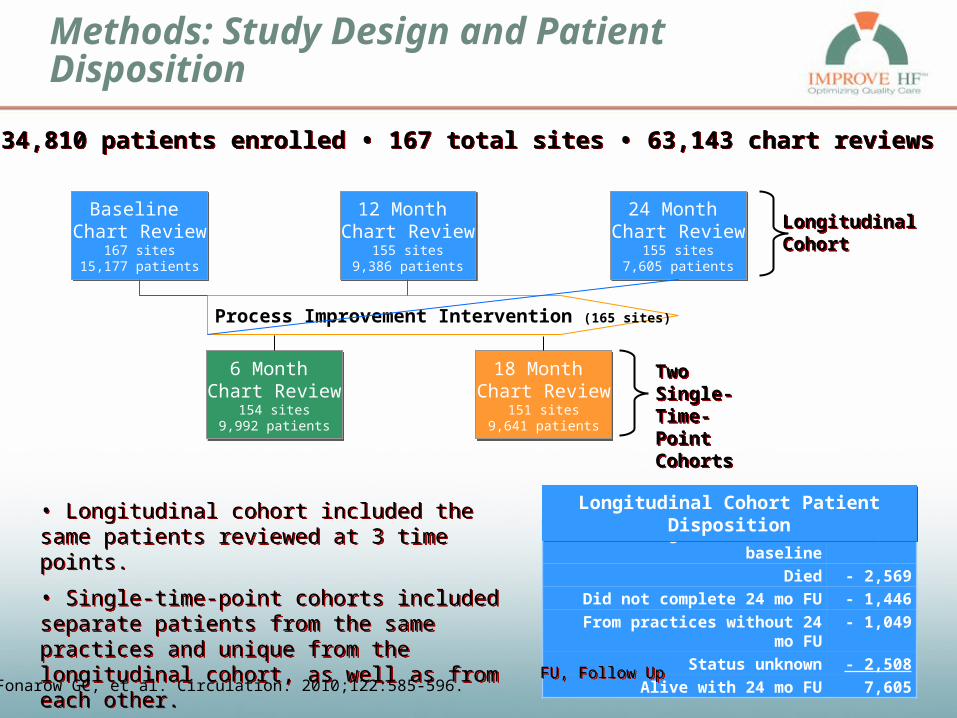
Methods: Study Design and Patient Disposition
LongitudinalCohortLongitudinalCohort
Two Single-Time-PointCohorts
Two Single-Time-PointCohorts
Process Improvement Intervention (165 sites)
Baseline Chart Review
167 sites15,177 patients
Baseline Chart Review
167 sites15,177 patients
12 Month Chart Review
155 sites9,386 patients
12 Month Chart Review
155 sites9,386 patients
24 Month Chart Review
155 sites7,605 patients
24 Month Chart Review
155 sites7,605 patients
6 Month Chart Review
154 sites9,992 patients
6 Month Chart Review
154 sites9,992 patients
Total Sites 167Patients Enrolled 34,810
Total Chart Reviews 63,143Total # of Site Visits 782
18 Month Chart Review
151 sites9,641 patients
18 Month Chart Review
151 sites9,641 patients
• Longitudinal cohort included the same patients reviewed at 3 time points.
• Single-time-point cohorts included separate patients from the same practices and unique from the longitudinal cohort, as well as from each other.
• Longitudinal cohort included the same patients reviewed at 3 time points.
• Single-time-point cohorts included separate patients from the same practices and unique from the longitudinal cohort, as well as from each other.
Fonarow GC, et al. Circulation. 2010;122:585-596.
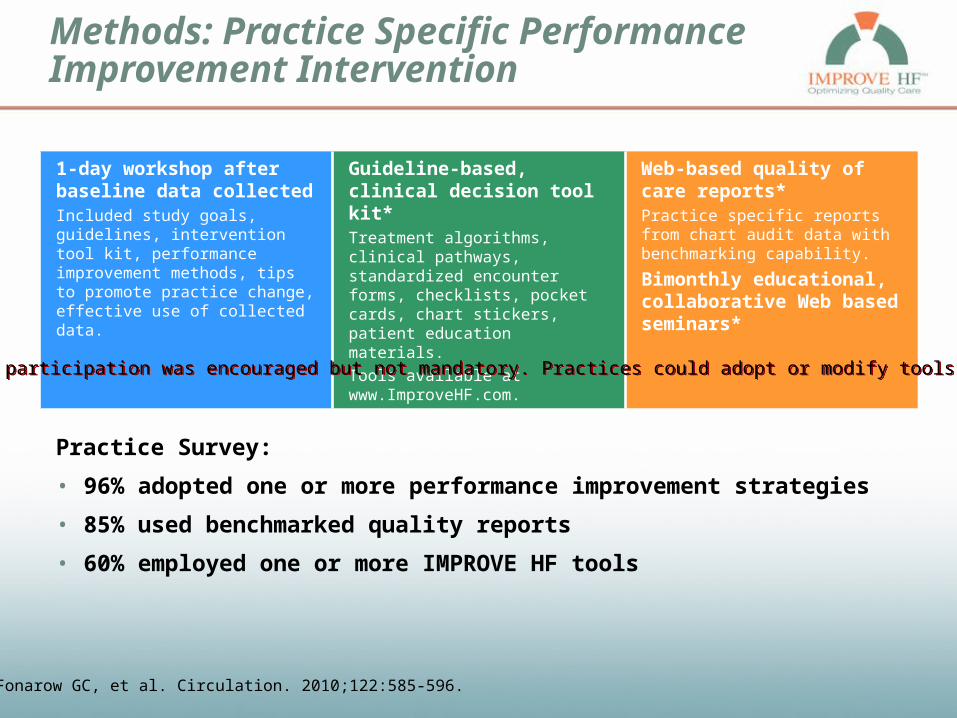
Methods: Practice Specific Performance Improvement Intervention
1-day workshop after baseline data collectedIncluded study goals, guidelines, intervention tool kit, performance improvement methods, tips to promote practice change, effective use of collected data.
Guideline-based, clinical decision tool kit*Treatment algorithms, clinical pathways, standardized encounter forms, checklists, pocket cards, chart stickers, patient education materials.
Tools available at www.ImproveHF.com.
Web-based quality of care reports*Practice specific reports from chart audit data with benchmarking capability.
Bimonthly educational, collaborative Web based seminars*
Practice Survey:
• 96% adopted one or more performance improvement strategies
• 85% used benchmarked quality reports
• 60% employed one or more IMPROVE HF tools
* Use or participation was encouraged but not mandatory. Practices could adopt or modify tools.* Use or participation was encouraged but not mandatory. Practices could adopt or modify tools.
Fonarow GC, et al. Circulation. 2010;122:585-596.

IMPROVE HF Practice Specific Education and Implementation Tools
www.improvehf.comwww.improvehf.com
Evidence Based Algorithmsand Pocket Cards
Patient Education Materials
Clinical Assessment and Management Forms
Clinical Trials and Current Guidelines
Dissemination of best practices:- Webcasts- Online Education- Newsletters

IMPROVE HF Performance Intervention:Benchmarked Practice Profile Report
Benchmarking
On-DemandPerformance Measures across all physicians within practice
Benchmarking Capability:region,practice, individual physician
Practice or Single Physician
Adherence to Guidelines

Patient Characteristics
Longitudinal Cohort18-Month
CohortN = 9,641Characteristic
All PatientsN = 15,177
24-MonthN = 7,605
Age, median, years 70.0 71.0 70.0
Male, % 71.1 71.3 70.7
Race: White, black, unavailable, % 42.4, 9.2, 46.7 42.6, 9.0, 46.5 55.9, 11.5, 31.0
Insured, not documented, uninsured, % 92.2, 6.3, 1.2 95.2, 3.7, 1.0 90.6, 7.6, 1.8
Heart failure origin, ischemic, % 65.4 67.0 65.9
Prior MI, % 40.0 51.7 41.6
History of CABG, % 31.2 34.1 31.2
History of PCI, % 25.6 30.0 29.1
History of atrial fibrillation/flutter, % 30.7 41.2 34.0
History of peripheral vascular disease, % 11.5 16.0 12.3
History of diabetes, % 34.1 37.8 35.6
History of hypertension, % 62.2 75.1 69.7
History of COPD, % 16.7 21.8 18.0
History of depression, % 9.0 15.7 10.7Fonarow GC, et al. Circulation. 2010;122:585-596.
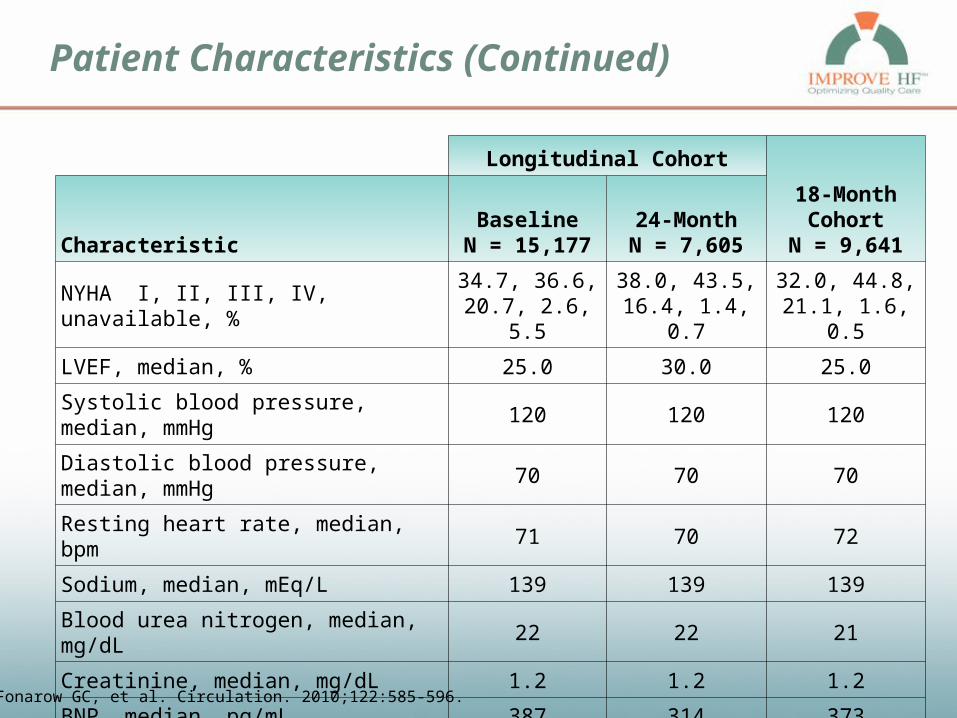
Patient Characteristics (Continued)
Longitudinal Cohort
18-Month Cohort
N = 9,641CharacteristicBaseline
N = 15,17724-MonthN = 7,605
NYHA I, II, III, IV, unavailable, %34.7, 36.6,
20.7, 2.6, 5.538.0, 43.5,
16.4, 1.4, 0.732.0, 44.8,
21.1, 1.6, 0.5
LVEF, median, % 25.0 30.0 25.0
Systolic blood pressure, median, mmHg 120 120 120
Diastolic blood pressure, median, mmHg 70 70 70
Resting heart rate, median, bpm 71 70 72
Sodium, median, mEq/L 139 139 139
Blood urea nitrogen, median, mg/dL 22 22 21
Creatinine, median, mg/dL 1.2 1.2 1.2
BNP, median, pg/mL 387 314 373
QRS duration, median, ms 124(n = 10,225)
132(n = 3,788)
122(n = 7,511)
Fonarow GC, et al. Circulation. 2010;122:585-596.

IMPROVE HF Practice Characteristics
Characteristic Practice Sites (N = 167*)
Census region: South, Northeast, Central, West, Missing, % 38.9, 32.3, 15.6, 12.0, 1.2
Practice setting: University, Non-university teaching, Non-university, non-teaching, % (n=157)
7.8, 21.6, 64.7
Multispecialty, % 24.0
Hospital-based, % 27.5
Transplant center, % 9.6
Suburban or rural location, % 71.3
HF clinic in practice, % (n=163) 41.3
HF nurse in practice, % 34.7
Device clinic in practice, % 78.4
No. of physicians in practice, 1-10, 11-20, >20, % 48.5, 27.5, 18.0
Number of electrophysiologists in practice, median 1.0
Interventionalist in practice, % 87.4
Annual number of patients managed by practice, median 1837.5
*Two sites did not provide any survey data. N=165 for these characteristics unless otherwise noted.*Two sites did not provide any survey data. N=165 for these characteristics unless otherwise noted.
Fonarow GC, et al. Circulation. 2010;122:585-596.

Results: Improvement in Quality Measures at 24 Months (Practice Level Analysis)
Quality Measure
Baseline (95% CI)N = 167
24 Months(95% CI)N = 155
Absolute Improvement
(95% CI)
Relative Improvement
(95% CI) P-value
ACEI/ARB78.3%
(76.5 – 80.2)85.1%
(83.4 – 86.8)+ 6.8%
(4.8 – 8.8)+ 19.4%
(-1.1 – 39.8) 0.063
ß-blocker86.0%
(84.3 – 87.7)92.2%
(90.6 – 93.8)+ 6.2%
(4.8 – 7.6)+ 7.6%
(5.1 – 10.2) <0.001
Aldosterone antagonist
34.5%(31.5 – 37.4)
60.3%(56.1 – 64.4)
+ 25.1%(20.7 – 29.6)
+ 86.5%(67.1 – 105.9) <0.001
Anticoagulationfor AF
68.0%(65.5 – 70.5)
67.8%(65.0 – 70.7)
- 0.1%(-3.0 – 2.8)
+ 1.0%(-3.6 – 5.5) 0.673
CRT-P/CRT-D37.2%
(32.2 – 42.2)66.3%
(61.6 – 71.1)+ 29.9%
(23.6 – 36.2)+ 124.5%
(85.5 – 163.5) <0.001
ICD/CRT-D50.1%
(47.3 – 52.8)77.5%
(74.8 – 80.1)+ 27.4%
(24.6 – 30.2)+ 70.9%
(61.0 – 80.8) <0.001
HF education59.5%
(55.7 – 63.2)72.1%
(68.3 – 75.9)+ 12.6%
(8.2 – 17.0)+ 50.6%
(27.1 – 74.2) <0.001
Longitudinal Cohort123 of 155 practices (79%) with ≥ 20% relative improvement in 2 or more care measures
Longitudinal Cohort123 of 155 practices (79%) with ≥ 20% relative improvement in 2 or more care measures
Fonarow GC, et al. Circulation. 2010;122:585-596.

Results: Improvement in Quality Measures at 24 Months (Patient Level Analysis)
Quality Measure
Baseline (95% CI)
N = 15,177
24 Months(95% CI)N = 7,605
Absolute Improvement
(95% CI)
Relative Improvement
(95% CI) P-value
ACEI/ARB79.8%
(79.2 – 80.5)86.5%
(85.6 – 87.3)+ 6.7%
(5.6 – 7.8)+ 8.4%
(7.0 – 9.7) <0.001
ß-blocker86.2%
(85.6 – 86.8)93.6%
(93.0 – 94.2)+ 7.4%
(6.6 – 8.2)+ 8.6%
(7.7 – 9.6) <0.001
Aldosterone antagonist
34.4%(32.7 – 36.1)
61.8%(59.2 – 64.5)
+ 27.4%(24.3 – 30.6)
+ 79.7%(70.5 – 89.0) <0.001
Anticoagulationfor AF
68.6%(67.2 – 70.0)
69.3%(67.5 – 71.0)
+ 0.7%(-1.5 – 2.9)
+ 1.0%(-2.2 – 4.2) 0.546
CRT-P/CRT-D37.7%
(35.2 – 40.1)68.5%
(65.8 – 71.3)+ 30.9%
(27.2 – 34.5)+ 81.9%
(72.2 – 91.7) <0.001
ICD/CRT-D48.8%
(47.8 – 49.8)79.1%
(78.0 – 80.2)+ 30.3%
(28.8 – 31.8)+ 62.1%
(59.1 – 65.1) <0.001
HF education61.8%
(61.0 – 62.5)70.8%
(69.8 – 71.9)+ 9.1%
(7.8 – 10.4)+ 14.7%
(12.6 – 16.8) <0.001
Longitudinal CohortPrespecified primary objective met: Relative improvement ≥ 20% in 3 quality measures
Longitudinal CohortPrespecified primary objective met: Relative improvement ≥ 20% in 3 quality measures
Fonarow GC, et al. Circulation. 2010;122:585-596.

Results: Improvement in Quality Measures at 24 Months (Patient Level Analysis)
80%
86%
34%
69%
38%
49%
62%
84%
93%
51%
69%
58%
71% 69%
87%
94%
62%
69% 69%
79%
71%
0%
20%
40%
60%
80%
100%
Baseline 12 months 24 months
ACEI/ARB ß-blocker Aldosterone Antagonist
Anticoagulant for AF
CRT ICD HF Education
*
*
*
*
*
**
*
*
*
* *
Eli
gib
le P
atie
nts
Tre
ate
dE
lig
ible
Pat
ien
ts T
rea
ted
Fonarow GC, et al. Circulation. 2010;122:585-596.
* P<0.001 vs. baseline
Significant Improvement in 6 of 7 Quality Measures at 12 and 24 MonthsPre-specified Primary Objective Met: Relative Improvement ≥ 20% in 3 Quality Measures
Significant Improvement in 6 of 7 Quality Measures at 12 and 24 MonthsPre-specified Primary Objective Met: Relative Improvement ≥ 20% in 3 Quality Measures
P-values are for relative change
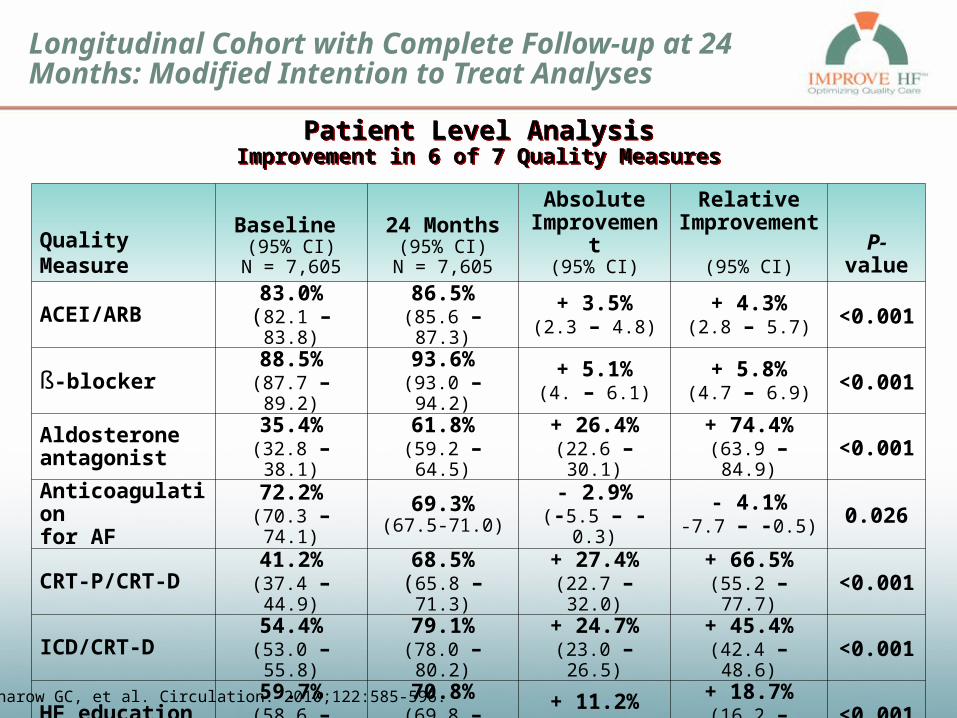
Longitudinal Cohort with Complete Follow-up at 24 Months: Modified Intention to Treat Analyses
Quality Measure
Baseline (95% CI)N = 7,605
24 Months(95% CI)N = 7,605
Absolute Improvement
(95% CI)
Relative Improvement
(95% CI) P-value
ACEI/ARB 83.0%(82.1 – 83.8)
86.5%(85.6 – 87.3)
+ 3.5%(2.3 – 4.8)
+ 4.3%(2.8 – 5.7) <0.001
ß-blocker88.5%
(87.7 – 89.2)93.6%
(93.0 – 94.2)+ 5.1%(4. – 6.1)
+ 5.8%(4.7 – 6.9) <0.001
Aldosterone antagonist
35.4%(32.8 – 38.1)
61.8%(59.2 – 64.5)
+ 26.4%(22.6 – 30.1)
+ 74.4%(63.9 – 84.9) <0.001
Anticoagulationfor AF
72.2%(70.3 – 74.1)
69.3%(67.5-71.0)
- 2.9%(-5.5 – -0.3)
- 4.1%-7.7 – -0.5) 0.026
CRT-P/CRT-D 41.2%(37.4 – 44.9)
68.5%(65.8 – 71.3)
+ 27.4%(22.7 – 32.0)
+ 66.5%(55.2 – 77.7) <0.001
ICD/CRT-D 54.4%(53.0 – 55.8)
79.1%(78.0 – 80.2)
+ 24.7%(23.0 – 26.5)
+ 45.4%(42.4 – 48.6) <0.001
HF education 59.7%(58.6 – 60.8)
70.8%(69.8 – 71.9)
+ 11.2%(9.7 – 12.7)
+ 18.7%(16.2 – 21.2) <0.001
Patient Level AnalysisImprovement in 6 of 7 Quality Measures
Patient Level AnalysisImprovement in 6 of 7 Quality Measures
Fonarow GC, et al. Circulation. 2010;122:585-596.
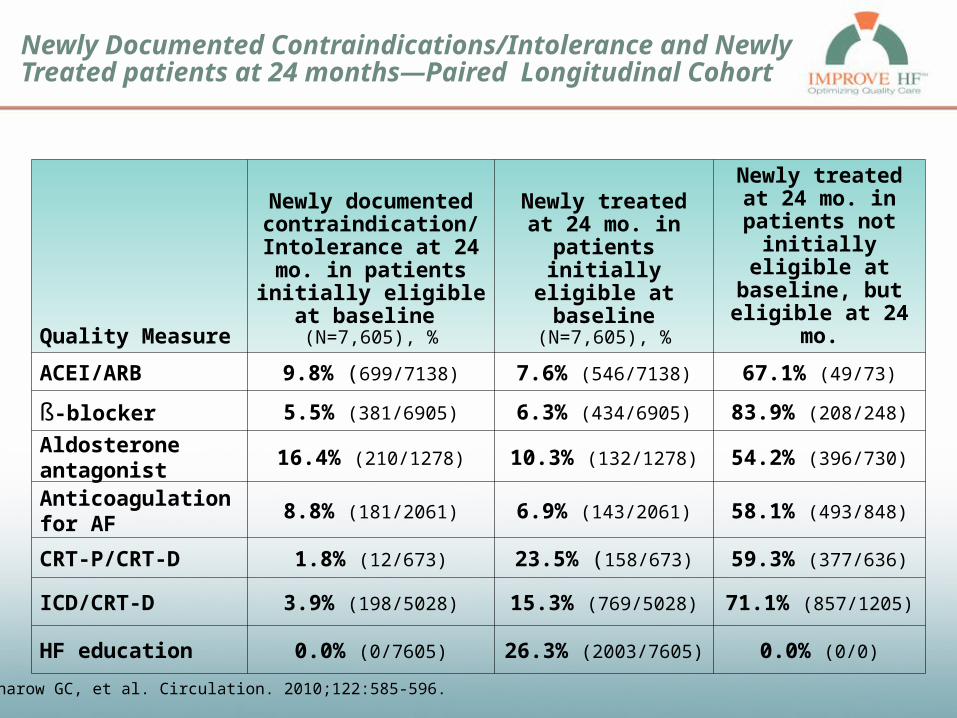
Newly Documented Contraindications/Intolerance and Newly Treated patients at 24 months—Paired Longitudinal Cohort
Quality Measure
Newly documented contraindication/
Intolerance at 24 mo. in patients initially eligible at baseline
(N=7,605), %
Newly treated at 24 mo. in patients
initially eligible at baseline
(N=7,605), %
Newly treated at 24 mo. in patients not initially eligible at
baseline, but eligible at 24 mo.
ACEI/ARB 9.8% (699/7138) 7.6% (546/7138) 67.1% (49/73)
ß-blocker 5.5% (381/6905) 6.3% (434/6905) 83.9% (208/248)
Aldosterone antagonist
16.4% (210/1278) 10.3% (132/1278) 54.2% (396/730)
Anticoagulationfor AF
8.8% (181/2061) 6.9% (143/2061) 58.1% (493/848)
CRT-P/CRT-D 1.8% (12/673) 23.5% (158/673) 59.3% (377/636)
ICD/CRT-D 3.9% (198/5028) 15.3% (769/5028) 71.1% (857/1205)
HF education 0.0% (0/7605) 26.3% (2003/7605) 0.0% (0/0)
Fonarow GC, et al. Circulation. 2010;122:585-596.

Results: Summary Measures Significantly Improved at the Patient Level
68.4%
80.1%
Baseline 24 months
Composite Score: % of total indicated quality measures
Patient level analysis
17% Relative Increase, P<0.001
43.9%
24.3%
Baseline 24 months
All or None Care: % of patients receiving each indicated quality
measure
Patient level analysis
81% relative increase, P<0.001
Fonarow GC, et al. Circulation. 2010;122:585-596.
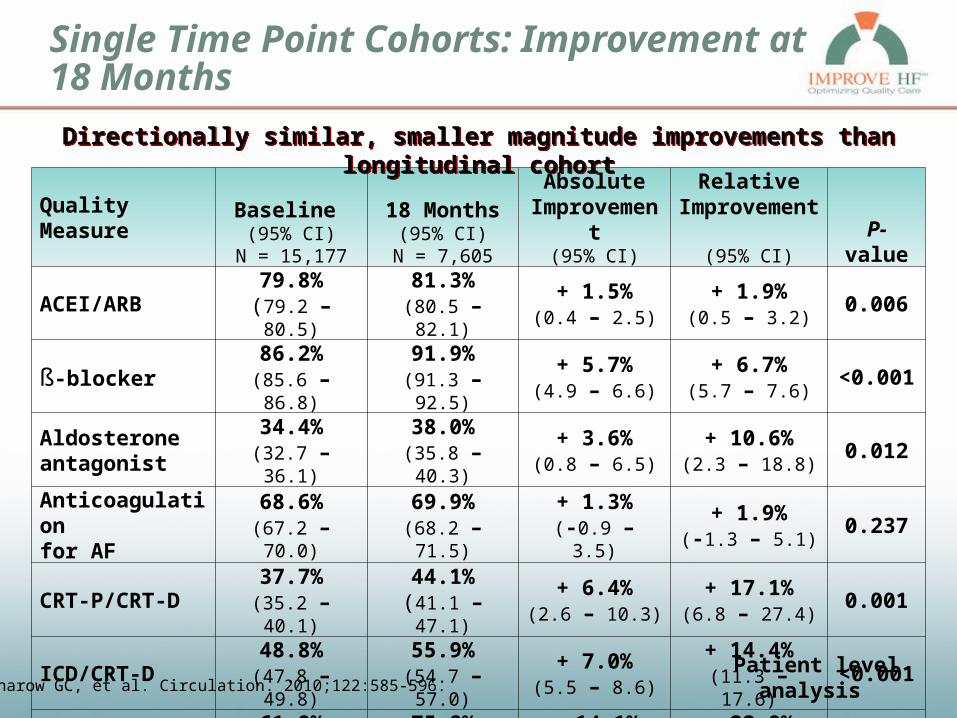
Single Time Point Cohorts: Improvement at 18 Months
Quality MeasureBaseline (95% CI)
N = 15,177
18 Months(95% CI)N = 7,605
Absolute Improvement
(95% CI)
Relative Improvement
(95% CI) P-value
ACEI/ARB79.8%
(79.2 – 80.5)81.3%
(80.5 – 82.1)+ 1.5%
(0.4 – 2.5)+ 1.9%
(0.5 – 3.2)0.006
ß-blocker86.2%
(85.6 – 86.8)91.9%
(91.3 – 92.5)+ 5.7%
(4.9 – 6.6)+ 6.7%
(5.7 – 7.6)<0.001
Aldosterone antagonist
34.4%(32.7 – 36.1)
38.0%(35.8 – 40.3)
+ 3.6%(0.8 – 6.5)
+ 10.6%(2.3 – 18.8)
0.012
Anticoagulationfor AF
68.6%(67.2 – 70.0)
69.9%(68.2 – 71.5)
+ 1.3%(-0.9 – 3.5)
+ 1.9%(-1.3 – 5.1)
0.237
CRT-P/CRT-D37.7%
(35.2 – 40.1)44.1%
(41.1 – 47.1)+ 6.4%
(2.6 – 10.3)+ 17.1%
(6.8 – 27.4)0.001
ICD/CRT-D48.8%
(47.8 – 49.8)55.9%
(54.7 – 57.0)+ 7.0%
(5.5 – 8.6)+ 14.4%
(11.3 – 17.6)<0.001
HF education61.8%
(61.0 – 62.5)75.8%
(75.0 – 76.7)+ 14.1%
(12.9 – 15.2)+ 22.8%
(20.9 – 24.7)<0.001
Fonarow GC, et al. Circulation. 2010;122:585-596. Patient level analysis
Directionally similar, smaller magnitude improvements than longitudinal cohortDirectionally similar, smaller magnitude improvements than longitudinal cohort

Study Limitations
• Patient eligibility and utilization rates determined by accuracy and completeness of medical records and their abstraction– Reasons for preventing treatment may not have been documented
• Potential for ascertainment bias– Self-selected cardiology practices, primary care setting not included
• Not randomized—secular trends may have influenced results
• Follow-up not available for all patients– Practices dropped out, patients died or were lost to follow-up
– Paired analyses revealed similar improvements
• Clinical outcomes could not be evaluated with the design
• Unable to measure use of therapies outside of guidelines
• Relative efficaciousness of intervention components could not be determined
Fonarow GC, et al. Circulation. 2010;122:585-596.

Conclusions
• IMPROVE HF is the largest outpatient cardiology heart failure practice performance improvement program.
• Implementation of a defined and scalable performance improvement intervention may improve the use of evidence-based, guideline-recommended heart failure therapies in real-world cardiology practices.
• Study findings may serve as a model for existing and future performance improvement programs.
Fonarow GC, et al. Circulation. 2010;122:585-596.

Clinical Implications
Implementation of a defined and scalable practice specific performance improvement intervention enhances use of evidence-based, guideline-recommended HF therapies demonstrated to improve outcomes
In all care settings where HF patients are managed, programs to provide practitioners with useful reminders based on the guidelines and to continuously assess the success achieved in providing these recommended therapies to the patients who can benefit from them should be implemented
Fonarow GC, et al. Circulation. 2010;122:585-596.

Back-up Slides
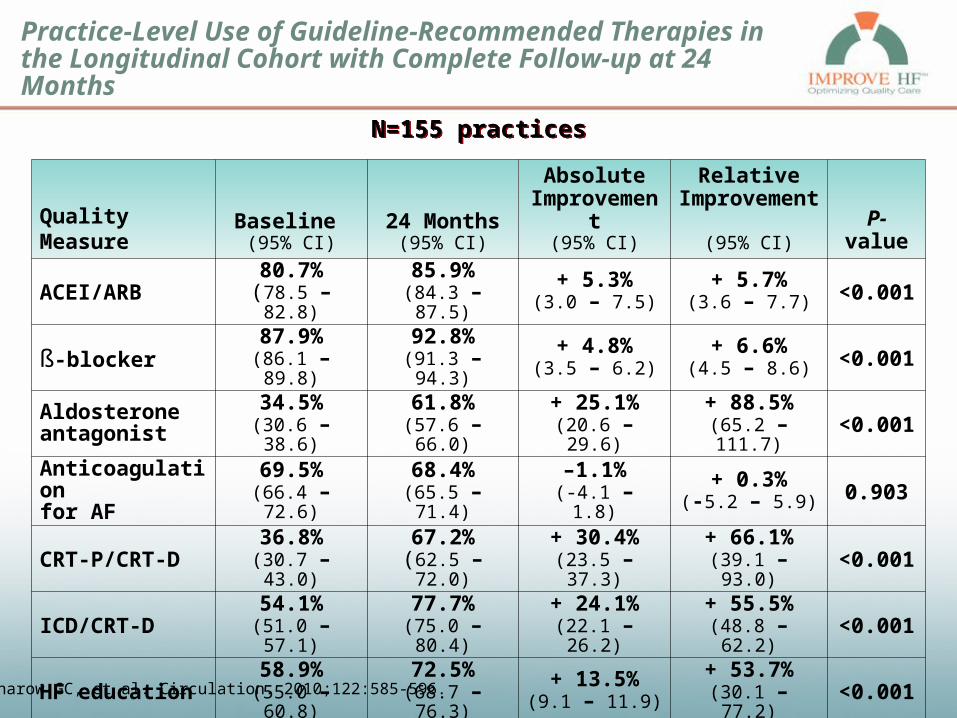
Practice-Level Use of Guideline-Recommended Therapies in the Longitudinal Cohort with Complete Follow-up at 24 Months
Quality MeasureBaseline (95% CI)
24 Months(95% CI)
Absolute Improvement
(95% CI)
Relative Improvement
(95% CI) P-value
ACEI/ARB80.7%
(78.5 – 82.8)85.9%
(84.3 – 87.5)+ 5.3%
(3.0 – 7.5)+ 5.7%
(3.6 – 7.7) <0.001
ß-blocker87.9%
(86.1 – 89.8)92.8%
(91.3 – 94.3)+ 4.8%
(3.5 – 6.2)+ 6.6%
(4.5 – 8.6) <0.001
Aldosterone antagonist
34.5%(30.6 – 38.6)
61.8%(57.6 – 66.0)
+ 25.1%(20.6 – 29.6)
+ 88.5%(65.2 – 111.7) <0.001
Anticoagulationfor AF
69.5%(66.4 – 72.6)
68.4%(65.5 – 71.4)
–1.1%(-4.1 – 1.8)
+ 0.3%(-5.2 – 5.9) 0.903
CRT-P/CRT-D36.8%
(30.7 – 43.0)67.2%
(62.5 – 72.0)+ 30.4%
(23.5 – 37.3)+ 66.1%
(39.1 – 93.0) <0.001
ICD/CRT-D54.1%
(51.0 – 57.1)77.7%
(75.0 – 80.4)+ 24.1%
(22.1 – 26.2)+ 55.5%
(48.8 – 62.2) <0.001
HF education58.9%
(55.0 – 60.8)72.5%
(68.7 – 76.3)+ 13.5%
(9.1 – 11.9)+ 53.7%
(30.1 – 77.2) <0.001
All-or-none care 25.5%(23.4 – 27.7)
44.1%(41.0 – 47.2)
+ 18.6%(15.4 – 21.7)
+ 125.1%(86.8 – 163.4) <0.001
Composite care 69.1%(67.6 – 70.6)
79.6%(78.1 – 71.1)
+ 10.5%(9.1 – 11.9)
+ 16.7%(14.0 – 19.4) <0.001
N=155 practicesN=155 practices
Fonarow GC, et al. Circulation. 2010;122:585-596.
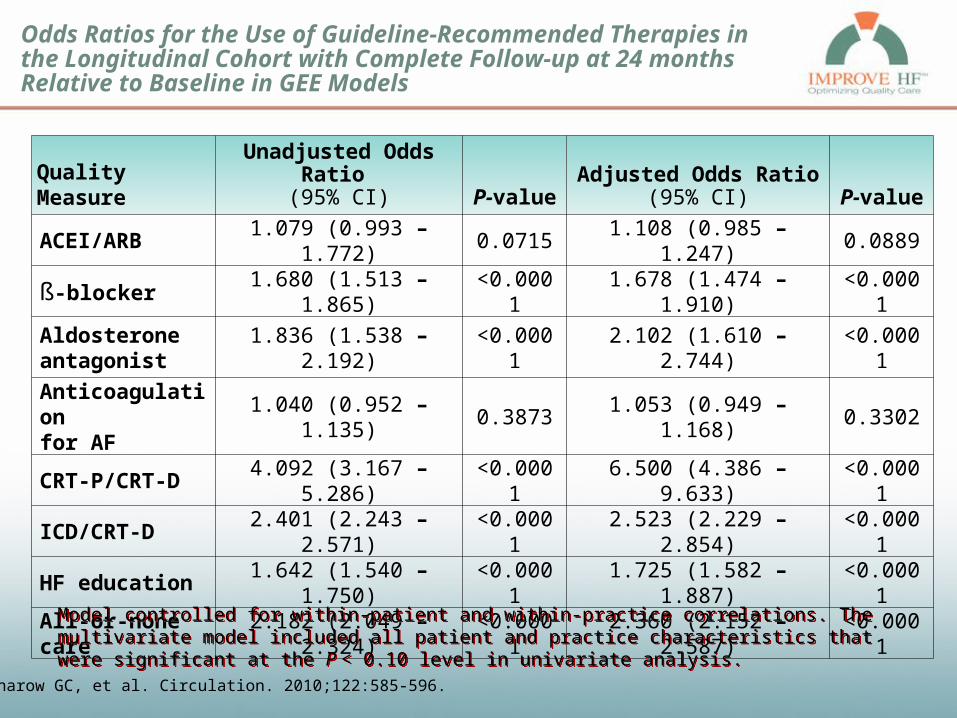
Odds Ratios for the Use of Guideline-Recommended Therapies in the Longitudinal Cohort with Complete Follow-up at 24 months Relative to Baseline in GEE Models
Quality MeasureUnadjusted Odds Ratio
(95% CI) P-valueAdjusted Odds Ratio
(95% CI) P-value
ACEI/ARB 1.079 (0.993 – 1.772) 0.0715 1.108 (0.985 – 1.247) 0.0889
ß-blocker 1.680 (1.513 – 1.865) <0.0001 1.678 (1.474 – 1.910) <0.0001
Aldosterone antagonist
1.836 (1.538 – 2.192) <0.0001 2.102 (1.610 – 2.744) <0.0001
Anticoagulationfor AF
1.040 (0.952 – 1.135) 0.3873 1.053 (0.949 – 1.168) 0.3302
CRT-P/CRT-D 4.092 (3.167 – 5.286) <0.0001 6.500 (4.386 – 9.633) <0.0001
ICD/CRT-D 2.401 (2.243 – 2.571) <0.0001 2.523 (2.229 – 2.854) <0.0001
HF education 1.642 (1.540 – 1.750) <0.0001 1.725 (1.582 – 1.887) <0.0001
All-or-none care 2.182 (2.049 – 2.324) <0.0001 2.360 (2.152 – 2.587) <0.0001
Fonarow GC, et al. Circulation. 2010;122:585-596.
Model controlled for within-patient and within-practice correlations. The multivariate model included all patient and practice characteristics that were significant at the P < 0.10 level in univariate analysis. Model controlled for within-patient and within-practice correlations. The multivariate model included all patient and practice characteristics that were significant at the P < 0.10 level in univariate analysis.

Use of Guideline-Recommended Therapies in the Longitudinal Cohort at Baseline for the Entire Cohort, and by Patient status at 24 Months
Quality MeasureTotal cohort (N=15,177)
Alive and with 24-month follow-up(N=7,605)
Subsequently lost to follow-
up(N=5,003)
Subsequently died
(N=2,569)
Subsequently lost or died
(N=7,572)
ACEI/ARB 79.8%(11,165/13,987)
83.0%(5,921/7138)
79.0%(3,624/4,588)
71.6%(1,620/2,261)
76.6%(5,244/6,849)
ß-blocker 86.2%(11,868/13,772)
88.5%(6,109/6,905)
85.3%(3,870/4,537)
81.1%(1,889/2,330)
83.9%(5,759/6,867)
Aldosterone antagonist
34.4%(987/2,870)
35.4%(453/1,278)
32.1%(313/976)
35.9%(221/616)
33.5%(534/1,592)
Anticoagulationfor AF
68.6%(2,910/4,244)
72.2%(1,488/2,061)
65.3%(835/1,278)
64.9%(587/905)
65.1%(1,422/2,183)
CRT-P/CRT-D 37.7%(580/1,540)
41.2%(277/673)
36.1%(174/482)
33.5%(129/385)
34.9%(303/867)
ICD/CRT-D 48.8%(4,799/9,830)
54.4%(2,736/5,028)
41.4%(1,262/3,048)
45.7%(801/1,754)
43.0%(2,063/4,802)
HF education 61.8%(9,373/15,177)
59.7%(4,539/7,605)
65.1%(3,259/5,003)
61.3%(1,575/2,569)
63.8%(4,834/7,572)
Fonarow GC, et al. Circulation. 2010;122:585-596.

Odds Ratios for the Use of Guideline-Recommended Therapies in the 18-Month Single-Point-in-Time Cohort Relative to the Longitudinal Baseline Cohort in GEE Models
Quality MeasureUnadjusted Odds Ratio
(95% CI) P-valueAdjusted Odds Ratio
(95% CI) P-value
ACEI/ARB 1.079 (1.008 – 1.556) 0.0284 1.036 (0.941 – 1.140) 0.04745
ß-blocker 1.736 (1.580 – 1.907) <0.0001 1.685 (1.474 – 1.927) <0.0001
Aldosterone antagonist
1.107 (0.975 – 1.257) 0.1166 1.018 (0.875 – 1.183) 0.8194
Anticoagulationfor AF
1.063 (0.958 – 1.180) 0.2489 1.025 (0.894 – 1.174) 0.7243
CRT-P/CRT-D 1.334 (1.132 – 1.573) 0.0006 1.361 (1.136 – 1.629) <0.0001
ICD/CRT-D 1.310 (1.231 – 1.395) <0.0001 1.269 (1.138 – 1.8415) <0.0001
HF education 2.024 (1.910 – 2.146) <0.0001 2.072 (1.894 – 2.267) <0.0001
All-or-none care 1.552 (1.464 – 1.645) 0.0001 1.684 (1. 568 – 1. 810) <0.0001
Fonarow GC, et al. Circulation. 2010;122:585-596.
Model controlled for within-practice correlations. The multivariate model included all patient and practice characteristics that were significant at the P < 0.10 level in univariate analysis. Model controlled for within-practice correlations. The multivariate model included all patient and practice characteristics that were significant at the P < 0.10 level in univariate analysis.

Eligible Patients for Each Quality Measure by Cohort
Longitudinal Single Time Point
Baseline 12 Months 24 Months 6 Months 18 Months
Total patients 15,177 9,386 7,605 9,992 9,641
ACEI/ARB 13,987 7,968 6,183 9,130 8,685
ß-blocker 13,772 8,274 6,608 8,930 8,519
Aldosterone antagonist
2,870 1,656 1,291 1,862 1,804
Anticoagulationfor AF
4,244 3,219 2,719 2,967 2,951
CRT-P/CRT-D 1,540 1,173 1,096 1,052 1,034
ICD/CRT-D 9,830 6,575 5,331 6,907 6,859
HF education 15,177 9,386 7,605 9,992 9,641
Fonarow GC, et al. Circulation. 2010;122:585-596.

Results: Summary of Baseline Patient Characteristics
• Mean and median age: 68.7 and 70.0 years
• Sex: 71.1% male
• Mean LVEF: 25.4%
• Ischemic etiology: 65.4%
• Comorbidities:– Hypertension 62.2%– Diabetes 34.1%– AF 30.7%– Chronic obstructive pulmonary disease 16.7%
• Median blood pressure: 120/70 mm Hg
• Median Creatinine: 1.2 mg/dL
• NYHA functional class: 34.7% Class I, 36.6% Class II, 20.7% Class III, 2.6% Class IV, 5.5% undocumented
Fonarow GC, et al. Circulation. 2010;122:585-596.
IMPROVE HF Primary Objective
• To observe over the aggregate of IMPROVE HF practice sites a relative ≥20% improvement in at least 2 of the 7 performance measures at 24 months compared with baseline
Fonarow GC et al. Improving the use of evidence-based heart failure therapies in the outpatient setting: theIMPROVE HF performance improvement registry. Am Heart J, 2007; 154:12-38.
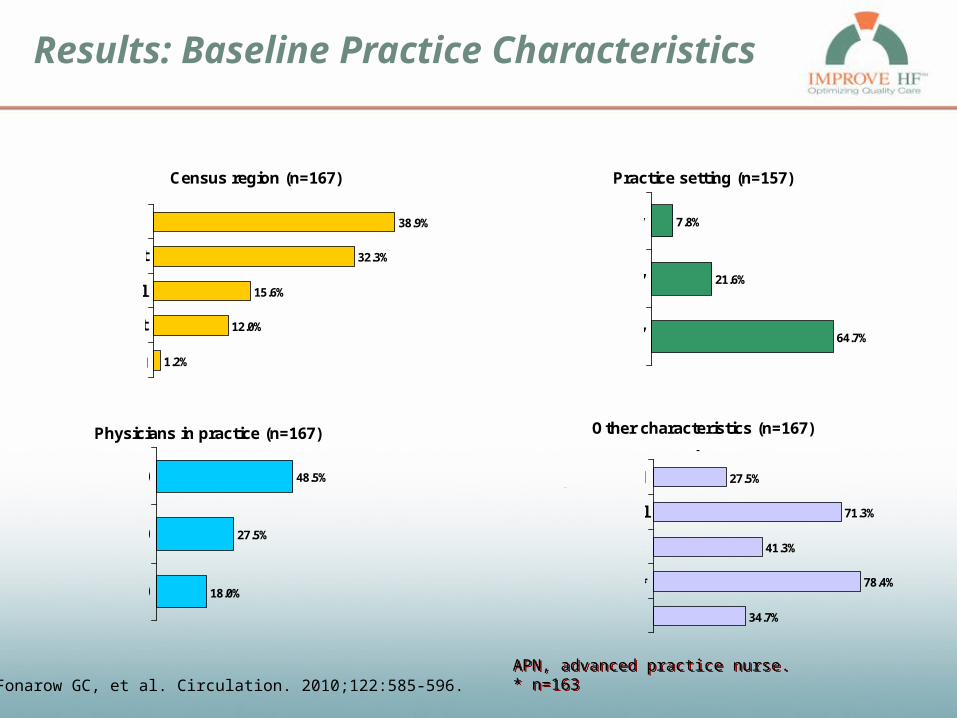
Results: Baseline Practice Characteristics
Census region (n=167)
1.2%
12.0%
15.6%
32.3%
38.9%South
Northeast
Central
West
Missing
Practice setting (n=157)
64.7%
21.6%
7.8%University
Nonuniversity,teaching
Nonuniversity,nonteaching
Other characteristics (n=167)
34.7%
78.4%
41.3%
71.3%
27.5%Hospital-based
HF clinic
>1 APN
Not mutually exclusive
Suburban/rural
Device clinic*
Physicians in practice (n=167)
18.0%
27.5%
48.5%1 - 10
11 - 20
> 20
APN, advanced practice nurse. * n=163APN, advanced practice nurse. * n=163Fonarow GC, et al. Circulation. 2010;122:585-596.
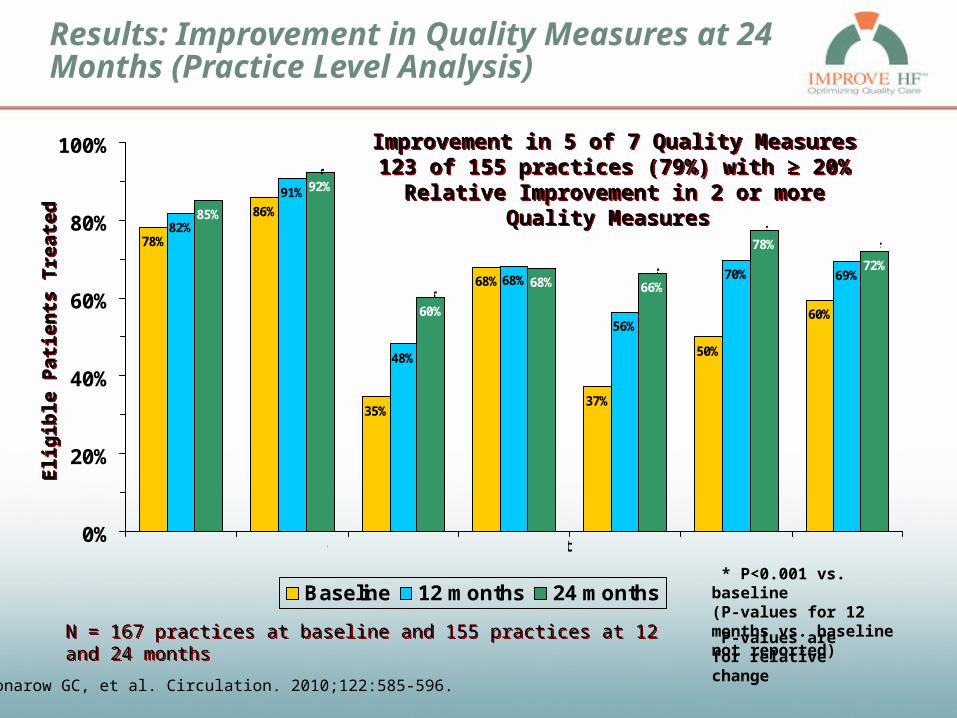
Results: Improvement in Quality Measures at 24 Months (Practice Level Analysis)
78%
86%
35%
68%
37%
50%
60%
82%
91%
48%
68%
56%
70% 69%
85%
92%
60%
68% 66%
78%
72%
0%
20%
40%
60%
80%
100%
Baseline 12 months 24 months
ACEI/ARB ß-blocker Aldosterone Antagonist
Anticoagulant for AF
CRT ICD HF Education
*
*
*
**
Eli
gib
le P
atie
nts
Tre
ate
dE
lig
ible
Pat
ien
ts T
rea
ted
Fonarow GC, et al. Circulation. 2010;122:585-596.
* P<0.001 vs. baseline(P-values for 12 months vs. baseline not reported)
N = 167 practices at baseline and 155 practices at 12 and 24 monthsN = 167 practices at baseline and 155 practices at 12 and 24 months
Improvement in 5 of 7 Quality Measures123 of 155 practices (79%) with ≥ 20% Relative Improvement in 2 or more Quality Measures
Improvement in 5 of 7 Quality Measures123 of 155 practices (79%) with ≥ 20% Relative Improvement in 2 or more Quality Measures
P-values are for relative change
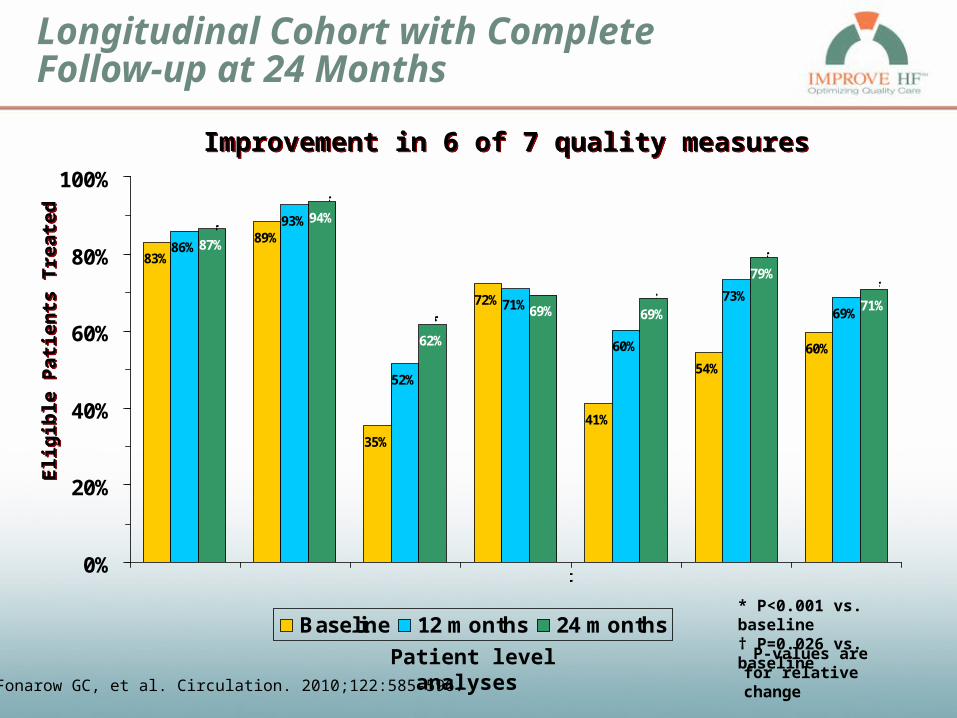
Longitudinal Cohort with Complete Follow-up at 24 Months
83%
89%
35%
72%
41%
54%
60%
86%
93%
52%
71%
60%
73%69%
87%
94%
62%
69% 69%
79%
71%
0%
20%
40%
60%
80%
100%
Baseline 12 months 24 months
ACEI/ARB ß-blocker Aldosterone Antagonist
Anticoagulant for AF
CRT ICD HF Education
*
*
*
*
*
*
†
Eli
gib
le P
atie
nts
Tre
ate
dE
lig
ible
Pat
ien
ts T
rea
ted
Fonarow GC, et al. Circulation. 2010;122:585-596.
* P<0.001 vs. baseline† P=0.026 vs. baseline
Improvement in 6 of 7 quality measuresImprovement in 6 of 7 quality measures
P-values are for relative change
Patient level analyses

Single Time Point Cohorts: Quality Measures at 18 Months
80%
86%
34%
69%
38%
49%
62%
81%
90%
37%
69%
38%
54%
68%
81%
92%
38%
70%
44%
56%
76%
0%
20%
40%
60%
80%
100%
Baseline 6 months 18 months
ACEI/ARB ß-blocker Aldosterone Antagonist
Anticoagulant for AF
CRT ICD HF Education
*
*
*
*
†
‡
Eli
gib
le P
atie
nts
Tre
ate
dE
lig
ible
Pat
ien
ts T
rea
ted
Fonarow GC, et al. Circulation. 2010;122:585-596.
* P ≤ 0.001 vs. baseline† P = 0.006 vs. baseline‡ P = 0.012 vs. baseline
P-values are for relative change
Directionally similar, smaller magnitude improvements than longitudinal cohortDirectionally similar, smaller magnitude improvements than longitudinal cohort
Patient level analyses

Results: Summary Measures at Practice Level
67.1%75.2%
Baseline(n=167)
24 months(n=155)
Composite Score: % of total indicated quality measures provided
Practice level analysis
19.2% relative increase, p < 0.00168.7%
23.5%
Baseline (n=167)
24 months(n=155)
All-or-None Care: % of patients receiving each
indicated quality measure
Practice level analysis
345.5% relative increase, p < 0.001
Fonarow GC, et al. Circulation. 2010;122:585-596.
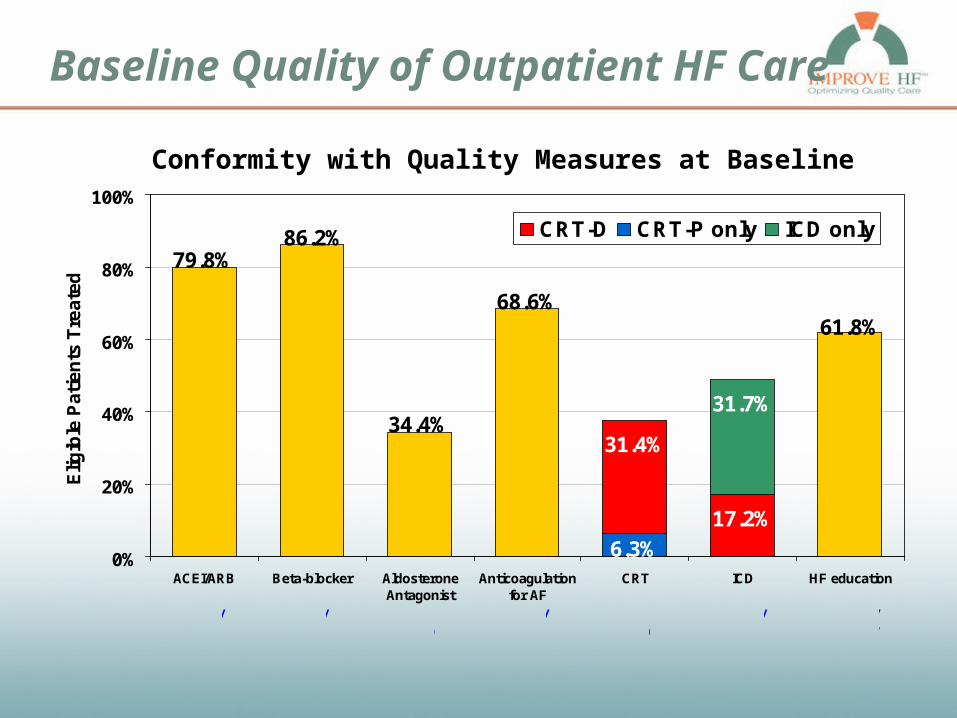
Baseline Quality of Outpatient HF Care
17.2%
31.4%
31.7%
6.3%
61.8%68.6%
34.4%
86.2%79.8%
0%
20%
40%
60%
80%
100%
ACEI/ARB Beta-blocker AldosteroneAntagonist
Anticoagulationfor AF
CRT ICD HF education
Elig
ible
Pa
tie
nts
Tre
ate
d
CRT-D CRT-P only ICD only
37.7%
48.8%
11,165/13,987
11,868/13,772
987/2,870
2,910/4,244
580/1,540
4,799/9,830
9,373/15,177
N =
Conformity with Quality Measures at Baseline
Methods: Study Design and Patient Disposition
LongitudinalCohortLongitudinalCohort
Two Single-Time-PointCohorts
Two Single-Time-PointCohorts
Process Improvement Intervention (165 sites)
Baseline Chart Review
167 sites15,177 patients
Baseline Chart Review
167 sites15,177 patients
12 Month Chart Review
155 sites9,386 patients
12 Month Chart Review
155 sites9,386 patients
24 Month Chart Review
155 sites7,605 patients
24 Month Chart Review
155 sites7,605 patients
6 Month Chart Review
154 sites9,992 patients
6 Month Chart Review
154 sites9,992 patients
Longitudinal cohort baseline 15,177
Died - 2,569
Did not complete 24 mo FU - 1,446
From practices without 24 mo FU - 1,049
Status unknown - 2,508
Alive with 24 mo FU 7,605
18 Month Chart Review
151 sites9,641 patients
18 Month Chart Review
151 sites9,641 patients
34,810 patients enrolled • 167 total sites • 63,143 chart reviews34,810 patients enrolled • 167 total sites • 63,143 chart reviews
FU, Follow UpFU, Follow Up
• Longitudinal cohort included the same patients reviewed at 3 time points.
• Single-time-point cohorts included separate patients from the same practices and unique from the longitudinal cohort, as well as from each other.
• Longitudinal cohort included the same patients reviewed at 3 time points.
• Single-time-point cohorts included separate patients from the same practices and unique from the longitudinal cohort, as well as from each other.
Longitudinal Cohort Patient DispositionLongitudinal Cohort Patient Disposition
Fonarow GC, et al. Circulation. 2010;122:585-596.

IMPROVE HF Performance Improvement Tools
• As part of an enhanced treatment plan, IMPROVE HF provided evidence-based best-practices algorithms, clinical pathways, standardized encounter forms, checklists, pocket cards, chart stickers, and patient education and other materials to facilitate improved management of outpatients with HF.
• The materials can be downloaded from www.improvehf.com
• The materials are also included in the Circulation online-only Data Supplement
Fonarow GC, et al. Circulation. 2010;122:585-596.