Fomc 20050920 Blue Book 20050915
40
Content last modified 03/31/2011. Prefatory Note The attached document represents the most complete and accurate version available based on original files from the FOMC Secretariat at the Board of Governors of the Federal Reserve System. Please note that some material may have been redacted from this document if that material was received on a confidential basis. Redacted material is indicated by occasional gaps in the text or by gray boxes around non-text content. All redacted passages are exempt from disclosure under applicable provisions of the Freedom of Information Act.
-
Upload
fraser-federal-reserve-archive -
Category
Documents
-
view
215 -
download
1
Transcript of Fomc 20050920 Blue Book 20050915
Content last modified 03/31/2011.
Prefatory Note The attached document represents the most complete and accurate version available based on original files from the FOMC Secretariat at the Board of Governors of the Federal Reserve System. Please note that some material may have been redacted from this document if that material was received on a confidential basis. Redacted material is indicated by occasional gaps in the text or by gray boxes around non-text content. All redacted passages are exempt from disclosure under applicable provisions of the Freedom of Information Act.
CLASS I FOMC - RESTRICTED CONTROLLED (FR)
SEPTEMBER 15, 2005
MONETARY POLICY ALTERNATIVES
PREPARED FOR THE FEDERAL OPEN MARKET COMMITTEE BY THE STAFF OF THE BOARD OF GOVERNORS OF THE FEDERAL RESERVE SYSTEM

Class I FOMC - Restricted Controlled (FR) September 15, 2005
MONETARY POLICY ALTERNATIVES
Recent Developments
(1) The Committee’s decision at the August meeting to tighten policy a quarter
point, to maintain an assessment that the risks to both price stability and sustainable
growth were balanced, and to retain the “measured pace” language evoked little
market reaction.1 Over the subsequent few weeks, expectations for the path of the
nominal federal funds rate edged lower in response to rising energy prices and
economic data releases suggesting somewhat softer spending and more subdued
inflation. As the extent of Hurricane Katrina’s devastation became apparent, energy
prices spiked higher and investors marked down their outlook for policy further. The
revision to the outlook was reinforced by the mention in the minutes of the August
FOMC meeting of risks to consumer spending posed by elevated energy prices and by
economic data releases indicating that economic growth may have been slowing even
before the hurricane. In recent days, however, interest rate futures have retraced
some of those declines, influenced by a drop in energy prices as well as comments by
several FOMC participants that noted underlying strength in spending and some
concerns about inflation. On net over the intermeeting period, the federal funds rate
expected for the middle of next year shifted down 30 basis points, to about 4 percent,
while measures of uncertainty about this path for policy derived from options prices
rose notably (Chart 1). Futures quotes suggest about a one-in-five chance that the
FOMC will leave policy unchanged on Tuesday, the first time in more than two years
that the policy outcome has appeared this uncertain this close to the date of the
1 Over the intermeeting period, the effective federal funds rate was close to the target. The Desk purchased $6.4 billion of Treasury coupon securities and $2.5 billion of Treasury bills in the market. There was also a redemption of $757 million of Treasury coupon securities. The volume of outstanding long-term RPs decreased $1 billion, to $18 billion.

Chart 1Interest Rate Developments
Note: Vertical lines indicate August 8, 2005. Last daily observations are for September 15, 2005.
Oct. Nov. Dec. Jan. Feb.2005 2006
3.6
3.8
4.0
4.2
4.4Percent
September 15, 2005 August 8, 2005
●
●
●
●
●
●
●
●
3.70
3.84
3.913.96
3.74
3.95
4.10
4.17
Expected Federal Funds Rates*
*Estimates assume a 1.0 basis point per month term premium and zeroprobability of intermeeting moves.
Sept. Dec. Mar. June Sept. Dec. Mar.2005 2006 2007
3.0
3.5
4.0
4.5
5.0Percent
September 15, 2005August 8, 2005
Expected Federal Funds Rates*
*Estimates from federal funds and eurodollar futures, with an allowance for term premia and other adjustments.
4
6
8
10
12
Jan. Apr. July Oct. Jan. Apr. July2004 2005
30
50
70
90
110
130
150
170
190Percent Basis points
Ten-Year Treasury (left scale)Six-Month Eurodollar (right scale)
Implied Volatilities
DailyFOMC
Jan. Apr. July Oct. Jan. Apr. July2004 2005
0
1
2
3
4
5
6
7Percent
Ten-YearTwo-Year
Nominal Treasury Yields*
Daily
*Par yields from a smoothed nominal off-the-run Treasury yield curve.
FOMC
Jan. Apr. July Oct. Jan. Apr. July2004 2005
0.0
0.5
1.0
1.5
2.0
2.5
3.0
3.5Percent
Five-YearTen-Year
TIPS Yields*
DailyFOMC
*Estimates are from a smoothed inflation-indexed Treasury yield curve.
Jan. Apr. July Oct. Jan. Apr. July2004 2005
1.5
2.0
2.5
3.0
3.5
4.0Percent
Five-to-Ten Years AheadNext Five Years
Inflation Compensation*
Daily
*Based on a comparison of a smoothed TIPS yield curve to a smoothednominal off-the-run Treasury yield curve.
FOMC
Class I FOMC - Restricted Controlled (FR) Page 2 of 38

meeting. Respondents to the Desk’s latest dealer survey attach slightly higher odds to
a pause at this meeting, and only a few expect any change to the characterization of
policy as accommodative or to the “measured pace” language.
(2) Yields on nominal Treasury notes shed about 20 to 30 basis points over the
intermeeting period.2 The decline in longer-term yields was accounted for by a
reduction in forward rates across the term structure in the pre-Katrina period—
consistent with a revision to the longer-term outlook—and a further drop post-
Katrina in near-term forward rates—suggestive of a larger downward revision to the
economic outlook in the nearer term. On net, the price of crude oil was about
unchanged over the intermeeting period, but wholesale gasoline prices edged up, and
natural gas prices jumped (Chart 2). 3 TIPS-implied inflation compensation for the
next five years increased about 15 basis points over the intermeeting period, while
inflation compensation in the five-to-ten-year range changed little. Survey measures
of inflation expectations held steady, although those surveys were mostly conducted
before the hurricane.
(3) Yields on investment-grade corporate bonds moved down about in line
with those on Treasuries, leaving their risk spreads about flat. Spreads on speculative-
grade debt widened somewhat, but generally remained narrow. Major equity indexes
were little changed over the intermeeting period, and the implied volatility of stock
prices remained low, as equity market participants apparently assessed the likely
aggregate economic impact of Hurricane Katrina as being fairly moderate and
2 Concerns about trading in the August 2012 note related to the current ten-year Treasury note futures contract prompted the Treasury to require a position report from large holders. More details on the situation are provided in the box on the next page. 3 However, spot oil prices had risen $3 per barrel between the publication of the August Greenbook and the August FOMC meeting. As a result, oil prices are considerably higher in the current staff forecast than they were in the August forecast.
Class I FOMC - Restricted Controlled (FR) Page 3 of 38
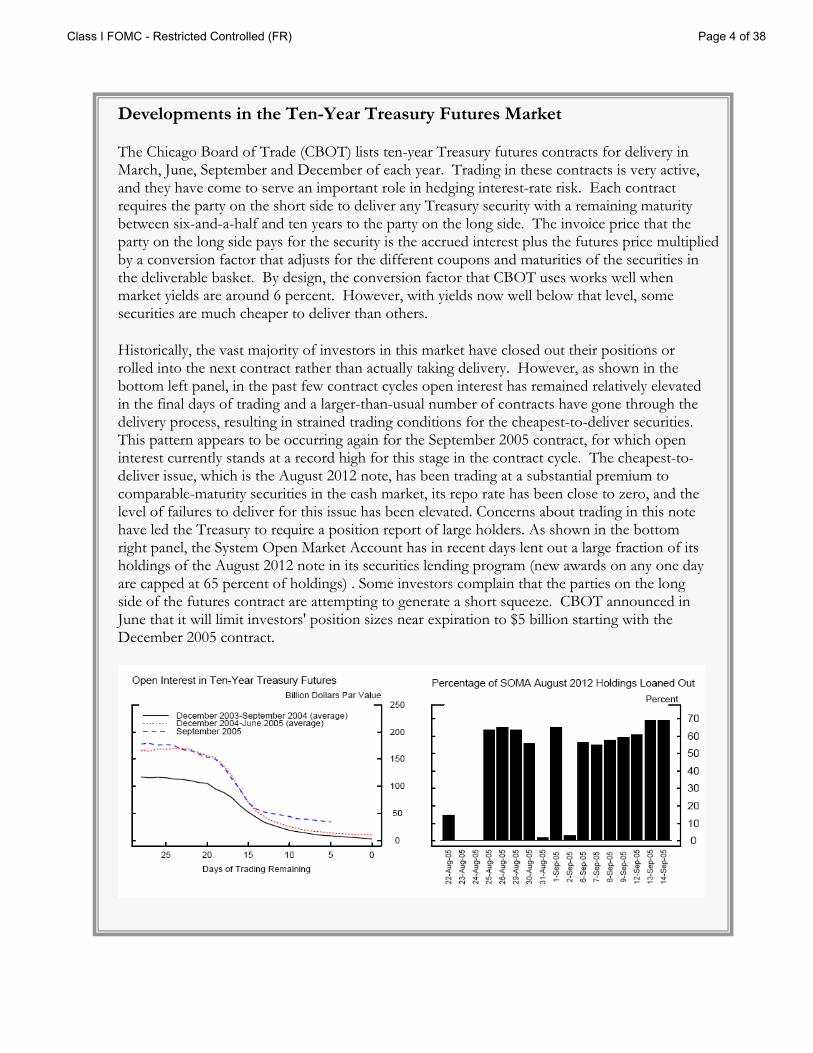
Developments in the Ten-Year Treasury Futures Market
The Chicago Board of Trade (CBOT) lists ten-year Treasury futures contracts for delivery in March, June, September and December of each year. Trading in these contracts is very active, and they have come to serve an important role in hedging interest-rate risk. Each contract requires the party on the short side to deliver any Treasury security with a remaining maturity between six-and-a-half and ten years to the party on the long side. The invoice price that the party on the long side pays for the security is the accrued interest plus the futures price multiplied by a conversion factor that adjusts for the different coupons and maturities of the securities in the deliverable basket. By design, the conversion factor that CBOT uses works well when market yields are around 6 percent. However, with yields now well below that level, some securities are much cheaper to deliver than others.
Historically, the vast majority of investors in this market have closed out their positions or rolled into the next contract rather than actually taking delivery. However, as shown in the bottom left panel, in the past few contract cycles open interest has remained relatively elevated in the final days of trading and a larger-than-usual number of contracts have gone through the delivery process, resulting in strained trading conditions for the cheapest-to-deliver securities. This pattern appears to be occurring again for the September 2005 contract, for which open interest currently stands at a record high for this stage in the contract cycle. The cheapest-to-deliver issue, which is the August 2012 note, has been trading at a substantial premium to comparable-maturity securities in the cash market, its repo rate has been close to zero, and the level of failures to deliver for this issue has been elevated. Concerns about trading in this note have led the Treasury to require a position report of large holders. As shown in the bottom right panel, the System Open Market Account has in recent days lent out a large fraction of its holdings of the August 2012 note in its securities lending program (new awards on any one day are capped at 65 percent of holdings) . Some investors complain that the parties on the long side of the futures contract are attempting to generate a short squeeze. CBOT announced in June that it will limit investors' position sizes near expiration to $5 billion starting with the December 2005 contract.
Class I FOMC - Restricted Controlled (FR) Page 4 of 38
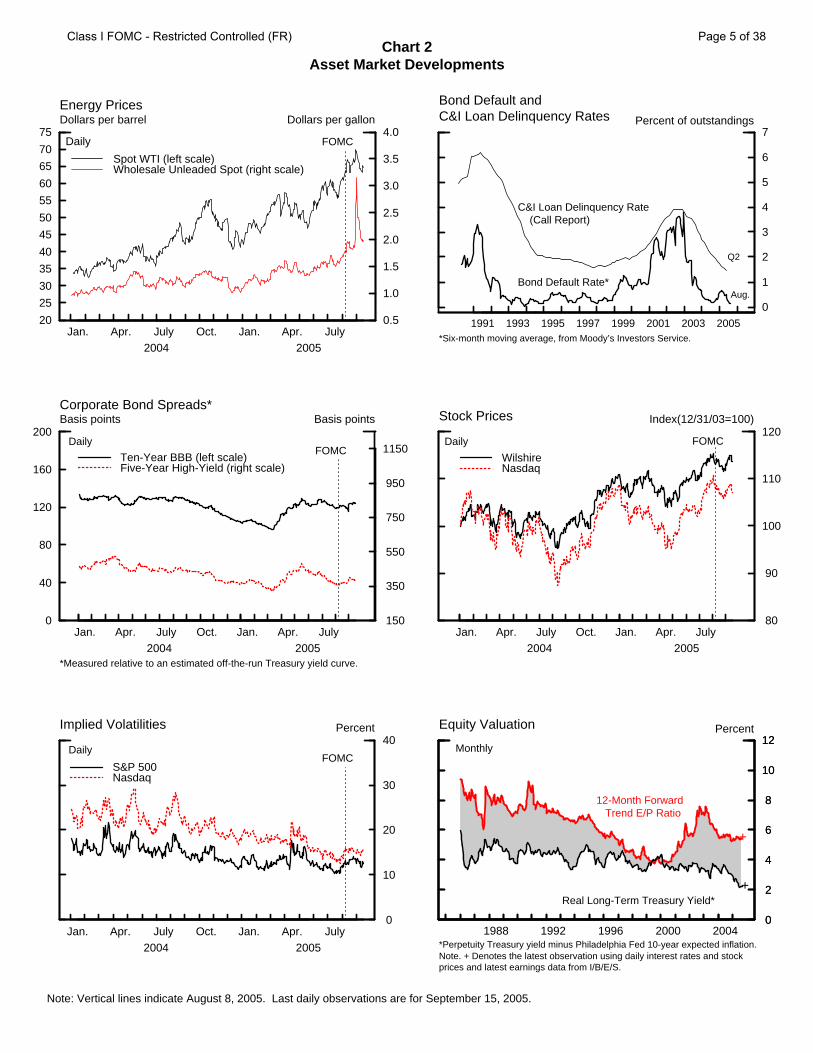
Chart 2Asset Market Developments
Note: Vertical lines indicate August 8, 2005. Last daily observations are for September 15, 2005.
20
25
30
35
40
45
50
55
60
65
70
75
Jan. Apr. July Oct. Jan. Apr. July2004 2005
0.5
1.0
1.5
2.0
2.5
3.0
3.5
4.0Dollars per barrel Dollars per gallon
Spot WTI (left scale) Wholesale Unleaded Spot (right scale)
Daily FOMC
Energy Prices
1991 1993 1995 1997 1999 2001 2003 2005
0
1
2
3
4
5
6
7
Bond Default andC&I Loan Delinquency Rates Percent of outstandings
C&I Loan Delinquency Rate (Call Report)
Bond Default Rate*
*Six-month moving average, from Moody’s Investors Service.
Q2
Aug.
0
40
80
120
160
200
Jan. Apr. July Oct. Jan. Apr. July2004 2005
150
350
550
750
950
1150
Basis points Basis points
Ten-Year BBB (left scale)Five-Year High-Yield (right scale)
FOMC
Corporate Bond Spreads*
Daily
*Measured relative to an estimated off-the-run Treasury yield curve.
Jan. Apr. July Oct. Jan. Apr. July2004 2005
80
90
100
110
120Index(12/31/03=100)
WilshireNasdaq
FOMC
Stock Prices
Daily
Jan. Apr. July Oct. Jan. Apr. July2004 2005
0
10
20
30
40Percent
S&P 500Nasdaq
Implied Volatilities
DailyFOMC
0
2
4
6
8
10
12
1988 1992 1996 2000 2004
12-Month Forward Trend E/P Ratio
Real Long-Term Treasury Yield*
+
+
*Perpetuity Treasury yield minus Philadelphia Fed 10-year expected inflation.Note. + Denotes the latest observation using daily interest rates and stock prices and latest earnings data from I/B/E/S.
Equity Valuation
Monthly
Percent
0
2
4
6
8
10
12
Class I FOMC - Restricted Controlled (FR) Page 5 of 38

temporary, and offset by lower interest rates and higher anticipated federal spending.4
The stocks of oil companies and utilities registered substantial gains, while a broad
index of property and casualty insurers was down only about 2 percent, although the
shares of Allstate insurance company, which has a significant exposure in the Gulf
Coast area, declined 7 percent. The announcement that two more large U.S. air
carriers entered into bankruptcy yesterday was widely expected and caused barely a
ripple in financial markets.
(4) The trade-weighted foreign exchange value of the dollar against major
foreign currencies fell about ¾ percent on balance over the intermeeting period
(Chart 3).5 The dollar was pressured lower during the period by data indicating
somewhat weaker U.S. economic performance and, for a while, by concerns about
the consequences of Hurricane Katrina. The dollar moved up about 1 percent against
the euro, as economic performance in the euro area continued to be sluggish, but it
slipped almost 1½ percent versus the yen and 2¼ percent vis-à-vis the Canadian
dollar. The Bank of Canada raised its policy rate 25 basis points—the first such move
in almost a year. Yields on benchmark long-term government securities in most
foreign industrial countries dropped 15 to 25 basis points over the intermeeting
period, while yields in Japan edged down only a small amount. Stock prices in most
countries were about unchanged or up slightly on balance, but share prices rose
10 percent in Japan, reacting in part to strong second-quarter earnings reports from
Japanese banks and also to the support for the governing coalition shown in national
elections earlier this week.
4 Timing conventions matter here as well. Stock prices were off modestly from the August Greenbook publication date to the September Greenbook publication date but up a touch from the meeting date. The former comparison is relevant for the discussion of revisions to the forecast in the “Economic Outlook” section of the Bluebook, while the latter is the basis for this section’s discussion of recent developments. 5
Class I FOMC - Restricted Controlled (FR) Page 6 of 38
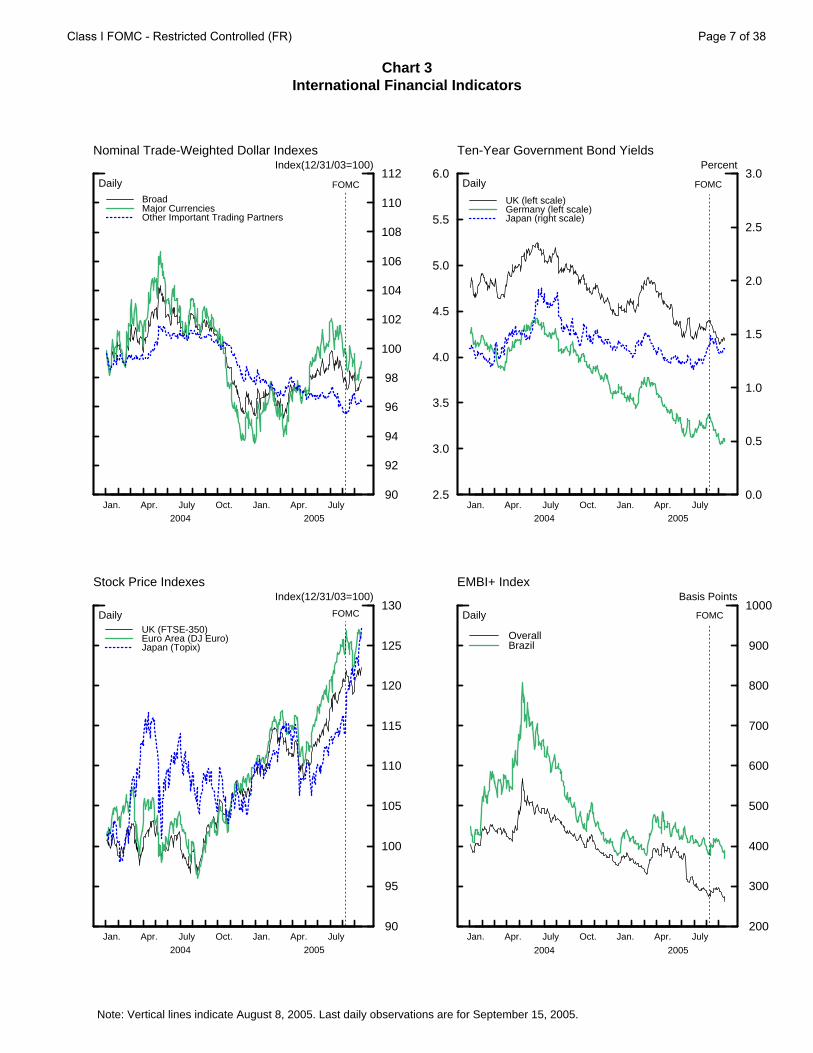
Chart 3International Financial Indicators
Note: Vertical lines indicate August 8, 2005. Last daily observations are for September 15, 2005.
Jan. Apr. July Oct. Jan. Apr. July2004 2005
90
92
94
96
98
100
102
104
106
108
110
112
BroadMajor CurrenciesOther Important Trading Partners
Nominal Trade-Weighted Dollar Indexes
Daily
Index(12/31/03=100)
FOMC
2.5
3.0
3.5
4.0
4.5
5.0
5.5
6.0
Jan. Apr. July Oct. Jan. Apr. July2004 2005
0.0
0.5
1.0
1.5
2.0
2.5
3.0
UK (left scale)Germany (left scale)Japan (right scale)
Ten-Year Government Bond Yields
Daily
Percent
FOMC
Jan. Apr. July Oct. Jan. Apr. July2004 2005
90
95
100
105
110
115
120
125
130
UK (FTSE-350)Euro Area (DJ Euro)Japan (Topix)
Stock Price Indexes
Daily
Index(12/31/03=100)
FOMC
Jan. Apr. July Oct. Jan. Apr. July
2004 2005
200
300
400
500
600
700
800
900
1000
OverallBrazil
EMBI+ Index
Daily
Basis Points
FOMC
Class I FOMC - Restricted Controlled (FR) Page 7 of 38
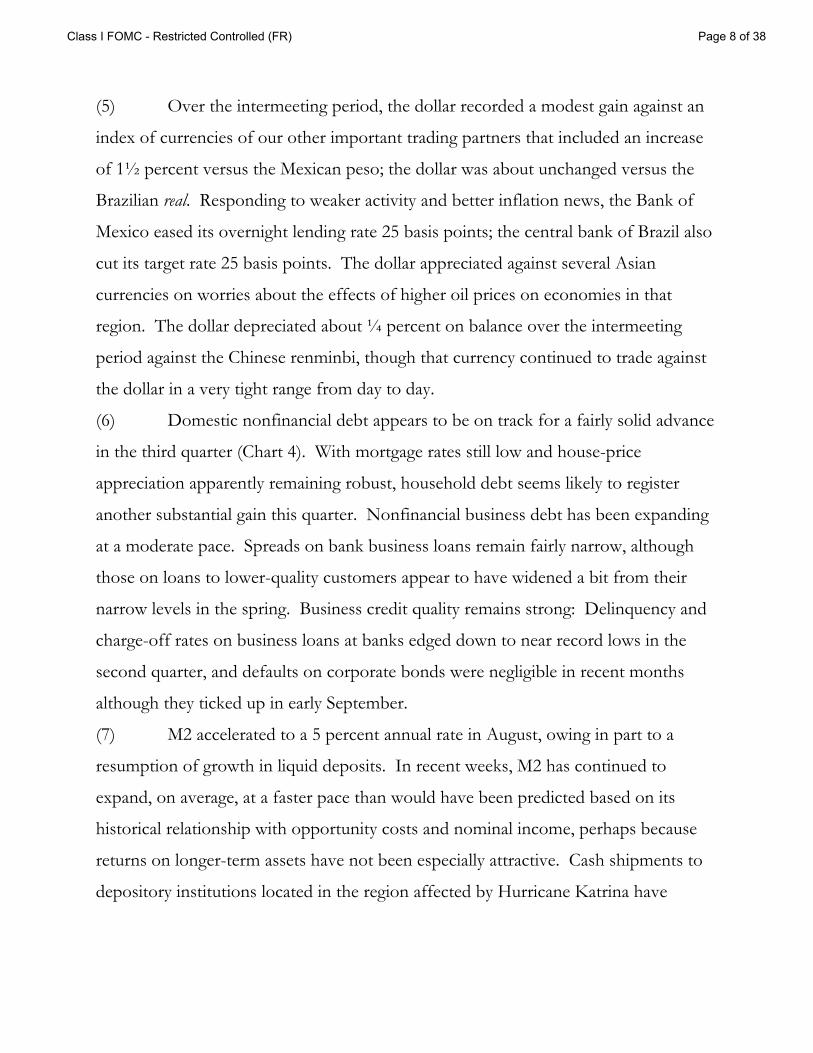
(5) Over the intermeeting period, the dollar recorded a modest gain against an
index of currencies of our other important trading partners that included an increase
of 1½ percent versus the Mexican peso; the dollar was about unchanged versus the
Brazilian real. Responding to weaker activity and better inflation news, the Bank of
Mexico eased its overnight lending rate 25 basis points; the central bank of Brazil also
cut its target rate 25 basis points. The dollar appreciated against several Asian
currencies on worries about the effects of higher oil prices on economies in that
region. The dollar depreciated about ¼ percent on balance over the intermeeting
period against the Chinese renminbi, though that currency continued to trade against
the dollar in a very tight range from day to day.
(6) Domestic nonfinancial debt appears to be on track for a fairly solid advance
in the third quarter (Chart 4). With mortgage rates still low and house-price
appreciation apparently remaining robust, household debt seems likely to register
another substantial gain this quarter. Nonfinancial business debt has been expanding
at a moderate pace. Spreads on bank business loans remain fairly narrow, although
those on loans to lower-quality customers appear to have widened a bit from their
narrow levels in the spring. Business credit quality remains strong: Delinquency and
charge-off rates on business loans at banks edged down to near record lows in the
second quarter, and defaults on corporate bonds were negligible in recent months
although they ticked up in early September.
(7) M2 accelerated to a 5 percent annual rate in August, owing in part to a
resumption of growth in liquid deposits. In recent weeks, M2 has continued to
expand, on average, at a faster pace than would have been predicted based on its
historical relationship with opportunity costs and nominal income, perhaps because
returns on longer-term assets have not been especially attractive. Cash shipments to
depository institutions located in the region affected by Hurricane Katrina have
Class I FOMC - Restricted Controlled (FR) Page 8 of 38
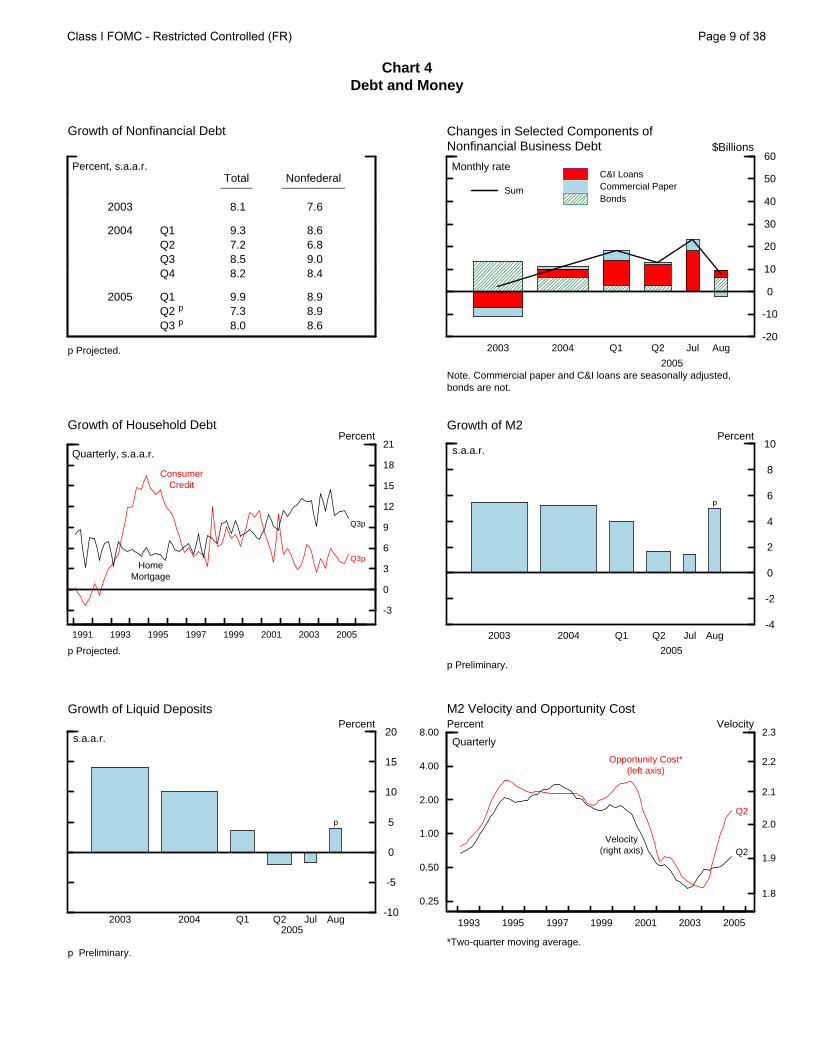
Chart 4Debt and Money
Growth of Nonfinancial Debt
Percent, s.a.a.r.
2003
2004
2005
Q1Q2Q3Q4
Q1Q2 p
Q3 p
Total_____
8.1
9.37.28.58.2
9.97.38.0
Nonfederal__________
7.6
8.66.89.08.4
8.98.98.6
p Projected.-20
-10
0
10
20
30
40
50
60
C&I LoansCommercial PaperBonds
Sum
Changes in Selected Components ofNonfinancial Business Debt $Billions
2003 2004 Q1 Q2 Jul Aug
2005
Monthly rate
Note. Commercial paper and C&I loans are seasonally adjusted,bonds are not.
1991 1993 1995 1997 1999 2001 2003 2005
-3
0
3
6
9
12
15
18
21
Growth of Household DebtPercent
Quarterly, s.a.a.r.
p Projected.
Q3p
Q3p
ConsumerCredit
HomeMortgage
-4
-2
0
2
4
6
8
10
Growth of M2
s.a.a.r.Percent
p
p Preliminary.
2003 2004 Q1 Q2 Jul Aug
2005
-10
-5
0
5
10
15
20
Growth of Liquid Deposits
s.a.a.r.Percent
p
p Preliminary.
2003 2004 Q1 Q2 Jul Aug2005
0.25
0.50
1.00
2.00
4.00
8.00
1993 1995 1997 1999 2001 2003 2005
1.8
1.9
2.0
2.1
2.2
2.3
M2 Velocity and Opportunity CostVelocityPercent
Quarterly
Opportunity Cost*(left axis)
Velocity(right axis)
*Two-quarter moving average.
Q2
Q2
Class I FOMC - Restricted Controlled (FR) Page 9 of 38

picked up, but there have been no discernible effects on the monetary aggregates to
date.6
6 The box at the end of this section discusses the effects of Hurricane Katrina on the reserves and monetary aggregates.
Class I FOMC - Restricted Controlled (FR) Page 10 of 38
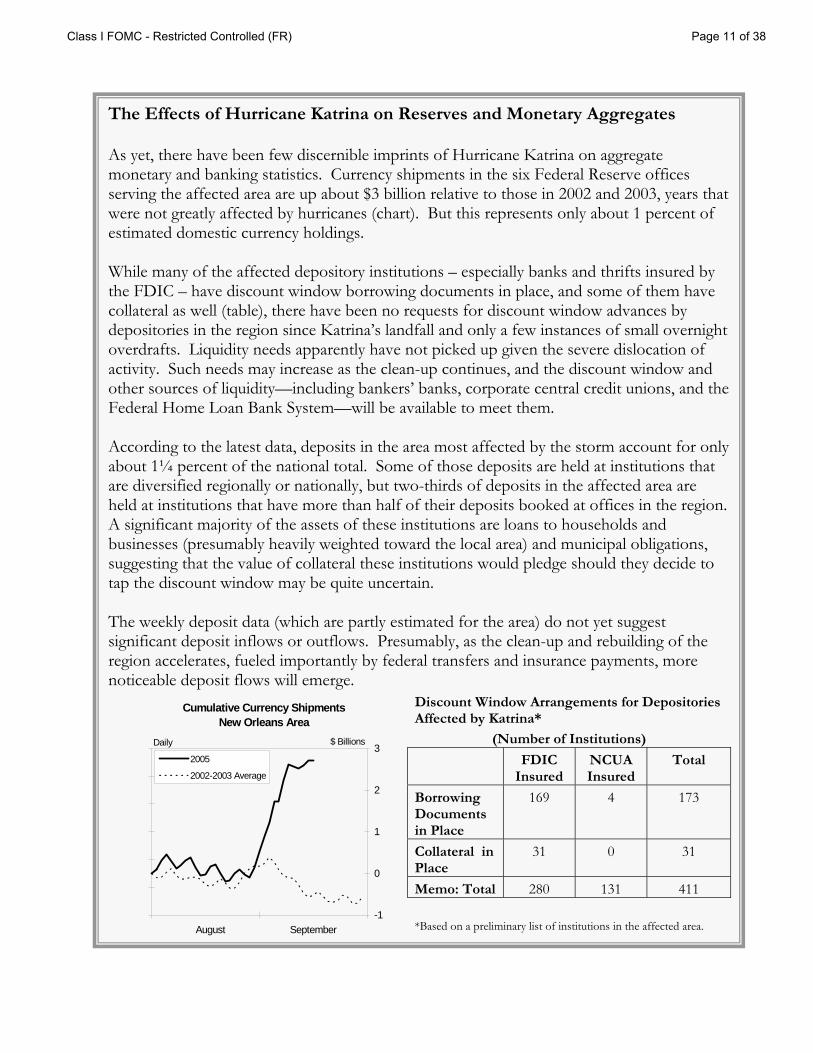
The Effects of Hurricane Katrina on Reserves and Monetary Aggregates As yet, there have been few discernible imprints of Hurricane Katrina on aggregate monetary and banking statistics. Currency shipments in the six Federal Reserve offices serving the affected area are up about $3 billion relative to those in 2002 and 2003, years that were not greatly affected by hurricanes (chart). But this represents only about 1 percent of estimated domestic currency holdings. While many of the affected depository institutions – especially banks and thrifts insured by the FDIC – have discount window borrowing documents in place, and some of them have collateral as well (table), there have been no requests for discount window advances by depositories in the region since Katrina’s landfall and only a few instances of small overnight overdrafts. Liquidity needs apparently have not picked up given the severe dislocation of activity. Such needs may increase as the clean-up continues, and the discount window and other sources of liquidity—including bankers’ banks, corporate central credit unions, and the Federal Home Loan Bank System—will be available to meet them. According to the latest data, deposits in the area most affected by the storm account for only about 1¼ percent of the national total. Some of those deposits are held at institutions that are diversified regionally or nationally, but two-thirds of deposits in the affected area are held at institutions that have more than half of their deposits booked at offices in the region. A significant majority of the assets of these institutions are loans to households and businesses (presumably heavily weighted toward the local area) and municipal obligations, suggesting that the value of collateral these institutions would pledge should they decide to tap the discount window may be quite uncertain. The weekly deposit data (which are partly estimated for the area) do not yet suggest significant deposit inflows or outflows. Presumably, as the clean-up and rebuilding of the region accelerates, fueled importantly by federal transfers and insurance payments, more noticeable deposit flows will emerge.
Discount Window Arrangements for Depositories Affected by Katrina*
(Number of Institutions)
FDIC Insured
NCUA Insured
Total
Borrowing Documents in Place
169 4 173
Collateral in Place
31 0 31
Memo: Total 280 131 411
Cumulative Currency ShipmentsNew Orleans Area
August September
Daily
-1
0
1
2
3$ Billions
2005
2002-2003 Average
*Based on a preliminary list of institutions in the affected area.
Class I FOMC - Restricted Controlled (FR) Page 11 of 38
Economic Outlook
(8) The staff has appreciably revised its economic projection, mainly to
incorporate the effects of Hurricane Katrina. The disruption to economic activity is
expected to hold down output and employment for several months before giving way
to recovery and reconstruction, aided by a large injection of federal spending. By the
end of 2007, economic activity is seen as essentially back on the path in the August
forecast, with output close to its potential. As in August, the staff has assumed that
the stance of monetary policy is tightened gradually over the next several quarters; the
federal funds rate reaches 4¼ percent by the middle of next year, a bit higher than
currently embedded in financial market prices. Bond yields are expected to drift up
over the forecast period, as market participants come to appreciate that monetary
policy will firm slightly more than currently anticipated. Equity prices rise at a pace
sufficient to produce risk-adjusted returns in line with those on fixed-income
securities, and the foreign exchange value of the dollar is assumed to edge down. As
suggested by futures markets, the price of crude oil is forecast to follow a path
somewhat above that in the last projection, with spot prices rising slightly over the
next few months before declining gradually thereafter. Retail energy prices in the near
term are expected to rise more substantially than predicted in August, owing partly to
disruptions to energy production and distribution that resulted from the hurricane,
but then to fall more steeply as the industry’s infrastructure is rebuilt. The near-term
projection for overall inflation has been revised up sharply, mainly reflecting the direct
effects of higher consumer energy prices. As energy prices recede, however, overall
PCE inflation is forecast to drop a little below 2 percent in 2006 and 2007. The
projection for core inflation this year has been shaved a bit, but with the pass-through
of increased energy prices it has been boosted to 2¼ percent for 2006, up about
¼ percentage point from the August round. Core inflation edges down to 2 percent
the following year.
Class I FOMC - Restricted Controlled (FR) Page 12 of 38

Policy Alternatives
(9) This Bluebook presents two formal policy alternatives for the Committee’s
consideration, summarized by the draft statements in Table 1. Both draft
announcements refer to the adverse near-term effects on spending, production, and
employment of Hurricane Katrina. (The box entitled “Monetary Policy
Announcements and External Events” summarizes the Committee’s past practice
with respect to mentioning significant exogenous events in its statements.) The
announcements also refer to inflation pressures but indicate that core inflation has
been relatively low. Under Alternative A, the Committee would leave its target for the
federal funds rate unchanged at 3½ percent at this meeting; the statement would
emphasize hurricane-related uncertainties and suggest that this was just a pause in the
tightening process. Under Alternative B, the Committee would boost the target
25 basis points to 3¾ percent; the statement would note that the longer-term
macroeconomic effects of the hurricane are likely to be limited. Because uncertainty
surrounding the economic outlook has risen considerably, this Bluebook also
considers ways of shading the language under Alternatives A and B to project more
distinct paths for policy. Paragraph 13 considers changes to the statement language
(relative to Alternative B) that could express more concern about inflation. In
contrast, paragraph 16 suggests wording changes to Alternative A that would be
consistent with an expectation of a more prolonged pause in firming. Lastly, the box
at the end of this section entitled “Opening Up the Statement” examines fundamental
changes to the risk assessment that could be made to either Alternative A or B.
(10) If the Committee remains particularly concerned about heightened inflation
pressures and sees little chance that Hurricane Katrina will have lasting and sizable
adverse effects on aggregate spending and production, it may wish to tighten policy
25 basis points at this meeting, as under Alternative B. The Committee may view the
downward revision to monetary policy expectations and the associated easing of
Class I FOMC - Restricted Controlled (FR) Page 13 of 38

Table 1: Alternative Language for the September FOMC Announcement August FOMC Alternative A Alternative B
Policy Decision
1. The Federal Open Market Committee decided today to raise its target for the federal funds rate by 25 basis points to 3½ percent.
The Federal Open Market Committee decided today to raise leave its target for the federal funds rate by 25 basis points to 3½ percent unchanged.
The Federal Open Market Committee decided today to raise its target for the federal funds rate by 25 basis points to 3¾ percent.
2. The Committee believes that, even after this action, the stance of monetary policy remains accommodative and, coupled with robust underlying growth in productivity, is providing ongoing support to economic activity.
The Committee deferred further policy firming in light of the uncertainties surrounding the economic effects of Hurricane Katrina.
[none/see below]
3. Aggregate spending, despite high energy prices, appears to have strengthened since late winter, and labor market conditions continue to improve gradually.
Output appeared poised to continue growing at a good pace before the tragic toll of the hurricane. The widespread devastation in the Gulf region, the associated dislocation of economic activity, and the boost to energy prices imply that spending, production, and employment will be set back in the near term. Moreover, the disruption to the production and refining infrastructure has elevated premiums for energy products and may add to market volatility.
Output appeared poised to continue growing at a good pace before the tragic toll of Hurricane Katrina. The widespread devastation in the Gulf region, the associated dislocation of economic activity, and the boost to energy prices imply that spending, production, and employment will be set back in the near term. Moreover, the disruption to the production and refining infrastructure has elevated premiums for energy products and may add to market volatility.
While these unfortunate developments have increased uncertainty about near-term economic performance, it is the Committee’s view that they do not pose a more persistent threat. Rather, remaining monetary policy accommodation, coupled with robust underlying growth in productivity, is providing ongoing support to economic activity.
Rationale
4. Core inflation has been relatively low in recent months and longer-term inflation expectations remain well contained, but pressures on inflation have stayed elevated.
Higher energy and other costs have the potential to add to inflation pressures. However, core inflation has been relatively low in recent months and longer-term inflation expectations remain well contained.
Higher energy and other costs have the potential to add to inflation pressures. However, core inflation has been relatively low in recent months and longer-term inflation expectations remain well contained.
5. The Committee perceives that, with appropriate monetary policy action, the upside and downside risks to the attainment of both sustainable growth and price stability should be kept roughly equal.
[no change]
[no change]
Assessment of Risk 6. With underlying inflation
expected to be contained, the Committee believes that policy accommodation can be removed at a pace that is likely to be measured. Nonetheless, the Committee will respond to changes in economic prospects as needed to fulfill its obligation to maintain price stability.
[no change]
[no change]
Class I FOMC - Restricted Controlled (FR) Page 14 of 38
financial conditions as an overreaction to recent developments, inclining it to try to
reverse at least a portion of this accommodation. Indeed, the real federal funds rate
remains below the range of staff estimates of its equilibrium value (Chart 5),
suggesting that further policy tightening will be necessary even after a 25 basis point
move at the upcoming meeting.7 Considerable government spending will be
forthcoming to help rebuild the Gulf region, adding to pressures on resources.
Moreover, the further upward spike in consumer energy prices raises the possibility
that the FOMC may need to bring the real funds rate above its equilibrium value for a
time in order to reverse inflationary momentum. A range of monetary policy rules, 7 Starting with this Bluebook, the TIPS-based measure of the equilibrium real rate incorporates time-varying estimates of a term premium that compensates investors for uncertainty about real rates and of a liquidity premium that compensates investors for the relatively poor liquidity of TIPS. Both estimates are obtained from a three-factor arbitrage-free term-structure model.
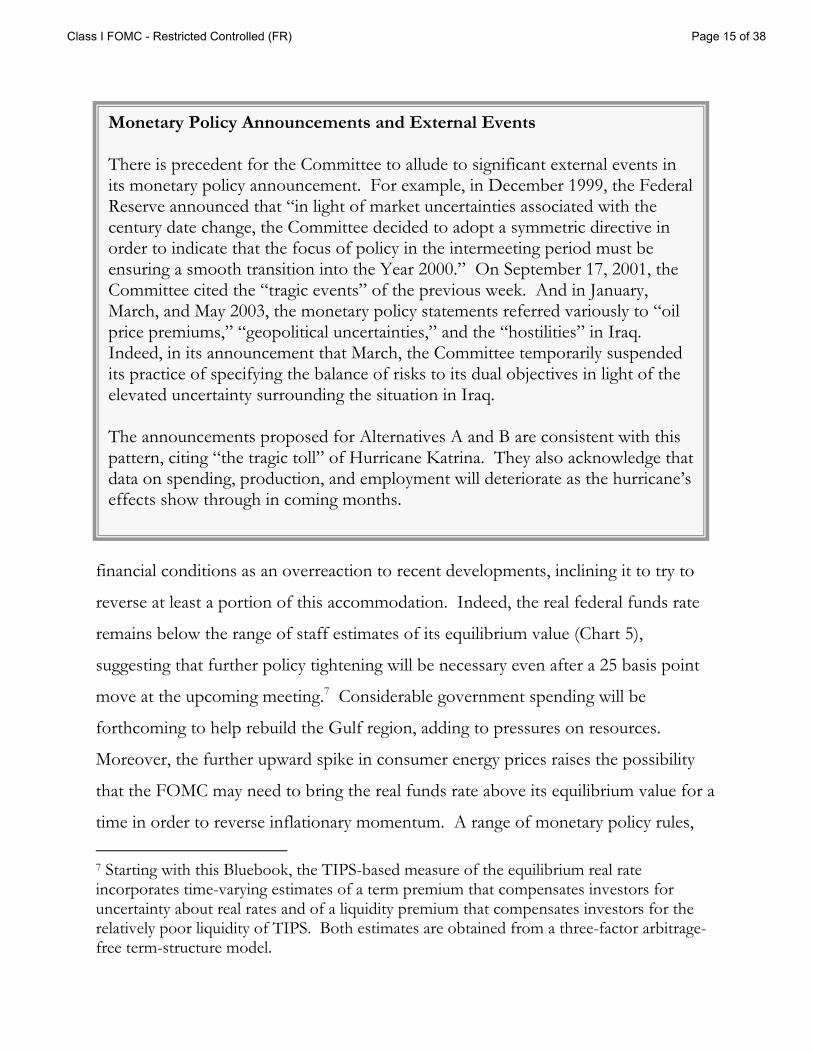
Monetary Policy Announcements and External Events There is precedent for the Committee to allude to significant external events in its monetary policy announcement. For example, in December 1999, the Federal Reserve announced that “in light of market uncertainties associated with the century date change, the Committee decided to adopt a symmetric directive in order to indicate that the focus of policy in the intermeeting period must be ensuring a smooth transition into the Year 2000.” On September 17, 2001, the Committee cited the “tragic events” of the previous week. And in January, March, and May 2003, the monetary policy statements referred variously to “oil price premiums,” “geopolitical uncertainties,” and the “hostilities” in Iraq. Indeed, in its announcement that March, the Committee temporarily suspended its practice of specifying the balance of risks to its dual objectives in light of the elevated uncertainty surrounding the situation in Iraq. The announcements proposed for Alternatives A and B are consistent with this pattern, citing “the tragic toll” of Hurricane Katrina. They also acknowledge that data on spending, production, and employment will deteriorate as the hurricane’s effects show through in coming months.
Class I FOMC - Restricted Controlled (FR) Page 15 of 38

Chart 5Equilibrium Real Federal Funds Rate
1990 1991 1992 1993 1994 1995 1996 1997 1998 1999 2000 2001 2002 2003 2004 2005 2006 2007
-2
-1
0
1
2
3
4
5
6
7
8Percent
25 b.p. TighteningCurrent Rate
Notes: The real federal funds rate is constructed as the difference between the quarterly average of the actual nominalfunds rate and the log difference of the core PCE price index over the previous four quarters. For the current quarter,the nominal funds rate used is the target federal funds rate as of the Bluebook publication date.
Notes: Confidence intervals and bands reflect uncertainties about model specification, coefficients, and the level ofpotential output. The final column indicates the values for the current quarter based on the estimation for the previousBluebook, except that the TIPS-consistent measure and the actual real funds rate are the values published in theprevious Bluebook.* Employs an adjustment for term and liquidity premiums.
Short-Run Estimates with Confidence Bands
Short-Run and Medium-Run Measures
Actual real federal funds rateRange of model-based estimates70 percent confidence band90 percent confidence bandGreenbook-consistent measure
Current Estimate Previous Bluebook
Short-Run Measures Single-equation model 1.9 1.9 Small structural model 2.2 2.2 Large model (FRB/US) 2.5 2.3 Confidence intervals for three model-based estimates 70 percent confidence interval (0.7 - 3.7( 90 percent confidence interval -0.1 - 4.5(
Greenbook-consistent measure 1.8 1.9
Medium-Run Measures Single-equation model 2.2 2.1 Small structural model 2.4 2.4 Confidence intervals for two model-based estimates 70 percent confidence interval (1.4 - 3.1( 90 percent confidence interval (0.7 - 3.7(
TIPS-based factor model *2.0* *2.0*
Memo Actual real federal funds rate 1.59 1.19
Class I FOMC - Restricted Controlled (FR) Page 16 of 38
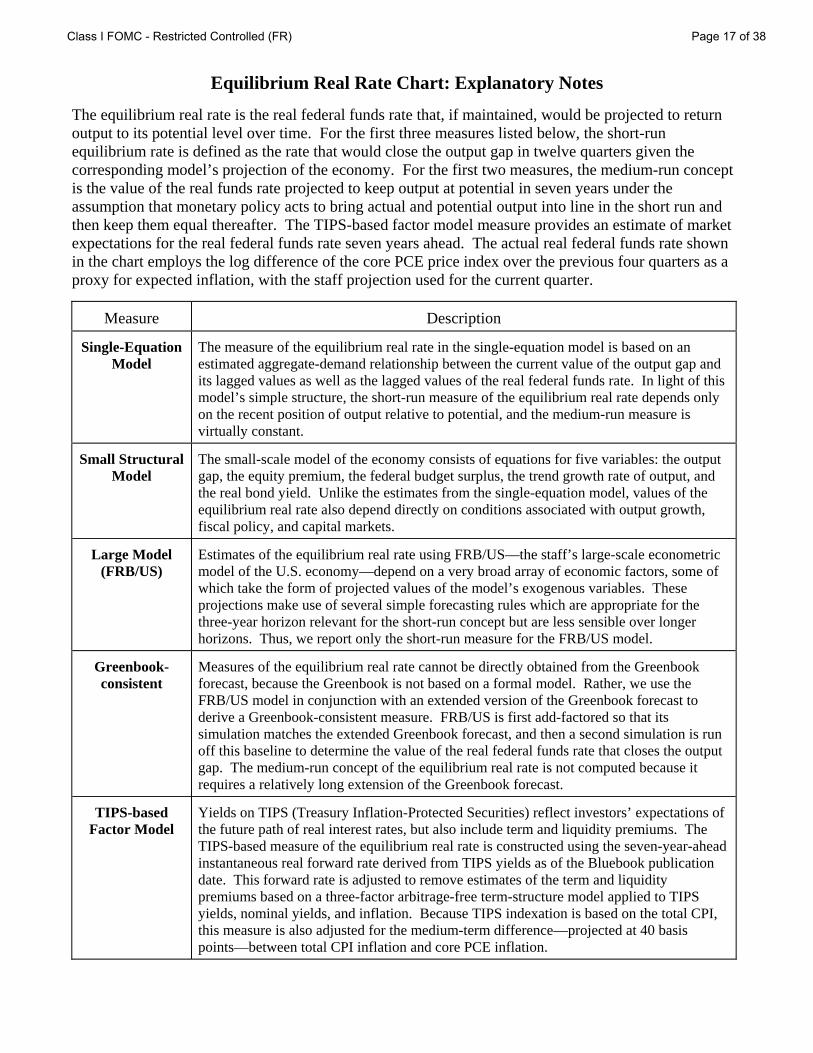
Equilibrium Real Rate Chart: Explanatory Notes
The equilibrium real rate is the real federal funds rate that, if maintained, would be projected to return output to its potential level over time. For the first three measures listed below, the short-run equilibrium rate is defined as the rate that would close the output gap in twelve quarters given the corresponding model’s projection of the economy. For the first two measures, the medium-run concept is the value of the real funds rate projected to keep output at potential in seven years under the assumption that monetary policy acts to bring actual and potential output into line in the short run and then keep them equal thereafter. The TIPS-based factor model measure provides an estimate of market expectations for the real federal funds rate seven years ahead. The actual real federal funds rate shown in the chart employs the log difference of the core PCE price index over the previous four quarters as a proxy for expected inflation, with the staff projection used for the current quarter.
Measure Description
Single-Equation Model
The measure of the equilibrium real rate in the single-equation model is based on an estimated aggregate-demand relationship between the current value of the output gap and its lagged values as well as the lagged values of the real federal funds rate. In light of this model’s simple structure, the short-run measure of the equilibrium real rate depends only on the recent position of output relative to potential, and the medium-run measure is virtually constant.
Small Structural Model
The small-scale model of the economy consists of equations for five variables: the output gap, the equity premium, the federal budget surplus, the trend growth rate of output, and the real bond yield. Unlike the estimates from the single-equation model, values of the equilibrium real rate also depend directly on conditions associated with output growth, fiscal policy, and capital markets.
Large Model (FRB/US)
Estimates of the equilibrium real rate using FRB/US—the staff’s large-scale econometric model of the U.S. economy—depend on a very broad array of economic factors, some of which take the form of projected values of the model’s exogenous variables. These projections make use of several simple forecasting rules which are appropriate for the three-year horizon relevant for the short-run concept but are less sensible over longer horizons. Thus, we report only the short-run measure for the FRB/US model.
Greenbook-consistent
Measures of the equilibrium real rate cannot be directly obtained from the Greenbook forecast, because the Greenbook is not based on a formal model. Rather, we use the FRB/US model in conjunction with an extended version of the Greenbook forecast to derive a Greenbook-consistent measure. FRB/US is first add-factored so that its simulation matches the extended Greenbook forecast, and then a second simulation is run off this baseline to determine the value of the real federal funds rate that closes the output gap. The medium-run concept of the equilibrium real rate is not computed because it requires a relatively long extension of the Greenbook forecast.
TIPS-based Factor Model
Yields on TIPS (Treasury Inflation-Protected Securities) reflect investors’ expectations of the future path of real interest rates, but also include term and liquidity premiums. The TIPS-based measure of the equilibrium real rate is constructed using the seven-year-ahead instantaneous real forward rate derived from TIPS yields as of the Bluebook publication date. This forward rate is adjusted to remove estimates of the term and liquidity premiums based on a three-factor arbitrage-free term-structure model applied to TIPS yields, nominal yields, and inflation. Because TIPS indexation is based on the total CPI, this measure is also adjusted for the medium-term difference—projected at 40 basis points—between total CPI inflation and core PCE inflation.
Class I FOMC - Restricted Controlled (FR) Page 17 of 38

especially those based on an inflation target of 1½ percent, also point to a further
near-term increase in the federal funds rate and suggest more tightening in coming
quarters (Chart 6). The Committee’s uncertainty about prospects for the economy
and inflation may well have increased in the aftermath of the hurricane, but probably
a few months will elapse before a reasonably clear picture of its economic effects
emerges. Thus, unless the Committee sees the hurricane as likely to undermine
spending significantly for several quarters or more—the period in which a change in
monetary policy would have most of its effect on spending—or has serious concerns
that a rate hike might interact in a particularly unfavorable way with household and
business confidence, members might believe it prudent to continue to firm policy at
this meeting.
(11) As shown in Table 1, the proposed announcement associated with
Alternative B would indicate that “Output appeared poised to continue growing at a
good pace before the tragic toll of Hurricane Katrina.” It would go on to state that,
while the hurricane will have adverse short-run economic consequences, including
heightened uncertainty and market volatility, the longer-run prospects for the
economy are not diminished. The statement would note that “Higher energy and
other costs have the potential to add to inflation pressures,” but would also indicate
that “. . . core inflation has been relatively low in recent months and longer-term
inflation expectations remain well contained.” It would assert that “remaining
monetary policy accommodation” and robust underlying growth in productivity
continued to support economic activity. The rest of the statement would repeat the
measured pace language and the assessment that, with appropriate monetary policy
action, the risks to growth and price stability should be kept roughly equal.
(12) Investors currently see a modest probability that the FOMC will leave the
stance of monetary policy unchanged at this meeting. Accordingly, a quarter-point
increase in the funds rate would tend to boost very short-term market interest rates a
Class I FOMC - Restricted Controlled (FR) Page 18 of 38
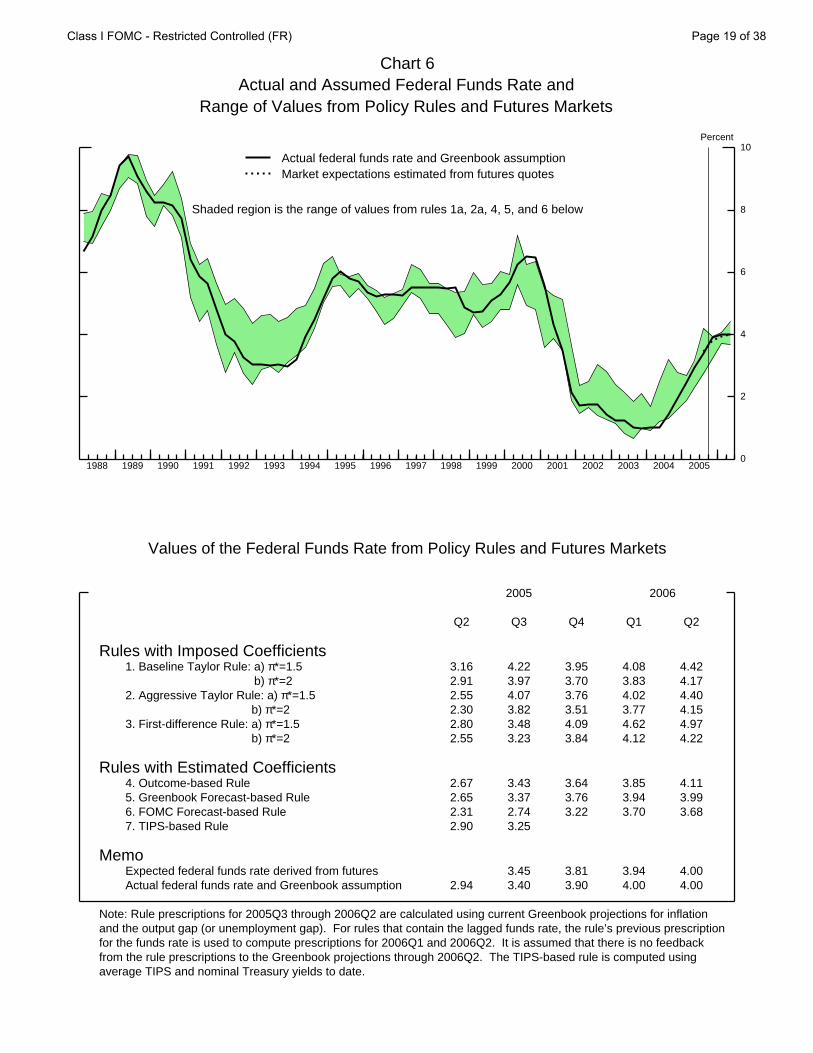
Chart 6Actual and Assumed Federal Funds Rate and
Range of Values from Policy Rules and Futures Markets
1988 1989 1990 1991 1992 1993 1994 1995 1996 1997 1998 1999 2000 2001 2002 2003 2004 20050
2
4
6
8
10
0
2
4
6
8
10Percent
Shaded region is the range of values from rules 1a, 2a, 4, 5, and 6 below
Actual federal funds rate and Greenbook assumptionMarket expectations estimated from futures quotes
Values of the Federal Funds Rate from Policy Rules and Futures Markets
2005 2006
Q2 Q3 Q4 Q1 Q2
Rules with Imposed Coefficients 1. Baseline Taylor Rule: a) π*=1.5 3.16 4.22 3.95 4.08 4.42 1. Baseline Taylor Rule: b) π*=2 2.91 3.97 3.70 3.83 4.17 2. Aggressive Taylor Rule: a) π*=1.5 2.55 4.07 3.76 4.02 4.40 3. First-difference Rule: b) π*=2 2.30 3.82 3.51 3.77 4.15 3. First-difference Rule: a) π*=1.5 2.80 3.48 4.09 4.62 4.97 3. First-difference Rule: b) π*=2 2.55 3.23 3.84 4.12 4.22
Rules with Estimated Coefficients 4. Outcome-based Rule 2.67 3.43 3.64 3.85 4.11 5. Greenbook Forecast-based Rule 2.65 3.37 3.76 3.94 3.99 6. FOMC Forecast-based Rule 2.31 2.74 3.22 3.70 3.68 7. TIPS-based Rule 2.90 3.25
Memo Expected federal funds rate derived from futures 3.45 3.81 3.94 4.00 Actual federal funds rate and Greenbook assumption 2.94 3.40 3.90 4.00 4.00
Note: Rule prescriptions for 2005Q3 through 2006Q2 are calculated using current Greenbook projections for inflationand the output gap (or unemployment gap). For rules that contain the lagged funds rate, the rule’s previous prescriptionfor the funds rate is used to compute prescriptions for 2006Q1 and 2006Q2. It is assumed that there is no feedbackfrom the rule prescriptions to the Greenbook projections through 2006Q2. The TIPS-based rule is computed usingaverage TIPS and nominal Treasury yields to date.
Class I FOMC - Restricted Controlled (FR) Page 19 of 38
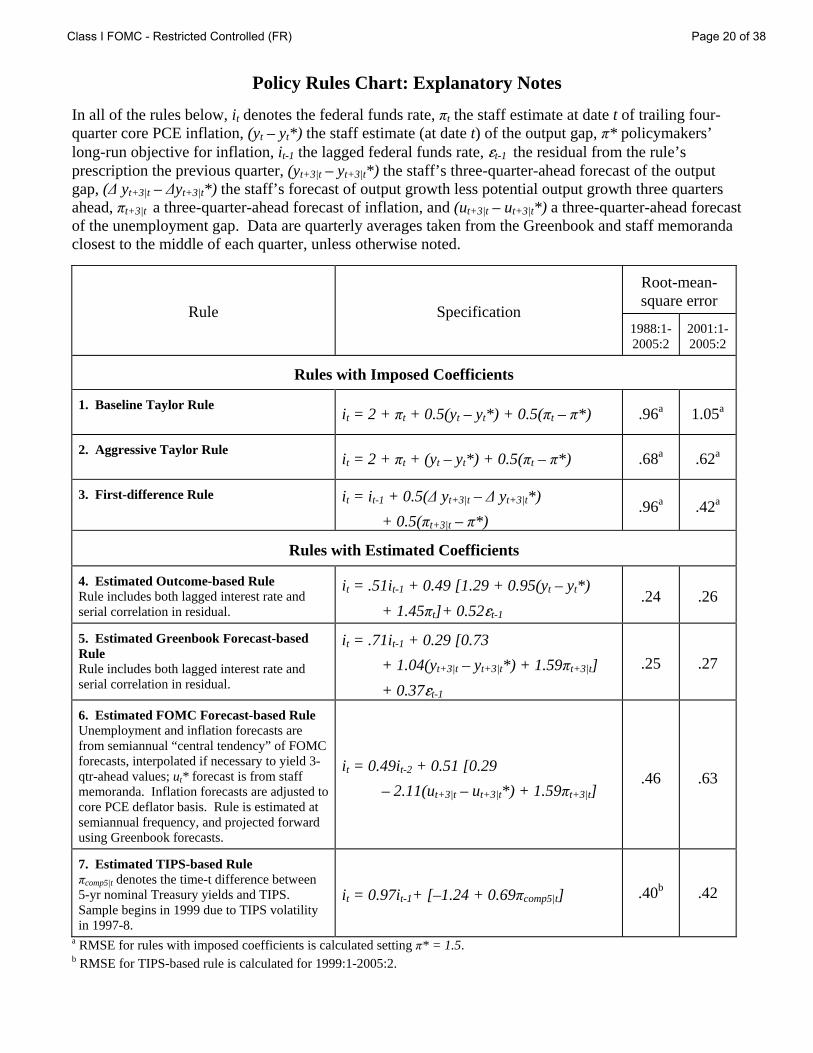
Policy Rules Chart: Explanatory Notes In all of the rules below, it denotes the federal funds rate, πt the staff estimate at date t of trailing four-quarter core PCE inflation, (yt – yt*) the staff estimate (at date t) of the output gap, π* policymakers’ long-run objective for inflation, it-1 the lagged federal funds rate, gt-1 the residual from the rule’s prescription the previous quarter, (yt+3|t – yt+3|t*) the staff’s three-quarter-ahead forecast of the output gap, (Δ yt+3|t – Δyt+3|t*) the staff’s forecast of output growth less potential output growth three quarters ahead, πt+3|t a three-quarter-ahead forecast of inflation, and (ut+3|t – ut+3|t*) a three-quarter-ahead forecast of the unemployment gap. Data are quarterly averages taken from the Greenbook and staff memoranda closest to the middle of each quarter, unless otherwise noted.
Root-mean-square error
Rule Specification 1988:1-2005:2
2001:1-2005:2
Rules with Imposed Coefficients
1. Baseline Taylor Rule it = 2 + πt + 0.5(yt – yt*) + 0.5(πt – π*) .96a 1.05a
2. Aggressive Taylor Rule
it = 2 + πt + (yt – yt*) + 0.5(πt – π*) .68a .62a
3. First-difference Rule
it = it-1 + 0.5(Δ yt+3|t – Δ yt+3|t*) + 0.5(πt+3|t – π*)
.96a .42a
Rules with Estimated Coefficients
4. Estimated Outcome-based Rule Rule includes both lagged interest rate and serial correlation in residual.
it = .51it-1 + 0.49 [1.29 + 0.95(yt – yt*) + 1.45πt]+ 0.52gt-1
.24 .26
5. Estimated Greenbook Forecast-based Rule Rule includes both lagged interest rate and serial correlation in residual.
it = .71it-1 + 0.29 [0.73 + 1.04(yt+3|t – yt+3|t*) + 1.59πt+3|t] + 0.37gt-1
.25 .27
6. Estimated FOMC Forecast-based Rule Unemployment and inflation forecasts are from semiannual “central tendency” of FOMC forecasts, interpolated if necessary to yield 3-qtr-ahead values; ut* forecast is from staff memoranda. Inflation forecasts are adjusted to core PCE deflator basis. Rule is estimated at semiannual frequency, and projected forward using Greenbook forecasts.
it = 0.49it-2 + 0.51 [0.29 – 2.11(ut+3|t – ut+3|t*) + 1.59πt+3|t]
.46 .63
7. Estimated TIPS-based Rule πcomp5|t denotes the time-t difference between 5-yr nominal Treasury yields and TIPS. Sample begins in 1999 due to TIPS volatility in 1997-8.
it = 0.97it-1+ [–1.24 + 0.69πcomp5|t] .40b .42
a RMSE for rules with imposed coefficients is calculated setting π* = 1.5. b RMSE for TIPS-based rule is calculated for 1999:1-2005:2.
Class I FOMC - Restricted Controlled (FR) Page 20 of 38

bit, and the retention of the “measured pace” language would suggest that further
policy tightening was likely, probably bringing the funds rate beyond the 4 percent
apex currently anticipated in markets. Consequently, other market interest rates
would likely increase somewhat in response to the announcement. The foreign
exchange value of the dollar could strengthen a touch, and equity prices could decline
a bit, although the suggestion that the FOMC was confident that the economic
expansion would not be severely affected by the hurricane could serve to limit the
decline in stock prices.
(13) At the August meeting, several participants noted that core PCE inflation
was running at the upper end of the range they considered to be consistent with price
stability. Since then, the staff has marked up its forecast of core inflation for next year
about ¼ percentage point, to 2¼ percent. Moreover, the edging lower of inflation
thereafter in the projection owes importantly to the assumed gradual decline in energy
prices. If the Committee saw this inflation outcome as unacceptable or believed that
such an expectation was likely to prove optimistic, then it might view the words of
Alternative B as too timid about the prospects for additional policy tightening. Such a
concern might well be intensified if significant odds were put on the possibility that
inflation expectations could become unanchored in response to surging energy prices,
perhaps in the manner discussed in the alternative simulation in the Greenbook. The
likelihood of more tightening than currently built into financial market prices could be
conveyed to the public by shortening the wording for Alternative B that appears in
Table 1. In particular, the Committee could give less weight to the disruptions from
Hurricane Katrina by striking the second and third sentences and dropping the word
“remaining” in row 3.8
(14) The Committee, in contrast, could arrive at a decision to keep the federal
funds rate unchanged for several reasons. One possibility is that, while generally
8 Minor corresponding changes to the fourth sentence of row 3 would also be required.
Class I FOMC - Restricted Controlled (FR) Page 21 of 38

accepting the economic outlook discussed under Alternative B, members may harbor
the reservation that there is a small probability that the disruption to economic activity
in the Gulf region and sapping of consumer and business confidence nationwide
could have serious consequences for the broader economy. While the mean (or
modal) outlook might be taken as a reason to tighten, consideration of that adverse
tail may counsel delaying further firming for a time. Under Alternative A, the
Committee would keep the target federal funds rate unchanged at 3½ percent at this
meeting and use the statement to explain that it was merely deferring firming in light
of the elevated uncertainties, and likely not ending the tightening cycle. As in
Alternative B, the Committee could note the adverse near-term effects of the
hurricane on spending, production, and employment, but not include the sentence
suggesting that the effects will be temporary. The text on inflation in Alternative B
could also be used in Alternative A.
(15) Short-term market interest rates would likely decline noticeably following
announcement of this alternative. However, with the statement suggesting that
further tightening was still in the cards, the drop in intermediate- and longer-term
rates probably would be considerably smaller. Equity prices could move slightly
higher, while the value of the dollar on foreign exchange markets could decline a bit.
(16) Another possible reason for holding the funds rate unchanged is that a
longer pause in policy firming could be appropriate. Committee members may be
concerned that the widespread and severe damage to private property and
infrastructure in the Gulf region, the extended displacement of a large population, the
sharp increase in consumer energy prices, and a potential significant drop in consumer
confidence could well exert a more substantial drag on aggregate economic activity
than in the staff forecast. Such a possibility is illustrated in the Greenbook’s
“sentiment slump” scenario and the scenario based on a pessimistic view of the
effects of Katrina. Moreover, while the stance of policy may still be accommodative,
Class I FOMC - Restricted Controlled (FR) Page 22 of 38
the extent of that accommodation has been reduced significantly by the Committee’s
actions through August. Thus, the Committee may feel comfortable awaiting further
Opening Up the Statement
The “measured pace” language, which has been included in the Committee’s statements for the past eleven meetings, has served to signal to market participants that the federal funds rate will be marched up steadily as long as policy accommodation remains in place. The Committee may believe that this language has now outlived its usefulness for several reasons, independent of this meeting’s outcome on the stance of policy. First, the 2½-percentage-point increase in the nominal federal funds rate since mid-2004 has placed the real federal funds rate near some model-based estimates of its equilibrium (as shown in Chart 5). By that arithmetic, some members might be of the view that policy accommodation has been substantially removed and that the Committee should halt the process of firming sometime soon. Second, the devastation in the Gulf region probably implies that more uncertainty attends the outlook, and this uncertainty is unlikely to be resolved soon, perhaps increasing the attractiveness of being more gradual in removing policy accommodation. Third, the possibilities that elevated energy prices, on the one hand, could sap consumer confidence or, on the other, unanchor inflation expectations may require more nimble adjustments to the stance of policy than consistent with the “measured pace” language.
In prior discussions of statement language, some have expressed a
preference for providing signals about the future direction of policy only in unusual situations, if at all. In that view, guidance about interest rates, which seemed useful when significant disinflation was a risk and at the outset of policy tightening, is no longer useful when the Committee is unsure about its actions at the next few meetings. The simple expedient, then, would be to drop rows 5 and 6 and any mention of the extent of policy accommodation in Table 1.
Others have argued, however, that providing information about the future
direction of the federal funds rate helps the public make better-informed decisions, enhancing the effectiveness of monetary policy. Moreover, simply stating that the Committee was not certain whether the next move in rates would be up or down would, on this view, be useful information to market participants.
(continued on next page)
Class I FOMC - Restricted Controlled (FR) Page 23 of 38

information on the effects of Hurricane Katrina, as well as of the cumulative
tightening of policy to date, before resuming policy firming—even if that wait could
be extended. Such a view could be conveyed to the public by striking sentence 2 from
the draft statement for Alternative A. The statement could also drop the word
“action” that now appears in row 5 in order to suggest that appropriate monetary
Opening Up the Statement (cont.)
One way of regaining flexibility about the range of future action while still providing such information would be to eliminate the “measured pace” language from the statement and move from the current practice of basing the risk assessment on appropriate policy to assuming explicitly that the current stance of policy will be kept unchanged for several quarters. Under such an assumption, the assessments of the probabilities of lower or higher economic growth than is sustainable and of lower or higher inflation, along with an overall risk assessment if needed, can provide guidance about the future direction of policy. Rows 5 and 6 of Table 1 in both columns A and B could be replaced with the following formula:
The Committee’s economic outlook is such that, if the federal funds rate were maintained at its current level for the next several quarters, output growth is [less/as/more] likely to be above [as/than] below its sustainable pace. Inflation over the same period is [less/as/more] likely to increase [as to/than] decrease. As a result, the Committee views the near-term risks to its dual objectives as [tilted to the downside/balanced/tilted to the upside]. In any event, the Committee is prepared to take the steps necessary to maintain price stability and sustainable economic growth.
If the Committee desires to convey the sense that the current stance of policy is unsustainably easy, it could set both toggle switches to their “more” setting. That is, it would tell the public that, if maintained for the next few quarters, a nominal funds rate of 3½ percent (under A) or 3¾ percent (under B) would likely foster a pickup in resource utilization and inflation. As both measurements would point in the same direction, the overall risk balance sentence could be omitted in this case with no harm to clarity.
Class I FOMC - Restricted Controlled (FR) Page 24 of 38

policy going forward would not necessarily involve near-term tightening, and refer to
“remaining” policy accommodation in the first sentence in row 6.
Money and Debt Forecasts
(17) Under the Greenbook forecast, M2 growth is projected to average about
3 percent over the third and fourth quarters of 2005, leaving growth for the year as a
whole just under 3 percent (Table 2). Velocity is forecast to increase 3¼ percent this
year. Over 2006 and 2007, the expansion of M2 is forecast to pick up to 4¼ percent
and 5 percent, respectively, with the velocity of M2 flattening out as the effects on
opportunity costs of past policy firmings fade. Domestic nonfinancial sector debt is
forecast to decelerate over the forecast period. The expansion of household sector
debt is projected to slow in the fourth quarter of 2005 to 8 percent and to continue to
decline over subsequent quarters, reaching about a 6 percent rate by the end of 2007,
as a moderation in home price appreciation prompts a significant deceleration of
home mortgage debt. The expansion of business sector debt is also projected to slow,
but more gradually. Federal debt growth, by contrast, remains brisk over the forecast
period, with growth rates of 7¾ percent, 8½ percent, and 8 percent, respectively, for
the years 2005 though 2007.
Class I FOMC - Restricted Controlled (FR) Page 25 of 38

No Change1 Raise 25 bp2 Greenbook3
Monthly Growth RatesJan-05 3.4 3.4 3.4Feb-05 2.8 2.8 2.8Mar-05 3.7 3.7 3.7Apr-05 -0.6 -0.6 -0.6
May-05 0.2 0.2 0.2Jun-05 6.1 6.1 6.1Jul-05 1.4 1.4 1.4
Aug-05 5.0 5.0 5.0Sep-05 3.3 3.1 3.1Oct-05 2.2 1.6 1.6Nov-05 3.1 2.3 2.0Dec-05 4.4 3.7 3.0Jan-06 4.0 3.4 2.6Feb-06 4.3 3.9 3.1Mar-06 5.5 5.1 4.6
Quarterly Growth Rates2005 Q1 4.0 4.0 4.02005 Q2 1.7 1.7 1.72005 Q3 3.3 3.3 3.32005 Q4 3.2 2.7 2.62006 Q1 4.2 3.6 3.0
Annual Growth Rates2004 5.2 5.2 5.22005 3.1 3.0 2.92006 4.9 4.6 4.32007 5.0 5.0 5.0
Growth From To2004 Q4 Aug-05 3.1 3.1 3.12004 Q4 Sep-05 3.1 3.1 3.1
Dec-04 Aug-05 2.8 2.8 2.8Aug-05 Mar-06 3.9 3.3 2.9
1 No change in target federal funds rate.2 Increase of 25 basis points in the target federal funds rate at this meeting and no change thereafter.3 This forecast is consistent with nominal GDP and interest rates in the Greenbook forecast.
Alternative Growth Rates for M2(percent, annual rate)
Table 2
Class I FOMC - Restricted Controlled (FR) Page 26 of 38
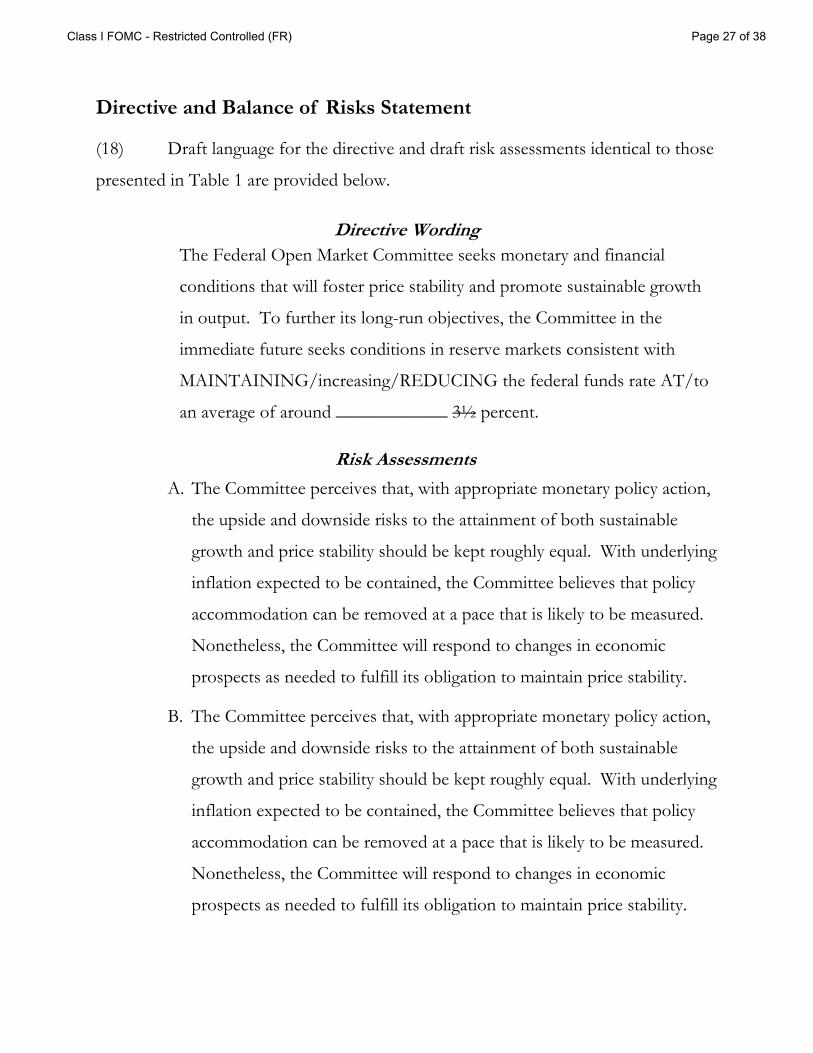
Directive and Balance of Risks Statement
(18) Draft language for the directive and draft risk assessments identical to those
presented in Table 1 are provided below.
Directive Wording The Federal Open Market Committee seeks monetary and financial
conditions that will foster price stability and promote sustainable growth
in output. To further its long-run objectives, the Committee in the
immediate future seeks conditions in reserve markets consistent with
MAINTAINING/increasing/REDUCING the federal funds rate AT/to
an average of around ____________ 3½ percent.
Risk Assessments
A. The Committee perceives that, with appropriate monetary policy action,
the upside and downside risks to the attainment of both sustainable
growth and price stability should be kept roughly equal. With underlying
inflation expected to be contained, the Committee believes that policy
accommodation can be removed at a pace that is likely to be measured.
Nonetheless, the Committee will respond to changes in economic
prospects as needed to fulfill its obligation to maintain price stability.
B. The Committee perceives that, with appropriate monetary policy action,
the upside and downside risks to the attainment of both sustainable
growth and price stability should be kept roughly equal. With underlying
inflation expected to be contained, the Committee believes that policy
accommodation can be removed at a pace that is likely to be measured.
Nonetheless, the Committee will respond to changes in economic
prospects as needed to fulfill its obligation to maintain price stability.
Class I FOMC - Restricted Controlled (FR) Page 27 of 38
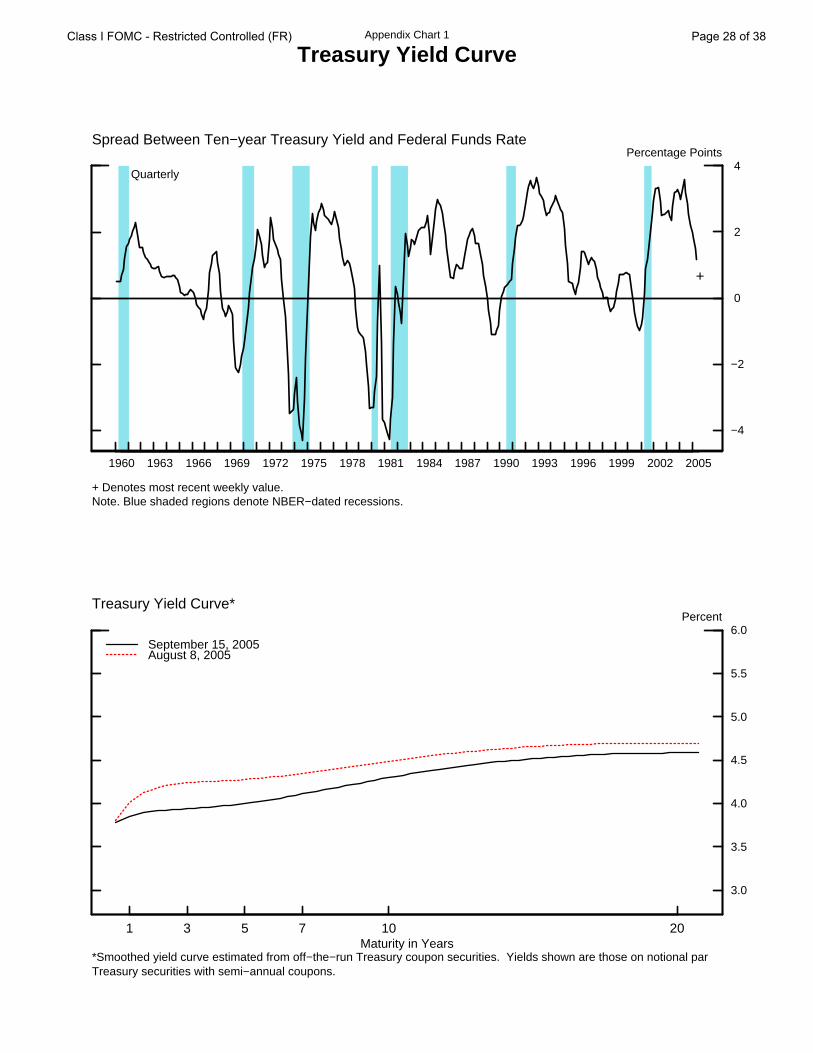
Appendix Chart 1
Treasury Yield Curve
1960 1963 1966 1969 1972 1975 1978 1981 1984 1987 1990 1993 1996 1999 2002 2005
−4
−2
0
2
4Percentage Points
+ Denotes most recent weekly value.Note. Blue shaded regions denote NBER−dated recessions.
+
Spread Between Ten−year Treasury Yield and Federal Funds Rate
Quarterly
1 3 5 7 10 20
3.0
3.5
4.0
4.5
5.0
5.5
6.0Percent
September 15, 2005 August 8, 2005
Treasury Yield Curve*
Maturity in Years*Smoothed yield curve estimated from off−the−run Treasury coupon securities. Yields shown are those on notional par Treasury securities with semi−annual coupons.
Class I FOMC - Restricted Controlled (FR) Page 28 of 38
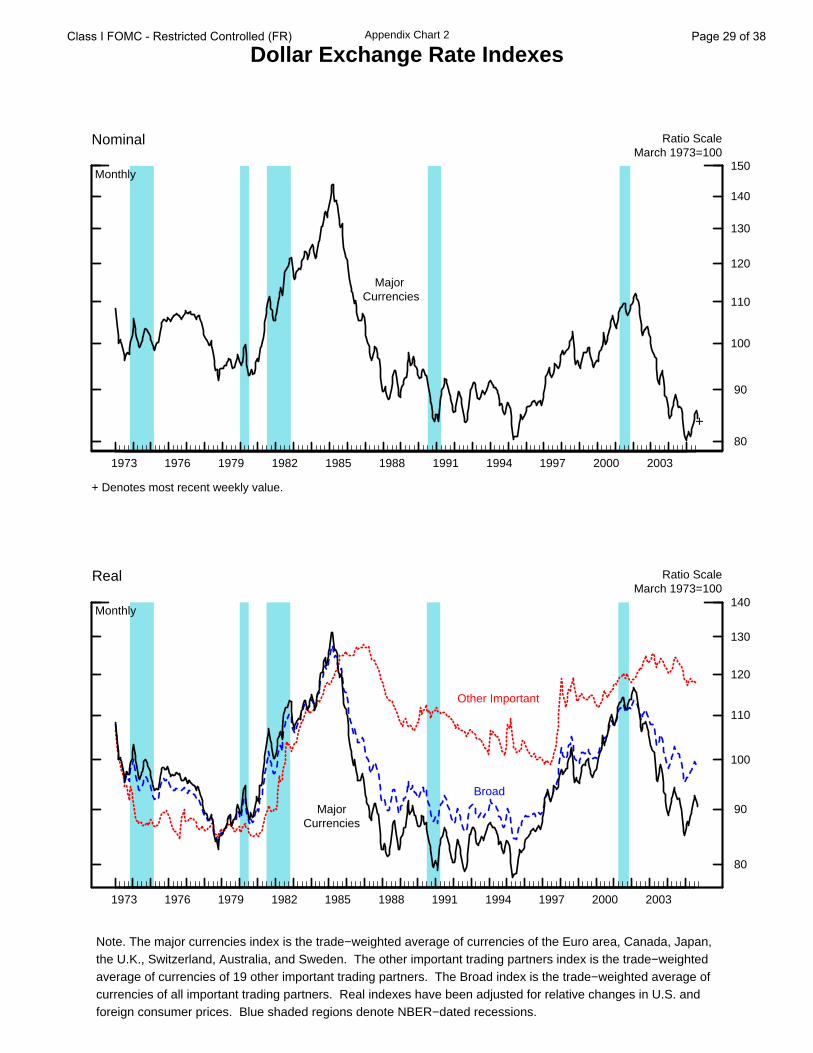
Appendix Chart 2
Dollar Exchange Rate Indexes
1973 1976 1979 1982 1985 1988 1991 1994 1997 2000 2003
80
90
100
110
120
130
140
150
Ratio ScaleMarch 1973=100
+ Denotes most recent weekly value.
+
Nominal
Major Currencies
Monthly
1973 1976 1979 1982 1985 1988 1991 1994 1997 2000 2003
80
90
100
110
120
130
140
Ratio ScaleMarch 1973=100
Real
MajorCurrencies
Broad
Other Important
Monthly
Note. The major currencies index is the trade−weighted average of currencies of the Euro area, Canada, Japan, the U.K., Switzerland, Australia, and Sweden. The other important trading partners index is the trade−weighted average of currencies of 19 other important trading partners. The Broad index is the trade−weighted average of currencies of all important trading partners. Real indexes have been adjusted for relative changes in U.S. and foreign consumer prices. Blue shaded regions denote NBER−dated recessions.
Class I FOMC - Restricted Controlled (FR) Page 29 of 38
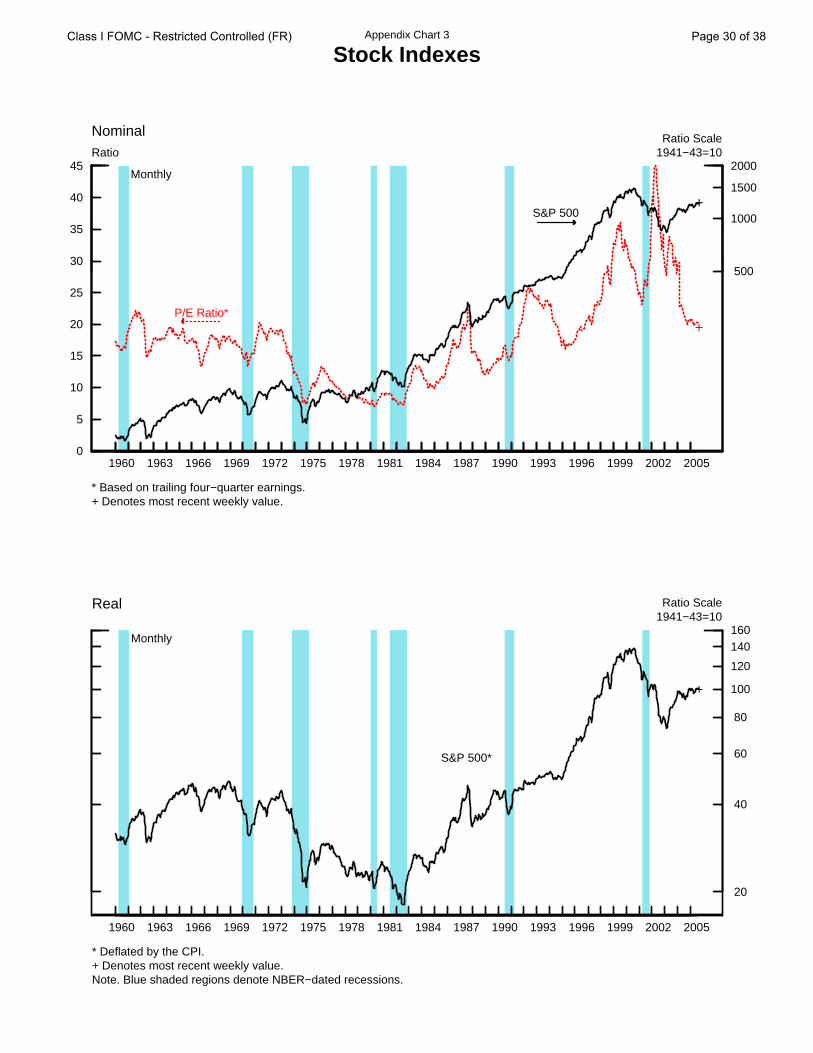
Appendix Chart 3
Stock Indexes
0
5
10
15
20
25
30
35
40
45Ratio
+
1960 1963 1966 1969 1972 1975 1978 1981 1984 1987 1990 1993 1996 1999 2002 2005
500
1000
1500
2000
Ratio Scale1941−43=10
* Based on trailing four−quarter earnings.+ Denotes most recent weekly value.
+
Nominal
Monthly
P/E Ratio*
S&P 500
1960 1963 1966 1969 1972 1975 1978 1981 1984 1987 1990 1993 1996 1999 2002 2005
20
40
60
80
100
120
140160
Ratio Scale1941−43=10
* Deflated by the CPI.+ Denotes most recent weekly value.Note. Blue shaded regions denote NBER−dated recessions.
+
Real
Monthly
S&P 500*
Class I FOMC - Restricted Controlled (FR) Page 30 of 38
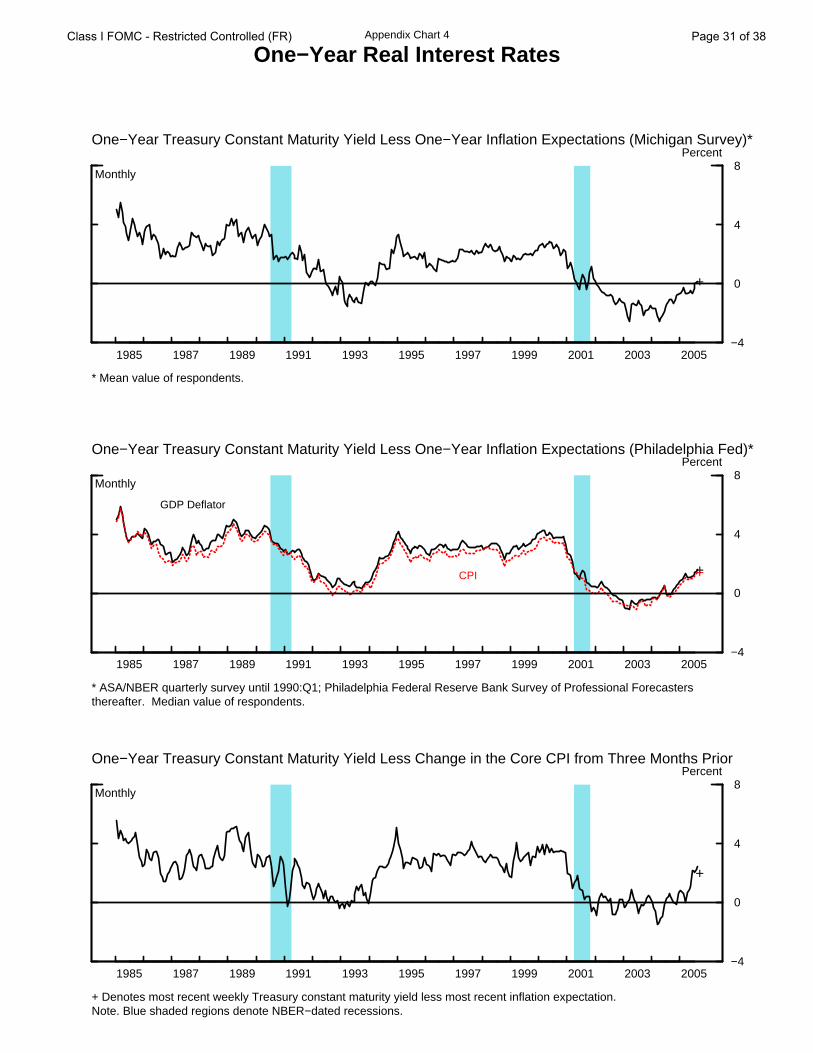
Appendix Chart 4
One−Year Real Interest Rates
1985 1987 1989 1991 1993 1995 1997 1999 2001 2003 2005−4
0
4
8Percent
* Mean value of respondents.
+
Monthly
One−Year Treasury Constant Maturity Yield Less One−Year Inflation Expectations (Michigan Survey)*
1985 1987 1989 1991 1993 1995 1997 1999 2001 2003 2005−4
0
4
8Percent
* ASA/NBER quarterly survey until 1990:Q1; Philadelphia Federal Reserve Bank Survey of Professional Forecastersthereafter. Median value of respondents.
++
GDP Deflator
CPI
Monthly
One−Year Treasury Constant Maturity Yield Less One−Year Inflation Expectations (Philadelphia Fed)*
1985 1987 1989 1991 1993 1995 1997 1999 2001 2003 2005−4
0
4
8Percent
+ Denotes most recent weekly Treasury constant maturity yield less most recent inflation expectation.Note. Blue shaded regions denote NBER−dated recessions.
+
Monthly
One−Year Treasury Constant Maturity Yield Less Change in the Core CPI from Three Months Prior
Class I FOMC - Restricted Controlled (FR) Page 31 of 38

Appendix Chart 5
Long−Term Real Interest Rates*
1985 1987 1989 1991 1993 1995 1997 1999 2001 2003 2005 0
2
4
6
8
10Percent
+
+
+
Monthly
Real Ten−Year Treasury Yields
Real rate usingPhiladelphia Fed Survey
Real rate usingMichigan Survey
Ten−year TIPS yield
1985 1987 1989 1991 1993 1995 1997 1999 2001 2003 2005
2
4
6
8
10
12
14Percent
+
++
Nominal and Real Corporate Bond Rates
Monthly
Nominal rate on Moody’sA−rated corporate bonds
Real rate usingPhiladelphia Fed Survey
Real rate usingMichigan Survey
* For real rates, measures using the Philadelphia Fed Survey employ the ten−year inflation expectations from the Blue Chip Survey until April 1991 and the Philadelphia Federal Reserve Bank Survey of Professional Forecasters thereafter (median value of respondents). Measures using the Michigan Survey employ the five− to ten−year inflation expectations from that survey (mean value of respondents).
+ For TIPS and nominal corporate rate, denotes the most recent weekly value. For other real rate series, denotes the most recent weekly nominal yield less the most recent inflation expectation. Note. Blue shaded regions denote NBER−dated recessions.
Class I FOMC - Restricted Controlled (FR) Page 32 of 38

Appendix Chart 6
Commodity Price Measures
1985 1987 1989 1991 1993 1995 1997 1999 2001 2003 2005
70
80
90
100
110
120
130140
Ratio scale, index (1980=100)Journal of Commerce Index
Weekly
Total
Metals
1985 1987 1989 1991 1993 1995 1997 1999 2001 2003 2005
220
240
260
280
300
320
340360380
Ratio scale, index (1967=100)CRB Spot Industrials
Weekly
1985 1987 1989 1991 1993 1995 1997 1999 2001 2003 2005180
200
220
240
260
280
300
320
340Ratio scale, index (1967=100)
Note. Blue shaded regions denote NBER−dated recessions.
CRB Futures
Weekly
Class I FOMC - Restricted Controlled (FR) Page 33 of 38
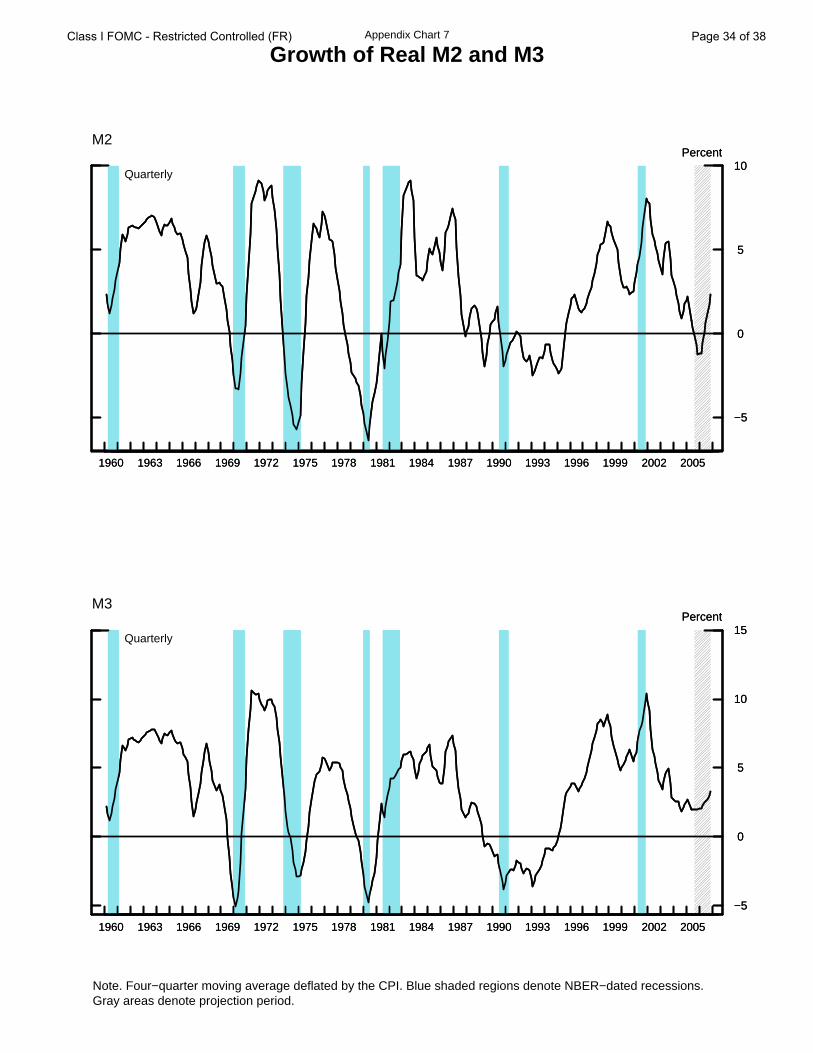
Appendix Chart 7
Growth of Real M2 and M3
1960 1963 1966 1969 1972 1975 1978 1981 1984 1987 1990 1993 1996 1999 2002 2005
−5
0
5
10Percent
1960 1963 1966 1969 1972 1975 1978 1981 1984 1987 1990 1993 1996 1999 2002 2005
−5
0
5
10Percent
M2
Quarterly
1960 1963 1966 1969 1972 1975 1978 1981 1984 1987 1990 1993 1996 1999 2002 2005
−5
0
5
10
15Percent
1960 1963 1966 1969 1972 1975 1978 1981 1984 1987 1990 1993 1996 1999 2002 2005
−5
0
5
10
15Percent
M3
Quarterly
Note. Four−quarter moving average deflated by the CPI. Blue shaded regions denote NBER−dated recessions. Gray areas denote projection period.
Class I FOMC - Restricted Controlled (FR) Page 34 of 38

Appendix Chart 8
Inflation Indicator Based on M2
Note: P* is defined to equal M2 times V* divided by potential GDP. V*, or long-run velocity, is estimatedusing average velocity over the 1959:Q1-to-1989:Q4 period and then, after a break, over the interval from1993:Q1 to the present. For the forecast period, P* is based on the staff M2 forecast and P is simulated using ashort-run dynamic model relating P to P*. Blue areas indicate periods in which P* is notably less than P.Gray areas denote the projection period.
1965 1968 1971 1974 1977 1980 1983 1986 1989 1992 1995 1998 2001 2004
40
60
80
100
120
140Ratio ScalePrice Level
Quarterly
Implicit GDPprice deflator (P) Long-run equilibrium
price level (P*)
1965 1968 1971 1974 1977 1980 1983 1986 1989 1992 1995 1998 2001 2004
40
60
80
100
120
140Ratio Scale
1965 1968 1971 1974 1977 1980 1983 1986 1989 1992 1995 1998 2001 2004
2
4
6
8
10
12PercentInflation 1
Quarterly
1965 1968 1971 1974 1977 1980 1983 1986 1989 1992 1995 1998 2001 2004
2
4
6
8
10
12Percent
1. Change in the implicit GDP price deflator over the previous four quarters.
Class I FOMC - Restricted Controlled (FR) Page 35 of 38
Short-term Long-term
Federalfunds
Treasury billssecondary market
CDssecondary
market
Comm.paper Off-the-run Treasury yields Indexed yields Moody’s
Baa
MunicipalBondBuyer
Conventional homemortgages
primary market
4-week 3-month 6-month 3-month 1-month 2-year 5-year 10-year 20-year 5-year 10-year Fixed-rate ARM
1 2 3 4 5 6 7 8 9 10 11 12 13 14 15 16
2.34 2.08 2.28 2.63 2.51 2.29 3.13 4.10 5.03 5.64 1.57 2.28 6.90 5.45 6.34 4.270.92 0.73 0.87 0.96 1.04 0.97 1.49 2.65 3.84 4.68 0.40 1.38 6.00 4.73 5.38 3.36
3.68 3.41 3.55 3.83 3.84 3.62 4.19 4.32 4.73 5.04 1.85 2.02 6.22 5.04 6.04 4.582.19 1.86 2.31 2.63 2.50 2.24 3.11 3.58 3.97 4.28 0.98 1.50 5.64 4.72 5.53 4.10
1.61 1.54 1.68 1.91 1.86 1.67 2.51 3.35 4.26 4.96 1.12 1.82 6.27 5.04 5.75 3.991.76 1.62 1.79 2.05 2.04 1.79 2.57 3.35 4.24 4.92 1.00 1.76 6.21 4.99 5.72 4.021.93 1.91 2.11 2.33 2.26 2.01 2.86 3.52 4.32 4.95 0.93 1.68 6.20 5.06 5.73 4.152.16 1.95 2.23 2.50 2.45 2.22 3.02 3.59 4.34 4.94 0.97 1.65 6.15 5.03 5.75 4.18
2.28 2.02 2.38 2.68 2.61 2.33 3.23 3.70 4.32 4.82 1.15 1.72 6.02 4.92 5.71 4.122.50 2.36 2.59 2.85 2.77 2.49 3.39 3.76 4.25 4.65 1.10 1.63 5.82 4.87 5.63 4.162.63 2.64 2.80 3.09 2.97 2.67 3.74 4.15 4.59 4.92 1.27 1.77 6.06 5.01 5.93 4.232.79 2.63 2.84 3.14 3.09 2.84 3.67 3.99 4.42 4.78 1.21 1.69 6.05 4.93 5.86 4.253.00 2.62 2.90 3.17 3.22 2.97 3.65 3.84 4.22 4.59 1.25 1.65 6.01 4.83 5.72 4.233.04 2.82 3.03 3.22 3.38 3.11 3.65 3.76 4.07 4.38 1.37 1.67 5.86 4.77 5.58 4.243.26 3.09 3.29 3.53 3.57 3.27 3.90 3.98 4.25 4.50 1.64 1.88 5.95 4.85 5.70 4.403.50 3.33 3.52 3.78 3.77 3.47 4.06 4.12 4.34 4.56 1.69 1.89 5.96 4.90 5.82 4.55
3.26 3.01 3.22 3.47 3.55 3.25 3.87 3.95 4.23 4.48 1.62 1.89 5.95 4.84 5.66 4.393.25 3.10 3.32 3.57 3.59 3.28 3.93 4.02 4.29 4.54 1.72 1.94 5.99 4.87 5.73 4.423.27 3.22 3.42 3.67 3.63 3.33 4.00 4.08 4.31 4.55 1.73 1.92 5.95 4.86 5.77 4.463.34 3.32 3.49 3.73 3.70 3.40 4.09 4.16 4.40 4.63 1.76 1.97 6.02 4.90 5.82 4.473.50 3.34 3.52 3.79 3.74 3.45 4.13 4.21 4.43 4.64 1.80 1.99 6.04 4.93 5.89 4.573.54 3.29 3.53 3.80 3.77 3.47 4.06 4.10 4.32 4.53 1.70 1.88 5.96 4.88 5.80 4.583.52 3.33 3.54 3.81 3.81 3.52 4.04 4.06 4.28 4.50 1.63 1.82 5.91 4.87 5.77 4.563.55 3.39 3.51 3.72 3.81 3.54 3.89 3.93 4.16 4.40 1.42 1.68 5.84 4.83 5.71 4.483.50 3.33 3.50 3.72 3.77 3.55 3.87 3.92 4.20 4.48 1.38 1.68 5.96 4.87 5.71 4.45 -- 3.27 3.47 3.77 3.83 3.58 3.91 3.97 4.26 4.54 1.36 1.69 -- -- 5.74 4.46
3.52 3.40 3.54 3.79 3.84 3.54 4.00 4.03 4.23 4.46 1.49 1.71 5.83 -- -- --3.63 3.41 3.52 3.74 3.83 3.56 3.84 3.86 4.09 4.34 1.41 1.67 5.79 -- -- --3.57 3.34 3.48 3.62 3.82 3.55 3.79 3.84 4.10 4.36 1.30 1.61 5.83 -- -- --3.49 3.37 3.45 3.63 3.72 3.52 3.76 3.84 4.11 4.38 1.31 1.61 5.87 -- -- --3.49 -- -- -- -- -- -- -- -- -- -- -- -- -- -- --3.57 3.37 3.53 3.70 3.74 3.52 3.82 3.89 4.16 4.44 1.39 1.67 5.92 -- -- --3.48 3.35 3.49 3.73 3.75 3.53 3.87 3.94 4.22 4.51 1.43 1.71 5.98 -- -- --3.49 3.30 3.48 3.73 3.78 3.56 3.89 3.94 4.22 4.50 1.39 1.70 5.98 -- -- --3.49 3.31 3.49 3.73 3.81 3.60 3.90 3.93 4.20 4.48 1.33 1.67 5.96 -- -- --3.50 3.31 3.52 3.79 3.82 3.59 3.93 3.98 4.26 4.53 1.37 1.70 6.00 -- -- --3.45 3.30 3.48 3.77 3.84 3.54 3.89 3.94 4.22 4.50 1.35 1.68 5.97 -- -- --3.54 3.25 3.43 3.76 3.83 3.62 3.91 3.97 4.25 4.53 1.37 1.69 6.00 -- -- --3.68 3.22 3.45 3.77 3.84 -- 3.92 4.00 4.30 4.59 1.39 1.72 -- -- -- --
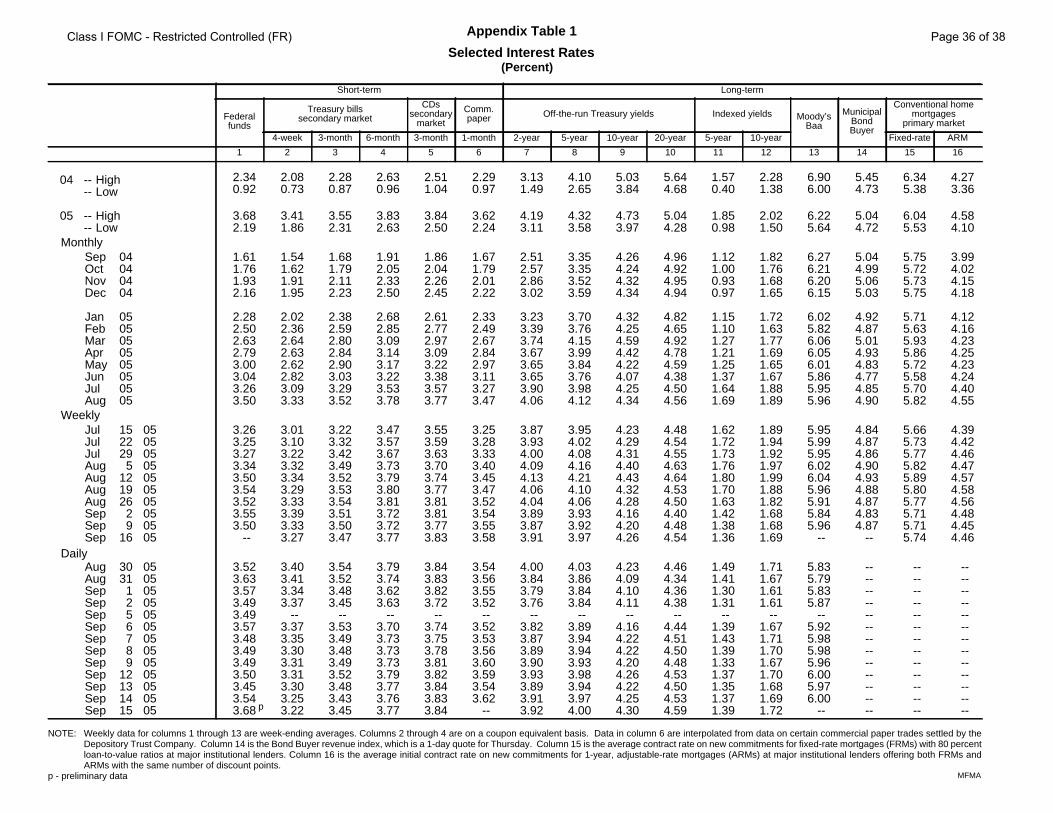
Appendix Table 1
Selected Interest Rates(Percent)
NOTE: Weekly data for columns 1 through 13 are week-ending averages. Columns 2 through 4 are on a coupon equivalent basis. Data in column 6 are interpolated from data on certain commercial paper trades settled by theDepository Trust Company. Column 14 is the Bond Buyer revenue index, which is a 1-day quote for Thursday. Column 15 is the average contract rate on new commitments for fixed-rate mortgages (FRMs) with 80 percentloan-to-value ratios at major institutional lenders. Column 16 is the average initial contract rate on new commitments for 1-year, adjustable-rate mortgages (ARMs) at major institutional lenders offering both FRMs andARMs with the same number of discount points.
p - preliminary data
Sep Oct Nov Dec Jan Feb Mar Apr May Jun Jul Aug
Jul Jul Jul Aug Aug Aug Aug Sep Sep Sep
Aug Aug Sep Sep Sep Sep Sep Sep Sep Sep Sep Sep Sep
04040404
0505050505050505
152229
5121926
29
16
3031
1256789
12131415
05050505050505050505
05050505050505050505050505
04 -- High-- Low
05 -- High-- Low
Monthly
Weekly
Daily
p
MFMA
Class I FOMC - Restricted Controlled (FR) Page 36 of 38

Appendix Table 2Money Aggregates
Seasonally Adjusted
nontransactions components
in M2 in M3 onlyM1 M2 M3
1 2 3 4 5
Period
Annual growth rates (%):
Annually (Q4 to Q4)2002 3.2 6.7 7.7 6.0 6.52003 7.4 5.5 5.0 3.4 4.82004 5.4 5.2 5.2 7.0 5.8
Quarterly (average)2004-Q3 3.3 3.4 3.4 5.9 4.2
Q4 5.7 5.8 5.8 0.4 4.02005-Q1 0.5 4.0 4.9 8.8 5.5
Q2 -0.6 1.7 2.3 14.7 5.9
Monthly2004-Aug. 15.8 4.0 0.8 5.8 4.6
Sep. 3.6 6.6 7.4 6.2 6.5Oct. 1.0 5.3 6.5 -6.7 1.4Nov. 13.8 7.0 5.2 -2.4 4.0Dec. -2.0 4.5 6.3 10.0 6.3
2005-Jan. -8.0 3.4 6.6 13.5 6.7Feb. 6.4 2.8 1.8 8.3 4.6Mar. 6.1 3.7 3.1 3.7 3.8Apr. -15.3 -0.6 3.4 21.4 6.5May 11.0 0.2 -2.6 15.6 5.2June 0.8 6.1 7.5 19.8 10.6July -18.2 1.4 6.7 7.0 3.3Aug. p 13.8 5.0 2.6 26.8 12.2
Levels ($billions):
Monthly2005-Apr. 1361.0 6481.5 5120.5 3139.2 9620.7
May 1373.5 6482.8 5109.3 3179.9 9662.7June 1374.4 6515.5 5141.2 3232.5 9748.0July 1353.5 6523.3 5169.8 3251.4 9774.7Aug. p 1369.1 6550.3 5181.2 3324.0 9874.3
Weekly2005-Aug. 1 1356.2 6543.9 5187.7 3259.3 9803.2
8 1347.3 6533.0 5185.8 3276.9 9810.015 1355.0 6536.2 5181.2 3307.8 9843.922 1381.5 6560.5 5179.0 3343.9 9904.429p 1387.2 6552.5 5165.3 3361.5 9914.0
Sep. 5p 1362.9 6564.1 5201.2 3382.2 9946.4
p preliminar y
Class I FOMC - Restricted Controlled (FR) Page 37 of 38
Appendix Table 3
Changes in System Holdings of Securities1
(Millions of dollars, not seasonally adjusted)
September 15, 2005
Treasury Bills Treasury Coupons Federal Net change Net RPs 5
Agency total
Net Redemptions Net Net Purchases 3 Redemptions Net Redemptions outright Short- Long- NetPurchases 2 (-) Change < 1 1-5 5-10 Over 10 (-) Change (-) holdings 4 Term 6 Term 7 Change
2002 21,421 --- 21,421 12,720 12,748 5,074 2,280 --- 32,822 --- 54,242 -5,366 517 -4,850
2003 18,150 --- 18,150 6,565 7,814 4,107 220 --- 18,706 10 36,846 2,223 1,036 3,259
2004 18,138 --- 18,138 7,994 17,249 5,763 1,364 --- 32,370 --- 50,507 -2,522 -331 -2,853
2004 QII 7,756 --- 7,756 1,693 2,543 988 84 --- 5,307 --- 13,063 1,133 418 1,550
QIII 4,508 --- 4,508 1,898 4,406 1,507 434 --- 8,244 --- 12,753 -1,787 782 -1,005
QIV 4,167 --- 4,167 3,092 7,453 2,018 571 --- 13,134 --- 17,301 -5,956 1,728 -4,227
2005 QI 35 --- 35 --- --- --- --- 544 -544 --- -509 1,653 -3,454 -1,801
QII 2,010 --- 2,010 --- 3,495 1,708 1,015 1,305 4,914 --- 6,923 1,082 1,361 2,443
2005 Jan --- --- --- --- --- --- --- --- --- --- --- 1,100 -3,387 -2,287
Feb 35 --- 35 --- --- --- --- 333 -333 --- -298 2,163 -2,187 -24
Mar --- --- --- --- --- --- --- 211 -211 --- -211 1,746 896 2,642
Apr --- --- --- --- 1,200 470 230 --- 1,900 --- 1,900 385 1,499 1,884
May 1,760 --- 1,760 --- 2,295 898 --- --- 3,193 --- 4,953 -2,453 340 -2,113
Jun 250 --- 250 --- --- 340 785 1,305 -180 --- 70 1,371 -606 764
Jul --- --- --- --- --- --- --- --- --- --- --- 671 2,413 3,084
Aug 2,751 --- 2,751 1,298 1,390 988 --- 757 2,919 --- 5,670 136 -581 -445
2005 Jun 22 --- --- --- --- --- 340 85 --- 425 --- 425 1,845 -3,000 -1,155
Jun 29 --- --- --- --- --- --- --- --- --- --- --- -3,072 3,000 -72
Jul 6 --- --- --- --- --- --- --- 1,305 -1,305 --- -1,305 2,508 3,000 5,508
Jul 13 --- --- --- --- --- --- --- --- --- --- --- -3,828 1,000 -2,828
Jul 20 --- --- --- --- --- --- --- --- --- --- --- 3,535 --- 3,535
Jul 27 --- --- --- --- --- --- --- --- --- --- --- -1,363 -3,000 -4,363
Aug 3 --- --- --- --- --- --- --- --- --- --- --- 8,355 -1,000 7,355
Aug 10 --- --- --- --- --- --- --- --- --- --- --- -7,150 2,000 -5,150
Aug 17 1,244 --- 1,244 --- 1,390 --- --- --- 1,390 --- 2,634 -3,366 2,000 -1,366
Aug 24 1,249 --- 1,249 --- --- 988 --- --- 988 --- 2,237 1,583 -2,000 -417
Aug 31 258 --- 258 1,298 --- --- --- 757 541 --- 799 3,673 -1,000 2,673
Sep 7 14 --- 14 --- --- --- --- --- --- --- 14 -1,709 3,000 1,291
Sep 14 47 --- 47 --- 2,531 130 90 --- 2,751 --- 2,798 -3,235 1,000 -2,235
2005 Sep 15 57 --- 57 --- --- --- --- --- --- --- 57 7,483 -4,000 3,483
Intermeeting Period
Aug 9-Sep 15 2,868 --- 2,868 1,298 3,921 1,118 90 757 5,670 --- 8,538 7,200 -1,000 6,200
Memo: LEVEL (bil. $)
Sep 15 267.9 121.4 214.3 52.6 77.1 465.4 --- 733.3 -8.5 18.0 9.5
1. Change from end-of-period to end-of-period. Excludes changes in compensation for the effects of 4. Includes redemptions (-) of Treasury and agency securities.inflation on the principal of inflation-indexed securities. 5. RPs outstanding less reverse RPs.
2. Outright purchases less outright sales (in market and with foreign accounts). 6. Original maturity of 13 days or less.3. Outright purchases less outright sales (in market and with foreign accounts). Includes short-term notes 7. Original maturity of 14 to 90 days.
acquired in exchange for maturing bills. Excludes maturity shifts and rollovers of maturing issues,except the rollover of inflation compensation.
MRA:SPS
Class I FOMC - Restricted Controlled (FR) Page 38 of 38