Fomc 19970205 g Bpt 219970129
99
Prefatory Note The attached document represents the most complete and accurate version available based on original copies culled from the files of the FOMC Secretariat at the Board of Governors of the Federal Reserve System. This electronic document was created through a comprehensive digitization process which included identifying the best- preserved paper copies, scanning those copies, 1 and then making the scanned versions text-searchable. 2 Though a stringent quality assurance process was employed, some imperfections may remain. Please note that this document may contain occasional gaps in the text. These gaps are the result of a redaction process that removed information obtained on a confidential basis. All redacted passages are exempt from disclosure under applicable provisions of the Freedom of Information Act. 1 In some cases, original copies needed to be photocopied before being scanned into electronic format. All scanned images were deskewed (to remove the effects of printer- and scanner-introduced tilting) and lightly cleaned (to remove dark spots caused by staple holes, hole punches, and other blemishes caused after initial printing). 2 A two-step process was used. An advanced optimal character recognition computer program (OCR) first created electronic text from the document image. Where the OCR results were inconclusive, staff checked and corrected the text as necessary. Please note that the numbers and text in charts and tables were not reliably recognized by the OCR process and were not checked or corrected by staff.
-
Upload
fraser-federal-reserve-archive -
Category
Documents
-
view
218 -
download
0
Transcript of Fomc 19970205 g Bpt 219970129
Prefatory Note
The attached document represents the most complete and accurate version available based on original copies culled from the files of the FOMC Secretariat at the Board of Governors of the Federal Reserve System. This electronic document was created through a comprehensive digitization process which included identifying the best-preserved paper copies, scanning those copies,1 and then making the scanned versions text-searchable.2 Though a stringent quality assurance process was employed, some imperfections may remain.
Please note that this document may contain occasional gaps in the text. These gaps are the result of a redaction process that removed information obtained on a confidential basis. All redacted passages are exempt from disclosure under applicable provisions of the Freedom of Information Act.
1 In some cases, original copies needed to be photocopied before being scanned into electronic format. All scanned images were deskewed (to remove the effects of printer- and scanner-introduced tilting) and lightly cleaned (to remove dark spots caused by staple holes, hole punches, and other blemishes caused after initial printing). 2 A two-step process was used. An advanced optimal character recognition computer program (OCR) first created electronic text from the document image. Where the OCR results were inconclusive, staff checked and corrected the text as necessary. Please note that the numbers and text in charts and tables were not reliably recognized by the OCR process and were not checked or corrected by staff.
Confidential (FR) Class II FOMC
Part 2January 29, 1997
CURRENT ECONOMICAND FINANCIAL CONDITIONS
Recent Developments
Prepared for the Federal Open Market Committee
By the staff of the Board of Governors of the Federal Reserve System
Confidential (FR) Class III FOMC
January 29, 1997
RECENT DEVELOPMENTS
Prepared for the Federal Open Market Committeeby the staff of the Board of Governors of the Federal Reserve System

DOMESTIC NONFINANCIALDEVELOPMENTS
DOMESTIC NONFINANCIAL DEVELOPMENTS
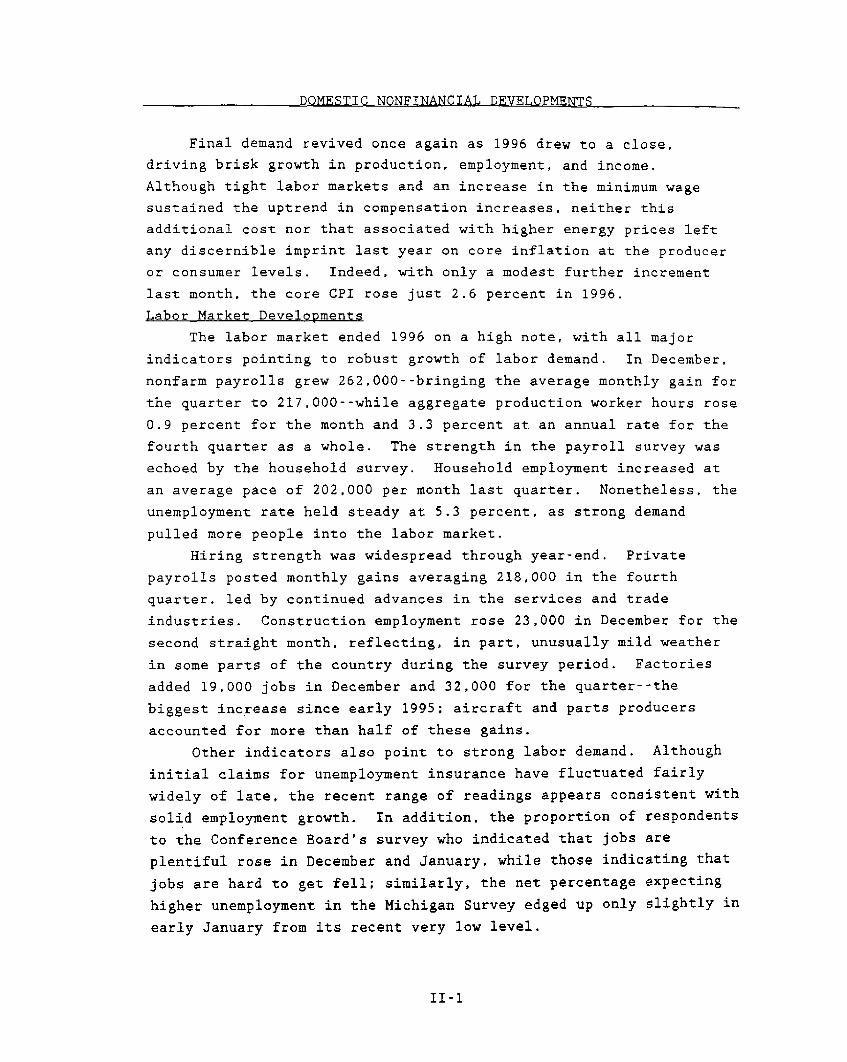
Final demand revived once again as 1996 drew to a close,
driving brisk growth in production, employment, and income.
Although tight labor markets and an increase in the minimum wage
sustained the uptrend in compensation increases, neither this
additional cost nor that associated with higher energy prices left
any discernible imprint last year on core inflation at the producer
or consumer levels. Indeed, with only a modest further increment
last month, the core CPI rose just 2.6 percent in 1996.
Labor Market Developments
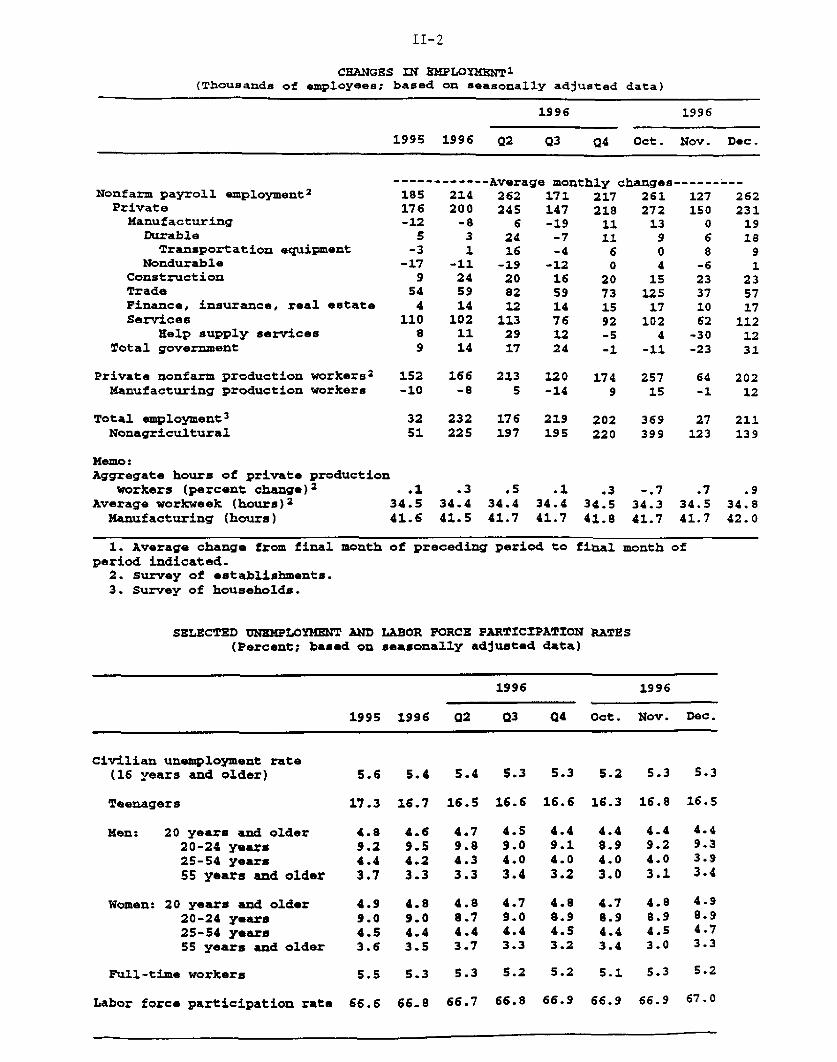
The labor market ended 1996 on a high note, with all major
indicators pointing to robust growth of labor demand. In December,
nonfarm payrolls grew 262,000--bringing the average monthly gain for
the quarter to 217,000--while aggregate production worker hours rose
0.9 percent for the month and 3.3 percent at an annual rate for the
fourth quarter as a whole. The strength in the payroll survey was
echoed by the household survey. Household employment increased at
an average pace of 202,000 per month last quarter. Nonetheless, the
unemployment rate held steady at 5.3 percent, as strong demand
pulled more people into the labor market.
Hiring strength was widespread through year-end. Private
payrolls posted monthly gains averaging 218,000 in the fourth
quarter, led by continued advances in the services and trade
industries. Construction employment rose 23,000 in December for the
second straight month, reflecting, in part, unusually mild weather
in some parts of the country during the survey period. Factories
added 19,000 jobs in December and 32,000 for the quarter--the
biggest increase since early 1995; aircraft and parts producers
accounted for more than half of these gains.
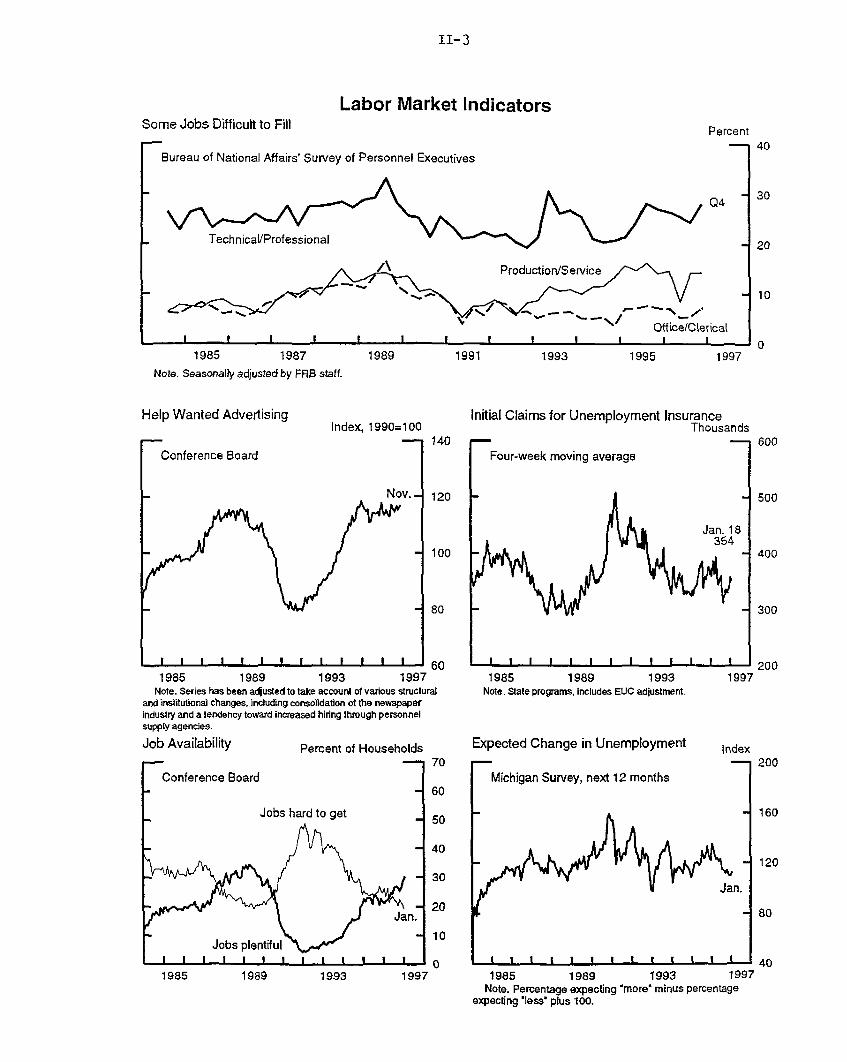
Other indicators also point to strong labor demand. Although
initial claims for unemployment insurance have fluctuated fairly
widely of late, the recent range of readings appears consistent with
solid employment growth. In addition, the proportion of respondents
to the Conference Board's survey who indicated that jobs are
plentiful rose in December and January, while those indicating that
jobs are hard to get fell; similarly, the net percentage expecting
higher unemployment in the Michigan Survey edged up only slightly in
early January from its recent very low level.
II-1
II-2
CHANGES IN EMPLOYMENT 1(Thousands of employees; based on seasonally adjusted data)
1996 1996
1995 1996 02 Q3 Q4 Oct. Nov. Dec.
------------Average monthly changes---------Nonfarm payroll employment2 185 214 262 171 217 261 127 262
Private 176 200 245 147 218 272 150 231Manufacturing -12 -8 6 -19 11 13 0 19
Durable 5 3 24 -7 11 9 6 18Transportation equipment -3 1 16 -4 6 0 8 9
Nondurable -17 -11 -19 -12 0 4 -6 1Construction 9 24 20 16 20 15 23 23Trade 54 59 82 59 73 125 37 57Finance, insurance, real estate 4 14 12 14 15 17 10 17Services 110 102 113 76 92 102 62 112
Help supply services 8 11 29 12 -5 4 -30 12Total government 9 14 17 24 -1 -11 -23 31
Private nonfarm production workers2 152 166 213 120 174 257 64 202Manufacturing production workers -10 -8 5 -14 9 15 -1 12
Total employment3 32 232 176 219 202 369 27 211Nonagricultural 51 225 197 195 220 399 123 139
Memo:Aggregate hours of private production
workers (percent change) 2 .1 .3 .5 .1 .3 -. 7 .7 .9Average workweek (hours) 2 34.5 34.4 34.4 34.4 34.5 34.3 34.5 34.8
Manufacturing (hours) 41.6 41.5 41.7 41.7 41.8 41.7 41.7 42.0
1. Average change from final month of preceding period to final month ofperiod indicated.
2. Survey of establishments.3. Survey of households.
SELECTED UNEMPLOYMENT AND LABOR FORCE PARTICIPATION RATES(Percent; based on seasonally adjusted data)
1996 1996
1995 1996 02 03 04 Oct. Nov. Dec.
Civilian unemployment rate(16 years and older)
Teenagers
Men: 20 years and older20-24 years25-54 years55 years and older
Women: 20 years and older20-24 years25-54 years55 years and older
Full-time workers
5.6 5.4 5.4 5.3 5.3 5.2 5.3 5.3
17.3 16.7 16.5 16.6 16.6 16.3 16.8 16.5
4.89.24.43.7
4.99.04.53.6
4.69.54.23.3
4.89.04.43.5
4.49.14.03.2
4.88.94.53.2
4.48.94.03.0
4.78.94.43.4
4.49.24.03.1
4.88.94.53.0
4.49.33.93.4
4.98.94.73.3
5.5 5.3 5.3 5.2 5.2 5.1 5.3
66.7 66.8 66.9 66.9 66.9 67.0Labor force participation rate 66.6 66.8
II-3
Labor Market IndicatorsSome Jobs Difficult to Fill
SBureau of National Affairs' Survey of Personnel Executives
I 1 I I - If I I I 1
1985 1987 1989 1991 1993
Note. Seasonally adjusted by FRS staff.
Help Wanted AdvertisingIndex, 1990=100
Initial Claims for Unemployment InsuranceThousands
1985 1989 1993 1997Note. Series has been adjusted to take account of various structural
and institutional changes, including consolidation ot the newspaperindustry and a tendency toward increased hiring through personnelsupply agencies.
Job Availability Percent of Households
1985 1989 1993Note. State programs, includes EUC adjustment.
Expected Change in Unemployment
1985 1989 1993 1997 1985 1989 1993 1997Note. Percentage expecting 'more' minus percentage
expecting "less" plus 100,
Percent
Q4
1995 1997
1997
Index
II-4
Unemployment Rates: Actual vs. Okun's Law SimulationsSimulation Begins in 1990:Q3
- ActualOkun's Law (Gross Domestic Product)
, I
1991 1992 1993 1994
I I i
1995 1996
Note: The Okun's Law projection for 1996:Q4 is based on the staffs GDP projection.
PUBLISHED LABOR PRODUCTIVITY(Percent change from preceding period at compound
based on seasonally adjusted data)annual rate;
1990:Q3 1995:Q4to to
1993:Q4 19941 19951 1996:Q3
Total business 1.4 .2 -.1 1.1Nonfarm business 1.4 .3 -.1 .7Manufacturing 2.6 4.5 3.5 4.9Nonfinancialcorporations2 2.1 .2 1.5 2.1
1. Changes are from fourth quarter of preceding year to fourth quarterof year shown.2. The nonfinancial corporate sector includes all corporations doing
business in the United States with the exception of banks, stock andcommodity brokers, finance and insurance companies; the sector accountsfor about two-thirds of business employment.
-- 8.8
- 4.8
II-5
Over 1996 as a whole, nonfarm payrolls increased 2.56 million,
while the household survey measure of employment--adjusted to make
it better match the payroll concept--increased 2.71 million.1
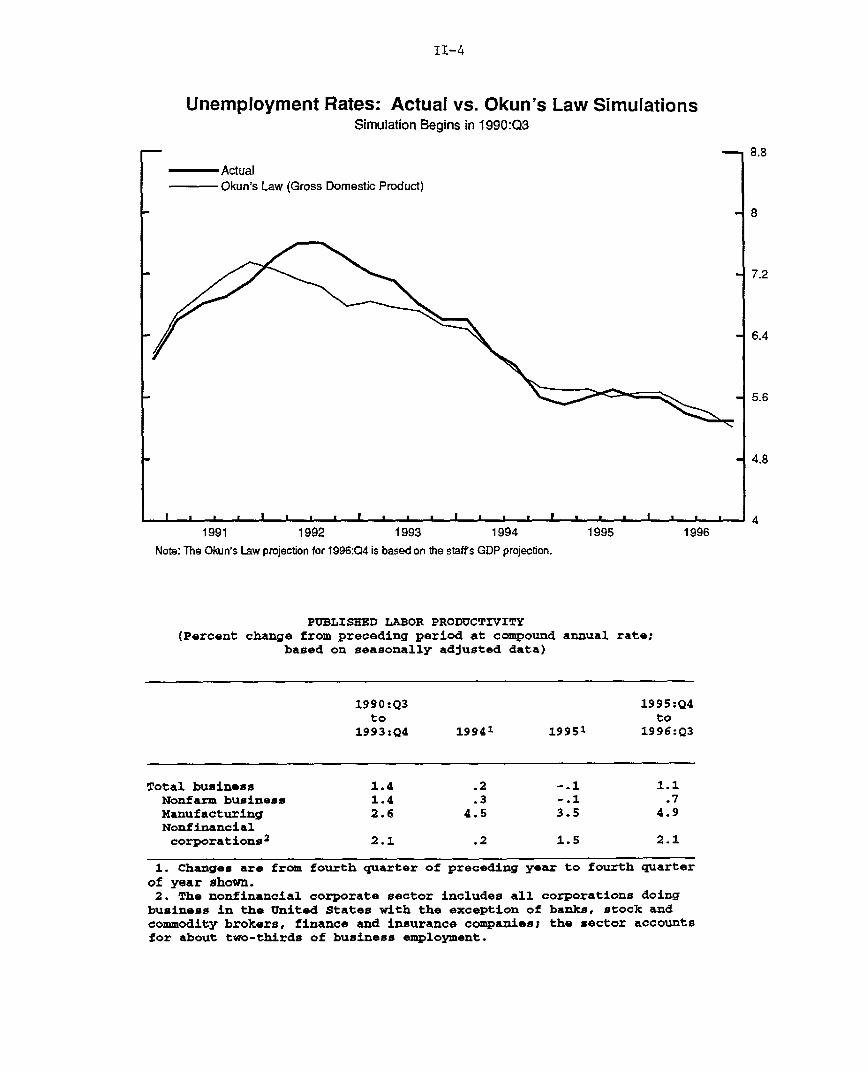
Yet, despite the rapid pace of employment growth over the year, the
unemployment rate fell just 0.3 percentage point--from 5.6 percent
in the fourth quarter of 1995 to 5.3 percent in the fourth quarter
of 1996. This relatively small decline would seem at variance with
Okun's Law, and reflects a run-up in the labor force participation
rate--from 66.5 percent in the fourth quarter of 1995 to
66.9 percent in the fourth quarter of 1996. Last year's discrepancy
is not unusual, however, as Okun's law often noticeably over- or
underpredicts changes in the unemployment rate over periods as short
as a year or two. Okun's law better explains unemployment rate
fluctuations over longer periods. In the current cycle, for
example, Okun's law predicted most of the rise in the unemployment
rate over 1991 and 1992 and the subsequent decline to its current
level.
One negative feature of last year's labor market was the
continued slow growth of nonfarm business sector
productivity--about 3/4 percent for the year, by our estimate. This
actually would be an improvement over the performance in 1994 and
1995, but it calls into further question our long-standing
assumption that the underlying, cyclically adjusted trend rate of
productivity growth this decade has been 1.1 percent per year.
Output per hour, according to the published data, has now grown, on
average, only 0.8 percent per year since the middle of 1990.
At the same time, however, we would also note that productivity
measurement is sensitive to the choice of output measure. In
particular, using the income-side measure of nonfarm business
output, one finds healthier productivity growth, averaging more
than 1-1/2 percent in 1996 and 1.1 percent per year since the last
business cycle peak. But there appears to be no tendency in the
annual or benchmark NIPA revisions for the statistical discrepancy
to be revised toward zero. And the reason the BEA advertises Gross
Domestic Product as its official measure of domestic output is that
they consider the preliminary spending indicators used to construct
1. The adjustment includes the removal from the household totalof agricultural workers, self-employed workers, unpaid familyworkers, and workers on unpaid absences, and the addition ofagricultural service workers and second jobs held by multiple-jobholders.
II-6
GROWTH IN SELECTED COMPONENTS OF INDUSTRIAL PRODUCTION(Percent change from preceding comparable period)
1996 1996Proportion1996:Q4 19951 19961 Q3 Q4 Oct. Nov. Dec.
-Annual rate- --Monthly rate---
Total index 100.0 1.8 3.7 3.3 3.8 .0 .8 .7Previous 1.6 4.5 4.5 4.1 -.1 .8 .8
Manufacturing 86.6 1.6 4.0 5.0 3.7 .0 .6 1.0Motor veh. and parts 4.6 -3.0 -3.7 2.7 -22.1 -6.1 5.0 .1Aircraft and parts 2.5 -15.4 35.1 21.3 35.4 3.3 2.3 1.8
Manufacturing excludingmotor vehicles,aircraft, and parts 79.4 2.4 3.7 4.7 4.7 .3 .3 1.0
Consumer goods 23.9 .2 2.6 2.2 6.1 .5 .8 .9Durables 4.1 2.5 3.6 .2 2.5 -.5 .6 3.0Nondurables 19.8 -.2 2.4 2.6 6.9 .7 .8 .5
Business equipment 11.9 8.1 5.7 5.7 6.0 1.1 -.4 1.0Office and computing 1.7 42.8 39.5 44.3 24.4 1.5 1.8 1.7Industrial 4.4 7.3 -.2 -.1 1.1 .7 -.6 1.1other 6.1 4.6 .8 2.2 2.9 .9 -.3 1.2
Construction supplies 5.7 -.8 5.9 9.3 .4 -1.6 1.1 .4
Materials 29.1 3.8 4.5 5.9 4.0 .1 .2 1.4Durables 20.2 6.9 5.8 6.6 4.7 .2 -.1 1.7Nondurables 8.7 -2.3 1.7 4.5 2.0 -.3 .9 .7
Mining 5.6 -1.3 3.9 .8 2.4 .1 .5 1.2Utilities 7.9 6.5 .4 -12.0 5.3 .3 2.3 -3.4
Memo:Information-related products 2 9.7 24.6 17.4 17.8 15.0 .8 1.3 1.8
1. From the final quarter of the previous period to the final quarter of the periodindicated.
2. Includes computer equipment, computer parts, semiconductors, communicationsequipment, and selected instruments.
CAPACITY UTILIZATION(Percent of capacity; seasonally adjusted)
1988-89 1963-96 1995 1996 1996
High Avg. Q4 Q3 Q4 Oct. Nov. Dec.
Manufacturing 85.7 81.9 82.3 82.3 82.2 81.8 82.1 82.6
Primary processing 88.9 83.0 86.2 86.6 86.4 86.4 86.1 86.7Advanced processing 84.2 81.3 80.5 80.4 80.4 79.9 80.4 80.8
II-7
this product-side measure to be more reliable than the preliminary
income-side indicators used to construct Gross Domestic Income.
Still, there are reasons to suspect that the official output and
productivity estimates for the nonfarm business sector are
understating gains. As has been noted, for example, the
nonfinancial corporate sector--which excludes many of the industries
producing difficult-to-measure output and is measured on the income
side--has shown consistently stronger productivity growth than the
nonfarm business sector.
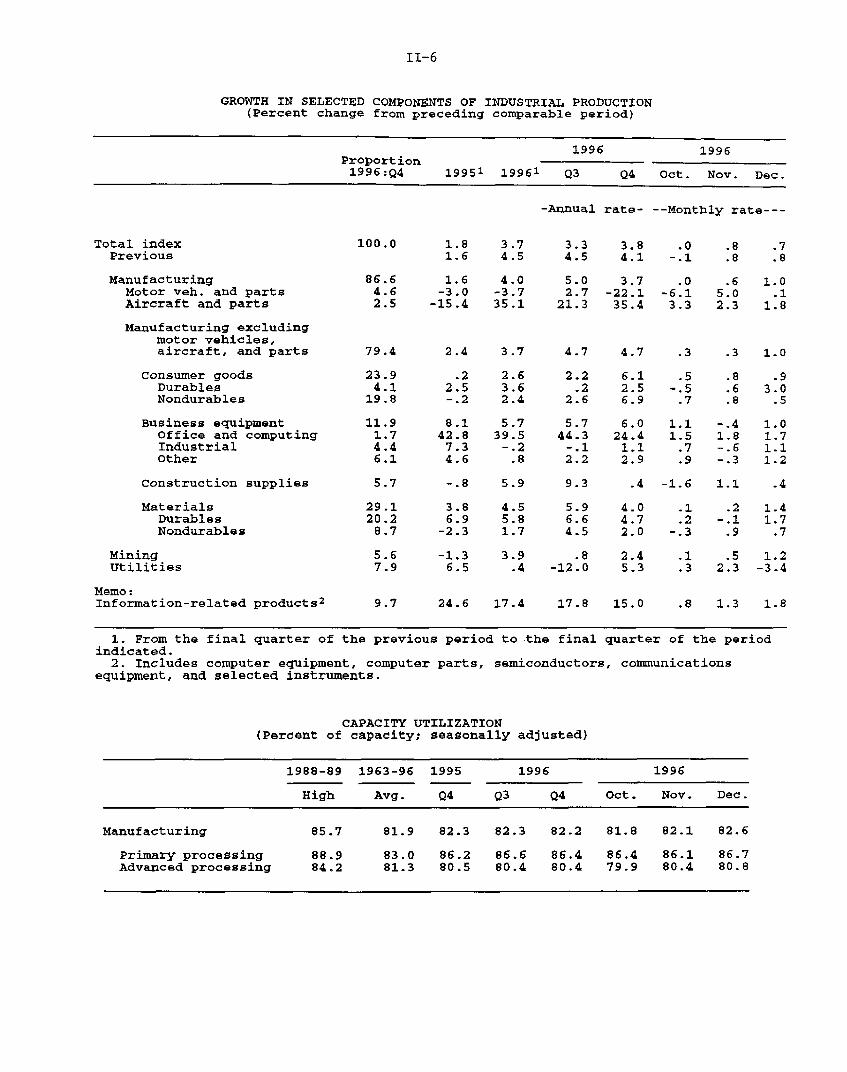
Industrial Production 2
Industrial production increased 0.7 percent in December after a
0.8 percent gain in November. Increases were widespread across
manufacturing industries; elsewhere, a steep decline in utilities
output, reflecting unseasonably mild weather in December, was partly
offset by an upturn in mining. The surge in activity brought IP
growth in the fourth quarter to 3.8 percent at an annual rate,
1/2 percentage point above its third-quarter rate. The December
surge in manufacturing output boosted the factory operating rate to
82.6 percent, the highest level since September 1995.
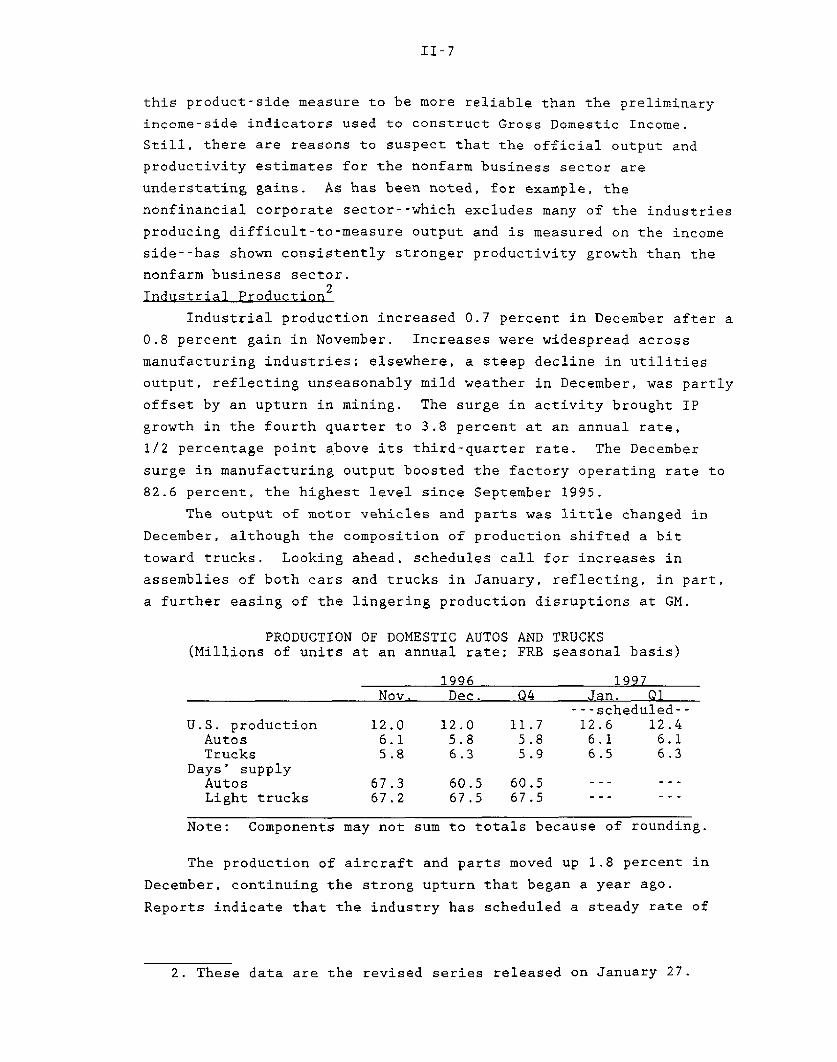
The output of motor vehicles and parts was little changed in
December, although the composition of production shifted a bit
toward trucks. Looking ahead, schedules call for increases in
assemblies of both cars and trucks in January, reflecting, in part,
a further easing of the lingering production disruptions at GM.
PRODUCTION OF DOMESTIC AUTOS AND TRUCKS(Millions of units at an annual rate; FRB seasonal basis)
1996 1997Nov. Dec. Q4 Jan. Q1
---scheduled--U.S. production 12.0 12.0 11.7 12.6 12.4
Autos 6.1 5.8 5.8 6.1 6.1Trucks 5.8 6.3 5.9 6.5 6.3
Days' supplyAutos 67.3 60.5 60.5 --- --Light trucks 67.2 67.5 67.5 --- ---
Note: Components may not sum to totals because of rounding.
The production of aircraft and parts moved up 1.8 percent in
December, continuing the strong upturn that began a year ago.
Reports indicate that the industry has scheduled a steady rate of
2. These data are the revised series released on January 27.
II-8
SALES OF AUTOMOBILES AND LIGHT TRUCKS(Millions of units at an annual rate; FRB seasonals)
1996
1995 1996 Q2 Q3 Q4 Oct. Nov. Dec.
FRB TotalAdjusted 1
AutosLight trucks
North American2
AutosBig ThreeTransplants
Light trucks
Foreign producedAutosLight trucks
Memo:BEA Total
14.7 15.1 15.0 15.0 14.8 14.9 14.7 14.814.7 15.0 15.0 15.1 14.7 15.0 14.6 14.5
8.6 8.5 8.7 8.6 8.0 8.0 7.9 8.16.1 6.6 6.3 6.4 6.8 7.0 6.8 6.7
12.87.15.41.75.7
13.47.25.32.06.1
13.37.45.51.95.9
13.37.35.32.16.0
13.16.84.81.96.3
13.26.74.91.86.5
12.96.64.62.06.3
13.27.05.02.06.2
1.9 1.7 1.7 1.7 1.7 1.7 1.8 1.71.5 1.3 1.3 1.3 1.2 1.2 1.3 1.2.4 .4 .4 .4 .5 .4 .5 .5
14.7 15.1 15.1 15.0 14.7 14.8 14.8 14.4
Note. Components may not add to totals because of rounding. Data on salesof trucks and imported autos for the most recent month are preliminary andsubject to revision.1. Excludes the estimated effect of automakers' changes in reporting periods.2. Excludes some vehicles produced in Canada that are classified as imports
by the industry.
Marketing Incentives for Light Vehicles(FRB seasonals)
Dollars
plannedQ1
~~Q
1800
1500
1200
900
600
300
0
Michigan SRC Survey Diffusion index
1993 1994 1995 1996
Note. Data from J.D. Powers.
1996
Buyer Sentiment for New Vehicles
1993 1994 1995 1996
II-9
increase until the end of 1997.3 Outside of motor vehicles and
aircraft, manufacturing output increased 1.0 percent in December,
with substantial advances in every major category.
The annual revision of IP, capacity, and capacity utilization
released on January 27 incorporated updated source data and featured
a change in the method of aggregating the indexes. From 1977
onward, the value-added proportions used to weight individual series
were updated annually rather than every five years, and were
aggregated using a Fisher formula rather than a linked-Laspeyres.
The new aggregation methods lowered IP and capacity growth,
reflecting in large part the smaller weights applied to the fast-
growing computer industry. The new estimates of production and
capacity from 1992 onward also incorporate additional and updated
statistics. Overall, these revisions lowered the average annual
rate of growth of IP over the past three years by about
1/2 percentage point.
The revision had only a minor influence on capacity utilization
rates. The lower estimate of IP growth was, in general, accompanied
by a downward revision in capacity growth (also reflecting the
changed method of aggregation). The most recent peak in factory
utilization (84.6 percent) still occurs at the end of 1994; the
average rate of capacity utilization in manufacturing from 1963 to
1996, 81.9 percent, is just a tad below the previous estimate of
82.1 percent, and, as before, the December rate (82.6 percent) is
just a bit above this longer-run average.
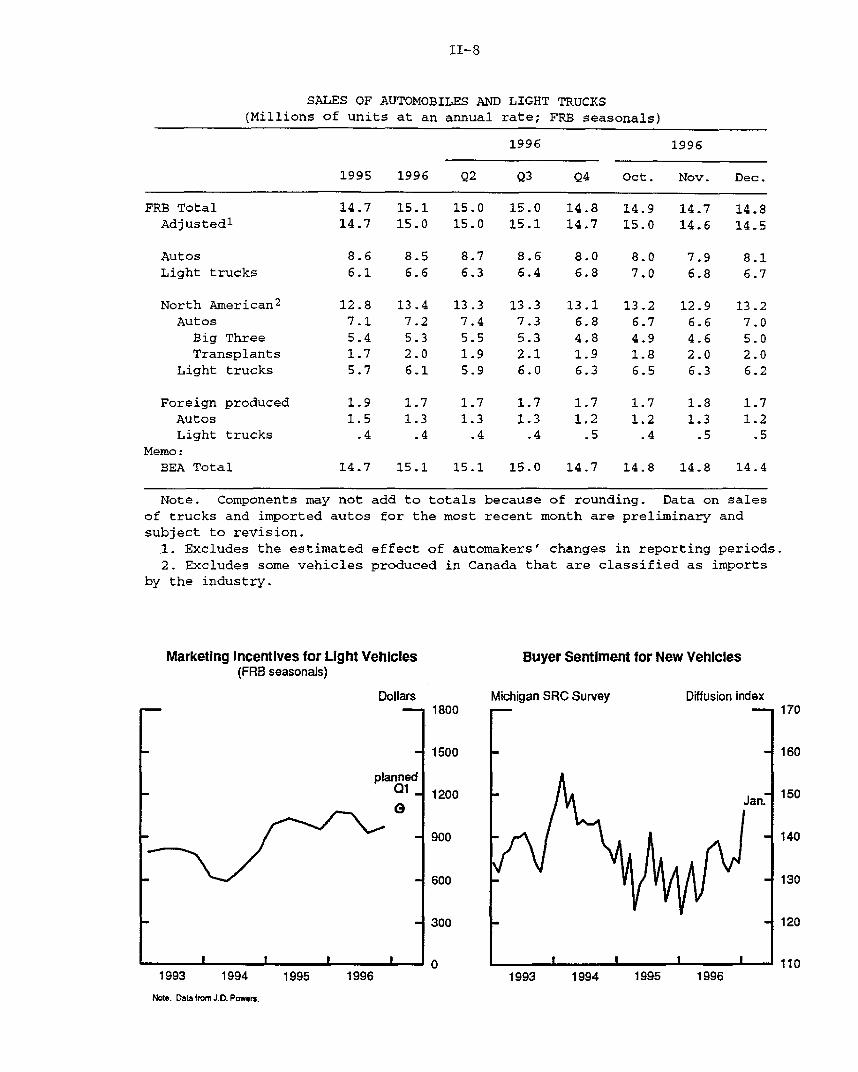
Motor Vehicles
Reported sales of light motor vehicles in December were
14.8 million units at an annual rate, based on recently revised FRB
seasonal factors, the same as the October-November average; actual
sales were about 300,000 units below this pace because some
automakers included an extra selling day in their December
report.4 Based on confidential data from company sources, sales
in December were propped up by a bounceback in GM fleet sales, which
had been unusually low in October and November owing to the
3. Boeing recently canceled the development of a new version ofthe 747. Given the long lead times of such a project, however, thischange will not affect production in 1997 or 1998.
4. The new FRB seasonal factors improve the estimate of tradingday weights. We expect that BEA will use older seasonal factorsuntil their midsummer revision. Based on these factors, sales fellsharply in December. For the fourth quarter as a whole, however,sales differed by only 100.000 units at an annual rate.
II-10
Medium and Heavy Truck Sales(FRB seasonals; annual rate)
Millions of units
1988 1990 1992 1994 1996
Backlog of North American Medium and Heavy Truck Orders(Classes 5-8; FRB seasonals)
Thousands of Units
Dec. -
I _ I I I Ir I I I
1988 1990 1992
Note: Data from Americas Commercial Transportation Research Qo.
0.56
0.49
0.42
0.35
0.28
0.21
0.14
1994 1996
II-11
strike-related supply disruptions at GM and subsequent model
changeover problems. For the fourth quarter as a whole, total light
vehicle sales declined a bit as the dip in fleet sales overshadowed
a moderate rise in retail sales.
In the near term, a host of factors should encourage retail
sales. Chief among these factors is favorable pricing. New car
prices in the CPI fell 1.7 percent at an annual rate in the last
three months of 1996, as Big Three sales incentives moved up in the
fourth quarter; first-quarter plans call for further increases in
incentives to above the high levels of a year ago. In addition, new
car-buying attitudes zoomed in the preliminary Michigan Survey of
Consumer Sentiment for January. Respondents cited low prices and
the strong economy as reasons why it was a good time to buy a car.
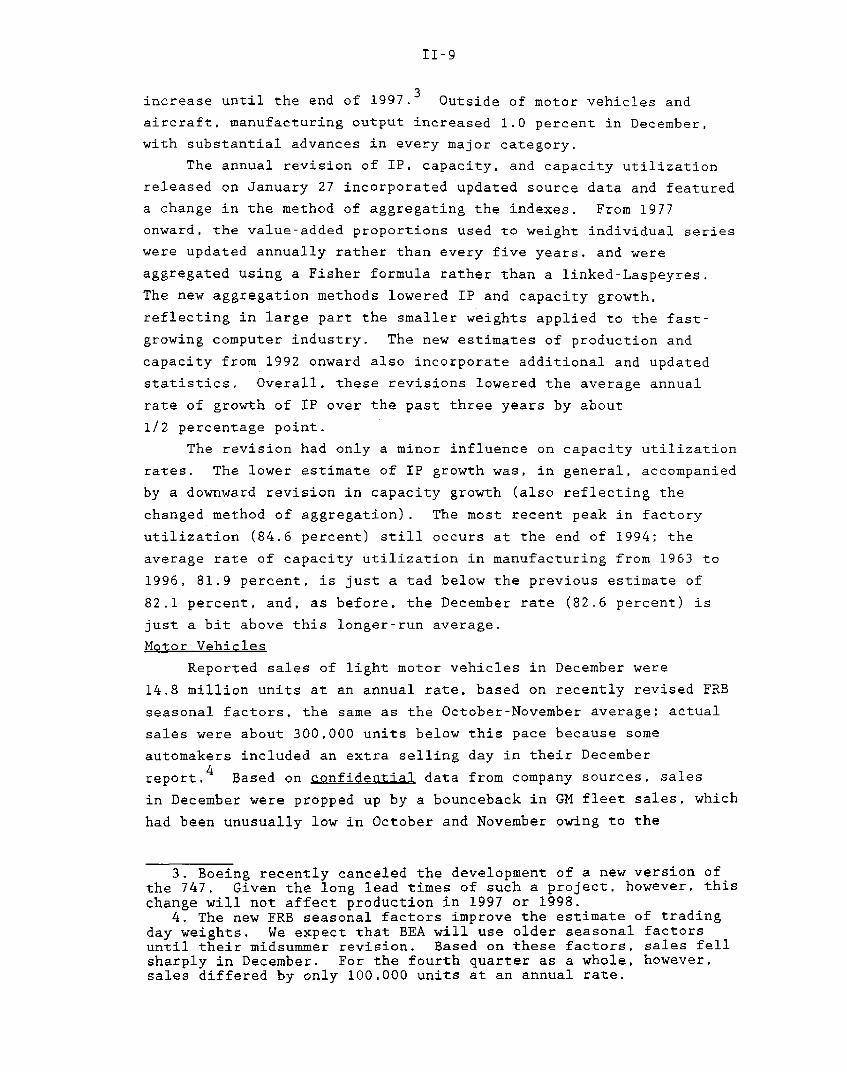
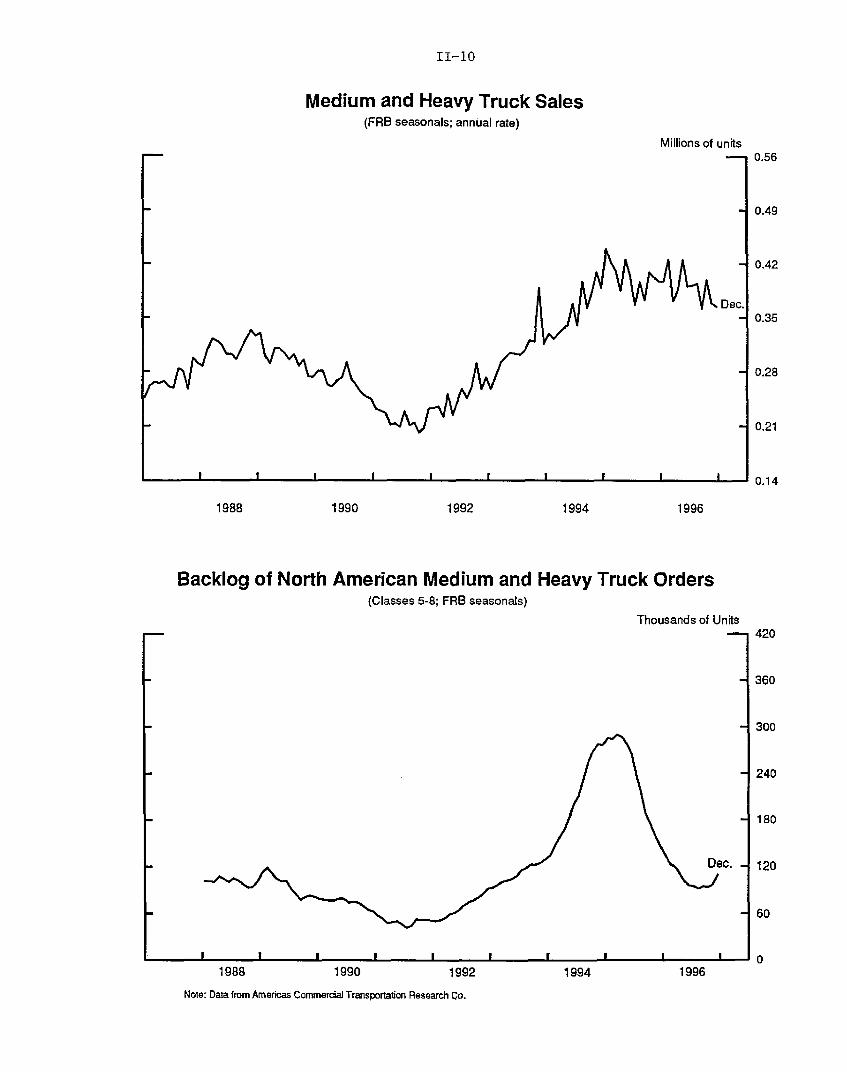
Sales of medium and heavy trucks were essentially unchanged in
December after having fallen 26,000 units at an annual rate in
November. Sales have been trending down for about a year, but
demand may have improved some recently. Orders for heavy trucks
(class 8) have increased a bit, and backlogs have ticked up in the
past few months after dropping steadily since early 1995. Orders
have also improved for medium trucks (class 5-7), where backlogs had
plummeted to very low levels. Over the past year, medium and heavy
truck production mirrored sales, keeping inventories in line and
leaving the days' supply at about its average level over the past
four years.
Personal Income and Consumption
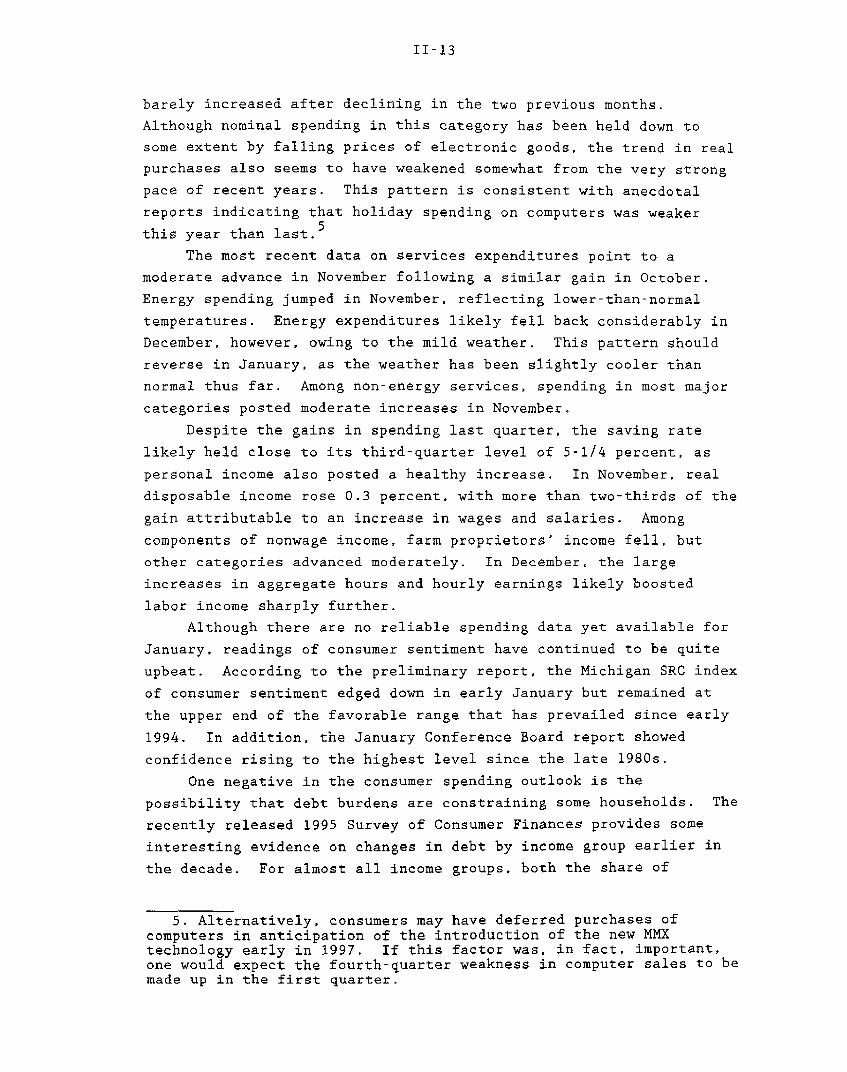
Household spending appears to have rebounded from its slump of
last summer, with growth in real PCE probably picking up to about a
3 percent pace in the fourth quarter of 1996. Moreover, the
continued solid uptrend in income and the very favorable recent
readings of sentiment suggest plenty of room for spending to expand
in the months ahead.
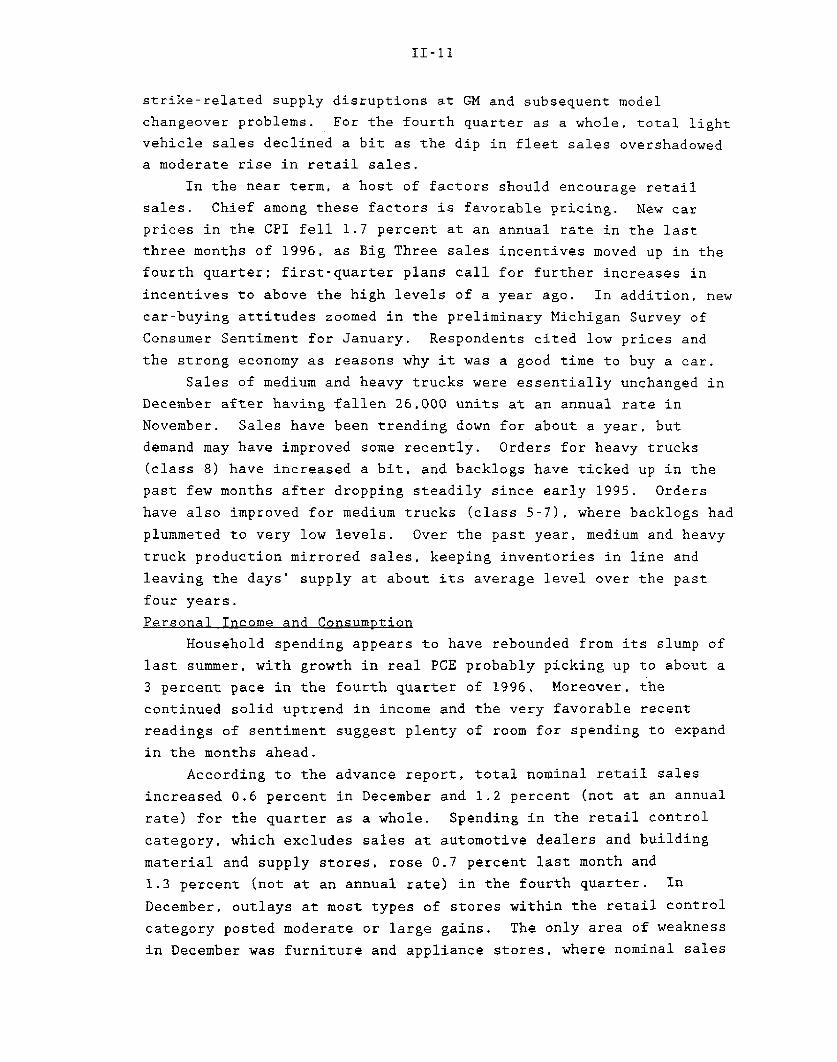
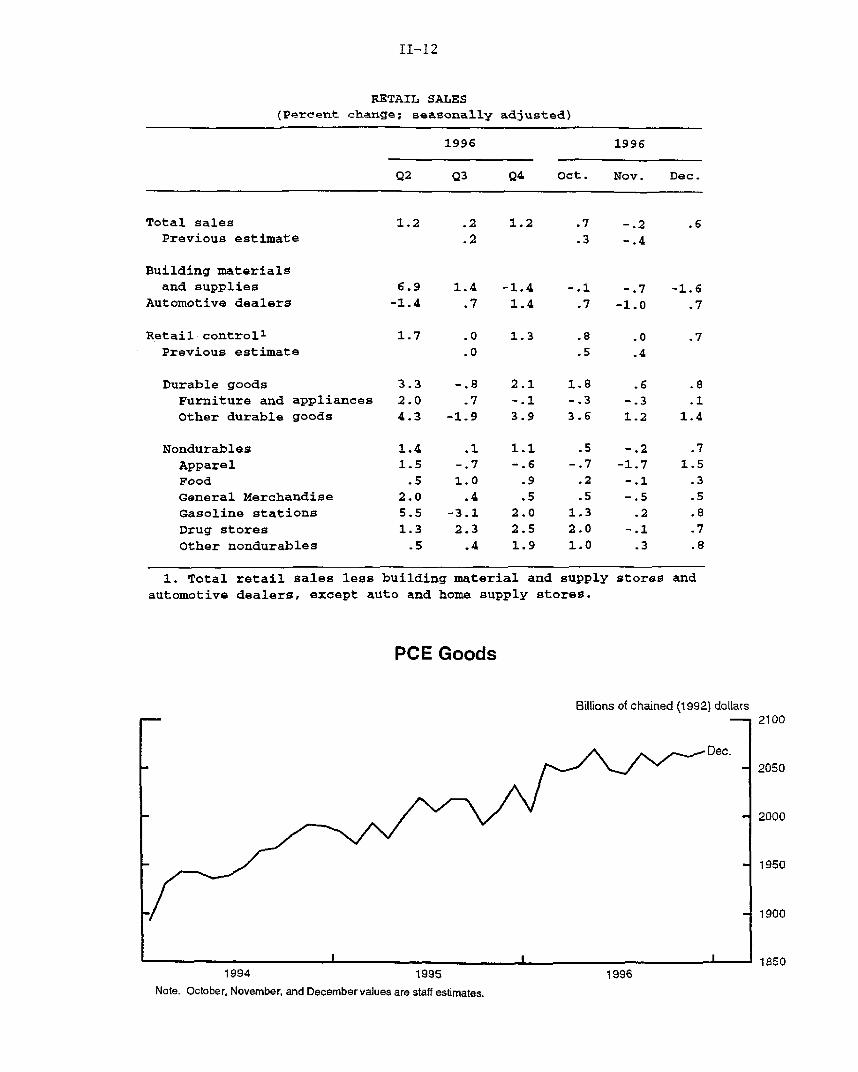
According to the advance report, total nominal retail sales
increased 0.6 percent in December and 1.2 percent (not at an annual
rate) for the quarter as a whole. Spending in the retail control
category, which excludes sales at automotive dealers and building
material and supply stores, rose 0.7 percent last month and
1.3 percent (not at an annual rate) in the fourth quarter. In
December, outlays at most types of stores within the retail control
category posted moderate or large gains. The only area of weakness
in December was furniture and appliance stores, where nominal sales
II-12
RETAIL SALES(Percent change; seasonally adjusted)
1996 1996
Q2 Q3 Q4 Oct. Nov. Dec.
Total sales 1.2 .2 1.2 .7 -.2 .6Previous estimate .2 .3 -.4
Building materials
and supplies 6.9 1.4 -1.4 -.1 -.7 -1.6Automotive dealers -1.4 .7 1.4 .7 -1.0 .7
Retail controll 1.7 .0 1.3 .8 .0 .7Previous estimate .0 .5 .4
Durable goods 3.3 -.8 2.1 1.8 .6 .8
Furniture and appliances 2.0 .7 -.1 -.3 -.3 .1
Other durable goods 4.3 -1.9 3.9 3.6 1.2 1.4
Nondurables 1.4 .1 1.1 .5 -.2 .7
Apparel 1.5 -.7 -.6 -.7 -1.7 1.5
Food .5 1.0 .9 .2 -.1 .3
General Merchandise 2.0 .4 .5 .5 -.5 .5
Gasoline stations 5.5 -3.1 2.0 1.3 .2 .8
Drug stores 1.3 2.3 2.5 2.0 -.1 .7
Other nondurables .5 .4 1.9 1.0 .3 .8
1. Total retail sales less building material and supply stores and
automotive dealers, except auto and home supply stores.
PCE Goods
Billions of chained (1992) dollars2100
2050
2000
1950
1900
18501994 1995 1996
Note. October, November, and December values are staff estimates.
II-13
barely increased after declining in the two previous months.
Although nominal spending in this category has been held down to
some extent by falling prices of electronic goods, the trend in real
purchases also seems to have weakened somewhat from the very strong
pace of recent years. This pattern is consistent with anecdotal
reports indicating that holiday spending on computers was weaker
this year than last. 5
The most recent data on services expenditures point to a
moderate advance in November following a similar gain in October.
Energy spending jumped in November, reflecting lower-than-normal
temperatures. Energy expenditures likely fell back considerably in
December, however, owing to the mild weather. This pattern should
reverse in January, as the weather has been slightly cooler than
normal thus far. Among non-energy services, spending in most major
categories posted moderate increases in November.
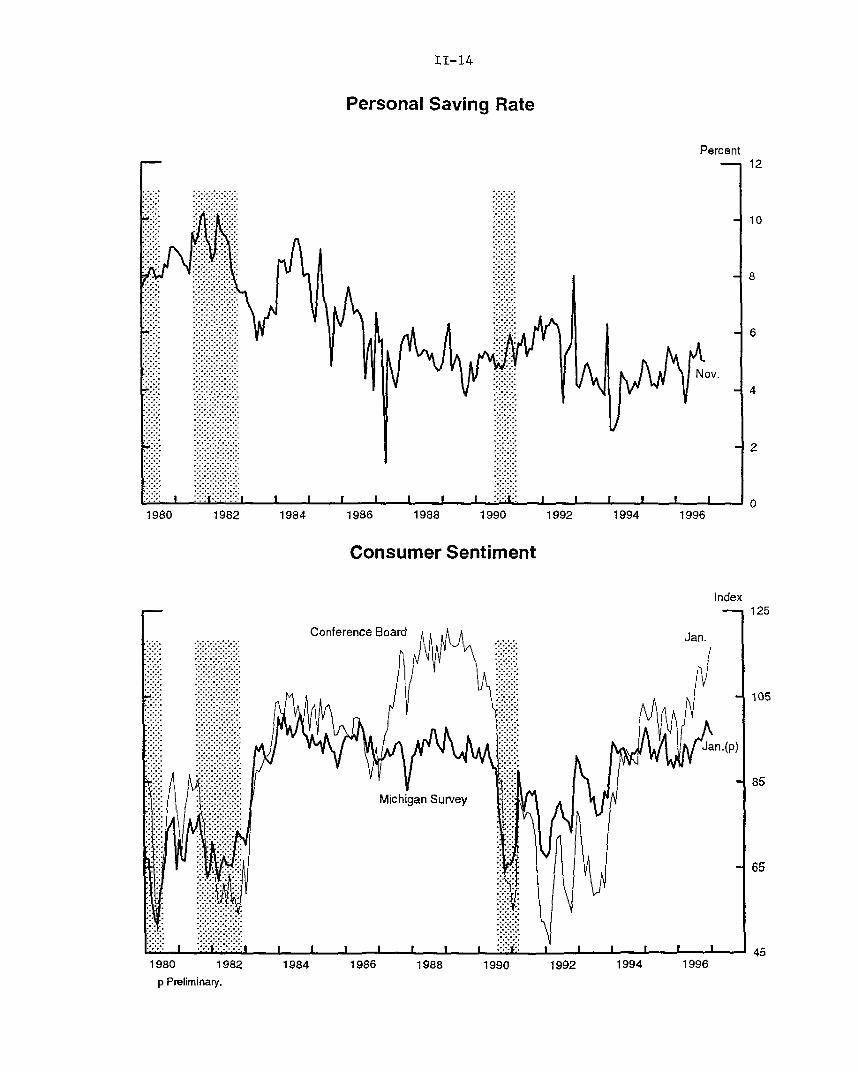
Despite the gains in spending last quarter, the saving rate
likely held close to its third-quarter level of 5-1/4 percent, as
personal income also posted a healthy increase. In November, real
disposable income rose 0.3 percent, with more than two-thirds of the
gain attributable to an increase in wages and salaries. Among
components of nonwage income, farm proprietors' income fell, but
other categories advanced moderately. In December, the large
increases in aggregate hours and hourly earnings likely boosted
labor income sharply further.
Although there are no reliable spending data yet available for
January, readings of consumer sentiment have continued to be quite
upbeat. According to the preliminary report, the Michigan SRC index
of consumer sentiment edged down in early January but remained at
the upper end of the favorable range that has prevailed since early
1994. In addition, the January Conference Board report showed
confidence rising to the highest level since the late 1980s.
One negative in the consumer spending outlook is the
possibility that debt burdens are constraining some households. The
recently released 1995 Survey of Consumer Finances provides some
interesting evidence on changes in debt by income group earlier in
the decade. For almost all income groups, both the share of
5. Alternatively, consumers may have deferred purchases ofcomputers in anticipation of the introduction of the new MMXtechnology early in 1997. If this factor was, in fact, important,one would expect the fourth-quarter weakness in computer sales to bemade up in the first quarter.
II-14
Personal Saving Rate
PercentS12
: 10
-8
.. ...... ..
I ( 1 I I F I I I F I I I I I I
1980 1982 1984 1986 1988 1990 1992 1994 1996
Consumer Sentiment
IndexS125
Conference Board - an
Jan.(p)
85
..i.... Michigan Survey
65
1980 1982 1984 1986 1988 1990 1992 1994 1996
p Preliminary.
II-15
households with debt and the mean amount borrowed (in real terms)
rose between 1992 and 1995. However, changes in financial
conditions were not uniform across income groups: Median ratios of
payments to income rose considerably for households with incomes
below $25,000. 6 while holding steady or declining for households
in higher income brackets. Whether low-income households took on a
greater debt burden because they perceived brighter future income
prospects or because of aggressive marketing by lenders, their
subsequent spending may have been pinched by the combination of the
high payment burden and the inability or unwillingness to take on
more credit; alternatively, however, greater access to credit may
simply have allowed them to accelerate purchases they would have
made later, thereby damping subsequent demands. Moreover,
households in this group probably gained little from the run-up in
stock prices during the past two years, because they typically hold
very small amounts of equities. Thus, the experience of low-income
households--which, according to the BLS's Consumer Expenditure
Survey, account for a bit more than 20 percent of total
spending--may be one factor that has held the aggregate saving rate
up despite the increase in stock market wealth.
RATIO OF DEBT PAYMENTS TO INCOME,BY INCOME GROUP, 1992 AND 1995
(Median ratio among households with debt)
Household income(thousandsof 1995 dollars) 1992 1995
Less than 10 13.2 15.110-24.9 14.7 17.825-49.9 16.0 16.950-99.9 16.9 16.8100 and more 14.6 11.4
Source. Survey of Consumer Finances,1992 and 1995.
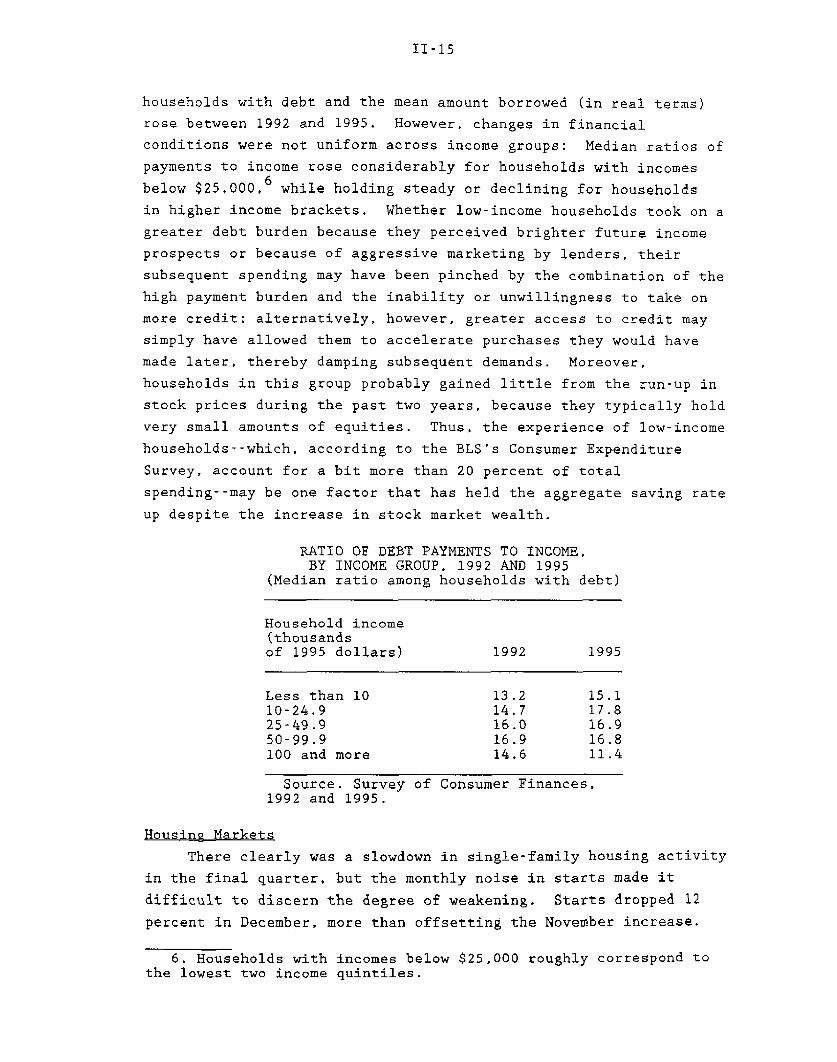
Housing Markets
There clearly was a slowdown in single-family housing activity
in the final quarter, but the monthly noise in starts made it
difficult to discern the degree of weakening. Starts dropped 12
percent in December, more than offsetting the November increase.
6. Households with incomes below $25,000 roughly correspond tothe lowest two income quintiles.
II-16
Private Housing Activity(Millions of units; seasonally adjusted annual rate)
1996P 1996
Q2 Q3 r Q4P Oct.r Nov. Dec.P
All unitsStarts 1.47 1.49 1.49 1.41 1.39 1.51 1.33Permits 1.43 1.44 1.43 1.40 1.36 1.42 1.41
Single-family unitsStarts 1.16 1.19 1.18 1.09 1.09 1.16 1.02Permits 1.07 1.10 1.06 1.02 1.01 1.03 1.02New home sales n.a. 0.74 0.79 n.a. 0.68 0.77 n.a.Existing home sales 4.09 4.21 4.11 3.95 3.97 4.01 3.87
Multifamily unitsStarts 0.31 0.31 0.31 0.32 0.30 0.35 0.31Permits 0.36 0.34 0.36 0.38 0.35 0.39 0.39
Mobile homesShipments n.a. 0.37 0.37 n.a. 0.37 0.35 n.a.
Note. p Preliminary. r Revised. n.a. Not available.
Private Housing Starts(Seasonally adjusted annual rate)
Millions of units
t Ir If ( Vj1 r L., Multifamily 1V Vi / I 95 1
Dec.
1977 1979 1981 1983 1985 1987 1989 1991 1993 1995 1997

II-17
However, unusually heavy precipitation late in the month,
particularly in the West, likely contributed to the falloff in
housing starts. 7 Single-family permit issuance, which is more
reliable statistically and less affected by weather, was little
changed last month. For the fourth quarter as a whole, starts and
permits were well aligned, and both were down appreciably from their
third-quarter levels.
Home sales have also slowed from the rapid third-quarter pace.
Although sales of new homes ticked up in November, the average sales
pace in October and November was down nearly 9 percent from the
average for the third quarter. In addition, the history of large
revisions to preliminary estimates of new home sales leaves open the
possibility that the November reading overstated the strength of
housing demand; the initial estimates for the two preceding months
were subsequently revised down about 35,000 units. Existing home
sales declined 3.8 percent in the fourth quarter to a 3.95 million
unit annual rate.
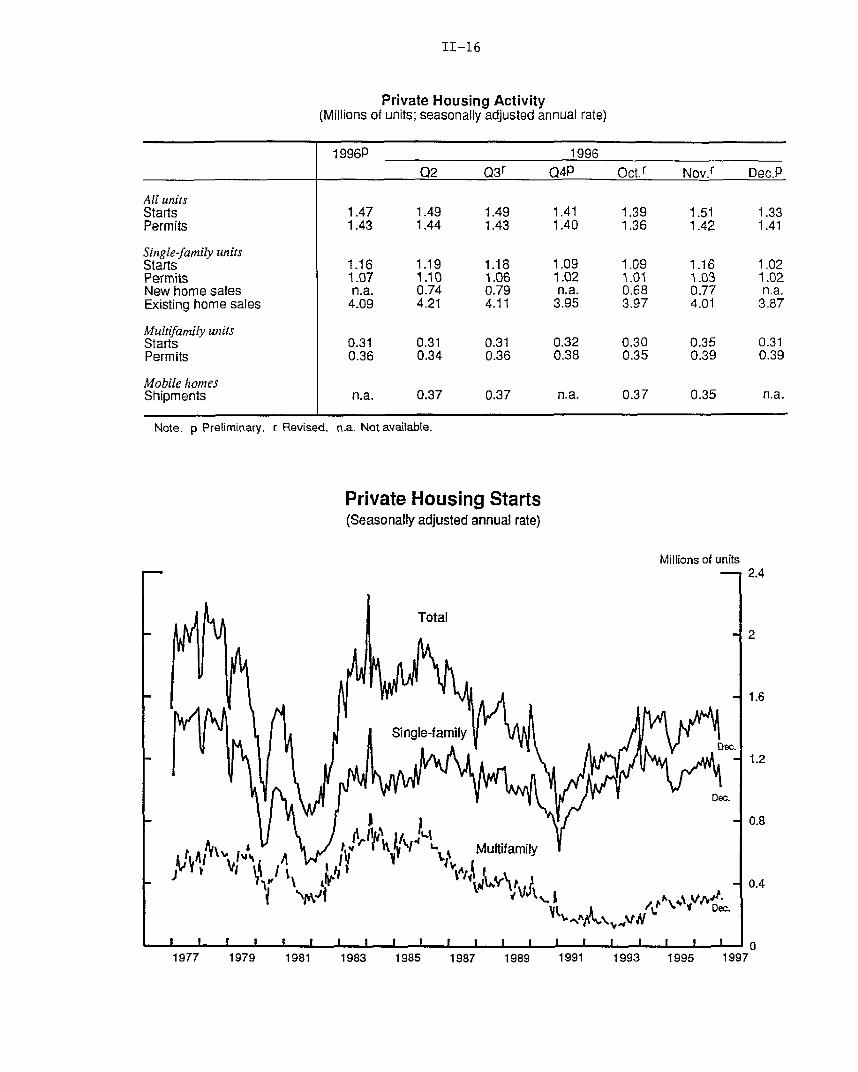
More recent indicators are somewhat ambiguous about the
strength of demand for single-family homes. An industry survey
showed that builders' assessments of new home sales weakened in
early January; however, respondents who rated current sales as good
still outnumber those who rate sales as poor. On the positive side,
home buying attitudes, as measured by the preliminary January
Michigan survey, jumped to their most optimistic level in nearly
three years. Finally, as in some earlier year-end periods,
applications for mortgages to purchase homes have been volatile in
recent weeks, likely reflecting the difficulty of seasonally
adjusting a rather short time series of weekly data to reflect the
Christmas and New Year's holidays. Over the latter part of 1996,
however, applications have shown no obvious trend.
Multifamily housing starts fell to 305,000 units in December, a
touch above the October level. Nevertheless, multifamily starts
increased nearly 13 percent in 1996 to the highest level for any
year since 1989. The vacancy rate for multifamily rental units
declined a bit in the fourth quarter but remains elevated relative
to the rate before the building boom in the mid-1980s.
7. As mentioned previously, BLS's estimate of constructionemployment refers to the second week of the month, when the weatherconditions were favorable. As a result, the employment figure wasnot affected by the poor weather later on.
II-18
Indicators of Housing Demand(Seasonally adjusted; FRB seasonals)
Builders' Rating of New Home Sales Diffusion index
1989 1990 1991 1992 1993 1994 1995 1996Note. The index is calculated from National Association of Homebuilders data as the proportion of respondents rating current sales as good
minus the proportion rating them as poor.
Consumer Homebuying Attitudes Diffusion index
Jan.
pI_ ~ p I p .1
1989 1990 1991 1992 1993 1994 1995Note. The homebuying attitudes index is calculated from Survey Research Center data as the proportion of respondents
rating current conditions as good minus the proportion rating such conditions as bad.
MBA Index of Mortgage Loan Applications for Home Purchase
1990 1991 1992Note. MBA index equals 100 on March 16, 1990, for NSA series.
Multifamily Rental Vacancy Rate
1993 1994 1995
1996
Index
Jan. 161
1996
Percent
1985 1988 19911982 1994 1997
II-19
Business Fixed Investment
Growth in real business fixed investment slowed considerably in
the fourth quarter from the 17-1/2 percent increase posted in the
third. Although nominal construction expenditures on nonresidential
structures reportedly skyrocketed during October and November,
nominal purchases of producers' durable equipment appear to have
been flat in recent months. Favorable financial market conditions,
good cash flow, and technological change--leading to rapid
obsolescence and falling prices--probably still are providing some
impetus to outlays. However, the level of investment last year was
already high enough to result in an increase in the stock of
producers' durable equipment of nearly 6 percent--a rapid pace by
historical standards.
Shipments of nondefense capital goods, excluding computers and
aircraft, increased 0.6 percent in December and only 0.7 percent
during the fourth quarter as a whole. Despite a strong December,
nominal computer shipments--which increased 4.4 percent in the third
quarter--fell 0.6 percent during the fourth quarter. The big swing
in computer shipments may be due, in part, to a shift in seasonal
patterns. There are reports that many computer manufacturers,
hoping to avoid the bottlenecks that have emerged near year-end over
the past few years, attempted to pull fourth-quarter demand into the
third quarter with aggressive pricing schemes last year. Shipments
of communications equipment edged down slightly in December from
their robust pace in November. Shipments of such equipment were up
5 percent for the fourth quarter and 16 percent for the year as a
whole, driven by healthy growth in the demand for cellular phone
services. Shipments of nondefense capital goods excluding aircraft,
office and computing, and communications equipment were little
changed during the fourth quarter. Looking ahead, recent large
increases in orders for communications equipment--which, though
falling sharply in December, still posted a healthy gain for the
fourth quarter--point to continued growth in spending. The
stagnation of new orders outside of the high-tech area suggests a
softening of demand for these goods.
Business purchases of transportation equipment were weak in the
fourth quarter. As had been expected, purchases of motor vehicles
declined markedly, as production shortfalls from the GM strikes
prompted cuts in fleet sales in October and November, and sales of
heavy trucks fell. Aircraft outlays are also likely to be a drag on
II-20
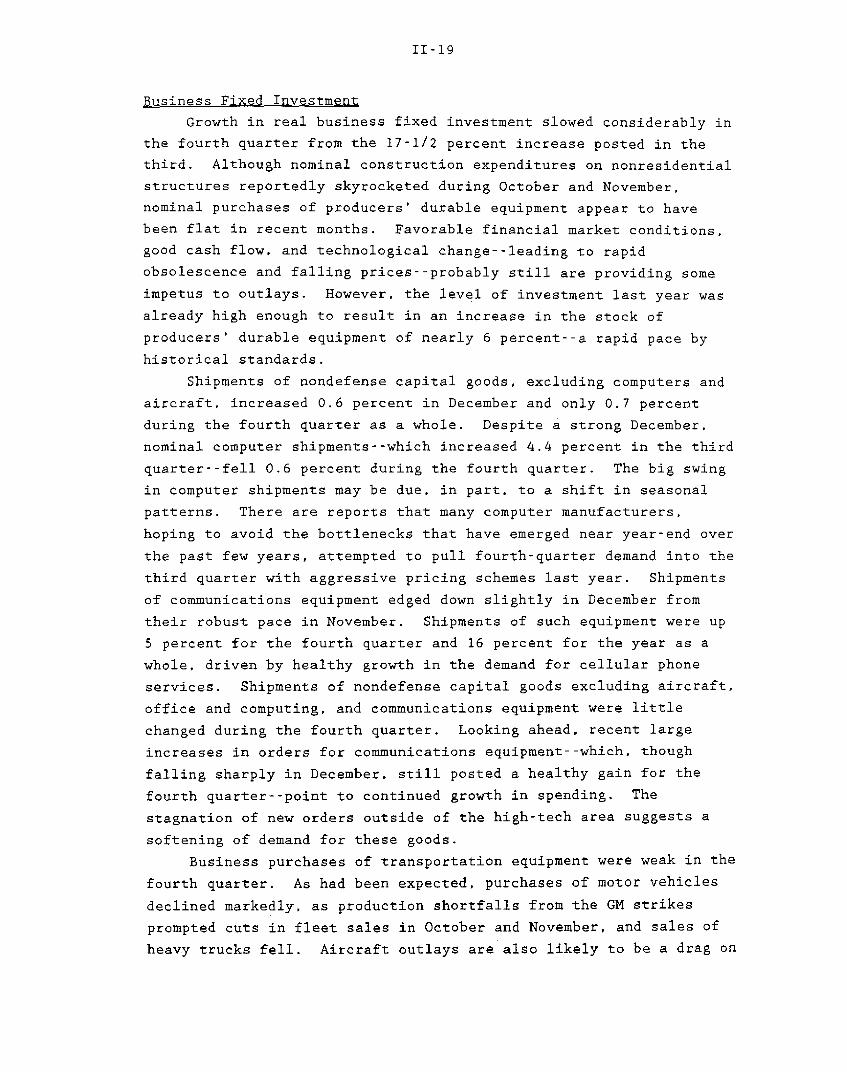
BUSINESS CAPITAL SPENDING INDICATORS(Percent change from preceding comparable period;
based on seasonally adjusted data, in current dollars)
1996 1996
Q1 Q2 Q3 Q4 Oct. Nov. Dec.
Producers' durable equipment
Shipments of nondefense capital goods -.5 2.9 1.8 1.5 -2.2 1.9 1.4Excluding aircraft and parts .8 1.5 1.5 .7 -2.3 1.5 .6Office and computing 3.7 -.8 4.4 -.6 -4.1 -.1 5.3Communications equipment -.3 4.7 4.5 5.1 -.4 5.4 -.5All other categories .0 1.7 -.3 .1 -2.2 1.2 -.8
Shipments of complete aircraft1 1.4 12.2 14.7 n.a. -20.1 15.7 n.a.
Sales of heavy trucks -2.2 1.2 -4.3 -1.8 8.6 -6.2 -1.0
Orders of nondefense capital goods 3.1 -6.5 4.9 .3 -.1 -7.5 -.5Excluding aircraft and parts 3.1 -1.7 2.6 -.6 2.0 -2.2 -2.8Office and computing 2.1 1.6 5.0 .3 .6 -2.8 10.4Communications equipment 8.7 -8.5 6.6 4.5 36.2 -14.3 -33.8All other categories 2.2 -1.2 .8 -2.3 -5.3 2.1 .8
Nonresidential structures
Construction put-in-place 1.0 .0 2.7 n.a. 4.3 2.3 n.a.Office -6.6 8.3 9.2 n.a. 5.9 .9 n.a.Other commercial 3.0 -1.0 1.4 n.a. 4.7 3.8 n.a.Institutional -2.9 1.2 8.2 n.a. 2.0 6.3 n.a.Industrial -1.6 -8.0 -1.0 n.a. 11.3 -6.3 n.a.Public utilities 4.5 3.1 -1.3 n.a. -.3 5.2 n.a.Lodging and miscellaneous 10.6 .0 4.5 n.a. 1.4 5.4 n.a.
Rotary drilling rigs in use 2 6.5 9.9 -4.0 -1.6 .9 -.5 1.5
Memo:Business fixed investment3 11.6 3.8 17.5 n.a. n.a. n.a. n.a.
Producers' durable equipment 3 13.1 6.7 20.9 n.a. n.a. n.a. n.a.Nonresidential structures3 7.7 -3.7 8.4 n.a. n.a. n.a. n.a.
1. From the Current Industrial Report "Civil Aircraft and Aircraft Engines."Monthly data are seasonally adjusted using FRB seasonal factors constrained toBEA quarterly seasonal factors. Quarterly data are seasonally adjusted usingBEA seasonal factors.
2. Percent change of number of rigs in use, seasonally adjusted.3. Based on 1992 chain-weighted data; percent change, annual rate.n.a. Not available.
II-21
Nonresidential Construction and Contracts(Six-month moving average)
Total Building index, Dec. 1982 = 100, ratio scale
1980 1982 1984 1986 1988 1990 1992 1994 1996
Other Commercial
1984 1986 1988 1990 1992 1994 1996
Industrial
1984 1986 1988 1990 1992 1994 1996
Institutional
I I 1 1 1 1 I 1 1 1 1.1 1
1984 1986 1988 1990 1992 1994 1996 1984 1986 1988 1990 1992 1994 1996
Note. For contracts, total includes private only, while individual sectors include public and private.
Office
II-22
Nonresidential Construction IndicatorsCB Commercial Vacancy Rates
Square footage available
Suburban office
Percent
-I IQ3
Downtown office
N"
1990 1991 1992 1993 1994 1995 1996
National Real Estate Price Index *Percent
1986 1988 1990 1992 1994 1996
* Data are semiannual from 1986 to 1991, and quarterly from 1992 to present.
FDIC SurveyDiffusion index
'What would you say is the general direction of the commercial market nowcompared with three months ago?'
I I 1 I I
1991 1992 1993 1994 1995 1996
II-23
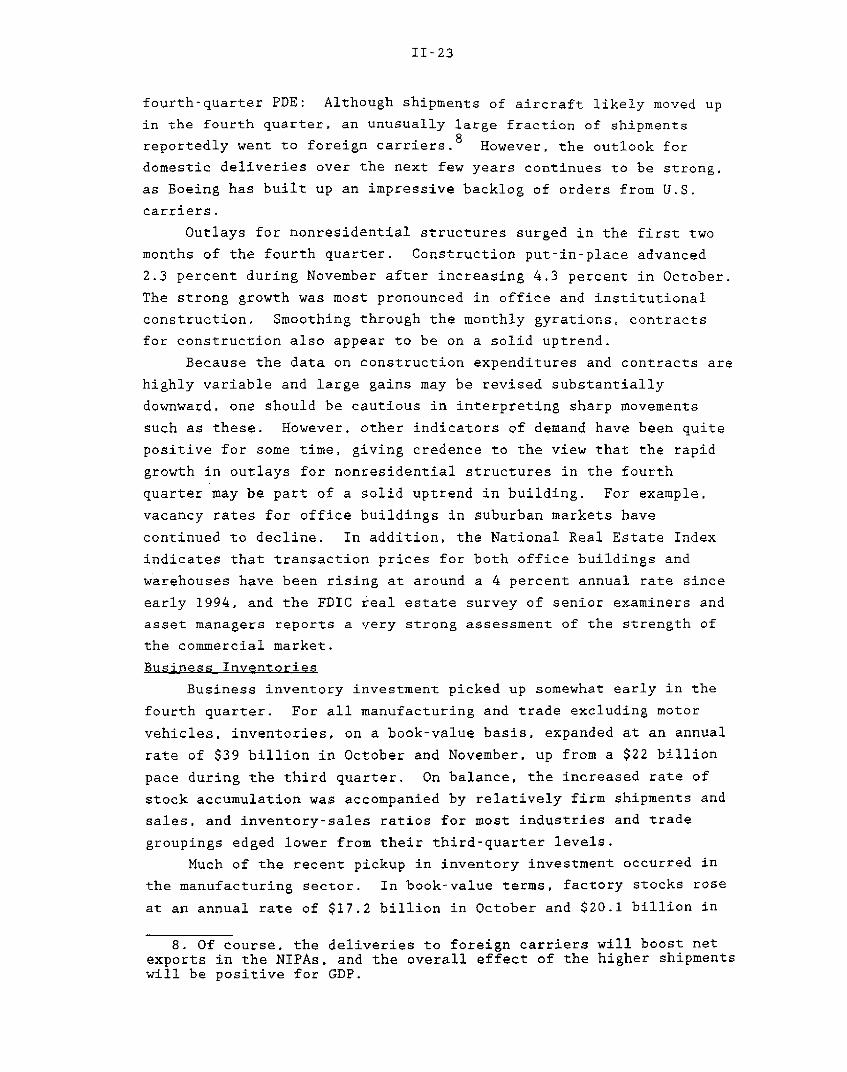
fourth-quarter PDE: Although shipments of aircraft likely moved up
in the fourth quarter, an unusually large fraction of shipments
reportedly went to foreign carriers.8 However, the outlook for
domestic deliveries over the next few years continues to be strong,
as Boeing has built up an impressive backlog of orders from U.S.
carriers.
Outlays for nonresidential structures surged in the first two
months of the fourth quarter. Construction put-in-place advanced
2.3 percent during November after increasing 4.3 percent in October.
The strong growth was most pronounced in office and institutional
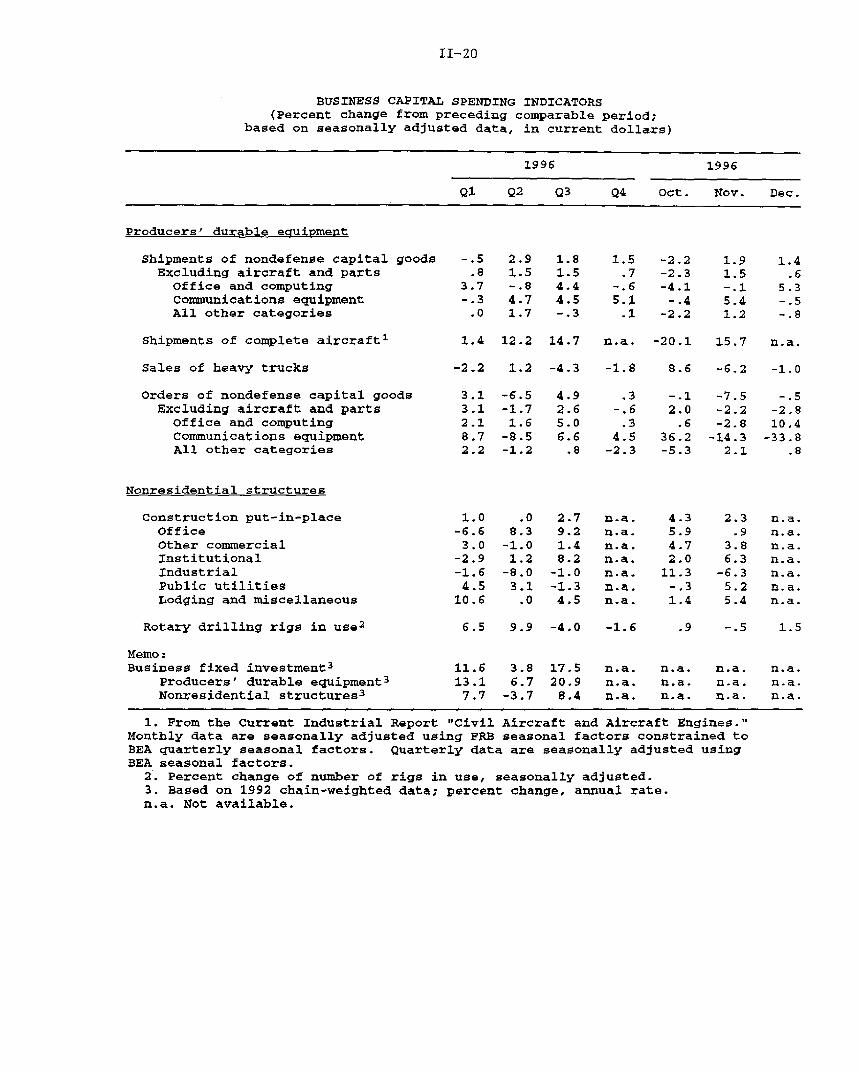
construction. Smoothing through the monthly gyrations, contracts
for construction also appear to be on a solid uptrend.
Because the data on construction expenditures and contracts are
highly variable and large gains may be revised substantially
downward, one should be cautious in interpreting sharp movements
such as these. However, other indicators of demand have been quite
positive for some time, giving credence to the view that the rapid
growth in outlays for nonresidential structures in the fourth
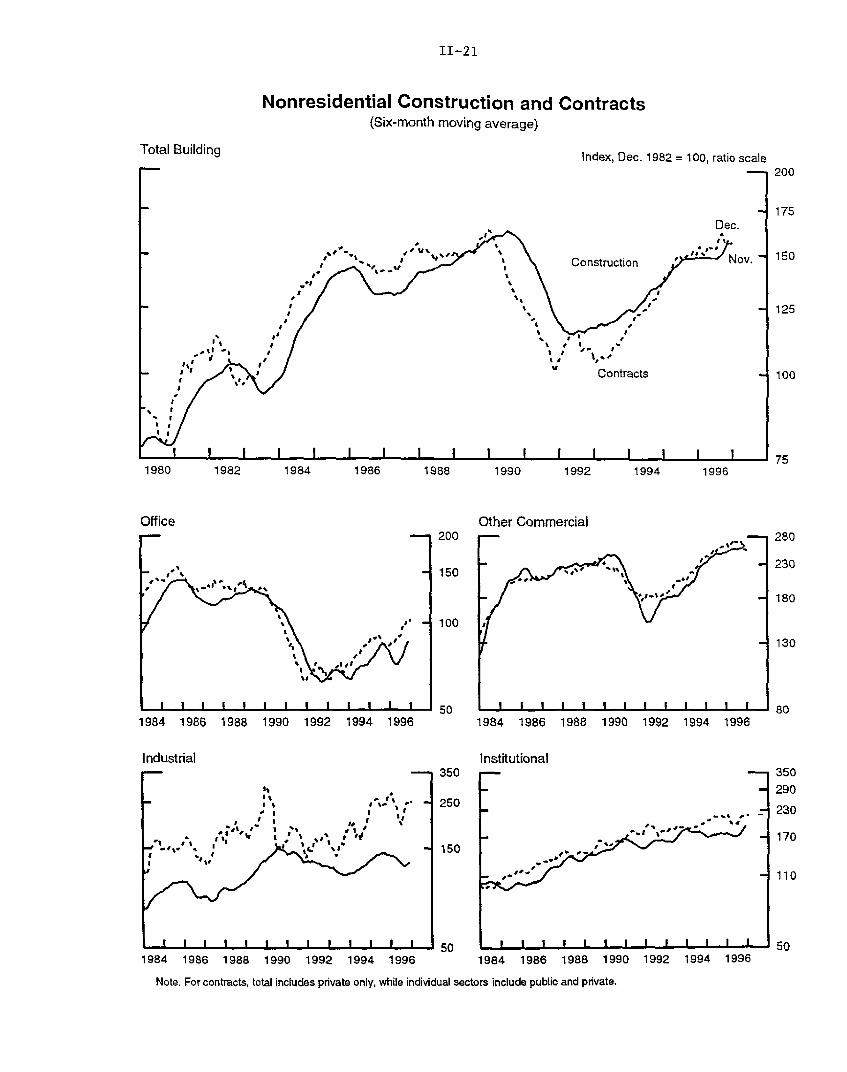
quarter may be part of a solid uptrend in building. For example,
vacancy rates for office buildings in suburban markets have
continued to decline. In addition, the National Real Estate Index
indicates that transaction prices for both office buildings and
warehouses have been rising at around a 4 percent annual rate since
early 1994, and the FDIC real estate survey of senior examiners and
asset managers reports a very strong assessment of the strength of
the commercial market.
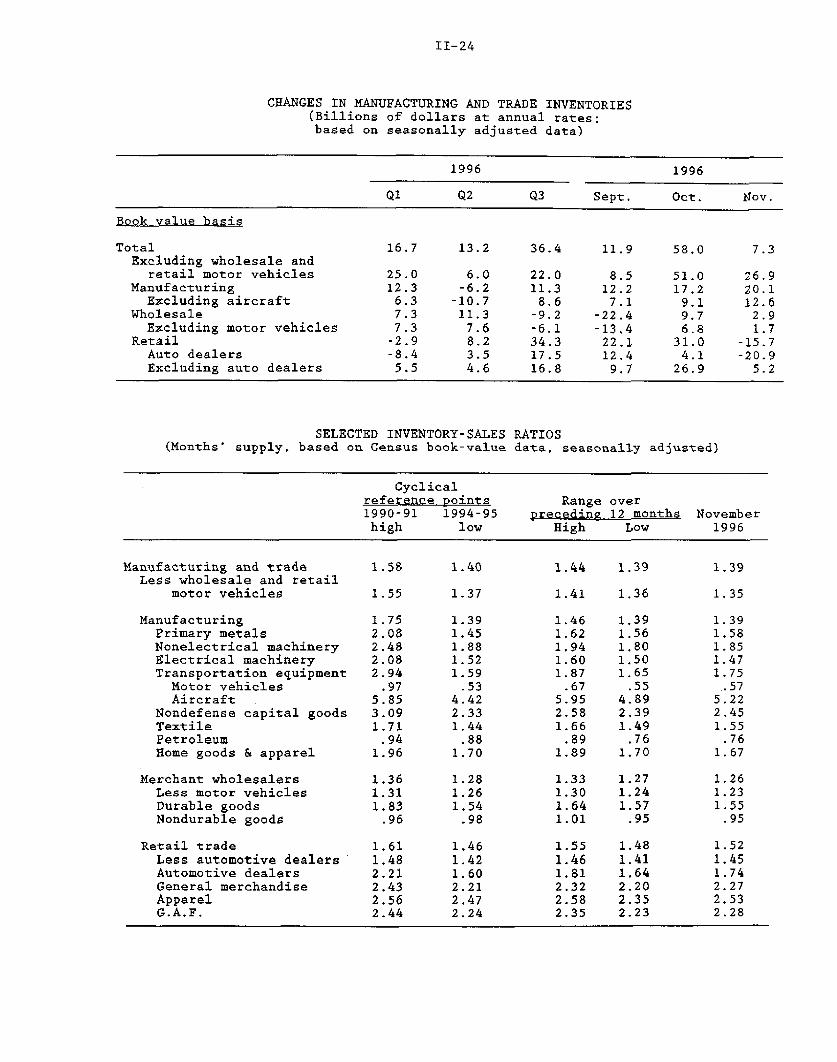
Business Inventories
Business inventory investment picked up somewhat early in the
fourth quarter. For all manufacturing and trade excluding motor
vehicles, inventories, on a book-value basis, expanded at an annual
rate of $39 billion in October and November, up from a $22 billion
pace during the third quarter. On balance, the increased rate of
stock accumulation was accompanied by relatively firm shipments and
sales, and inventory-sales ratios for most industries and trade
groupings edged lower from their third-quarter levels.
Much of the recent pickup in inventory investment occurred in
the manufacturing sector. In book-value terms, factory stocks rose
at an annual rate of $17.2 billion in October and $20.1 billion in
8. Of course, the deliveries to foreign carriers will boost netexports in the NIPAs, and the overall effect of the higher shipmentswill be positive for GDP.
II-24
CHANGES IN MANUFACTURING AND TRADE INVENTORIES(Billions of dollars at annual rates:based on seasonally adjusted data)
1996 1996
Q1 Q2 Q3 Sept. Oct. Nov.
Book value basis
Total 16.7 13.2 36.4 11.9 58.0 7.3Excluding wholesale and
retail motor vehicles 25.0 6.0 22.0 8.5 51.0 26.9Manufacturing 12.3 -6.2 11.3 12.2 17.2 20.1
Excluding aircraft 6.3 -10.7 8.6 7.1 9.1 12.6Wholesale 7.3 11.3 -9.2 -22.4 9.7 2.9
Excluding motor vehicles 7.3 7.6 -6.1 -13.4 6.8 1.7Retail -2.9 8.2 34.3 22.1 31.0 -15.7
Auto dealers -8.4 3.5 17.5 12.4 4.1 -20.9Excluding auto dealers 5.5 4.6 16.8 9.7 26.9 5.2
SELECTED INVENTORY-SALES RATIOS(Months' supply, based on Census book-value data, seasonally adjusted)
Cyclicalreference points Range over1990-91 1994-95 preceding 12 months Novemberhigh low High Low 1996
Manufacturing and trade 1.58 1.40 1.44 1.39 1.39Less wholesale and retail
motor vehicles 1.55 1.37 1.41 1.36 1.35
Manufacturing 1.75 1.39 1.46 1.39 1.39Primary metals 2.08 1.45 1.62 1.56 1.58Nonelectrical machinery 2.48 1.88 1.94 1.80 1.85Electrical machinery 2.08 1.52 1.60 1.50 1.47Transportation equipment 2.94 1.59 1.87 1.65 1.75
Motor vehicles .97 .53 .67 .55 .57Aircraft 5.85 4.42 5.95 4.89 5.22
Nondefense capital goods 3.09 2.33 2.58 2.39 2.45Textile 1.71 1.44 1.66 1.49 1.55Petroleum .94 .88 .89 .76 .76Home goods & apparel 1.96 1.70 1.89 1.70 1.67
Merchant wholesalers 1.36 1.28 1.33 1.27 1.26Less motor vehicles 1.31 1.26 1.30 1.24 1.23Durable goods 1.83 1.54 1.64 1.57 1.55Nondurable goods .96 .98 1.01 .95 .95
Retail trade 1.61 1.46 1.55 1.48 1.52Less automotive dealers 1.48 1.42 1.46 1.41 1.45Automotive dealers 2.21 1.60 1.81 1.64 1.74General merchandise 2.43 2.21 2.32 2.20 2.27Apparel 2.56 2.47 2.58 2.35 2.53G.A.F. 2.44 2.24 2.35 2.23 2.28
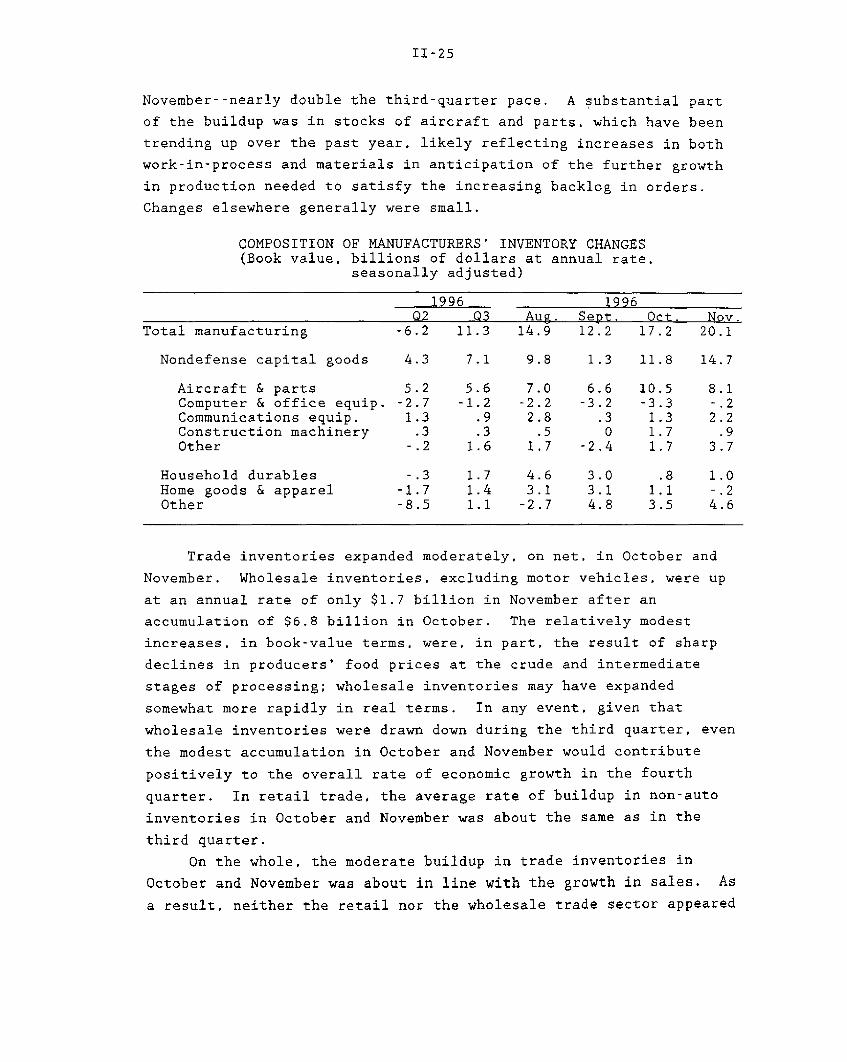
II-25
November--nearly double the third-quarter pace. A substantial part
of the buildup was in stocks of aircraft and parts, which have been
trending up over the past year, likely reflecting increases in both
work-in-process and materials in anticipation of the further growth
in production needed to satisfy the increasing backlog in orders.
Changes elsewhere generally were small.
COMPOSITION OF MANUFACTURERS' INVENTORY CHANGES(Book value, billions of dollars at annual rate,
seasonally adjusted)
1996 1996Q2 Q3 Aug. Sept. Oct. Nov.
Total manufacturing -6.2 11.3 14.9 12.2 17.2 20.1
Nondefense capital goods 4.3 7.1 9.8 1.3 11.8 14.7
Aircraft & parts 5.2 5.6 7.0 6.6 10.5 8.1Computer & office equip. -2.7 -1.2 -2.2 -3.2 -3.3 -.2Communications equip. 1.3 .9 2.8 .3 1.3 2.2Construction machinery .3 .3 .5 0 1.7 .9Other -.2 1.6 1.7 -2.4 1.7 3.7
Household durables -.3 1.7 4.6 3.0 .8 1.0Home goods & apparel -1.7 1.4 3.1 3.1 1.1 -.2Other -8.5 1.1 -2.7 4.8 3.5 4.6
Trade inventories expanded moderately, on net, in October and
November. Wholesale inventories, excluding motor vehicles, were up
at an annual rate of only $1.7 billion in November after an
accumulation of $6.8 billion in October. The relatively modest
increases, in book-value terms, were, in part, the result of sharp
declines in producers' food prices at the crude and intermediate
stages of processing; wholesale inventories may have expanded
somewhat more rapidly in real terms. In any event, given that
wholesale inventories were drawn down during the third quarter, even
the modest accumulation in October and November would contribute
positively to the overall rate of economic growth in the fourth
quarter. In retail trade, the average rate of buildup in non-auto
inventories in October and November was about the same as in the
third quarter.
On the whole, the moderate buildup in trade inventories in
October and November was about in line with the growth in sales. As
a result, neither the retail nor the wholesale trade sector appeared
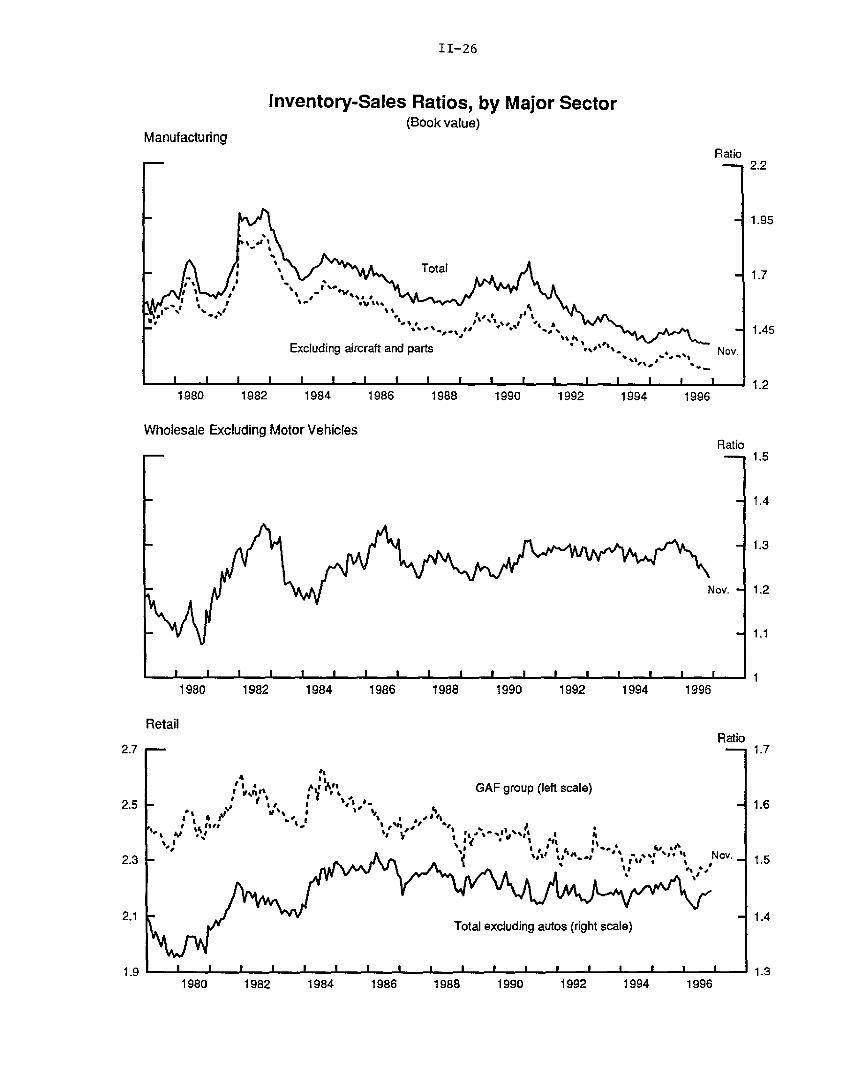
II-26
Inventory-Sales Ratios, by Major Sector(Book value)
ManufacturingRatio
2.2
S1.95
1980 1982 1984 1986 1988 1990 1992 1994 1996
Wholesale Excluding Motor VehiclesRatio
1.5
- 1.4
- 1.3
- Nov. 1.2
-1.1
1980 1982 1984 1986 1988 1990 1992 1994 1996
RetailRatio
2.7 - - 1.7
SIt
/ ' ,* ''"\ GAF group (left scale)2.5 - ' - - 1.6
A--ludin ",tcraft a i , " ".' "" Z Nov.2.3 let ,, ' /, ,- ' /, " ' , 1.5
2.1 .. 1.42.3 An "". i , *", ' ' No . ^
1982 1984 1986 1988 1990 1992 19941980 1996
II-27
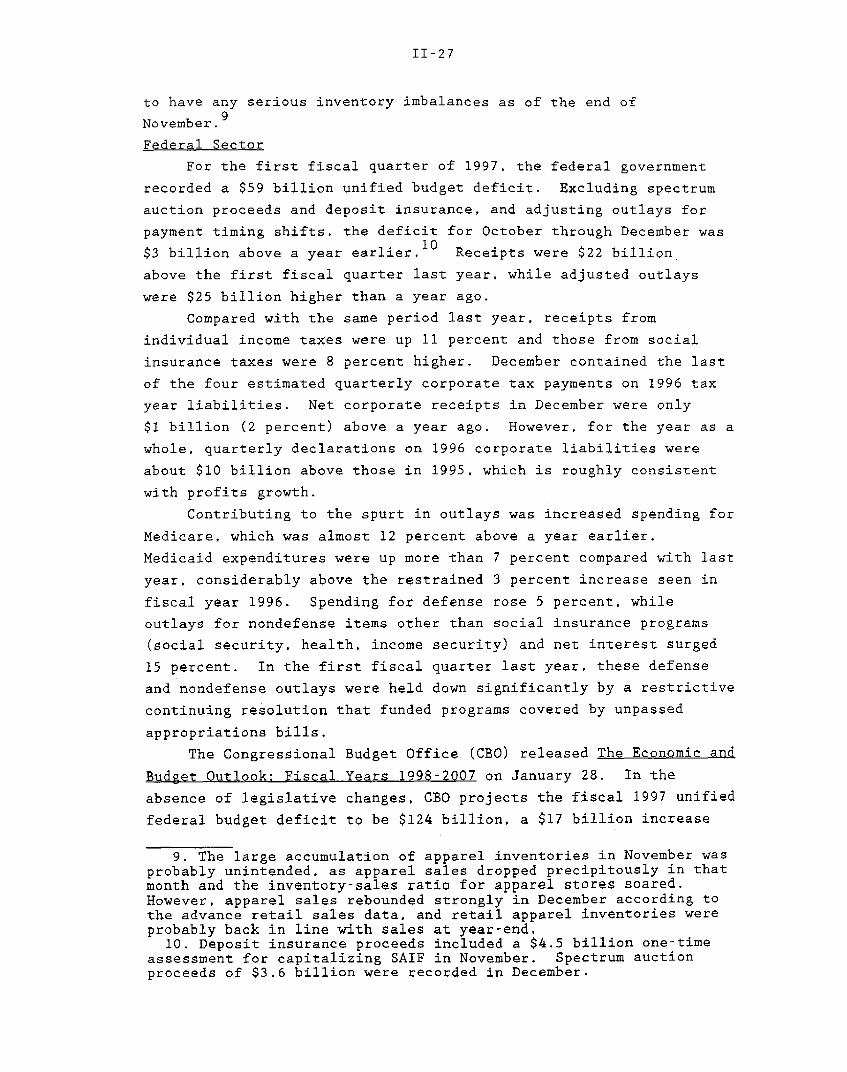
to have any serious inventory imbalances as of the end of
November.
Federal Sector
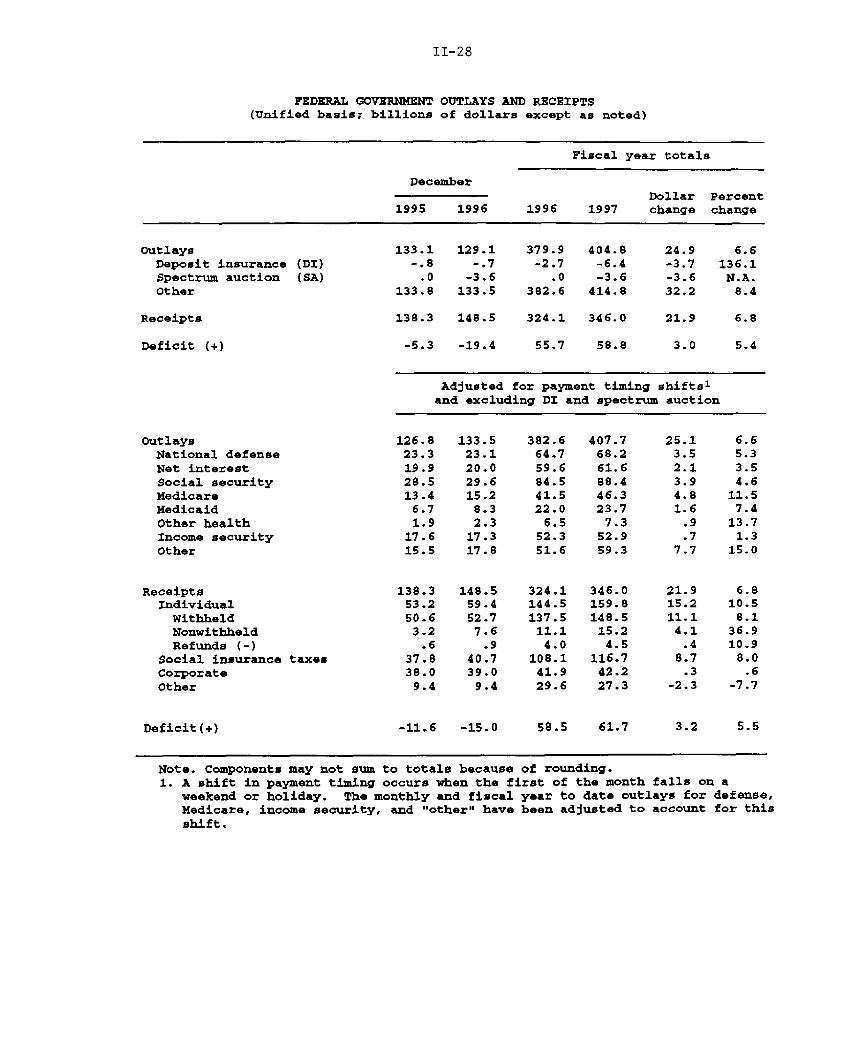
For the first fiscal quarter of 1997, the federal government
recorded a $59 billion unified budget deficit. Excluding spectrum
auction proceeds and deposit insurance, and adjusting outlays for
payment timing shifts, the deficit for October through December was
$3 billion above a year earlier.10 Receipts were $22 billion
above the first fiscal quarter last year, while adjusted outlays
were $25 billion higher than a year ago.
Compared with the same period last year, receipts from
individual income taxes were up 11 percent and those from social
insurance taxes were 8 percent higher. December contained the last
of the four estimated quarterly corporate tax payments on 1996 tax
year liabilities. Net corporate receipts in December were only
$1 billion (2 percent) above a year ago. However, for the year as a
whole, quarterly declarations on 1996 corporate liabilities were
about $10 billion above those in 1995, which is roughly consistent
with profits growth.
Contributing to the spurt in outlays was increased spending for
Medicare, which was almost 12 percent above a year earlier.
Medicaid expenditures were up more than 7 percent compared with last
year, considerably above the restrained 3 percent increase seen in
fiscal year 1996. Spending for defense rose 5 percent, while
outlays for nondefense items other than social insurance programs
(social security, health, income security) and net interest surged
15 percent. In the first fiscal quarter last year, these defense
and nondefense outlays were held down significantly by a restrictive
continuing resolution that funded programs covered by unpassed
appropriations bills.
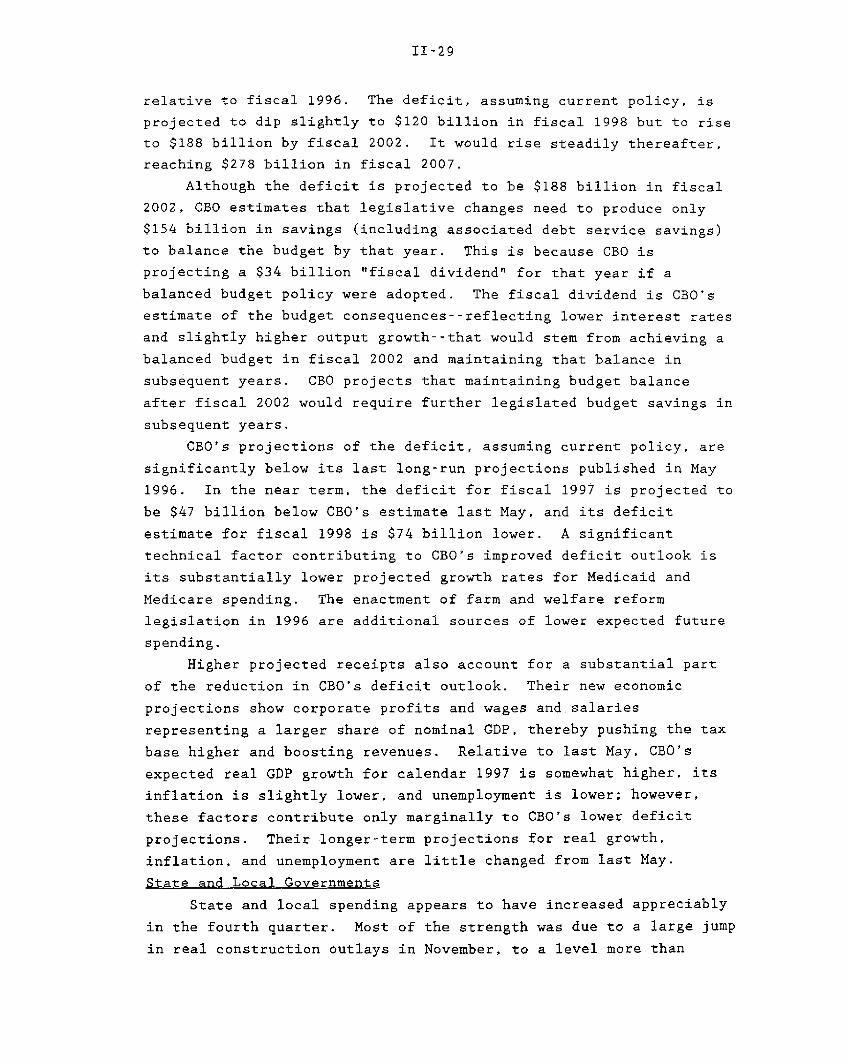
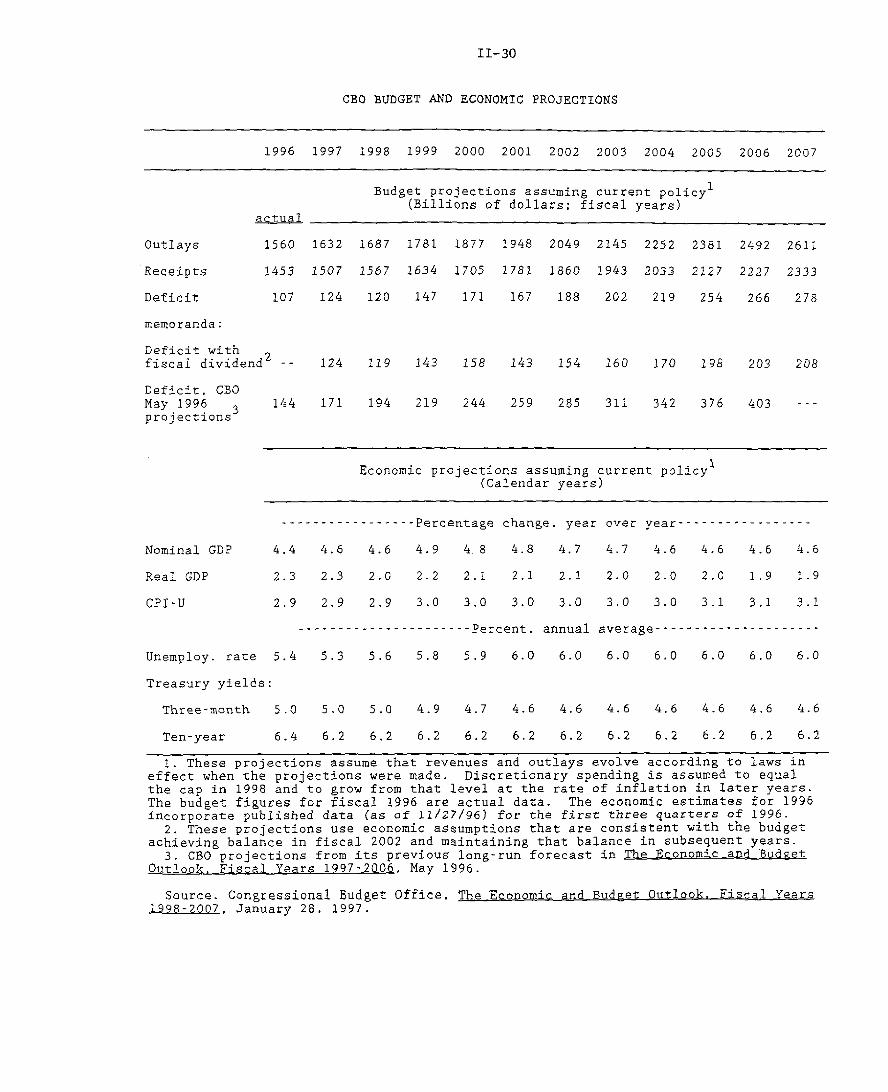
The Congressional Budget Office (CBO) released The Economic and
Budget Outlook: Fiscal Years 1998-2007 on January 28. In the
absence of legislative changes, CBO projects the fiscal 1997 unified
federal budget deficit to be $124 billion, a $17 billion increase
9. The large accumulation of apparel inventories in November wasprobably unintended, as apparel sales dropped precipitously in thatmonth and the inventory-sales ratio for apparel stores soared.However, apparel sales rebounded strongly in December according tothe advance retail sales data, and retail apparel inventories wereprobably back in line with sales at year-end.
10. Deposit insurance proceeds included a $4.5 billion one-timeassessment for capitalizing SAIF in November. Spectrum auctionproceeds of $3.6 billion were recorded in December.
II-28
FEDERAL GOVERNMENT OUTLAYS AND RECEIPTS(Unified basis; billions of dollars except as noted)
Fiscal year totals
DecemberDollar Percent
1995 1996 1996 1997 change change
OutlaysDeposit insuranceSpectrum auctionOther
Receipts
Deficit (+)
(DI)(SA)
133.1-. 8.0
133.8
129.1-.7
-3.6133.5
138.3 148.5
-5.3 -19.4
379.9-2.7
.0382.6
404.8-6.4-3.6
414.8
324.1 346.0
55.7 58.8
Adjusted for payment timing shifts 1
and excluding DI and spectrum auction
OutlaysNational defenseNet interestSocial securityMedicareMedicaidOther healthIncome securityOther
ReceiptsIndividualWithheldNonwithheldRefunds (-)
Social insurance taxesCorporateOther
126.823.319.928.513.4
6.71.9
17.615.5
138.353.250.63.2.6
37.838.09.4
Deficit(+) -11.6 -15.0 58.5 61.7
Note. Components may not sum to totals because of rounding.1. A shift in payment timing occurs when the first of the month falls on a
weekend or holiday. The monthly and fiscal year to date outlays for defense,Medicare, income security, and "other" have been adjusted to account for this
shift.
24.9-3.7-3.632.2
21.9
3.0
6.6136.1N.A.
8.4
6.8
5.4
133.523.120.029.615.28.32.3
17.317.8
148.559.452.7
7.6.9
40.739.09.4
382.664.759.684.541.522.0
6.552.351.6
324.1144.5137.511.1
4.0108.1
41.929.6
407.768.261.688.446.323.77.352.959.3
346.0159.8148.515.24.5
116.742.227.3
25.13.52.13.94.81.6.9.7
7.7
21.915.211.1
4.1.4
8.7.3
-2.3
6.65.33.54.611.57.4
13.71.3
15.0
6.810.5
8.136.910.98.0
.6-7.7
II-29
relative to fiscal 1996. The deficit, assuming current policy, is
projected to dip slightly to $120 billion in fiscal 1998 but to rise
to $188 billion by fiscal 2002. It would rise steadily thereafter,
reaching $278 billion in fiscal 2007.
Although the deficit is projected to be $188 billion in fiscal
2002, CBO estimates that legislative changes need to produce only
$154 billion in savings (including associated debt service savings)
to balance the budget by that year. This is because CBO is
projecting a $34 billion "fiscal dividend" for that year if a
balanced budget policy were adopted. The fiscal dividend is CBO's
estimate of the budget consequences--reflecting lower interest rates
and slightly higher output growth--that would stem from achieving a
balanced budget in fiscal 2002 and maintaining that balance in
subsequent years. CBO projects that maintaining budget balance
after fiscal 2002 would require further legislated budget savings in
subsequent years.
CBO's projections of the deficit, assuming current policy, are
significantly below its last long-run projections published in May
1996. In the near term, the deficit for fiscal 1997 is projected to
be $47 billion below CBO's estimate last May, and its deficit
estimate for fiscal 1998 is $74 billion lower. A significant
technical factor contributing to CBO's improved deficit outlook is
its substantially lower projected growth rates for Medicaid and
Medicare spending. The enactment of farm and welfare reform
legislation in 1996 are additional sources of lower expected future
spending.
Higher projected receipts also account for a substantial part
of the reduction in CBO's deficit outlook. Their new economic
projections show corporate profits and wages and salaries
representing a larger share of nominal GDP, thereby pushing the tax
base higher and boosting revenues. Relative to last May, CBO's
expected real GDP growth for calendar 1997 is somewhat higher, its
inflation is slightly lower, and unemployment is lower; however,
these factors contribute only marginally to CBO's lower deficit
projections. Their longer-term projections for real growth,
inflation, and unemployment are little changed from last May.
State and Local Governments
State and local spending appears to have increased appreciably
in the fourth quarter. Most of the strength was due to a large jump
in real construction outlays in November, to a level more than
II-30
CBO BUDGET AND ECONOMIC PROJECTIONS
1996 1997 1998 1999 2000 2001 2002 2003 2004 2005 2006 2007
Budget projections assuming current policy 1
(Billions of dollars; fiscal years)
Outlays
Receipts
Deficit
memoranda:
1560 1632 1687 1781 1877 1948 2049 2145 2252 2381
1453 1507 2567 1634 1705 1781 1860 1943 2033 2127
107 124 120 147 171 167 188 202 219 254
2492 2611
2227 2333
266 278
Deficit withfiscal dividend2 - 124 119 143 158 143 154 160 170 198
Deficit, CBOMay 1996projections
144 171 194 219 244 259 285 311 342 376
Economic projections assuming current policy'(Calendar years)
---.----..-----. Percentage change, year over year----------------
Nominal GDP
Real GDP
CPI-U
4.4 4.6 4.6
2.3 2.3 2.0
2.9 2.9 2.9
4.9 4 8 4.8 4.7 4.7 4.6 4.6 4.6
2.2 2.1 2.1 2.1 2.0 2.0
3.0 3.0 3.0 3.0 3.0 3.0
2.0 1.9
3.1 3.1 3.1
---------------------- Percent, annual average---------------------
Unemploy. rate 5.4 5.3 5.6
Treasury yields:
Three-month 5.0
Ten-year
5.0 5.0 4.9
6.4 6.2 6.2 6.2
5.8 5.9 6.0 6.0 6.0 6.0
4.7 4.6 4.6 4.6 4.6
6.2 6.2 6.2 6.2 6.2
6.0 6.0 6.0
4.6 4.6 4.6
6.2 6.2 6.2
1. These projections assume that revenues and outlays evolve according to laws ineffect when the projections were made. Discretionary spending is assumed to equalthe cap in 1998 and to grow from that level at the rate of inflation in later years.The budget figures for fiscal 1996 are actual data. The economic estimates for 1996incorporate published data (as of 11/27/96) for the first three quarters of 1996.2. These projections use economic assumptions that are consistent with the budget
achieving balance in fiscal 2002 and maintaining that balance in subsequent years.3. CBO projections from its previous long-run forecast in The Economic and Budget
Outlook. Fiscal Years 1997-2006, May 1996.
Source. Congressional Budget Office, The Economic and Budget Outlook._ iscal Years.998-2D007 January 28, 1997.
actual
203 208
~------
II-31
6 percent above the third-quarter average. 11 The largest gains
were in spending on educational and other buildings. Meanwhile, the
rise in employment in December was not enough to offset the three
preceding months of declines, and the level of state and local
employment in the fourth quarter stood a bit below the third-quarter
average.
A December survey of the states by the National Conference of
State Legislatures suggests that the fiscal position of most states
continues to be good. Most states expect revenue collections to be
on or above target through the remainder of fiscal 1997, which ends
on June 30; only Hawaii and Idaho expect a decline. The key fiscal
issues facing the legislatures in the sessions just getting under
way are implementing welfare reform, funding primary and secondary
education and corrections, enacting tax cuts, and addressing
Medicaid requirements.
Labor Costs and Prices
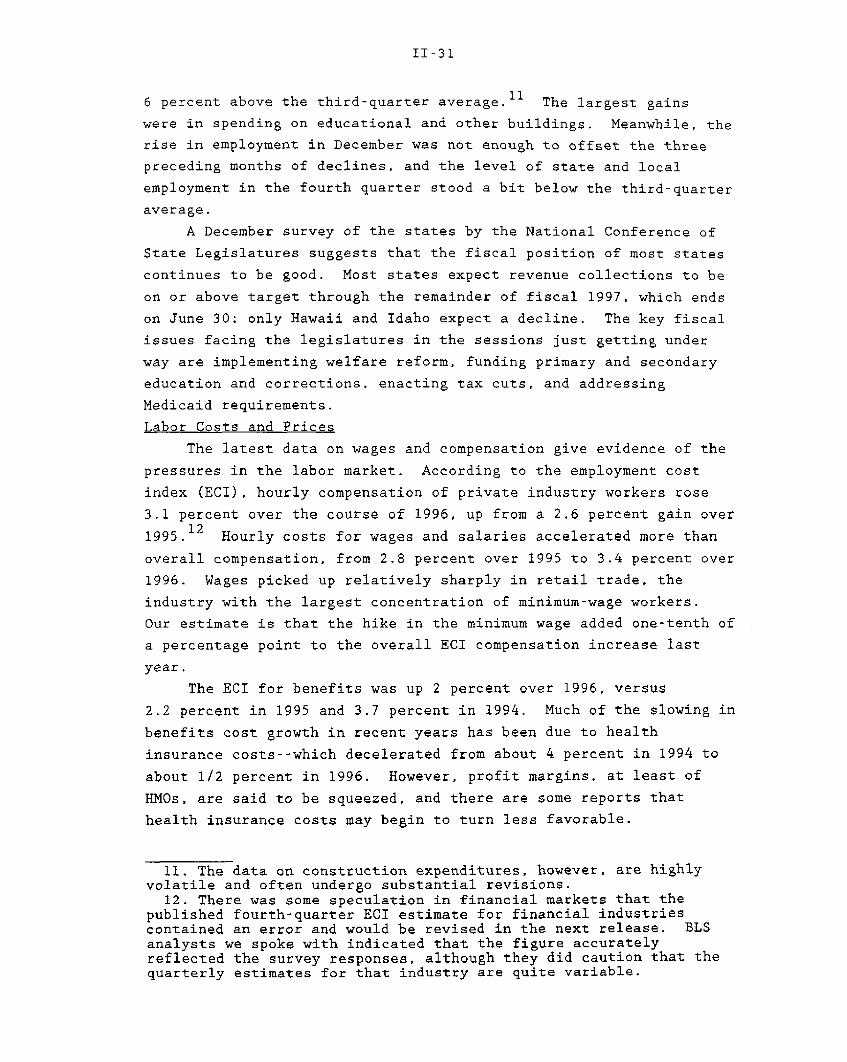
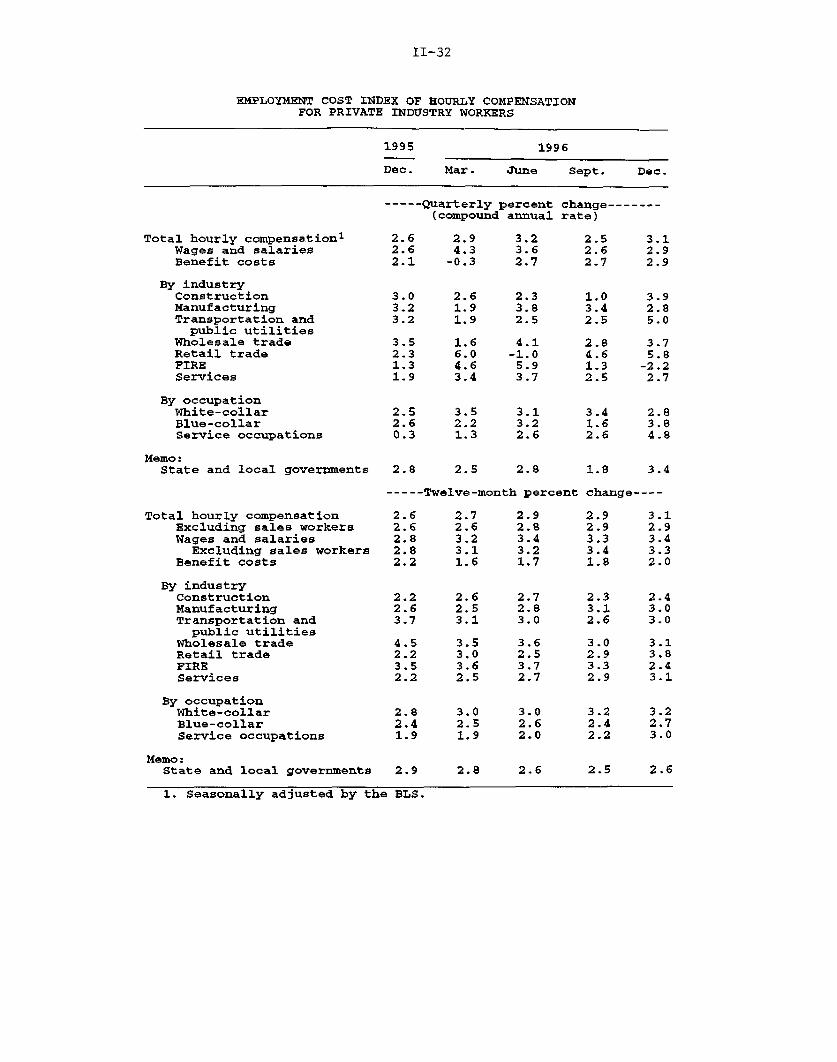
The latest data on wages and compensation give evidence of the
pressures in the labor market. According to the employment cost
index (ECI), hourly compensation of private industry workers rose
3.1 percent over the course of 1996, up from a 2.6 percent gain over
1995. 12 Hourly costs for wages and salaries accelerated more than
overall compensation, from 2.8 percent over 1995 to 3.4 percent over
1996. Wages picked up relatively sharply in retail trade, the
industry with the largest concentration of minimum-wage workers.
Our estimate is that the hike in the minimum wage added one-tenth of
a percentage point to the overall ECI compensation increase last
year.
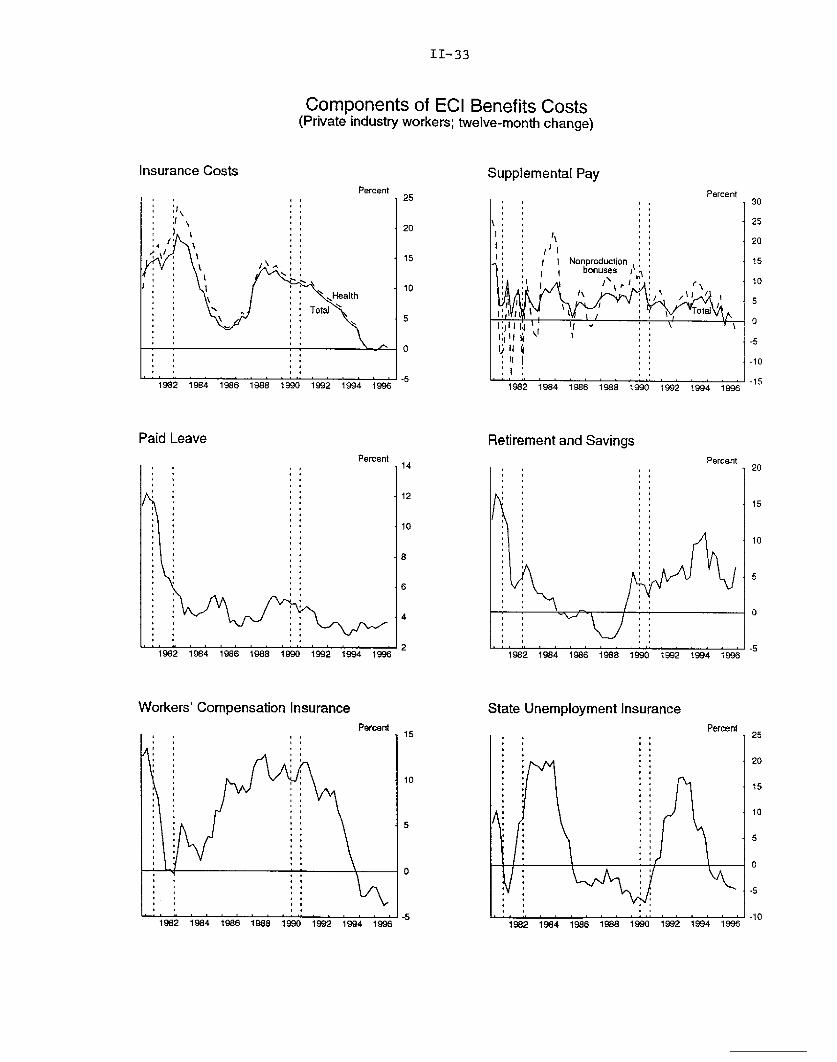
The ECI for benefits was up 2 percent over 1996, versus
2.2 percent in 1995 and 3.7 percent in 1994. Much of the slowing in
benefits cost growth in recent years has been due to health
insurance costs--which decelerated from about 4 percent in 1994 to
about 1/2 percent in 1996. However, profit margins, at least of
HMOs, are said to be squeezed, and there are some reports that
health insurance costs may begin to turn less favorable.
11. The data on construction expenditures, however, are highlyvolatile and often undergo substantial revisions.
12. There was some speculation in financial markets that thepublished fourth-quarter ECI estimate for financial industriescontained an error and would be revised in the next release. BLSanalysts we spoke with indicated that the figure accuratelyreflected the survey responses, although they did caution that thequarterly estimates for that industry are quite variable.
II-32
EMPLOYMENT COST INDEX OF HOURLY COMPENSATIONFOR PRIVATE INDUSTRY WORKERS
1995 1996
Dec. Mar. June Sept. Dec.
----- Quarterly percent(compound annual
Total hourly compensation 1
Wages and salariesBenefit costs
By industryConstructionManufacturingTransportation andpublic utilities
Wholesale tradeRetail tradeFIREServices
By occupationWhite-collarBlue-collarService occupations
Memo:State and local governments
2.6 2.92.6 4.32.1 -0.3
3.03.23.2
3.52.31.31.9
2.52.60.3
2.8
2.61.91.9
1.66.04.63.4
3.23.62.7
2.33.82.5
4.1-1.0
5.93.7
change-------rate)
2.5 3.12.6 2.92.7 2.9
1.0 3.93.4 2.82.5 5.0
2.8 3.74.6 5.81.3 -2.22.5 2.7
3.4 2.81.6 3.82.6 4.8
1.8
----- Twelve-month percent change----
Total hourly compensationExcluding sales workersWages and salaries
Excluding sales workersBenefit costs
By industryConstructionManufacturingTransportation andpublic utilities
Wholesale tradeRetail tradeFIREServices
By occupationWhite-collarBlue-collarService occupations
Memo:State and local governments
1. Seasonally adjusted by the
2.92.83.43.21.7
2.6 2.72.5 2.83.1 3.0
4.5 3.5 3.62.2 3.0 2.53.5 3.6 3.72.2 2.5 2.7
2.82.41.9
2.9
BLS.
2.92.93.33.41.8
2.43.03.0
3.13.82.43.1
3.22.73.0
2.6
1
II-33
Components of ECI Benefits Costs(Private industry workers; twelve-month change)
Insurance CostsPercent
25
: \
S\20
Health
SJ I Total-5
192 1984 196 1988 990 1992 1994 1996
19821841986.188 .19.0.19.2......-51982 1984 1986 1988 1990 1992 1994 1996
Paid Leave
Percent1 14
Supplemental PayPercent
Retirement and Savings
Workers' Compensation InsurancePercent
1982 1984 1986 1988 1990 1992 1i
State Unemployment InsurancePercent
II-34
CPI AND PPI INFLATION RATES(Percent change)
From twelvemonths earlier 1996 1996
Dec. Dec.1995 1996 Q3 Q4 Nov. Dec.
-Annual rate- -Monthly rate-
CPI
All items (100.0) 1 2.5 3.3 2.3 3.1 0.3 0.3
Food (15.8) 2.1 4.3 5.6 5.2 0.3 0.1Energy (6.7) -1.3 8.6 -7.4 7.6 1.2 1.6CPI less food and energy (77.5) 3.0 2.6 2.4 2.7 0.2 0.1
Commodities (23.9) 1.7 1.1 0.1 1.3 0.1 0.1
New vehicles (5.0) 1.9 1.8 3.2 0.5 -0.1 .0Used cars (1.3) 4.4 -1.6 -4.1 -1.6 -0.4 -0.2Apparel (5.0) -0.1 -0.5 -4.8 2.8 0.5 0.1
Services (53.6) 3.6 3.3 3.6 2.9 0.2 0.2
Owners' equivalent rent (19.7) 3.7 2.8 2.7 3.0 0.3 0.2Tenants' rent (5.8) 2.5 2.8 3.0 2.7 0.2 0.2Medical care (6.1) 4.4 3.2 3.3 2.8 0.4 0.3Auto finance charges (0.6) 2.0 -2.0 13.7 -1.2 -1.2 -1.1
PPI
Finished goods (100.0)2 2.3 2.8 1.5 4.2 0.4 0.5
Finished consumer foods (23.4) 1.9 3.4 8.3 4.8 -0.1 -0.1Finished energy (13.4) 1.1 12.0 -7.0 21.2 2.3 3.1Finished goods less food
and energy (63.2) 2.6 0.6 1.2 0.1 0.1 0.1
Consumer goods (38.5) 2.8 0.7 1.1 0.4 .0 0.2Capital equipment (24.7) 2.2 0.5 1.0 -0.0 0.3 0.1
Intermediate materials (100) 3 3.3 0.8 -0.9 1.9 0.2 0.4
Intermediate materials 3.2 -0.9 -0.6 0.4 0.1 0.1less food and energy (82.6)
Crude materials (100)4 5.5 12.2 4.8 1.5 1.8 4.2
Crude food materials (44.7) 12.9 -0.9 17.0 -28.3 -1.9 -4.3Crude energy (31.4) 3.7 43.2 -1.8 54.7 7.7 16.5Crude materials less -4.2 -5.6 -8.0 2.6 -0.3 0.2
food and energy (23.9)
1. Relative importance weight for CPI, December 1995.2. Relative importance weight for PPI, December 1995.3. Relative importance weight for intermediate materials, December 1995.4. Relative importance weight for crude materials, December 1995.

II-35
The acceleration in average hourly earnings of production or
nonsupervisory workers has been more pronounced than has the rise in
wages and salaries for comparable workers in the ECI. In December,
average hourly earnings stood 4 percent above their year-earlier
level--a full percentage point faster growth than over 1995. The
chain-weighted average hourly earnings measure also has accelerated
about 1 percentage point over the past year, suggesting that changes
in the industrial composition of the work force have not contributed
to the acceleration in the published average hourly earnings series.
However, given the increase in the average workweek between December
1995 and December 1996, some of the acceleration in average hourly
earnings may be due to an increase in overtime hours--which is not
counted as an increase in compensation rates in the ECI.
In addition to labor cost pressures, there have been
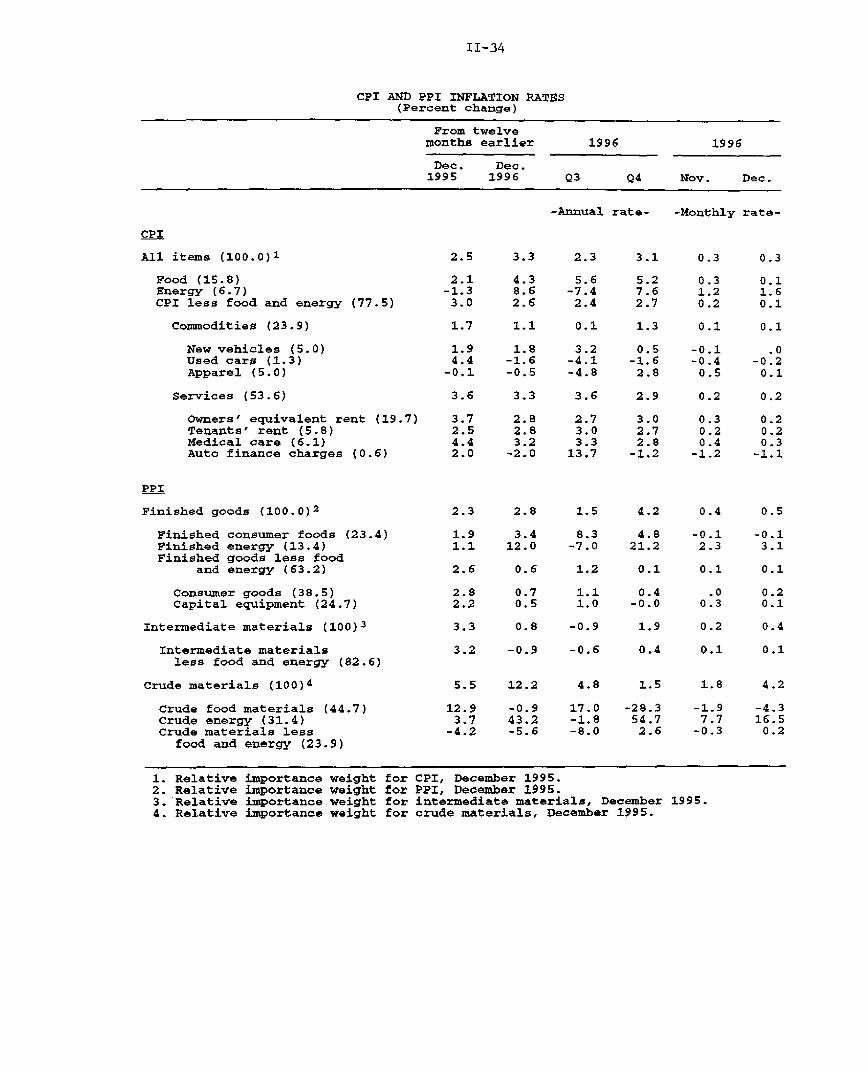
substantial increases in energy prices. The CPI for energy rose
1.6 percent in December, bringing the rise in 1996 to 8.6 percent.
December's sizable increases in the prices of gasoline and heating
oil reflected rising crude oil prices and continued low inventories.
Although stocks of gasoline remained rather low in early January,
refiners have been able to boost inventories of heating oil
considerably in recent weeks, and these stocks now stand close to
year-earlier levels. Still, with the unusually cold weather in
Europe spurring demand, the energy price situation is unlikely to
improve markedly in the near future.
Non-energy price increases have been quite modest of late.
Consumer food prices were up 0.1 percent in December, after a
0.3 percent increase in November and larger increases in preceding
months. At earlier stages of processing, the PPI for crude
foodstuffs and feedstuffs declined again in December and has now
completely reversed its run-up earlier in the year. The recent
freeze in Florida will probably result in a temporary run-up in
fresh fruit and vegetable prices. The CPI excluding food and energy
also rose only 0.1 percent in December, as small price increases
were widespread. Prices of new vehicles were unchanged in December,
and apparel prices rose 0.1 percent on a seasonally adjusted basis
following larger increases in the preceding three months.
Over the year as a whole, core consumer prices increased
2.6 percent, down from a 3 percent rise over 1995 and the same as
the increase over 1994. A similar deceleration occurred in core PCE
prices, which we estimate to have slowed to a 2 percent rate of
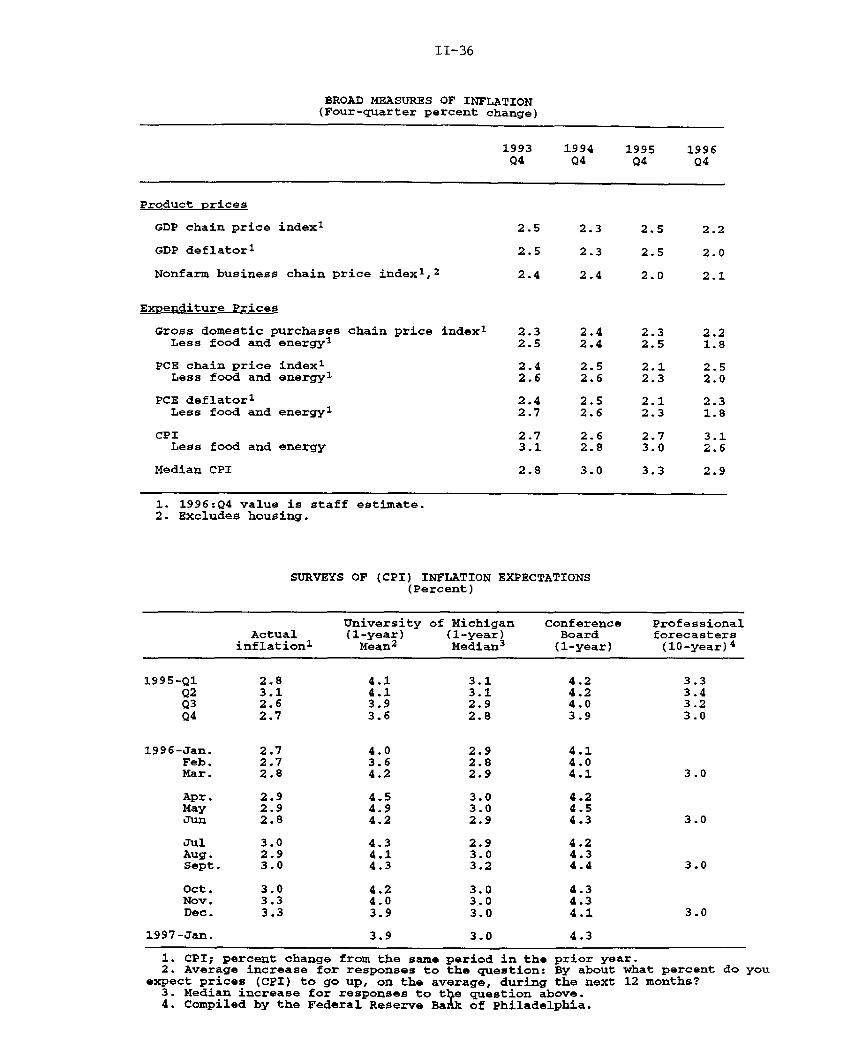
II-36
BROAD MEASURES OF INFLATION(Four-quarter percent change)
1993 1994 1995 1996Q4 Q4 Q4 Q4
Product prices
GDP chain price index I 2.5 2.3 2.5 2.2
GDP deflator 2.5 2.3 2.5 2.0
Nonfarm business chain price index 1 ,2 2.4 2.4 2.0 2.1
Expenditure Prices
Gross domestic purchases chain price index1 2.3 2.4 2.3 2.2Less food and energy1 2.5 2.4 2.5 1.8
PCE chain price index I 2.4 2.5 2.1 2.5Less food and energy1 2.6 2.6 2.3 2.0
PCE deflatorI 2.4 2.5 2.1 2.3Less food and energy 1 2.7 2.6 2.3 1.8
CPI 2.7 2.6 2.7 3.1Less food and energy 3.1 2.8 3.0 2.6
Median CPI 2.8 3.0 3.3 2.9
1. 1996:Q4 value is staff estimate.2. Excludes housing.
SURVEYS OF (CPI) INFLATION EXPECTATIONS(Percent)
University of Michigan Conference ProfessionalActual (1-year) (1-year) Board forecasters
inflationi Mean 2 Median3 (1-year) (10-year)4
1995-Ql 2.8 4.1 3.1 4.2 3.3Q2 3.1 4.1 3.1 4.2 3.4Q3 2.6 3.9 2.9 4.0 3.2Q4 2.7 3.6 2.8 3.9 3.0
1996-Jan. 2.7 4.0 2.9 4.1Feb. 2.7 3.6 2.8 4.0Mar. 2.8 4.2 2.9 4.1 3.0
Apr. 2.9 4.5 3.0 4.2May 2.9 4.9 3.0 4.5Jun 2.8 4.2 2.9 4.3 3.0
Jul 3.0 4.3 2.9 4.2Aug. 2.9 4.1 3.0 4.3Sept. 3.0 4.3 3.2 4.4 3.0
Oct. 3.0 4.2 3.0 4.3Nov. 3.3 4.0 3.0 4.3Dec. 3.3 3.9 3.0 4.1 3.0
1997-Jan. 3.9 3.0 4.3
1. CPI; percent change from the same period in the prior year.2. Average increase for responses to the question: By about what percent do you
expect prices (CPI) to go up, on the average, during the next 12 months?3. Median increase for responses to te question above.4. Compiled by the Federal Reserve Bak of Philadelphia.
II-37
increase over 1996. The comparatively small rise in core PCE prices
relative to the core CPI can be attributed to a variety of factors,
but the most important is the difference in how the two indexes
treat prices of medical services. Unlike most components of PCE,
medical prices do not use the CPI as source data; rather, PCE
medical prices are based on PPIs that attempt to price a treatment
path rather than inputs, and these prices have increased more slowly
than the CPI for medical services. (The CPI is about to change its
method for measuring hospital prices--but not doctors'
services--toward the treatment-path approach.) In addition, medical
services have a much larger weight in PCE than in the CPI--the
latter only includes out-of-pocket medical care costs--which
magnifies the effect of the price slowdown in the PCE index.
Unlike the core consumption price measures, increases in both
the overall PCE chain price index and the overall CPI accelerated
over the past year, reflecting the sizable increases in both food
and energy prices. However, price increases for investment goods,
exports, and government purchases all slowed last year, and we
estimate that the GDP chain-type price index increased 2-1/4 percent
over 1996. down a bit from 2-1/2 percent over 1995.
Prices of intermediate goods have yet to show the effects of
the higher energy prices. As measured by the producer price index,
increases in prices of energy-intensive intermediate goods, such as
plastics and chemicals, have been moderate of late. Similarly,
energy-intensive intermediate goods have not been prominent on the
purchasing managers lists of goods whose prices are increasing.
Nor has the energy-driven acceleration in the overall CPI led
to rising inflationary expectations. Indeed, the mean expected
price increase over the next twelve months, as measured by the
Michigan survey, is now running a bit lower than it was six months
ago, and the median expected price increase is about unchanged from
six months ago. Similarly, the Conference Board's survey of
inflation expectations over the next twelve months and the
Philadelphia Fed's survey of inflation expectations over the next
ten years have remained flat in recent months.
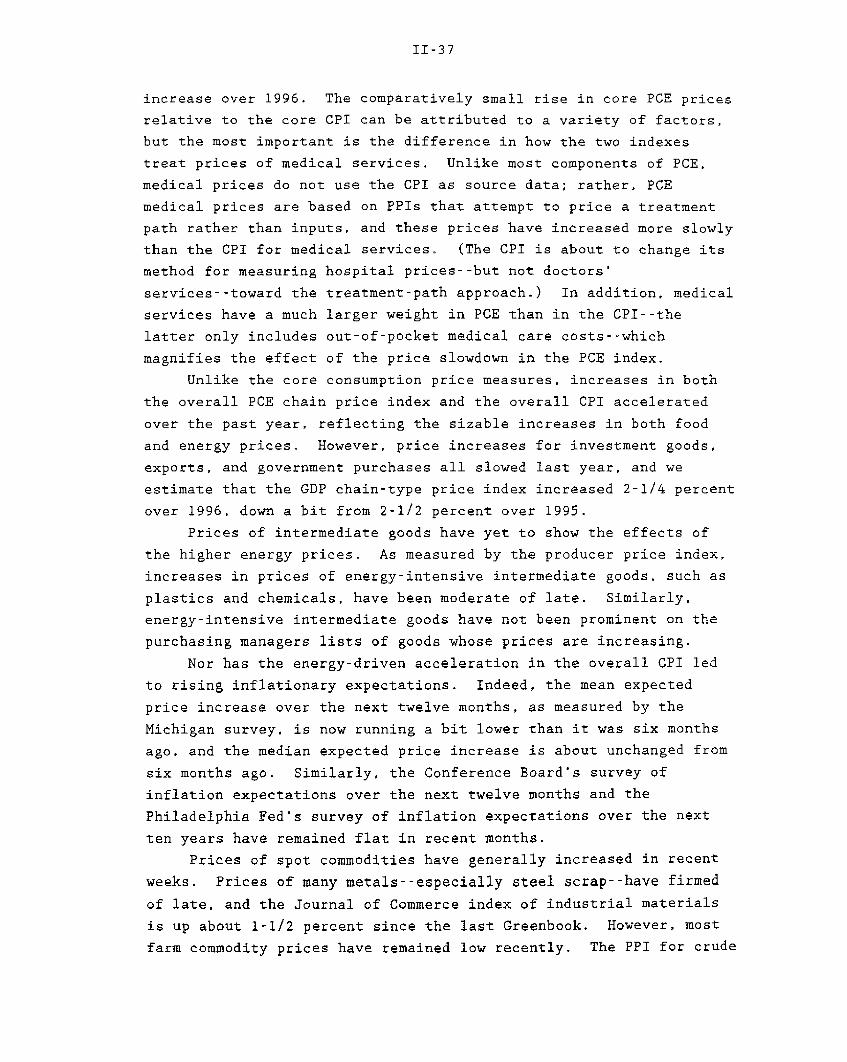
Prices of spot commodities have generally increased in recent
weeks. Prices of many metals--especially steel scrap--have firmed
of late, and the Journal of Commerce index of industrial materials
is up about 1-1/2 percent since the last Greenbook. However, most
farm commodity prices have remained low recently. The PPI for crude
II-38
Commodity Price Measures
Journal of Commerce IndexRatio scale, index, 1990=100
125
115
105103
95 Dec. Jan.1996 1997
Metals
J 91
1997
KR-CRB Spot IndustrialsRatio scale, index, 1967=100
Jan. 28
1985 1986 1987 1988 1989 1990 1991 1992 1993 1994 1995 1996 1997
J-J 321
1997
KR-CRB FuturesRatio scale, index, 1967=100
KR-CRB Futures252
- 247
- 239
231Dec. Jan.
5 1997
Note. Weekly data. Tuesdays. Vertical lines on small panels indicate week of last Greenbook. The Journal of Commerce index is based almostentirely on industrial commodities, with a small weight given to energy commodities, and the KR-CRB spot price index consists entirely of industrialcommodities, excluding energy. The KR-CRB futures index gives about a 60 percent weight to food commodities and splits the remaining weight rojghlyequally among energy commodities, industrial commodities, and precious metals. Copyright for Journal of Commerce data is held by CIBCR, 1994.

II-39
materials less food and energy moved up in December but remains morethan 5 percent below its year-earlier level.

DOMESTIC FINANCIALDEVELOPMENTS
III-T-1
Selected Financial Market Quotations 1(Percent except as noted)
1996 1997 Change to Jan. 28, from:
Instrument Feb. July FOMC,* Feb. July FOMC,
low high Dec. 17 Jan. 28 low high Dec. 17
Short-term rates
Federal funds2
Treasury bills3
3-month6-month1-year
Commercial paper
1-month3-month
Large negotiable CDs3
1-month3-month6-month
Eurodollar deposits'
1-month3-month
Bank prime rate
Intermediate- and Long-term Rates
U.S. Treasury (constant maturity)
3-year10-year30-year
Municipal revenue (Bond Buyer)5
Corporate-A utility, recently offered
High-yield corporate'
Home mortgages7
FHLMC 30-yr fixed rateFHLMC 1-yr adjustable rate
Stock exchange index
5.15
4.764.674.55
5.275.12
5.215.124.99
5.135.13
8.25
4.985.586.02
5.67
7.18
9.57
6.945.19
5.39
5.215.405.64
5.505.59
5.445.595.83
5.385.56
8.25
6.627.067.19
6.24
8.23
10.36
8.426.01
-. 19 -.07
.84 -.21
-.64 -.04
Record high 1996 1997 Percentage change to Jan 28, from:
Level Date
July FOMC,* Record
low Dec. 17 Jan. 28 high
July FOMC,
low Dec. 17
Dow-Jones Industrial 6883.90 1/21/97 5346.55 6268.35 6656.08 -3.31 24.49 6.19
S&P 500 Composite 786.23 1/22/97 626.65 720.98 765.02 -2.70 22.08 6.11
NASDAQ (OTC) 1388.06 1/22/97 1042.37 1260.98 1354.37 -2.43 29.93 7.41
Russell 2000 370.65 1/22/97 307.78 350.48 366.47 -.68 19.61 4.56
Wilshire 7594.85 1/22/97 6099.34 6998.62 7414.93 -2.37 21.57 5.95
1. One-day quotes except as noted.2. Average for two-week reserve maintenance period closest to date shown. Last observation is the average to date for maintenance period
ending January 29, 1997.3. Secondary market.4. Bid rates for Eurodollar deposits at 11 a.m. London time.5. Most recent observation based on one-day Thursday quote and futures market index changes.6. Merrill Lynch Master II high-yield bond index composite.7. Quotes for week ending Friday previous to date shown.* Figures cited are as of the close on December 16.
Selected Interest RatesShort-Term
Percent
1991 1992 1993 1994 1995 1996
8
7
6
5
4
3
2
Percent
Daily
FOMC12/17
C
Federal funds
T : .
~ ~1' r -- - - -
Three-month T-bill
i i i i i
12/13 12/20 12/271996
1/3 1/10 1/17 1/241997
Long-Term
jI I a I i I1991 1992 1993 1994 1995 1996
Weekly/Daily
FOMC12/17
Percent
]Corporate bond
(weekly)
Mortgage rate(weekly)
Thirty-year T-bond(daily)
I I I I I I I12/13 12/20 12/27 1/3
19961/10 1/17 1/24
1997
Percent
-- Primary fexd-rate mortgageS orporat bond (A-raed utty)
-- - Thirty-year Treasury bond
I I I ~_
Monthly

DOMESTIC FINANCIAL DEVELOPMENTS
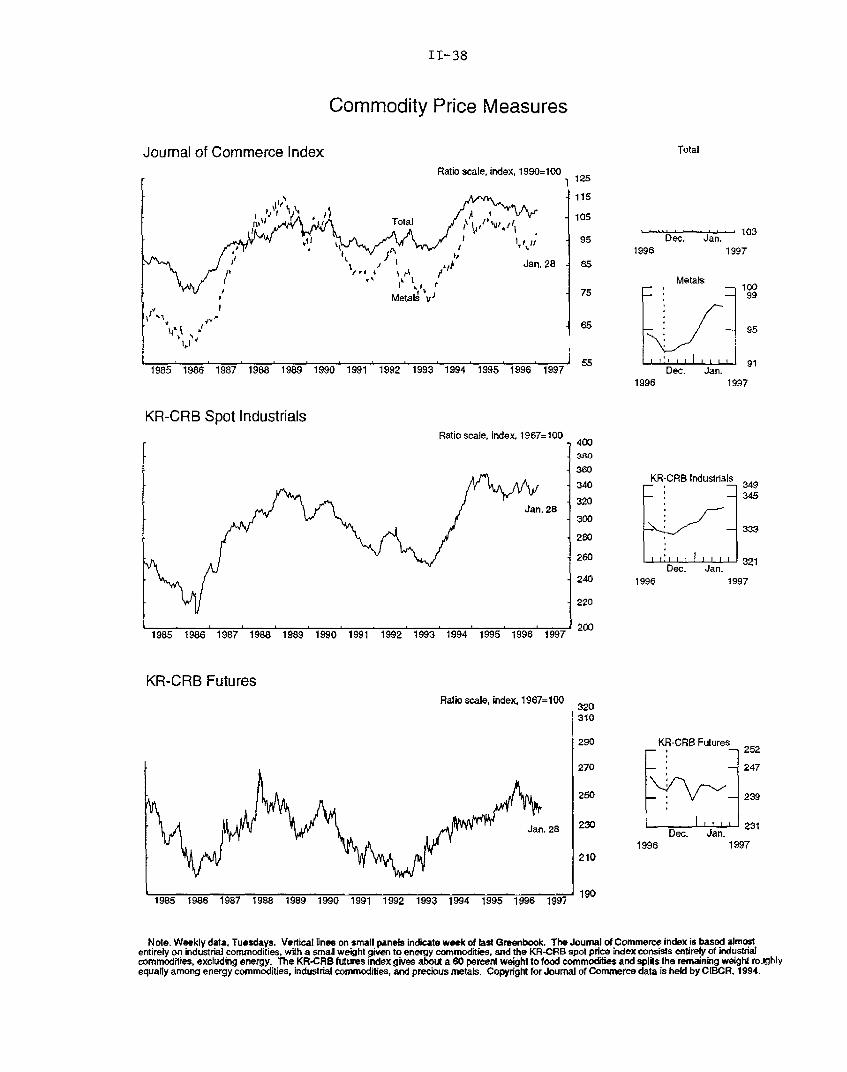
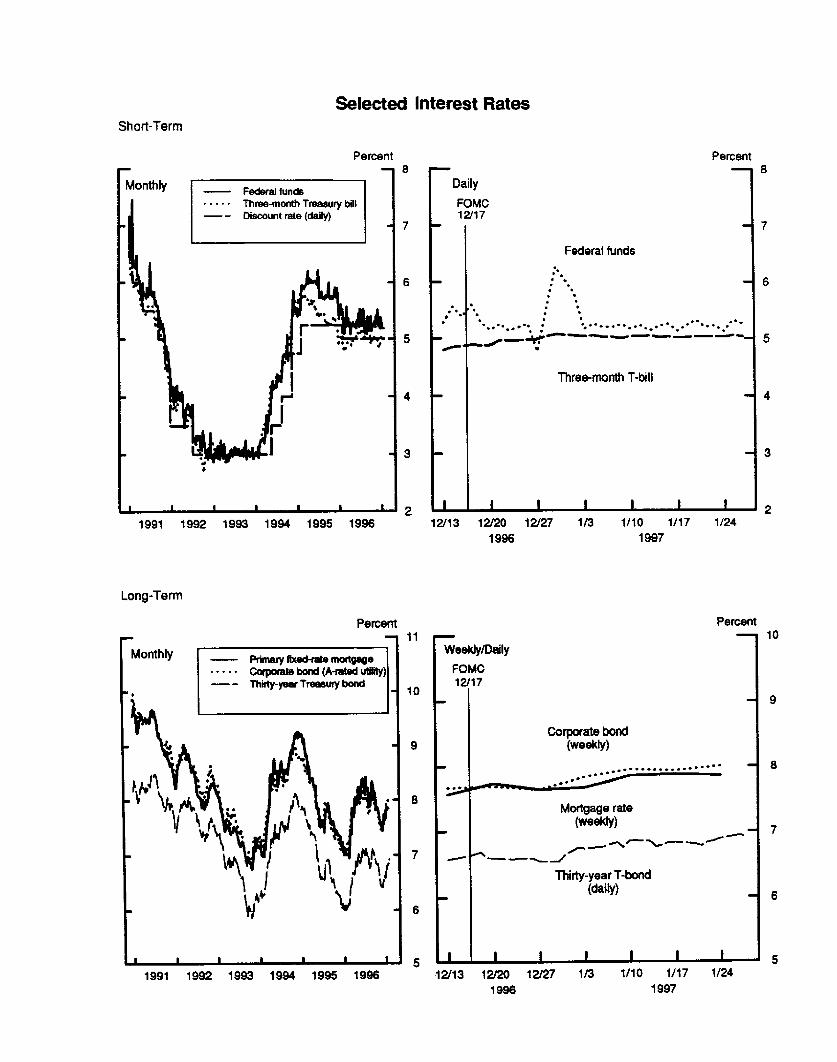
Since the December FOMC meeting, most readings on the strength
of economic activity have exceeded expectations, putting upward
pressure on interest rates. Although better-than-expected inflation
reports and an appreciating dollar have tempered the rise, long-term
rates still have increased about a quarter percentage point over the
intermeeting period. The thirty-year Treasury yield has reached
6.9 percent--more than a half point above its recent low at the end
of November. Changes in short-term rates were mixed since mid-
December: Treasury bill rates increased modestly, while private
rates fell as the year-end premium disappeared. Quotes for federal
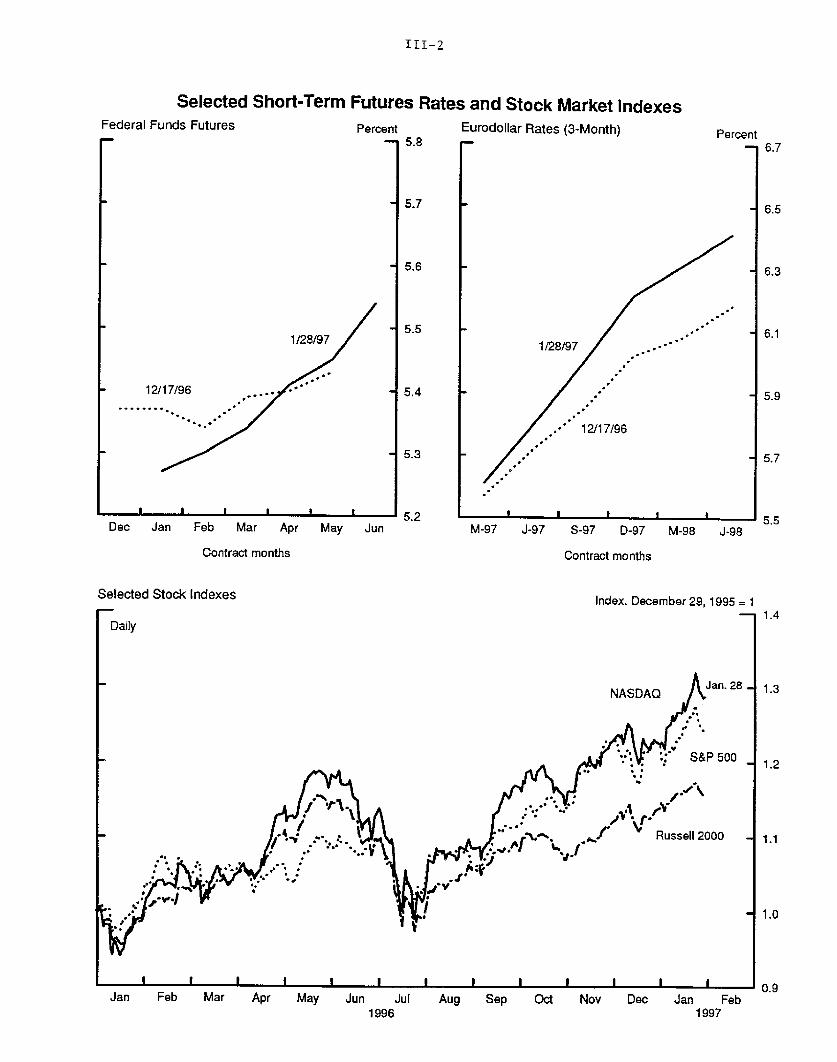
funds futures contracts continue to suggest that market participants
expect the Federal Reserve to hold policy unchanged at the February
FOMC meeting, but the perceived odds of a tightening by the spring
have moved up a shade.
Despite the increase in long-term interest rates, stocks have
risen on net during the intermeeting period in reaction to
surprisingly strong news on fourth-quarter earnings. Major stock
indexes have increased 4 to 8 percent. Although the sharpest gains
have been recorded for large companies, indexes that include the
stocks of smaller firms, such as the Russell 2000, also set new
highs through mid-January.
For the most part, financial intermediaries and the markets
appear willing to provide financing on very favorable terms. The
elevated price-earnings ratios in stock markets have kept equity a
cheap source of finance, and spreads on junk bonds have narrowed
further from already low levels. Recent survey data indicate that
banks have continued to ease slightly underwriting standards on
business loans and, more notably, terms. Although banks have
tightened their standards for issuing credit cards, home equity
loans have been promoted more heavily as an alternative.
The growth of business and household debt slackened a bit, on
balance, late last year. While businesses borrowed heavily from
banks over the fall and stepped up their net issuance of bonds,
paydowns of commercial paper increased. In the household sector,
growth of consumer credit fluctuated quite a bit but remained well
below the double-digit pace of 1995 and early 1996. Home mortgage
borrowing appears to have edged off in the fourth quarter, in
keeping with some softening of housing activity, despite a boost
III-1
III-2
Selected Short-Term Futures Rates and Stock Market IndexesFederal Funds Futures Percent Eurodollar Rates (3-Month)- -- 5.8 r
Dec Jan Feb Mar Apr May Jun
Contract months
Selected Stock Indexes
Percent
1
1/28/97
S12/17/96
I i i pM-97 J-97 S-97 D-97 M-98 J-98
Contract months
Index. December 29, 1995 = 1
Daily
NASDAQ
Russell 2000
Jan Feb Mar Apr May Jun Jul1996
Aug Sep Oct Nov Dec Jan Feb1997
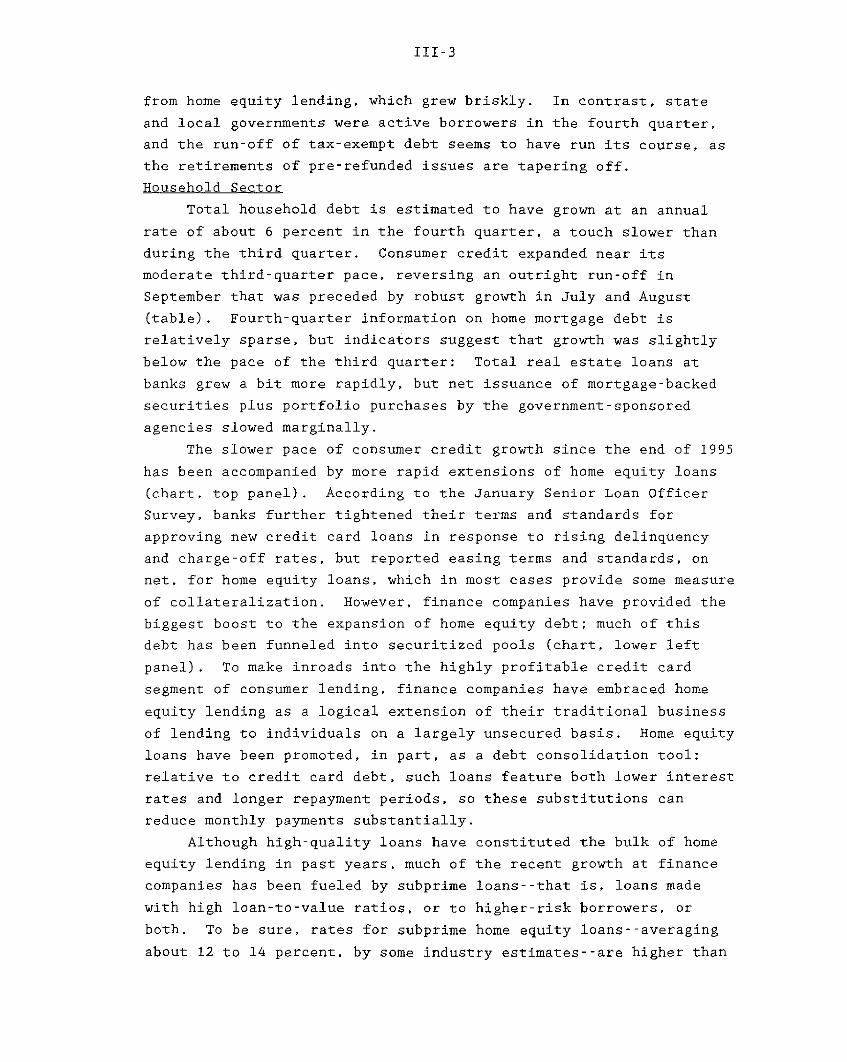
III-3
from home equity lending, which grew briskly. In contrast, state
and local governments were active borrowers in the fourth quarter,
and the run-off of tax-exempt debt seems to have run its course, as
the retirements of pre-refunded issues are tapering off.
Household Sector
Total household debt is estimated to have grown at an annual
rate of about 6 percent in the fourth quarter, a touch slower than
during the third quarter. Consumer credit expanded near its
moderate third-quarter pace, reversing an outright run-off in
September that was preceded by robust growth in July and August
(table). Fourth-quarter information on home mortgage debt is
relatively sparse, but indicators suggest that growth was slightly
below the pace of the third quarter: Total real estate loans at
banks grew a bit more rapidly, but net issuance of mortgage-backed
securities plus portfolio purchases by the government-sponsored
agencies slowed marginally.
The slower pace of consumer credit growth since the end of 1995
has been accompanied by more rapid extensions of home equity loans
(chart, top panel). According to the January Senior Loan Officer
Survey, banks further tightened their terms and standards for
approving new credit card loans in response to rising delinquency
and charge-off rates, but reported easing terms and standards, on
net, for home equity loans, which in most cases provide some measure
of collateralization. However, finance companies have provided the
biggest boost to the expansion of home equity debt; much of this
debt has been funneled into securitized pools (chart, lower left
panel). To make inroads into the highly profitable credit card
segment of consumer lending, finance companies have embraced home
equity lending as a logical extension of their traditional business
of lending to individuals on a largely unsecured basis. Home equity
loans have been promoted, in part, as a debt consolidation tool;
relative to credit card debt, such loans feature both lower interest
rates and longer repayment periods, so these substitutions can
reduce monthly payments substantially.
Although high-quality loans have constituted the bulk of home
equity lending in past years, much of the recent growth at finance
companies has been fueled by subprime loans--that is, loans made
with high loan-to-value ratios, or to higher-risk borrowers, or
both. To be sure, rates for subprime home equity loans--averaging
about 12 to 14 percent, by some industry estimates--are higher than
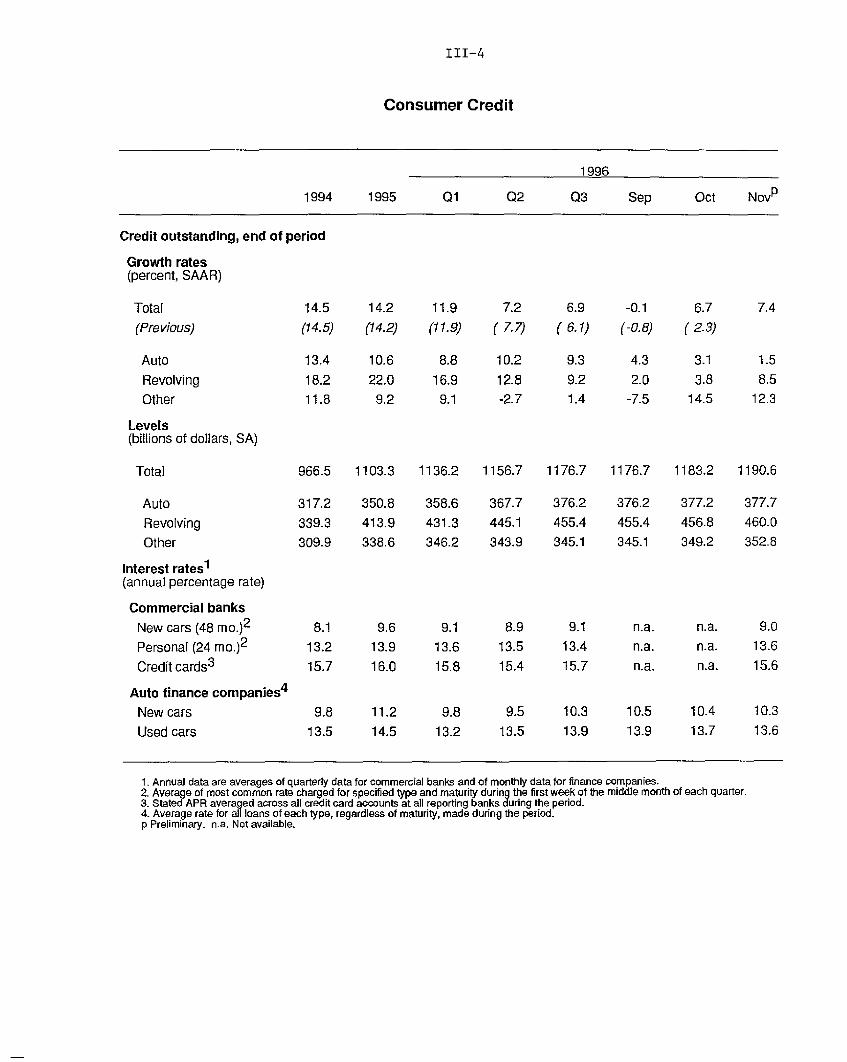
III-4
Consumer Credit
1996
1994 1995 Q1 Q2 03 Sep Oct Nov
Credit outstanding, end of period
Growth rates(percent, SAAR)
Total 14.5 14.2 11.9 7.2 6.9 -0.1 6.7 7.4
(Previous) (14.5) (14.2) (11.9) (7.7) (6.1) (-0.8) (2.3)
Auto 13.4 10.6 8.8 10.2 9.3 4.3 3.1 1.5
Revolving 18.2 22.0 16.9 12.8 9.2 2.0 3.8 8.5
Other 11.8 9.2 9.1 -2.7 1.4 -7.5 14.5 12.3
Levels(billions of dollars, SA)
Total 966.5 1103.3 1136.2 1156.7 1176.7 1176.7 1183.2 1190.6
Auto 317.2 350.8 358.6 367.7 376.2 376.2 377.2 377.7
Revolving 339.3 413.9 431.3 445.1 455.4 455.4 456.8 460.0
Other 309.9 338.6 346.2 343.9 345.1 345.1 349.2 352.8
Interest rates 1
(annual percentage rate)
Commercial banks
New cars (48 mo.)2 8.1 9.6 9.1 8.9 9.1 n.a. n.a. 9.0
Personal (24 mo.)2 13.2 13.9 13.6 13.5 13.4 n.a. n.a. 13.6
Credit cards3 15.7 16.0 15.8 15.4 15.7 n.a. n.a. 15.6
Auto finance companies 4
New cars 9.8 11.2 9.8 9.5 10.3 10.5 10.4 10.3
Used cars 13.5 14.5 13.2 13.5 13.9 13.9 13.7 13.6
1. Annual data are averages of quarterly data for commercial banks and of monthly data for finance companies.2. Average of most common rate charged for specified type and maturity during the first week of the middle month of each quarter.3. Stated APR averaged across all credit card accounts at all reporting banks during the period.4. Average rate for all loans of each type, regardless of maturity, made during the period.p Preliminary. n.a. Not available.
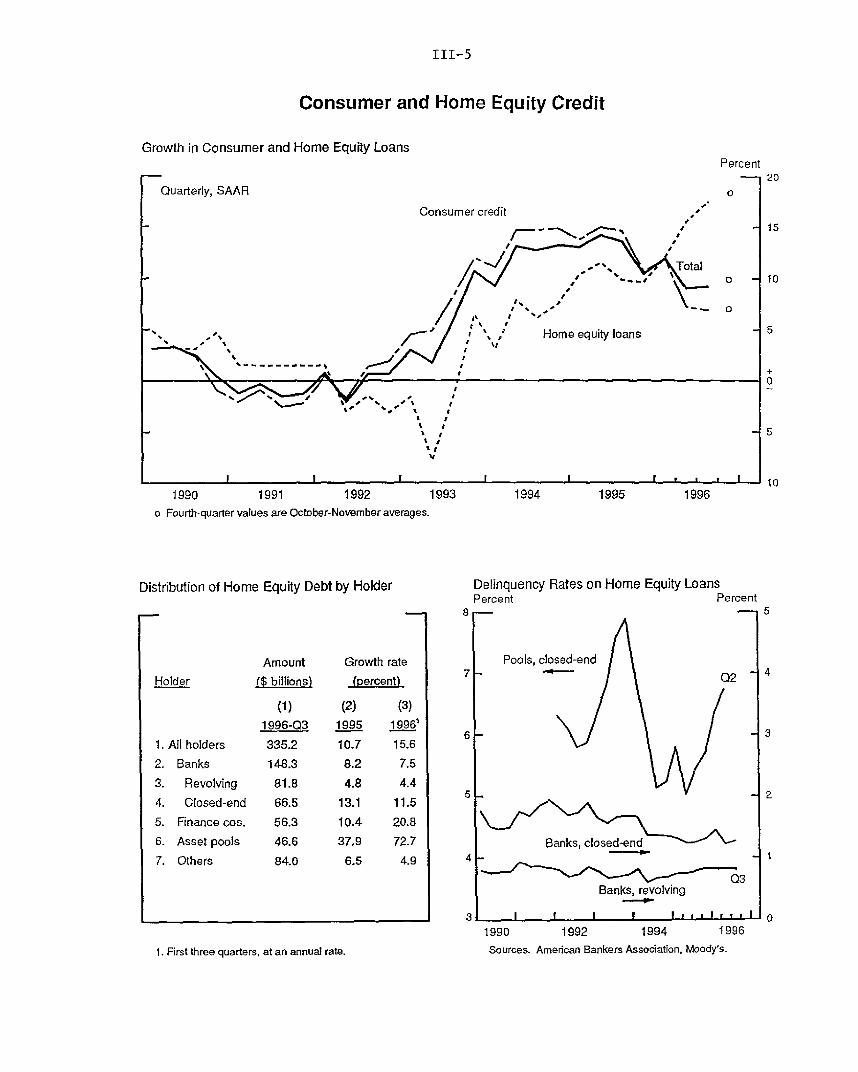
III-5
Consumer and Home Equity Credit
Growth in Consumer and Home Equity LoansPercent
1990 1991 1992 1993 1994 1995 1996
o Fourth-quarter values are October-November averages.
Distribution of Home Equity Debt by Holder Delinquency Rates on Home Equity LoansPercent Percent
Holder
1. All holders
2. Banks
3. Revolving
4. Closed-end
5. Finance cos.
6. Asset pools
7. Others
Amount($ billions)
(1)1996-Q3
335.2148.3
81.866.5
56.3
46.684.0
Growth rate
(percent)
(2) (3)1995 19961
10.7 15.68.2 7.5
4.8 4.413.1 11.510.4 20.8
37,9 72.76.5 4.9
1. First three quarters, at an annual rate.
Pools, closed-end02 14
Banks, closed-end
Banks, revolving
I lI I I ImIr ,I
1990 1992 1994 1996
Sources. American Bankers Association, Moody's.
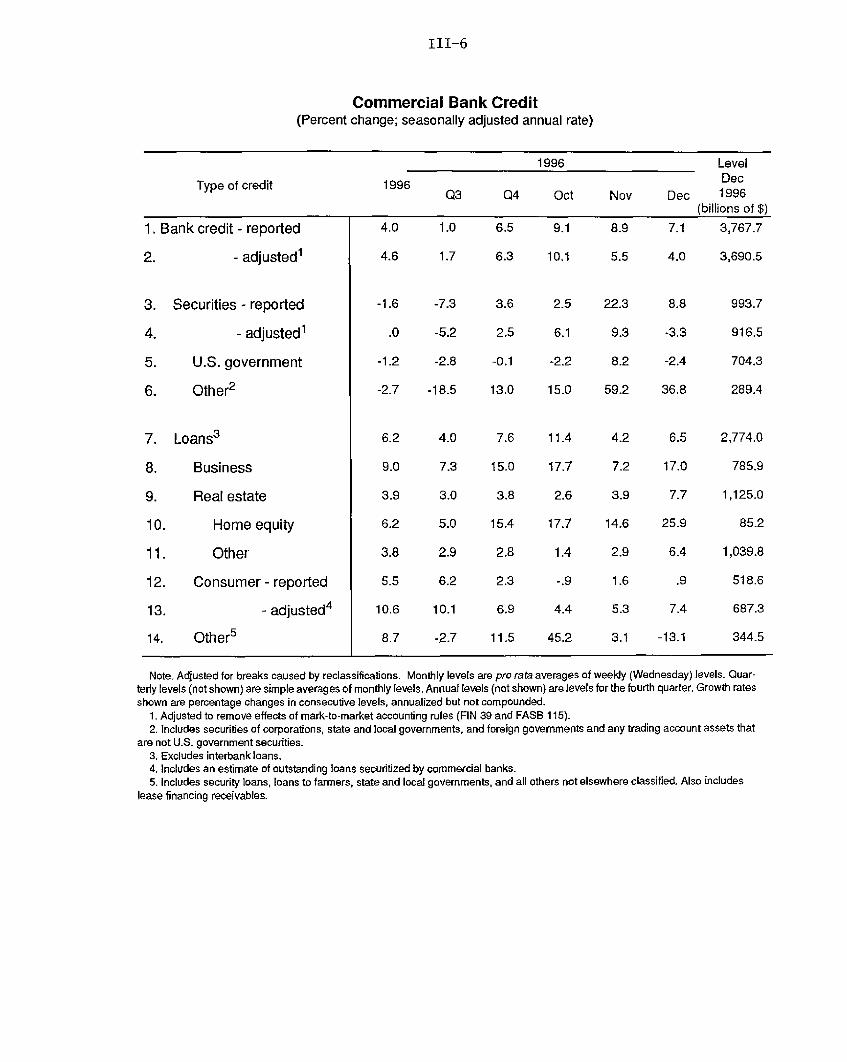
III-6
Commercial Bank Credit(Percent change; seasonally adjusted annual rate)
1996 Level
Type of credit 1996 DecQ3 Q4 Oct Nov Dec 1996
(billions of $)
1. Bank credit - reported 4.0 1.0 6.5 9.1 8.9 7.1 3,767.7
2. - adjusted1 4.6 1.7 6.3 10.1 5.5 4.0 3,690.5
3. Securities - reported -1.6 -7.3 3.6 2.5 22.3 8.8 993.7
4. - adjusted 1 .0 -5.2 2.5 6.1 9.3 -3.3 916.5
5. U.S. government -1.2 -2.8 -0.1 -2.2 8.2 -2.4 704.3
6. Other2 -2.7 -18.5 13.0 15.0 59.2 36.8 289.4
7. Loans3 6.2 4.0 7.6 11.4 4.2 6.5 2,774.0
8. Business 9.0 7.3 15.0 17.7 7.2 17.0 785.9
9. Real estate 3.9 3.0 3.8 2.6 3.9 7.7 1,125.0
10. Home equity 6.2 5.0 15.4 17.7 14.6 25.9 85.2
11. Other 3.8 2.9 2.8 1.4 2.9 6.4 1,039.8
12. Consumer - reported 5.5 6.2 2.3 -.9 1.6 .9 518.6
13. - adjusted4 10.6 10.1 6.9 4.4 5.3 7.4 687.3
14. Other5 8.7 -2.7 11.5 45.2 3.1 -13.1 344.5
Note. Adjusted for breaks caused by reclassifications. Monthly levels are pro rata averages of weekly (Wednesday) levels. Quar-terly levels (not shown) are simple averages of monthly levels. Annual levels (not shown) are levels for the fourth quarter. Growth ratesshown are percentage changes in consecutive levels, annualized but not compounded.
1. Adjusted to remove effects of mark-to-market accounting rules (FIN 39 and FASB 115).2. Includes securities of corporations, state and local governments, and foreign governments and any trading account assets that
are not U.S. government securities.3. Excludes interbank loans.4. Includes an estimate of outstanding loans securitized by commercial banks.5. Includes security loans, loans to farmers, state and local governments, and all others not elsewhere classified. Also includes
lease financing receivables.
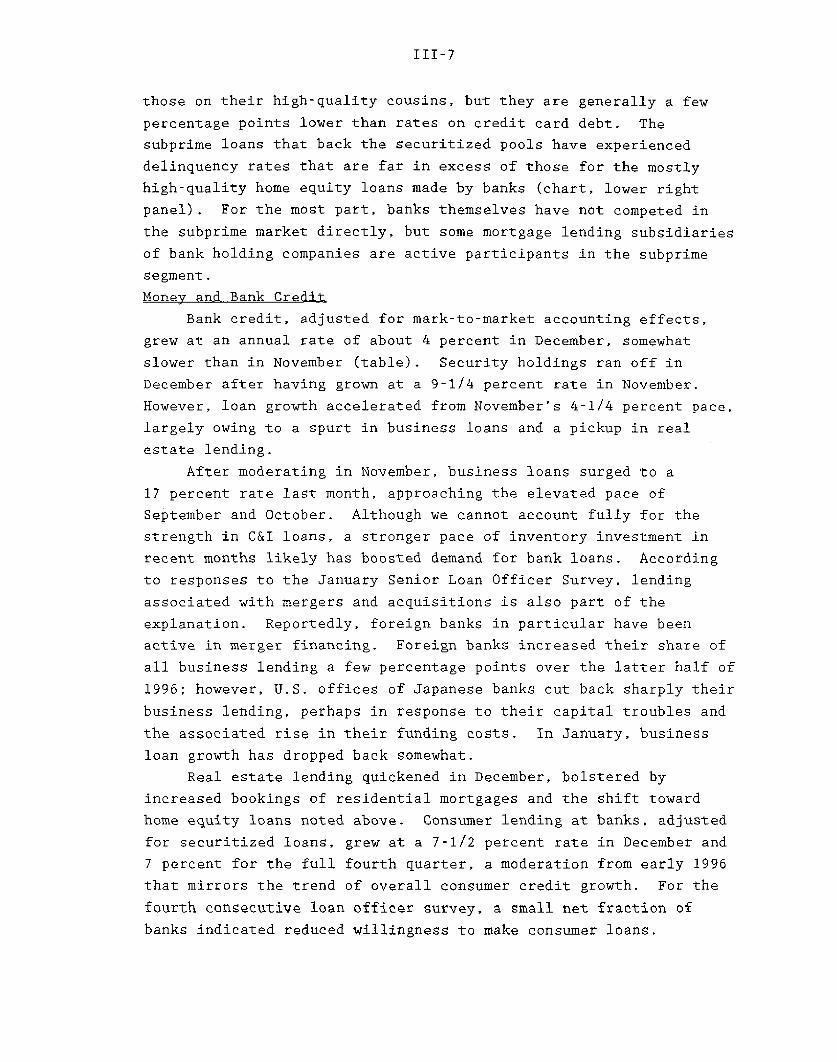
III-7
those on their high-quality cousins, but they are generally a few
percentage points lower than rates on credit card debt. The
subprime loans that back the securitized pools have experienced
delinquency rates that are far in excess of those for the mostly
high-quality home equity loans made by banks (chart, lower right
panel). For the most part, banks themselves have not competed in
the subprime market directly, but some mortgage lending subsidiaries
of bank holding companies are active participants in the subprime
segment.
Money and Bank Credit
Bank credit, adjusted for mark-to-market accounting effects,
grew at an annual rate of about 4 percent in December, somewhat
slower than in November (table). Security holdings ran off in
December after having grown at a 9-1/4 percent rate in November.
However, loan growth accelerated from November's 4-1/4 percent pace,
largely owing to a spurt in business loans and a pickup in real
estate lending.
After moderating in November, business loans surged to a
17 percent rate last month, approaching the elevated pace of
September and October. Although we cannot account fully for the
strength in C&I loans, a stronger pace of inventory investment in
recent months likely has boosted demand for bank loans. According
to responses to the January Senior Loan Officer Survey, lending
associated with mergers and acquisitions is also part of the
explanation. Reportedly, foreign banks in particular have been
active in merger financing. Foreign banks increased their share of
all business lending a few percentage points over the latter half of
1996; however, U.S. offices of Japanese banks cut back sharply their
business lending, perhaps in response to their capital troubles and
the associated rise in their funding costs. In January, business
loan growth has dropped back somewhat.
Real estate lending quickened in December, bolstered by
increased bookings of residential mortgages and the shift toward
home equity loans noted above. Consumer lending at banks, adjusted
for securitized loans, grew at a 7-1/2 percent rate in December and
7 percent for the full fourth quarter, a moderation from early 1996
that mirrors the trend of overall consumer credit growth. For the
fourth consecutive loan officer survey, a small net fraction of
banks indicated reduced willingness to make consumer loans.
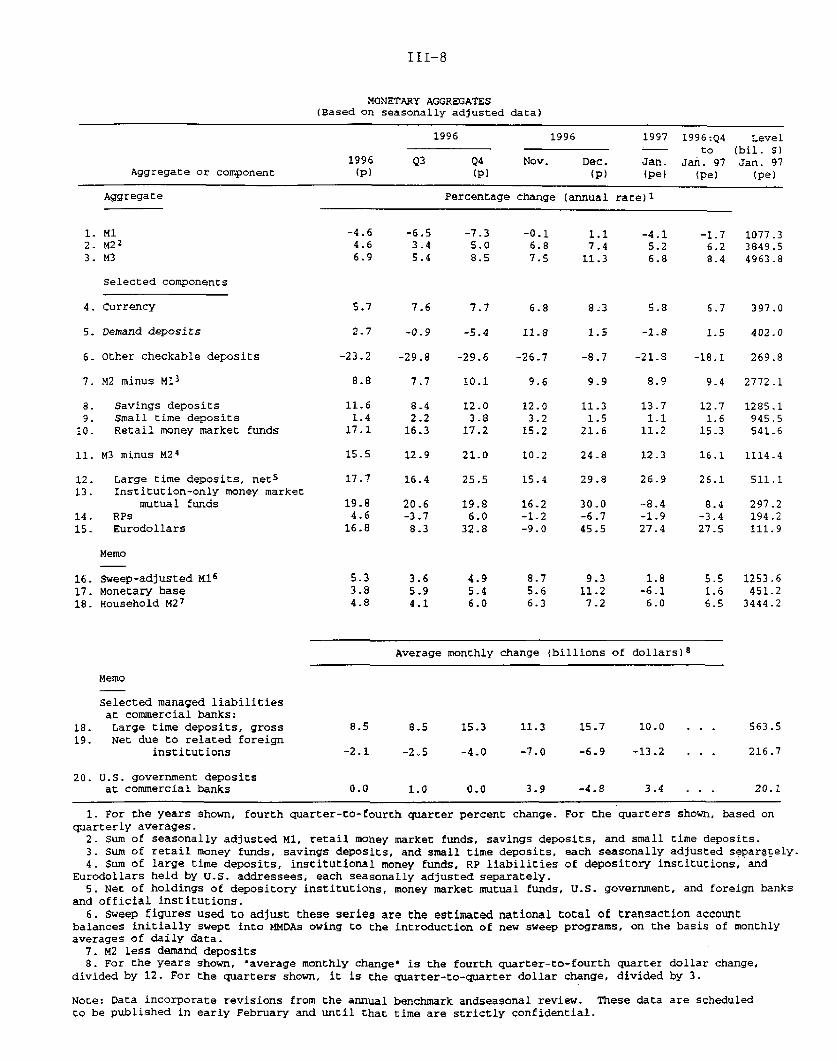
III-8
MONETARY AGGREGATES(Based on seasonally adjusted data)
1996 1996 1997 1996:Q4 Level- to (bil. $1
1996 Q3 Q4 Nov. Dec. Jan. Jan. 97 Jan. 97Aggregate or component (p) (p) ( (p (pe) (pe) (pe)
Aggregate Percentage change (annual rate)'
1. M12. M22
3. M3
Selected components
4. Currency
5. Demand deposits
6. Other checkable deposits
7. M2 minus M13
8. Savings deposits9- Small time deposits10. Retail money market funds
11. M3 minus M24
12. Large time deposits, nets13. Institution-only money market
mutual funds14. RPs15. Eurodollars
-6.53.45.4
-7.35.08.5
7.6 7.7
-0.16.87.5
6.8
2,7 -0.9 -5.4 11.8
-23.2 -29.8 -29.6 -26.7
7.7 10.1
11.61.4
17.1
8.4 12.0 12.0 11.32.2 3.8 3.2 1.5
16.3 17.2 15.2 21.6
1.17.4
11.3
8-3
-4.15.26.8
5.8
1.5 -1.8
-1.7 1077.36.2 3849.58.4 4963.8
6.7 397.0
1.5 402.0
-8.7 -21.8 -18.1 269.8
9.4 2772.1
13.7 12.7 1285-11.1 1-6 945.5
11.2 15.3 541.6
15.5 12.9 21.0 10.2 24.8 12.3 16.1 1114.4
17.7
19.84.6
16.8
16.4 25.5 15.4 29.8 26.9 26.1 511.1
20.6 19.8 16.2 30.0-3.7 6.0 -1-2 -6.78.3 32.8 -9.0 45.5
Memo
Sweep-adjusted M16Monetary baseHousehold M27
-8.4-1.927.4
8.4-3.427.5
8.7 9.3 1.85.6 11.2 -6.16.3 7.2 6.0
297.2194.2111.9
1253.6451.2
3444.2
Average monthly change (billions of dollars) 8
Memo
selected managed liabilitiesat commercial banks:
18. Large time deposits, gross19. Net due to related foreign
institutions
20. U.S. government depositsat commercial banks
8.5 15.3 11.3 15.7 10.0 . . .
-2.1 -2.5 -4.0 -7.0 -6.9 -13.2 . . .
0.0 1.0 0.0 3.9 -4.8
1. For the years shown, fourth quarter-to-fourth quarter percent change. For the quarters shown, based onquarterly averages.2. sum of seasonally adjusted M1, retail money market funds, savings deposits, and small time deposits.3. Sum of retail money funds, savings deposits, and small time deposits, each seasonally adjusted separately.4. Sum of large time deposits, institutional money funds, RP liabilities of depository institutions, and
Eurodollars held by U.S. addressees, each seasonally adjusted separately.5. Net of holdings of depository institutions, money market mutual funds, U.S. government, and foreign banks
and official institutions.6. Sweep figures used to adjust these series are the estimated national total of transaction account
balances initially swept into MMDAs owing to the introduction of new sweep programs, on the basis of monthlyaverages of daily data.
7. M2 less demand deposits8. For the years shown, "average monthly change" is the fourth quarter-to-fourth quarter dollar change,
divided by 12. For the quarters shown, it is the quarter-to-quarter dollar change, divided by 3.
Note: Data incorporate revisions from the annual benchmark andseasonal review. These data are scheduledto be published in early February and until that time are strictly confidential.
563.5
216.7
3.4 . . .
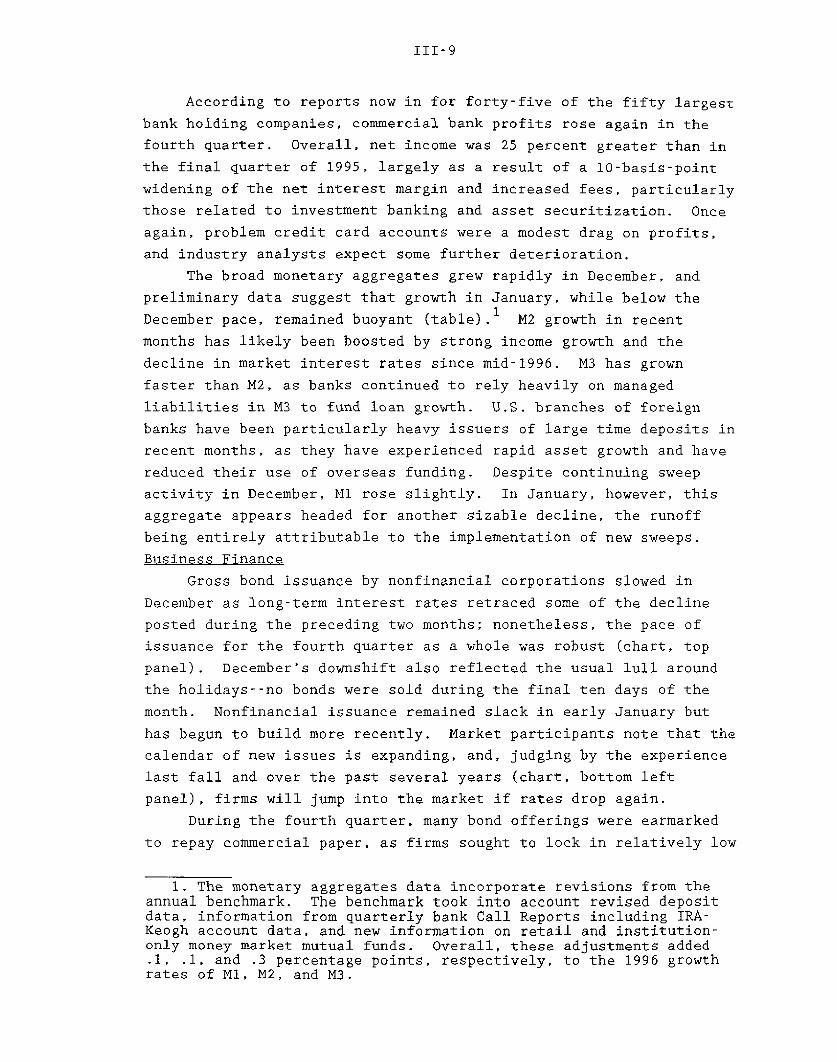
III-9
According to reports now in for forty-five of the fifty largest
bank holding companies, commercial bank profits rose again in the
fourth quarter. Overall, net income was 25 percent greater than in
the final quarter of 1995, largely as a result of a 10-basis-point
widening of the net interest margin and increased fees, particularly
those related to investment banking and asset securitization. Once
again, problem credit card accounts were a modest drag on profits,
and industry analysts expect some further deterioration.
The broad monetary aggregates grew rapidly in December, and
preliminary data suggest that growth in January, while below the
December pace, remained buoyant (table).1 M2 growth in recent
months has likely been boosted by strong income growth and the
decline in market interest rates since mid-1996. M3 has grown
faster than M2, as banks continued to rely heavily on managed
liabilities in M3 to fund loan growth. U.S. branches of foreign
banks have been particularly heavy issuers of large time deposits in
recent months, as they have experienced rapid asset growth and have
reduced their use of overseas funding. Despite continuing sweep
activity in December, M1 rose slightly. In January, however, this
aggregate appears headed for another sizable decline, the runoff
being entirely attributable to the implementation of new sweeps.
Business Finance
Gross bond issuance by nonfinancial corporations slowed in
December as long-term interest rates retraced some of the decline
posted during the preceding two months; nonetheless, the pace of
issuance for the fourth quarter as a whole was robust (chart, top
panel). December's downshift also reflected the usual lull around
the holidays--no bonds were sold during the final ten days of the
month. Nonfinancial issuance remained slack in early January but
has begun to build more recently. Market participants note that the
calendar of new issues is expanding, and, judging by the experience
last fall and over the past several years (chart, bottom left
panel), firms will jump into the market if rates drop again.
During the fourth quarter, many bond offerings were earmarked
to repay commercial paper, as firms sought to lock in relatively low
1. The monetary aggregates data incorporate revisions from theannual benchmark. The benchmark took into account revised depositdata, information from quarterly bank Call Reports including IRA-Keogh account data, and new information on retail and institution-only money market mutual funds. Overall, these adjustments added.1, .1, and .3 percentage points, respectively, to the 1996 growthrates of Ml, M2, and M3.
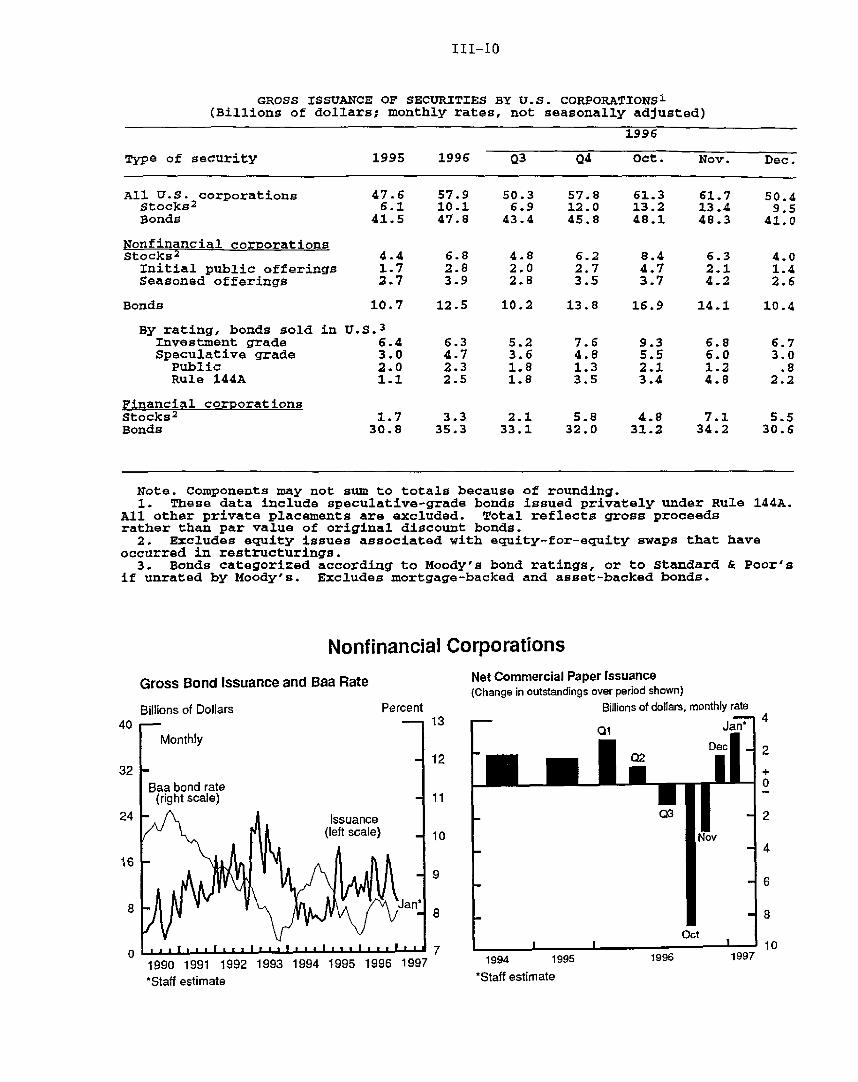
III-10
GROSS ISSUANCE OF SECURITIES BY U.S. CORPORATIONS 1
(Billions of dollars; monthly rates, not seasonally adjusted)
Type of security 1995 1996
1996
Q3 Q4 Oct. Nov. Dec.
47.66.1
41.5
4.41.72.7
All U.S. corporationsStocks2
Bonds
Nonfinancial corporationsStocks2
Initial public offeringsSeasoned offerings
Bonds
By rating, bonds sold in U.S. 3
Investment grade 6.4Speculative grade 3.0
Public 2.0Rule 144A 1.1
57.910.147.8
6.82.83.9
50.36.9
43.4
4.82.02.8
57.812.045.8
6.22.73.5
61.313.248.1
8.44.73.7
61.713.448.3
6.32.14.2
50.49.5
41.0
4.01.42.6
10.7 12.5 10.2 13.8 16.9 14.1 10.4
5.23.61.81.8
7.64.81.33.5
9.35.52.13.4
6.86.01.24.8
Financial corporationsStocks 2
Bonds1.7
30.83.3 2.1 5.8
35.3 33.1 32.04.8
31.27.1 5.5
34.2 30.6
Note. Components may not sum to totals because of rounding.1. These data include speculative-grade bonds issued privately under Rule 144A.
All other private placements are excluded. Total reflects gross proceedsrather than par value of original discount bonds.2. Excludes equity issues associated with equity-for-equity swaps that have
occurred in restructurings.3. Bonds categorized according to Moody's bond ratings, or to Standard & Poor's
if unrated by Moody's. Excludes mortgage-backed and asset-backed bonds.
Nonfinancial Corporations
Gross Bond Issuance and Baa Rate
Billions of Dollars Percent
Net Commercial Paper Issuance(Change in outstandings over period shown)
Billions of dollars, monthly rate
1994 1I
*Staff estimate
1996 19971990 1991 1992 1993 1994 1995 1996 1997
*Staff estimate
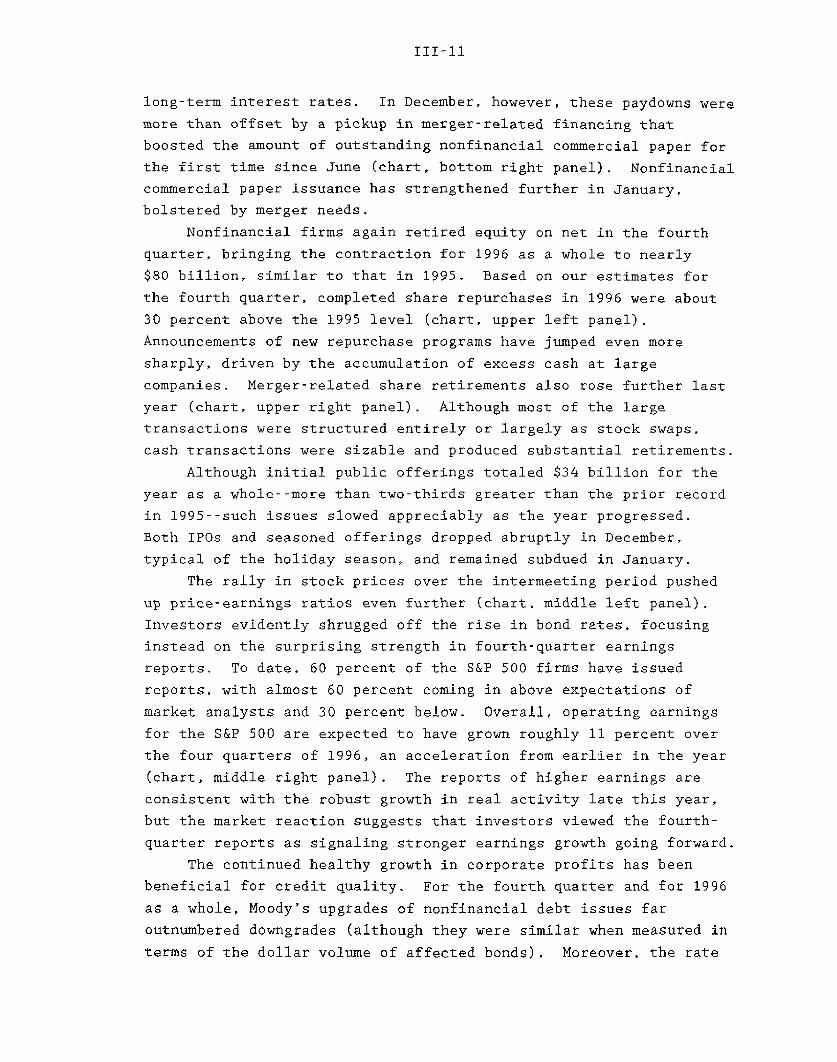
III-11
long-term interest rates. In December, however, these paydowns were
more than offset by a pickup in merger-related financing that
boosted the amount of outstanding nonfinancial commercial paper for
the first time since June (chart, bottom right panel). Nonfinancial
commercial paper issuance has strengthened further in January,
bolstered by merger needs.
Nonfinancial firms again retired equity on net in the fourth
quarter, bringing the contraction for 1996 as a whole to nearly
$80 billion, similar to that in 1995. Based on our estimates for
the fourth quarter, completed share repurchases in 1996 were about
30 percent above the 1995 level (chart, upper left panel).
Announcements of new repurchase programs have jumped even more
sharply, driven by the accumulation of excess cash at large
companies. Merger-related share retirements also rose further last
year (chart, upper right panel). Although most of the large
transactions were structured entirely or largely as stock swaps,
cash transactions were sizable and produced substantial retirements.
Although initial public offerings totaled $34 billion for the
year as a whole--more than two-thirds greater than the prior record
in 1995--such issues slowed appreciably as the year progressed.
Both IPOs and seasoned offerings dropped abruptly in December,
typical of the holiday season, and remained subdued in January.
The rally in stock prices over the intermeeting period pushed
up price-earnings ratios even further (chart, middle left panel).
Investors evidently shrugged off the rise in bond rates, focusing
instead on the surprising strength in fourth-quarter earnings
reports. To date, 60 percent of the S&P 500 firms have issued
reports, with almost 60 percent coming in above expectations of
market analysts and 30 percent below. Overall, operating earnings
for the S&P 500 are expected to have grown roughly 11 percent over
the four quarters of 1996, an acceleration from earlier in the year
(chart, middle right panel). The reports of higher earnings are
consistent with the robust growth in real activity late this year,
but the market reaction suggests that investors viewed the fourth-
quarter reports as signaling stronger earnings growth going forward.
The continued healthy growth in corporate profits has been
beneficial for credit quality. For the fourth quarter and for 1996
as a whole, Moody's upgrades of nonfinancial debt issues far
outnumbered downgrades (although they were similar when measured in
terms of the dollar volume of affected bonds). Moreover, the rate
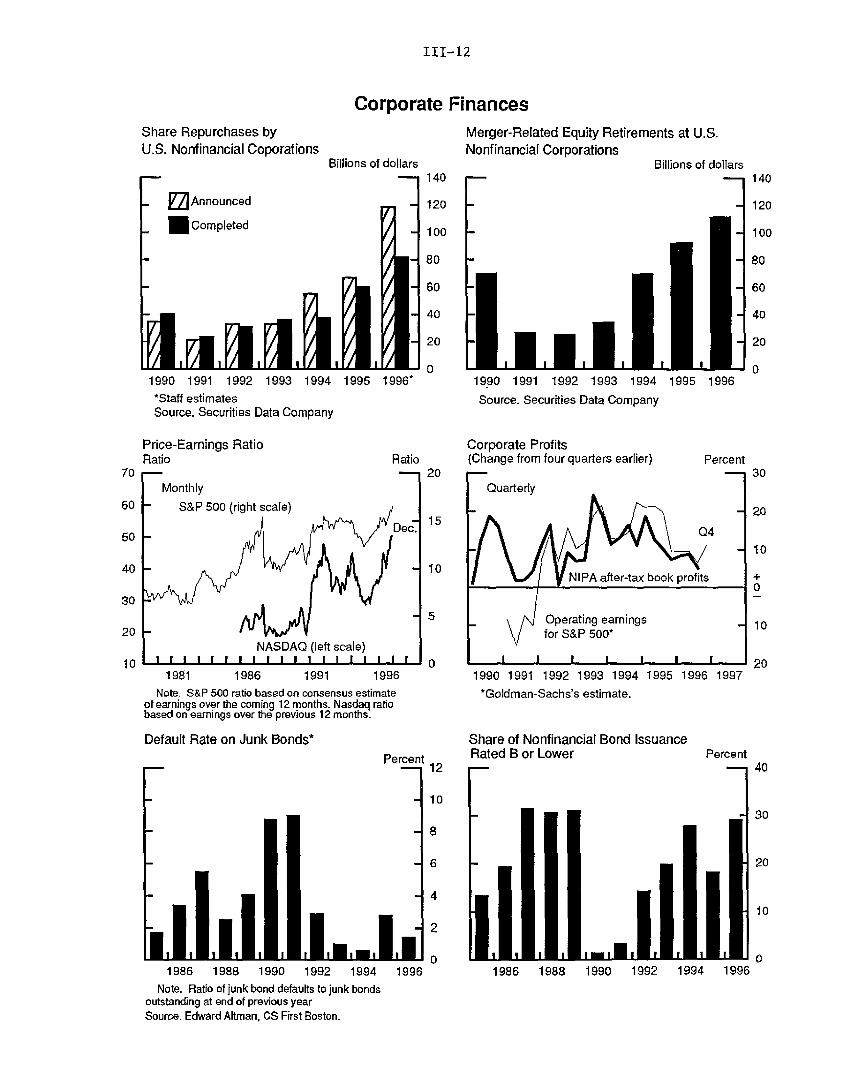
III-12
Corporate FinancesShare Repurchases byU.S. Nonfinancial Coporations
Billions of dollars
Merger-Related Equity Retirements at U.S.Nonfinancial Corporations
Billions of dollars
M7Announced
SCompleted
1990 1991 1992 1993 1994 1995 1996**Staff estimatesSource. Securities Data Company
Price-Earnings RatioRatio
FMonthly
Ratio
-1
NASDAQ (left scale)I I I I I I I I I I I I I 1 I I l I
1990 1991 1992 1993 1994 1995 1996Source. Securities Data Company
Corporate Profits(Change from four quarters earlier) Percent
1990 1991 1992 1993 1994 1995 1996 1997
Note. S&P 500 ratio based on consensus estimateof earnings over the coming 12 months. Nasdaq ratiobased on earnings over the previous 12 months.
Default Rate on Junk Bonds*Percent
~-- 12
*Goldman-Sachs's estimate.
Share of Nonfinancial Bond IssuanceRated B or Lower
1986 1988 1990 1992 1994 1996
1981 1986 1991 1996
Percent
1986 1988 1990 1992 1994 1996
Note. Ratio of junk bond defaults to junk bondsoutstanding at end of previous yearSource. Edward Altman, CS First Boston.
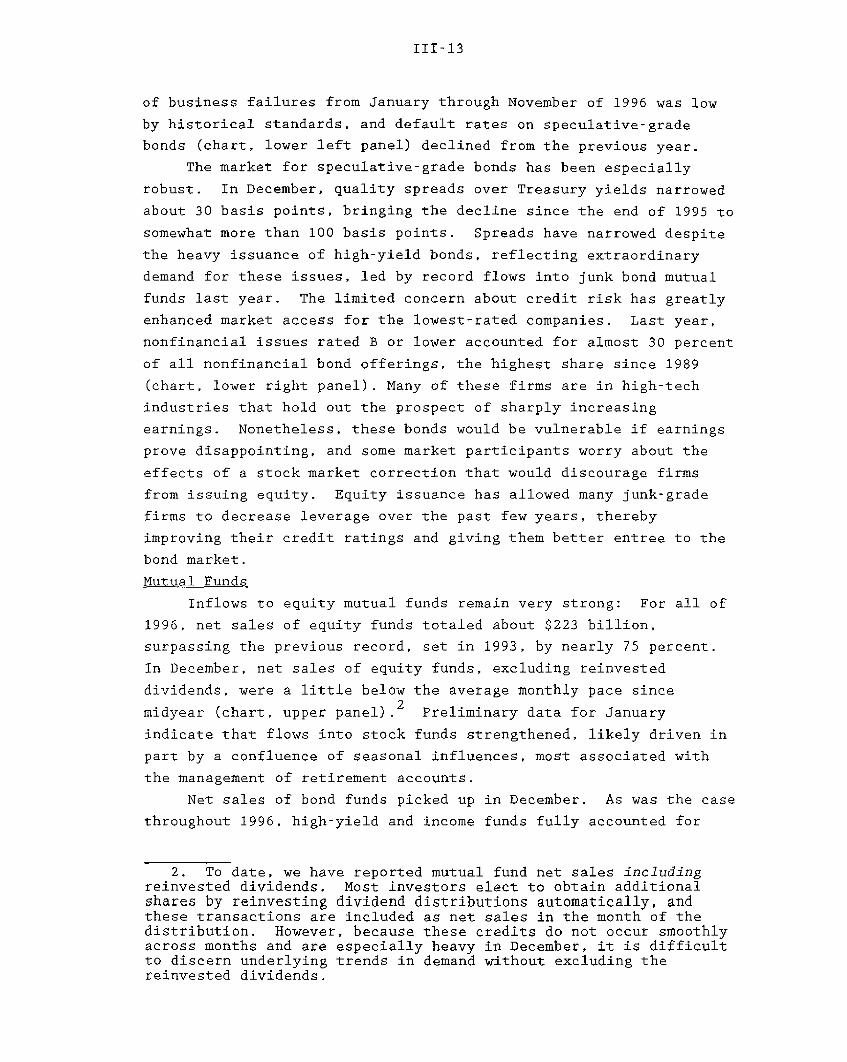
III-13
of business failures from January through November of 1996 was low
by historical standards, and default rates on speculative-grade
bonds (chart, lower left panel) declined from the previous year.
The market for speculative-grade bonds has been especially
robust. In December, quality spreads over Treasury yields narrowed
about 30 basis points, bringing the decline since the end of 1995 to
somewhat more than 100 basis points. Spreads have narrowed despite
the heavy issuance of high-yield bonds, reflecting extraordinary
demand for these issues, led by record flows into junk bond mutual
funds last year. The limited concern about credit risk has greatly
enhanced market access for the lowest-rated companies. Last year,
nonfinancial issues rated B or lower accounted for almost 30 percent
of all nonfinancial bond offerings, the highest share since 1989
(chart, lower right panel). Many of these firms are in high-tech
industries that hold out the prospect of sharply increasing
earnings. Nonetheless, these bonds would be vulnerable if earnings
prove disappointing, and some market participants worry about the
effects of a stock market correction that would discourage firms
from issuing equity. Equity issuance has allowed many junk-grade
firms to decrease leverage over the past few years, thereby
improving their credit ratings and giving them better entree to the
bond market.
Mutual Funds
Inflows to equity mutual funds remain very strong: For all of
1996, net sales of equity funds totaled about $223 billion,
surpassing the previous record, set in 1993, by nearly 75 percent.
In December, net sales of equity funds, excluding reinvested
dividends, were a little below the average monthly pace since
midyear (chart, upper panel).2 Preliminary data for January
indicate that flows into stock funds strengthened, likely driven in
part by a confluence of seasonal influences, most associated with
the management of retirement accounts.
Net sales of bond funds picked up in December. As was the case
throughout 1996, high-yield and income funds fully accounted for
2. To date, we have reported mutual fund net sales includingreinvested dividends. Most investors elect to obtain additionalshares by reinvesting dividend distributions automatically, andthese transactions are included as net sales in the month of thedistribution. However, because these credits do not occur smoothlyacross months and are especially heavy in December, it is difficultto discern underlying trends in demand without excluding thereinvested dividends.
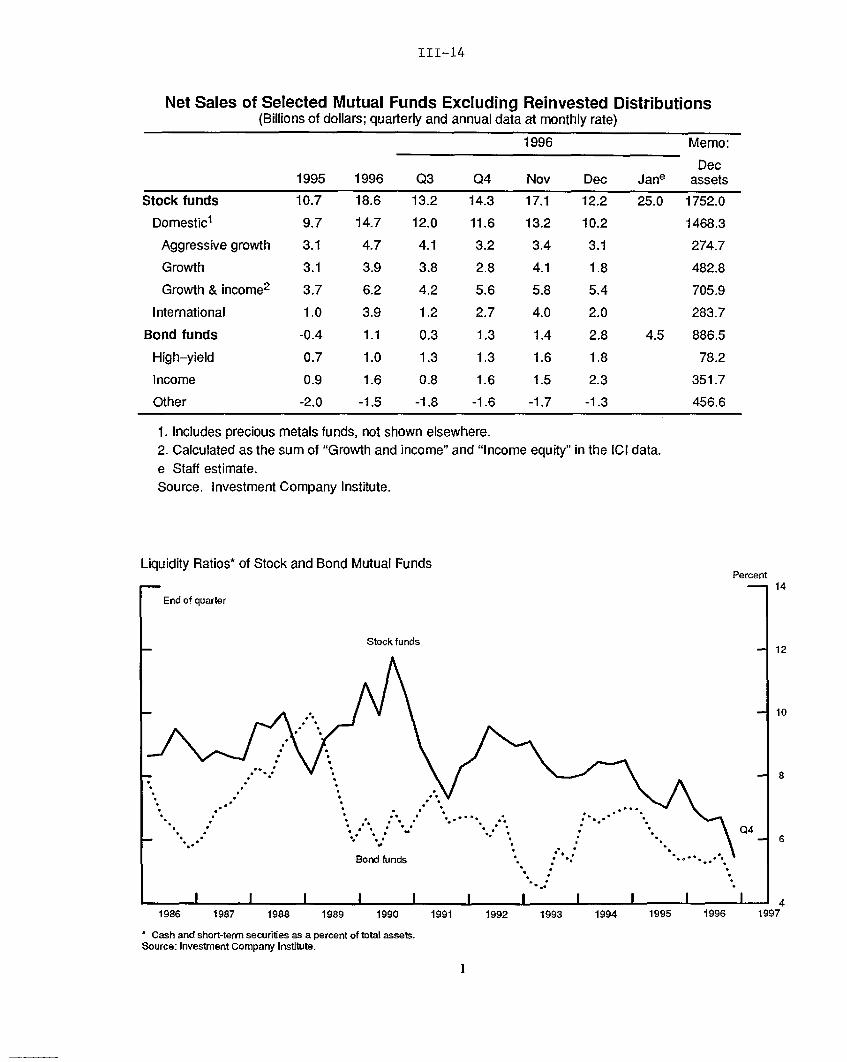
III-14
Net Sales of Selected Mutual Funds Excluding Reinvested Distributions(Billions of dollars; quarterly and annual data at monthly rate)
1996 Memo:
Dec1995 1996 Q3 Q4 Nov Dec Jane assets
Stock funds 10.7 18.6 13.2 14.3 17.1 12.2 25.0 1752.0
Domestic 1 9.7 14.7 12.0 11.6 13.2 10.2 1468.3
Aggressive growth 3.1 4.7 4.1 3.2 3.4 3.1 274.7
Growth 3.1 3.9 3.8 2.8 4.1 1.8 482.8
Growth & income 2 3.7 6.2 4.2 5.6 5.8 5.4 705.9
International 1.0 3.9 1.2 2.7 4.0 2.0 283.7
Bond funds -0.4 1.1 0.3 1.3 1.4 2.8 4.5 886.5
High-yield 0.7 1.0 1.3 1.3 1.6 1.8 78.2
Income 0.9 1.6 0.8 1.6 1.5 2.3 351.7
Other -2.0 -1.5 -1.8 -1.6 -1.7 -1.3 456.6
1. Includes precious metals funds, not shown elsewhere.2. Calculated as the sum of "Growth and income" and "Income equity" in the ICI data.e Staff estimate.Source. Investment Company Institute.
Liquidity Ratios* of Stock and Bond Mutual FundsPercent
End of quarter
Stock funds
-, °" * ' I. /
, .. *. . "-. . -.
.. o f n
Bond funds
**
.55 ..
- i I I I
1986 1987 1988 1989 1990
*Cash and short-term securities as a percent of total assets.Source: Investment Company Institute.
199I I 1 4 1 191991 1992 1993 1994 1995 1996 1997
II I I I I I I I I

III-15
December's inflows to bond funds and for the majority of such flows
in the first half of January. As noted above, the appeal of high-
yield funds likely reflects the improvement in corporate earnings
and a perceived decline in default risk, while income funds have
proved attractive because they invest a portion of their assets in
equities. Accordingly, returns on these funds have exceeded those
on other bond funds.
In December, liquidity ratios for equity funds averaged only
5-1/2 percent, the lowest since 1977 (chart, bottom panel).
Although this statistic could be taken as an indicator of fund
managers' views on the prospects for further stock market gains,
other factors are also involved. Much of the downward trend in the
liquidity ratio in recent years reportedly reflects a growing
reliance on backup lines of credit which have allowed funds to
absorb more risk by keeping a greater share of fund assets fully
invested. In addition, indexed funds, which hold minimal cash
reserves, represent a growing share of total mutual fund assets.
Treasury and Agency Financing
The Treasury will likely finance the projected $71 billion
deficit this quarter by borrowing about $58 billion in the market
and by drawing down its cash balance by $13 billion (table). The
steady shrinkage of the federal budget deficit has reduced the
borrowing needs of the Treasury, which are now estimated to be about
$130 billion for the 1997 calendar year. Strong revenues around the
end of the year also have led the Treasury to cut the size of this
quarter's two-year note and weekly bill auctions.
On Wednesday, January 29, the Treasury sold price index-linked
securities for the first time in an auction of ten-year notes worth
$7 billion. As with Canada's inflation-indexed bond, the principal
adjusts to changes in the price index, while the coupon rate remains
unchanged. Accordingly, investors are compensated for price level
changes through gradually increasing coupon payments and receipt of
the fully adjusted principal value at maturity.
The Treasury plans quarterly auctions of indexed debt; bidders
will submit tenders in terms of a real yield, and winning bids will
be awarded at the highest accepted yield. In the first sale, the
winning bid equaled 3.45 percent. Reportedly, the first sale went
well; demand was strong, with bids exceeding awards by five to one.
The security had traded on a "when-issued" basis, yielding 3-1/4 to
3-1/2 percent, although reports suggested that the market was
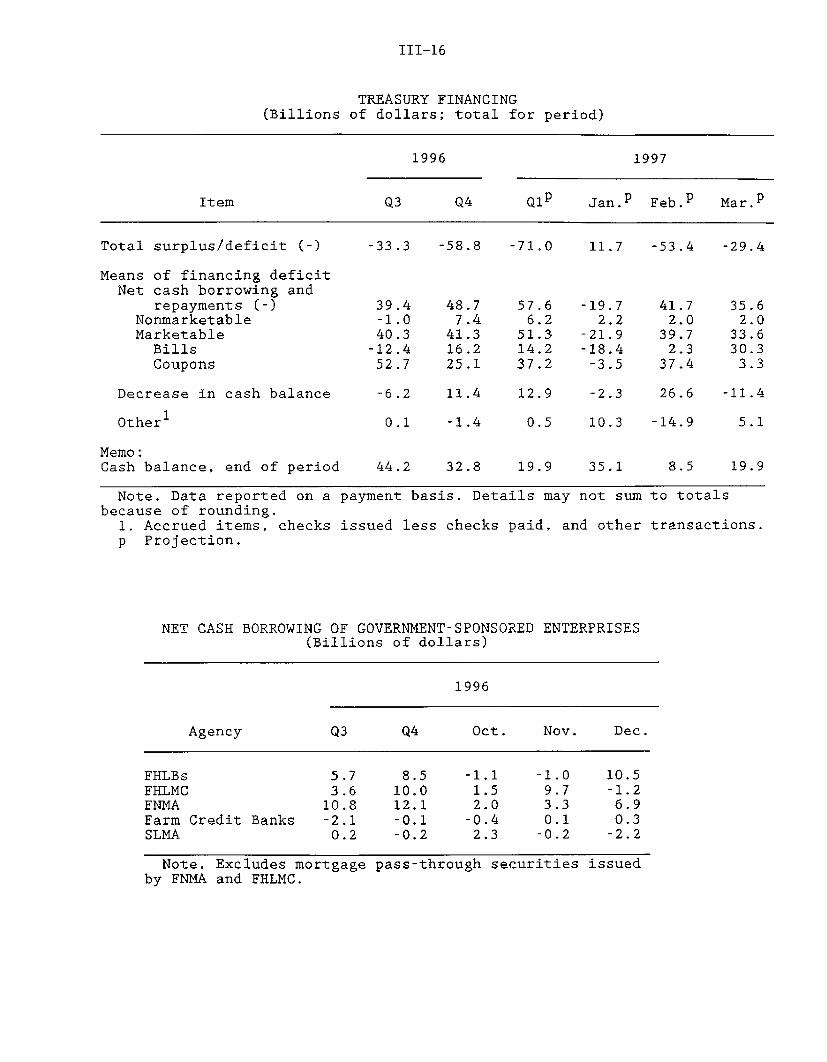
III-16
TREASURY FINANCING(Billions of dollars; total for period)
1996 1997
Item Q3 Q4 Q1 Jan.p Feb. p Mar.
Total surplus/deficit (-) -33.3 -58.8 -71.0 11.7 -53.4 -29.4
Means of financing deficitNet cash borrowing and
repayments (-) 39.4 48.7 57.6 -19.7 41.7 35.6Nonmarketable -1.0 7.4 6.2 2.2 2.0 2.0Marketable 40.3 41.3 51.3 -21.9 39.7 33.6
Bills -12.4 16.2 14.2 -18.4 2.3 30.3Coupons 52.7 25.1 37.2 -3.5 37.4 3.3
Decrease in cash balance -6.2 11.4 12.9 -2.3 26.6 -11.4
Other 1 0.1 -1.4 0.5 10.3 -14.9 5.1
Memo:Cash balance, end of period 44.2 32.8 19.9 35.1 8.5 19.9
Note. Data reported on a payment basis. Details may not sum to totalsbecause of rounding.
1. Accrued items, checks issued less checks paid, and other transactions.p Projection.
NET CASH BORROWING OF GOVERNMENT-SPONSORED ENTERPRISES(Billions of dollars)
1996
Agency Q3 Q4 Oct. Nov. Dec.
FHLBs 5.7 8.5 -1.1 -1.0 10.5FHLMC 3.6 10.0 1.5 9.7 -1.2FNMA 10.8 12.1 2.0 3.3 6.9Farm Credit Banks -2.1 -0.1 -0.4 0.1 0.3SLMA 0.2 -0.2 2.3 -0.2 -2.2
Note. Excludes mortgage pass-through securities issuedby FNMA and FHLMC.
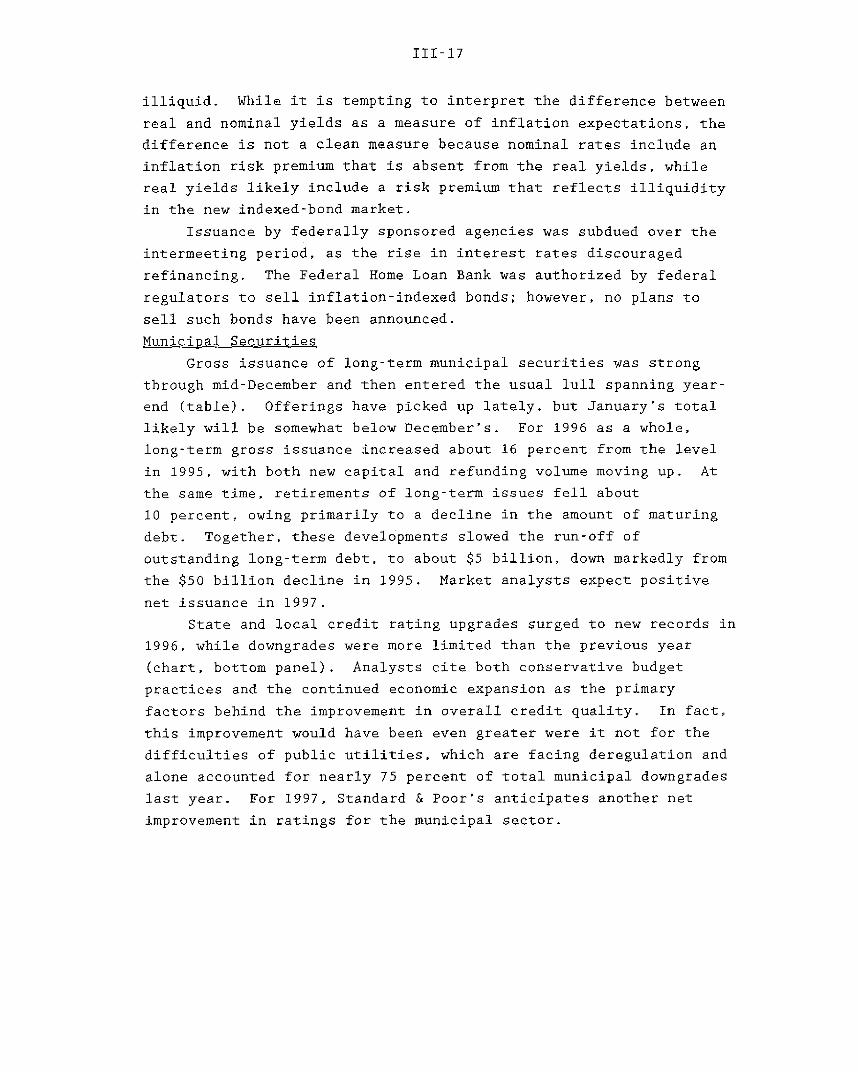
III-17
illiquid. While it is tempting to interpret the difference between
real and nominal yields as a measure of inflation expectations, the
difference is not a clean measure because nominal rates include an
inflation risk premium that is absent from the real yields, while
real yields likely include a risk premium that reflects illiquidity
in the new indexed-bond market.
Issuance by federally sponsored agencies was subdued over the
intermeeting period, as the rise in interest rates discouraged
refinancing. The Federal Home Loan Bank was authorized by federal
regulators to sell inflation-indexed bonds; however, no plans to
sell such bonds have been announced.
Municipal Securities
Gross issuance of long-term municipal securities was strong
through mid-December and then entered the usual lull spanning year-
end (table). Offerings have picked up lately, but January's total
likely will be somewhat below December's. For 1996 as a whole,
long-term gross issuance increased about 16 percent from the level
in 1995, with both new capital and refunding volume moving up. At
the same time, retirements of long-term issues fell about
10 percent, owing primarily to a decline in the amount of maturing
debt. Together, these developments slowed the run-off of
outstanding long-term debt, to about $5 billion, down markedly from
the $50 billion decline in 1995. Market analysts expect positive
net issuance in 1997.
State and local credit rating upgrades surged to new records in
1996, while downgrades were more limited than the previous year
(chart, bottom panel). Analysts cite both conservative budget
practices and the continued economic expansion as the primary
factors behind the improvement in overall credit quality. In fact,
this improvement would have been even greater were it not for the
difficulties of public utilities, which are facing deregulation and
alone accounted for nearly 75 percent of total municipal downgrades
last year. For 1997, Standard & Poor's anticipates another net
improvement in ratings for the municipal sector.
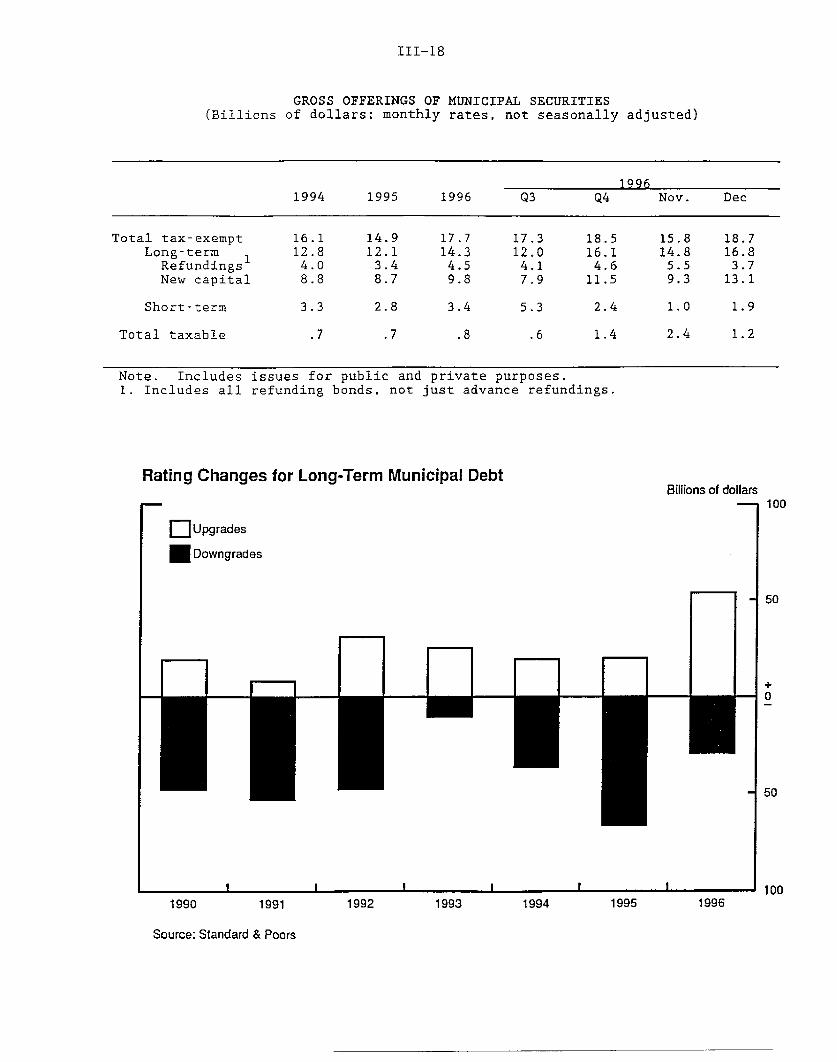
III-18
GROSS OFFERINGS OF MUNICIPAL SECURITIES(Billions of dollars; monthly rates, not seasonally adjusted)
19961994 1995 1996 Q3 Q4 Nov. Dec
Total tax-exempt 16.1 14.9 17.7 17.3 18.5 15.8 18.7Long-term 12.8 12.1 14.3 12.0 16.1 14.8 16.8Refundings 4.0 3.4 4.5 4.1 4.6 5.5 3.7New capital 8.8 8.7 9.8 7.9 11.5 9.3 13.1
Short-term 3.3 2.8 3.4 5.3 2.4 1.0 1.9
Total taxable .7 .7 .8 .6 1.4 2.4 1.2
Note. Includes issues for public and private purposes.1. Includes all refunding bonds, not just advance refundings.
Rating Changes for Long-Term Municipal DebtBillions of dollars
] Upgrades
* Downgrades
n r
1990
H
1992 1993
nI
1994
F-n
1995 1996
Source: Standard & Poors
100
50
+0
50
100_ I I I
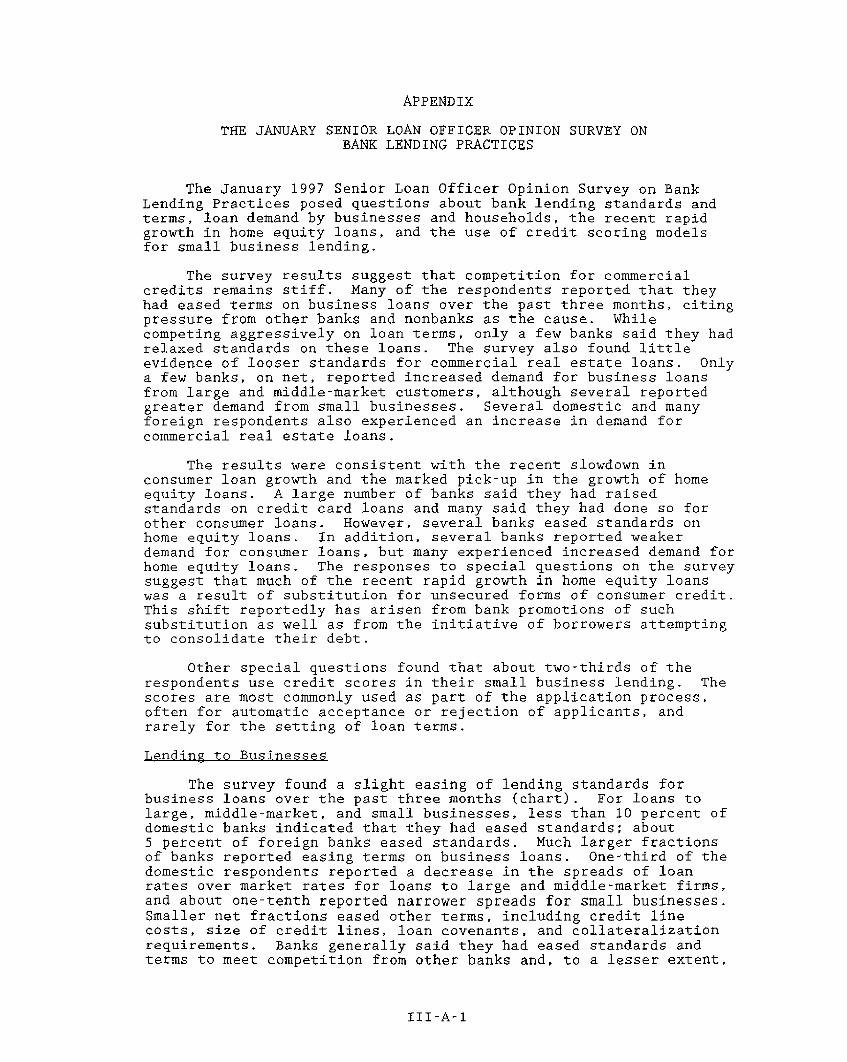
APPENDIX
THE JANUARY SENIOR LOAN OFFICER OPINION SURVEY ONBANK LENDING PRACTICES
The January 1997 Senior Loan Officer Opinion Survey on BankLending Practices posed questions about bank lending standards andterms, loan demand by businesses and households, the recent rapidgrowth in home equity loans, and the use of credit scoring modelsfor small business lending.
The survey results suggest that competition for commercialcredits remains stiff. Many of the respondents reported that theyhad eased terms on business loans over the past three months, citingpressure from other banks and nonbanks as the cause. Whilecompeting aggressively on loan terms, only a few banks said they hadrelaxed standards on these loans. The survey also found littleevidence of looser standards for commercial real estate loans. Onlya few banks, on net, reported increased demand for business loansfrom large and middle-market customers, although several reportedgreater demand from small businesses. Several domestic and manyforeign respondents also experienced an increase in demand forcommercial real estate loans.
The results were consistent with the recent slowdown inconsumer loan growth and the marked pick-up in the growth of homeequity loans. A large number of banks said they had raisedstandards on credit card loans and many said they had done so forother consumer loans. However, several banks eased standards onhome equity loans. In addition, several banks reported weakerdemand for consumer loans, but many experienced increased demand forhome equity loans. The responses to special questions on the surveysuggest that much of the recent rapid growth in home equity loanswas a result of substitution for unsecured forms of consumer credit.This shift reportedly has arisen from bank promotions of suchsubstitution as well as from the initiative of borrowers attemptingto consolidate their debt.
Other special questions found that about two-thirds of therespondents use credit scores in their small business lending. Thescores are most commonly used as part of the application process,often for automatic acceptance or rejection of applicants, andrarely for the setting of loan terms.
Lending to Businesses
The survey found a slight easing of lending standards forbusiness loans over the past three months (chart). For loans tolarge, middle-market, and small businesses, less than 10 percent ofdomestic banks indicated that they had eased standards; about5 percent of foreign banks eased standards. Much larger fractionsof banks reported easing terms on business loans. One-third of thedomestic respondents reported a decrease in the spreads of loanrates over market rates for loans to large and middle-market firms,and about one-tenth reported narrower spreads for small businesses.Smaller net fractions eased other terms, including credit linecosts, size of credit lines, loan covenants, and collateralizationrequirements. Banks generally said they had eased standards andterms to meet competition from other banks and, to a lesser extent,
III-A-1

III-A-2
from nonbank lenders. These results suggest a similar degree ofeasing of standards and terms as found in the November survey.
Also as in November, only slight net margins of banks reportedstronger demand for business loans. About 15 percent, on net, ofdomestic respondents reported increased demand for business loansfrom small firms and somewhat fewer indicated increased demand fromlarge or middle-market firms. Demand was up at about 10 percent ofthe foreign respondents. Banks attributed the increased demand fromsmall firms to plant and equipment investment and inventoryfinancing needs. The increased demand from large and middle-marketfirms reportedly also derived somewhat from these factors but mainlyfrom greater merger and acquisition financing.
Only one domestic respondent, on net, and two foreignrespondents indicated an easing of standards on construction andland development loans. About 15 percent of the domesticrespondents and nearly one-third of the foreign respondentsexperienced an increase in demand for these loans.
Lending to Households
For the fifth consecutive survey, significant fractions ofbanks said they had tightened standards on consumer loans. Nearly40 percent of the banks, on net, said they had tightened standardsover the past three months for approving new credit card accounts,and over 20 percent tightened standards on other consumer loans. Asmall net fraction of banks indicated less willingness to makeconsumer installment loans--the fourth survey in a row to show aslight decline in willingness to make these loans (chart). Terms oncredit cards tightened: About one-fourth of the respondents, onnet, lowered credit limits and a few raised spreads. About 10percent of banks tightened spreads on other consumer loans. Otherterms on consumer loans were reportedly about unchanged. On net,respondents reported a slight decline in demand for consumer loans.
Banks indicated a slight tightening in standards for approvinghome mortgages over the past three months and a slight increase, onnet, in demand for these loans. About 15 percent of the banksreported easing standards for home equity loans and similarfractions reported easing maximum loan-to-value levels. Smaller netfractions eased spreads and fees on these loans.
The easing of terms for home equity loans was reportedly afactor in the recent rapid growth in these loans. About one-fourthof the respondents said that easing terms on home equity loans,including entering the market for low- or no-equity loans, hadboosted the amount of these loans on their books. However, asignificantly larger fraction of the banks, about three-quarters,said that encouraging specific customers to switch from unsecuredconsumer loans to home equity loans had boosted home equityoutstandings. About three-quarters also said increased demand forthese loans was a factor in the recent growth.
Those banks that had followed policies to increase theirholdings of home equity loans said they did so because the increasedriskiness of, and the increased competition for, unsecured consumerloans had made the risk-adjusted yield on home equity loansrelatively more attractive. Those banks that experienced increased

III-A-3
demand for home equity loans attributed the increase to debtconsolidation and to the increased credit needs of their customers.
Credit Scores and Small Business Loans
Special questions on the survey examined respondents' use ofcredit scores for small business lending. Two-fifths of therespondents said they always use credit scores when making smallbusiness loans, and one-fourth said they sometimes use them. Ofthose banks that used credit scores, two-fifths used them for theautomatic acceptance or rejection of some applications and nearlyall used them as part of the evaluation process other than automaticacceptance or rejection. Two-fifths of the banks used the scores toevaluate existing loans. Only a few of the banks--15 percent--usedthe scores to set loan terms. Most of the banks purchase theirscores, although one-fourth used scores from an internally developedcredit scoring model.
Only two of the respondents reported having securitized anysmall business loans, and these two had securitized only SBA-guaranteed loans. One of these banks said the use of credit scoreshad not facilitated the securitization of the loans, and the otherbank said scoring had helped, but only slightly.
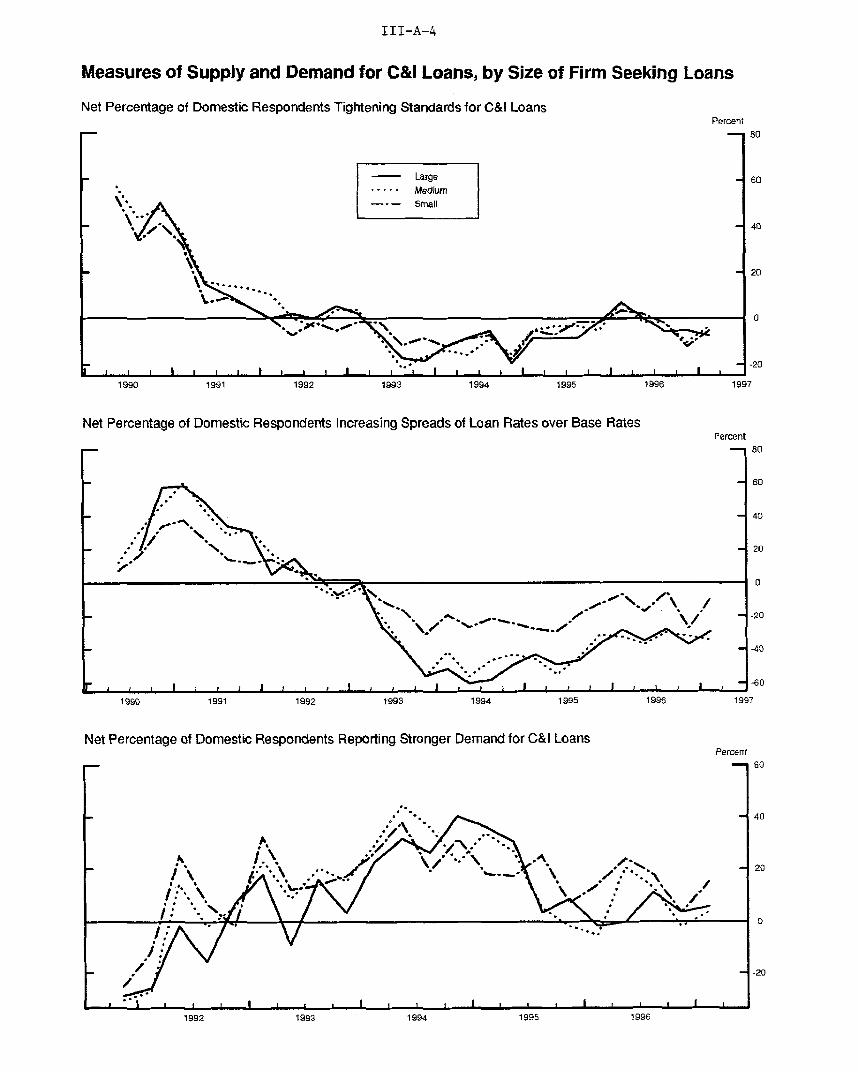
III-A-4
Measures of Supply and Demand for C&I Loans, by Size of Firm Seeking Loans
Net Percentage of Domestic Respondents Tightening Standards for C&I Loans
- Large..... Medium
\ --- Small
Percent
=1* .9'
1996 19
Net Percentage of Domestic Respondents Increasing Spreads of Loan Rates over Base Rates
197
Percent
1991 1992 1993
S-60
19971994 1995 1996
Net Percentage of Domestic Respondents Reporting Stronger Demand for C&I LoansPercent
- -20
i
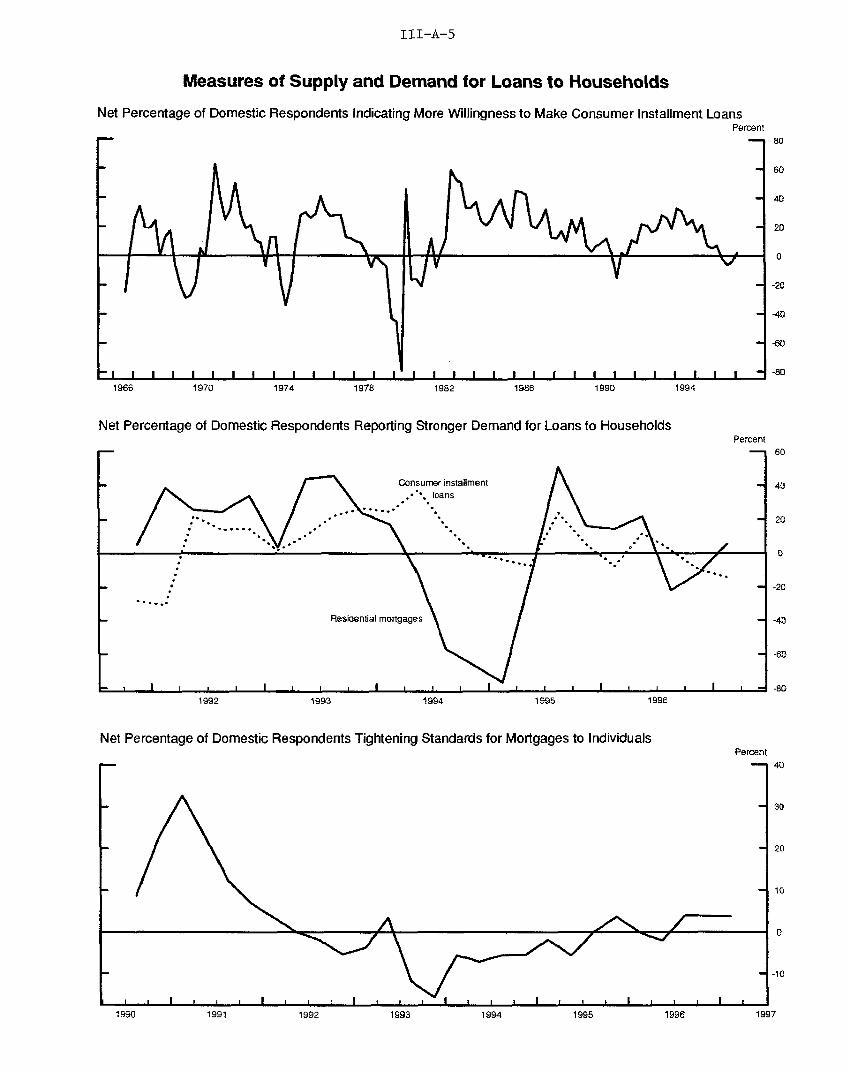
III-A-5
Measures of Supply and Demand for Loans to Households
Net Percentage of Domestic Respondents Indicating More Willingness to Make Consumer Installment LoansPercent
A NNAV/ - ^
I I I I I I I I I I I I I I I I I I I I I I I I I 1 I I - I I I I -
1966 1970 1974 1978 1982 1986 1990 1994
Net Percentage of Domestic Respondents Reporting Stronger Demand for Loans to HouseholdsPercent
1992 1993 1994 1995 1996
Net Percentage of Domestic Respondents Tightening Standards for Mortgages to IndividualsPercent
1992 1993 19941990 1991 1995 1996 1997
h k, h

INTERNATIONAL DEVELOPMENTS
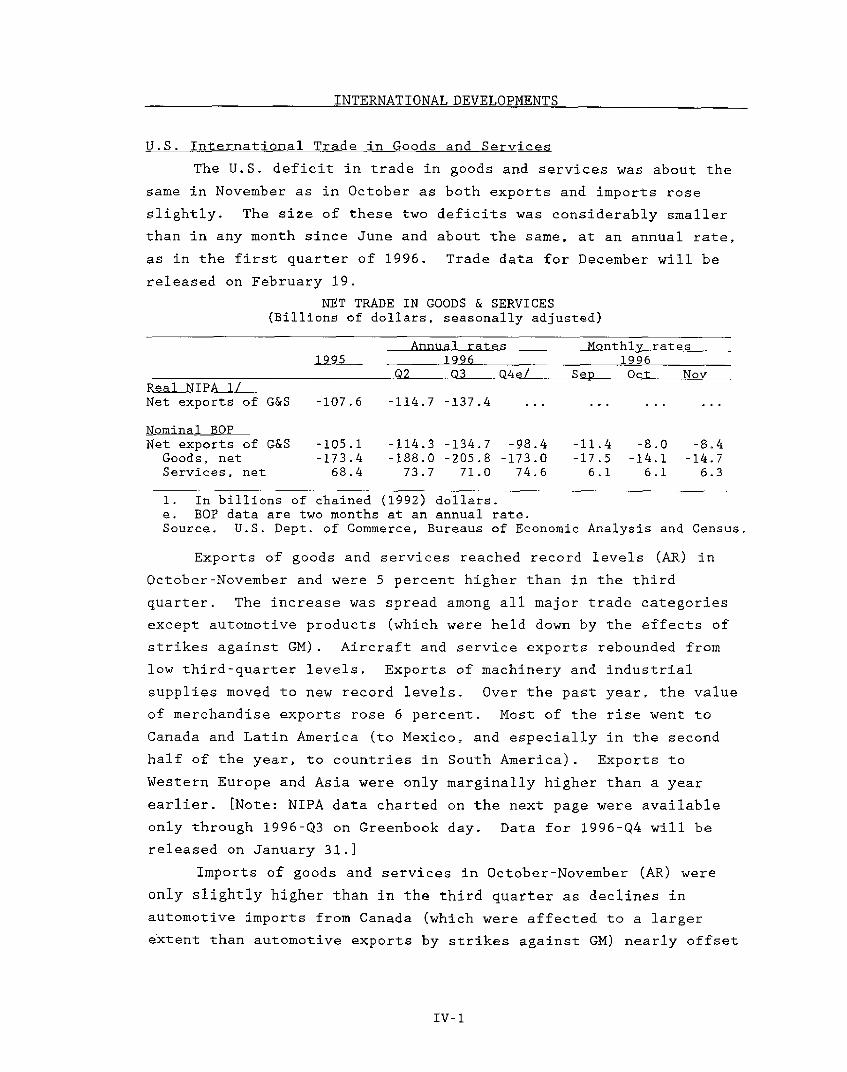
INTERNATIONAL DEVELOPMENTS
U.S. International Trade in Goods and Services
The U.S. deficit in trade in goods and services was about the
same in November as in October as both exports and imports rose
slightly. The size of these two deficits was considerably smaller
than in any month since June and about the same, at an annual rate,
as in the first quarter of 1996. Trade data for December will be
released on February 19.
NET TRADE IN GOODS & SERVICES(Billions of dollars, seasonally adjusted)
Annual rates Monthly rates1995 1996 1996
Q2 Q3 Q4e/ Sep Oct NovReal NIPA 1/Net exports of G&S -107.6 -114.7 -137.4 ...
Nominal BOPNet exports of G&S -105.1 -114.3 -134.7 -98.4 -11.4 -8.0 -8.4
Goods, net -173.4 -188.0 -205.8 -173.0 -17.5 -14.1 -14.7Services, net 68.4 73.7 71.0 74.6 6.1 6.1 6.3
1. In billions of chained (1992) dollars.e. BOP data are two months at an annual rate.Source, U.S. Dept. of Commerce, Bureaus of Economic Analysis and Census.
Exports of goods and services reached record levels (AR) in
October-November and were 5 percent higher than in the third
quarter. The increase was spread among all major trade categories
except automotive products (which were held down by the effects of
strikes against GM). Aircraft and service exports rebounded from
low third-quarter levels. Exports of machinery and industrial
supplies moved to new record levels. Over the past year, the value
of merchandise exports rose 6 percent. Most of the rise went to
Canada and Latin America (to Mexico, and especially in the second
half of the year, to countries in South America). Exports to
Western Europe and Asia were only marginally higher than a year
earlier. [Note: NIPA data charted on the next page were available
only through 1996-Q3 on Greenbook day. Data for 1996-Q4 will be
released on January 31.]
Imports of goods and services in October-November (AR) were
only slightly higher than in the third quarter as declines in
automotive imports from Canada (which were affected to a larger
extent than automotive exports by strikes against GM) nearly offset
IV-1
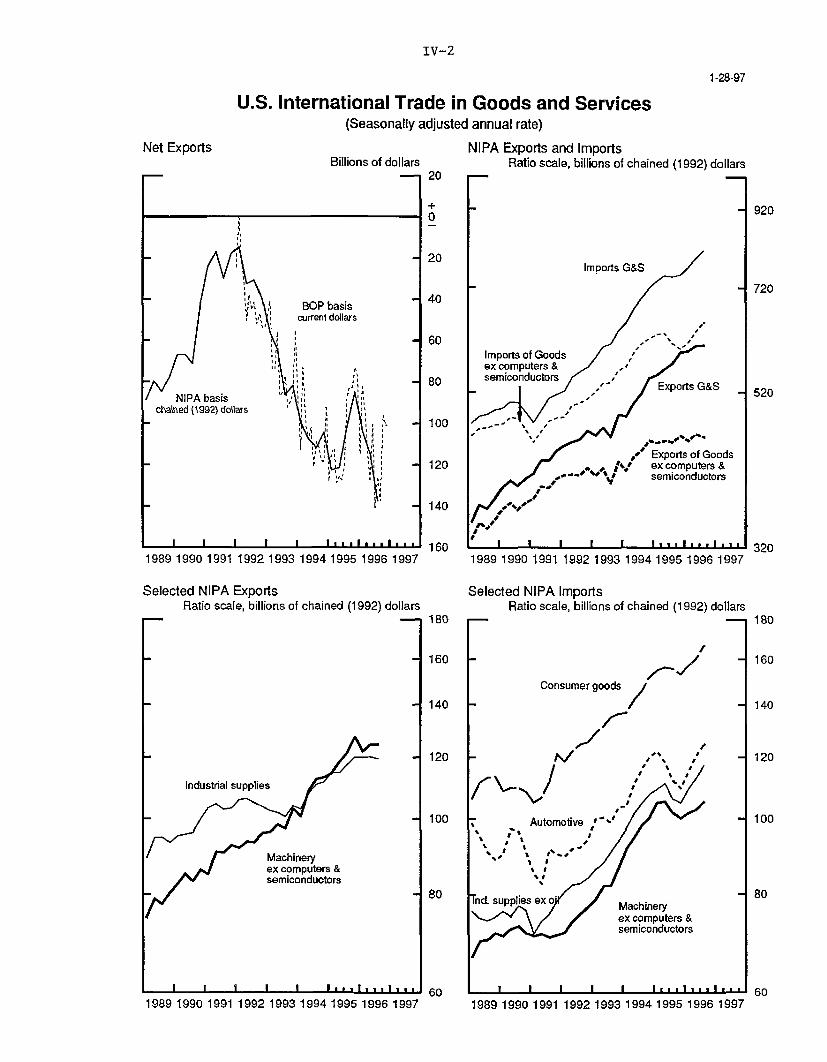
IV-2
1-28-97
U.S. International Trade in Goods and Services(Seasonally adjusted annual rate)
Net ExportsBillions of dollars
NIPA Exports and ImportsRatio scale, billions of chained (1992) dollars
1989 1990 1991 1992 1993 1994 1995 1996 1997
Selected NIPA ExportsRatio scale, billions of chained (1992) dollars
1989 1990 1991 1992 1993 1994 1995 1996 1997
Selected NIPA ImportsRatio scale, billions of chained (1992) dollars
1989 1990 1991 1992 1993 1994 1995 1996 1997 1989 1990 1991 1992 1993 1994 1995 1996 1997
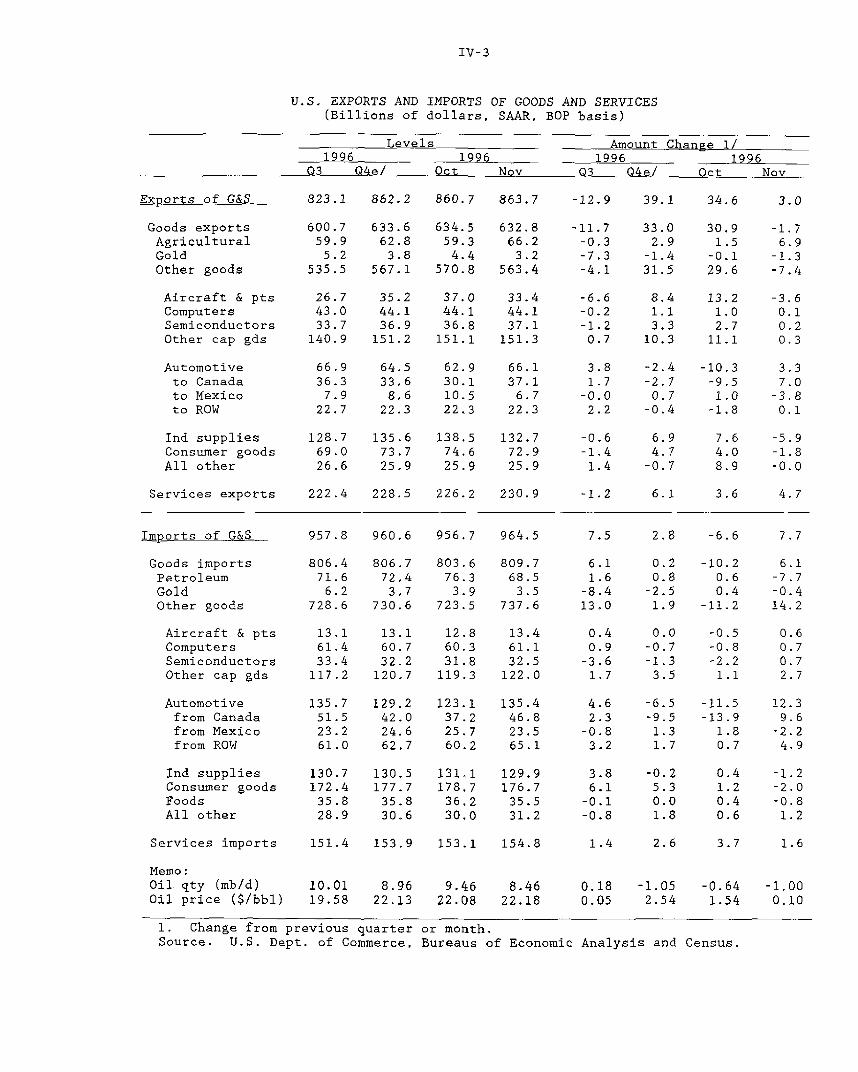
IV-3
U.S. EXPORTS AND IMPORTS OF GOODS AND SERVICES(Billions of dollars, SAAR, BOP basis)
Levels1996
03 Q4e/ Oct1996 1996
Nov1996_
Oct Nov
823.1 862.2 860.7 863.7 -12.9 39.1 34.6
600.759.9
5.2535.5
26.743.033.7
140.9
66.936.3
7.922.7
128.769.026.6
633.662.8
3.8567.1
35.244.136.9151.2
64.533.68,6
22.3
135.673.725.9
634.559.34.4
570.8
37.044.136.8
151.1
62.930.110.522.3
138.574.625.9
632.866.23.2
563.4
33.444.137.1
151.3
66.137.16.7
22.3
132.772.925.9
Exports of G&S
Goods exportsAgriculturalGoldOther goods
Aircraft & ptsComputersSemiconductorsOther cap gds
Automotiveto Canadato Mexicoto ROW
Ind suppliesConsumer goodsAll other
Services exports
Imports of G&S
Goods importsPetroleumGoldOther goods
Aircraft & ptsComputersSemiconductorsOther cap gds
Automotivefrom Canadafrom Mexicofrom ROW
Ind suppliesConsumer goodsFoodsAll other
Services imports
Memo:Oil qty (mb/d)Oil price ($/bbl)
806.471.6
6.2728.6
13.161.433.4
117.2
135.751.523.261.0
130.7172.435.828.9
806.772.43.7
730.6
13.1
60.732.2
120.7
129.242.024.662.7
130.5177.735.830.6
803.676.3
3.9723.5
12.860.331.8
119.3
123.137.225.7
60.2
131.1178.736,230,0
809.768.53.5
737.6
13.461.132.5122.0
135.446.823.565.1
129.9176.735.531.2
151.4 153.9 153.1 154.8
10.01 8.96 9.46 8.4619.58 22.13 22.08 22.18
-11.7-0.3-7.3-4.1
-6.6-0.2-1.2
0.7
3.81.7
-0.02.2
-0.6-1.4
1.4
-1.2
7.5
6.11.6-8.413.0
0.40.9-3.6
1.7
4.62.3-0.83.2
3.86.1-0.1-0.8
1.4
33.02.9-1.431.5
8.41.13.3
10.3
-2.4-2.7
0.7-0.4
6.94.7
-0.7
2.8
0.20.8-2.51.9
0.0-0.7-1.3
3.5
-6.5-9.51.31.7
-0.25.30.01.8
2.6
30.91.5
-0.129.6
13.21.02.7
11.1
-10.3-9.5
1.0-1.8
3.0
-1.76.9
-1.3-7.4
-3.60.10.20.3
3.37.0-3.80.1
7.6 -5.94.0 -1.88.9 -0.0
-6.6
-10.20.60.4
-11.2
-0.5-0.8-2.2
1.1
-11.5-13.9
1.80.7
0.41.20.40.6
3.7
7.7
6.1-7.7-0.414.2
0.60.70.72.7
12.39.6
-2.24.9
-1.2-2.0-0.8
1.2
1.6
0.18 -1.05 -0.64 -1.000.05 2.54 1.54 0.10
1. Change from previous quarterSource. U.S. Dept. of Commerce,
or month.Bureaus of Economic Analysis and Census.
Amount Change
1/
222.4 228.5 226.2 230.9
957.8 960,6 956.7 964.5
~"~' C'
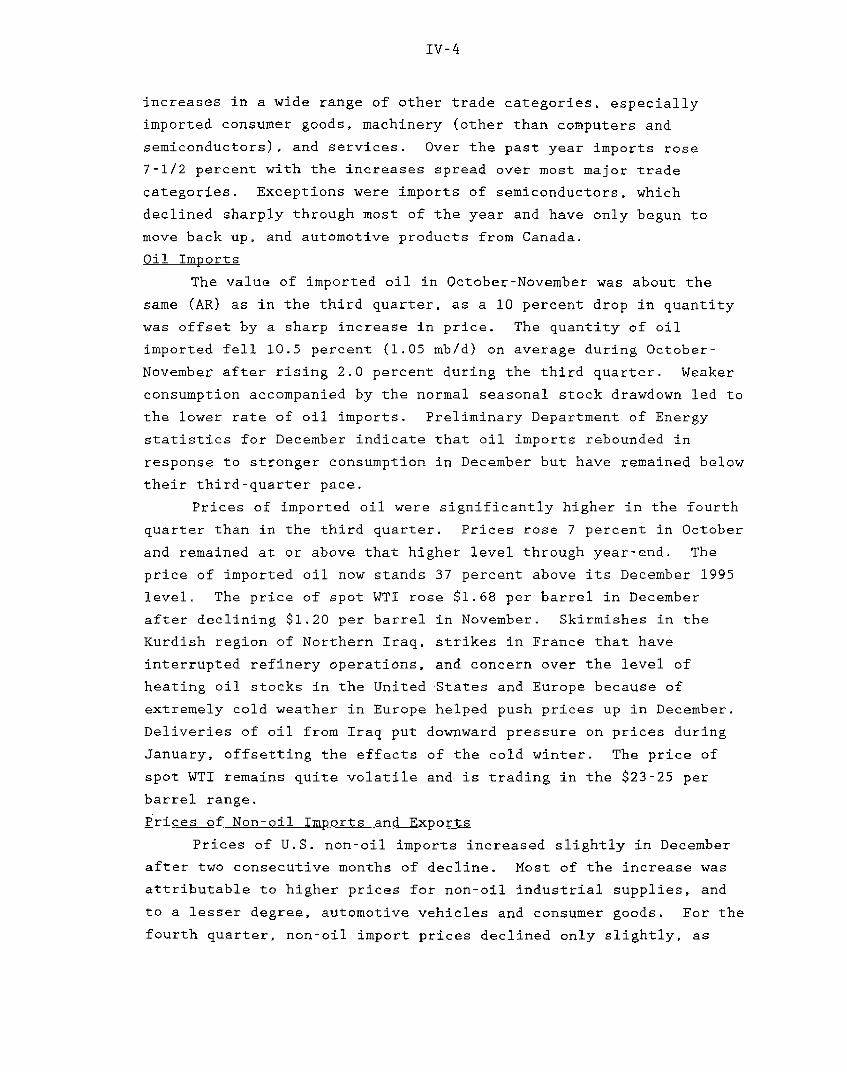
IV-4
increases in a wide range of other trade categories, especially
imported consumer goods, machinery (other than computers and
semiconductors), and services. Over the past year imports rose
7-1/2 percent with the increases spread over most major trade
categories. Exceptions were imports of semiconductors, which
declined sharply through most of the year and have only begun to
move back up, and automotive products from Canada.
Oil Imports
The value of imported oil in October-November was about the
same (AR) as in the third quarter, as a 10 percent drop in quantity
was offset by a sharp increase in price. The quantity of oil
imported fell 10.5 percent (1.05 mb/d) on average during October-
November after rising 2.0 percent during the third quarter. Weaker
consumption accompanied by the normal seasonal stock drawdown led to
the lower rate of oil imports. Preliminary Department of Energy
statistics for December indicate that oil imports rebounded in
response to stronger consumption in December but have remained below
their third-quarter pace.
Prices of imported oil were significantly higher in the fourth
quarter than in the third quarter. Prices rose 7 percent in October
and remained at or above that higher level through year-end. The
price of imported oil now stands 37 percent above its December 1995
level. The price of spot WTI rose $1.68 per barrel in December
after declining $1.20 per barrel in November. Skirmishes in the
Kurdish region of Northern Iraq, strikes in France that have
interrupted refinery operations, and concern over the level of
heating oil stocks in the United States and Europe because of
extremely cold weather in Europe helped push prices up in December.
Deliveries of oil from Iraq put downward pressure on prices during
January, offsetting the effects of the cold winter. The price of
spot WTI remains quite volatile and is trading in the $23-25 per
barrel range.
Prices of Non-oil Imports and Exports
Prices of U.S. non-oil imports increased slightly in December
after two consecutive months of decline. Most of the increase was
attributable to higher prices for non-oil industrial supplies, and
to a lesser degree, automotive vehicles and consumer goods. For the
fourth quarter, non-oil import prices declined only slightly, as
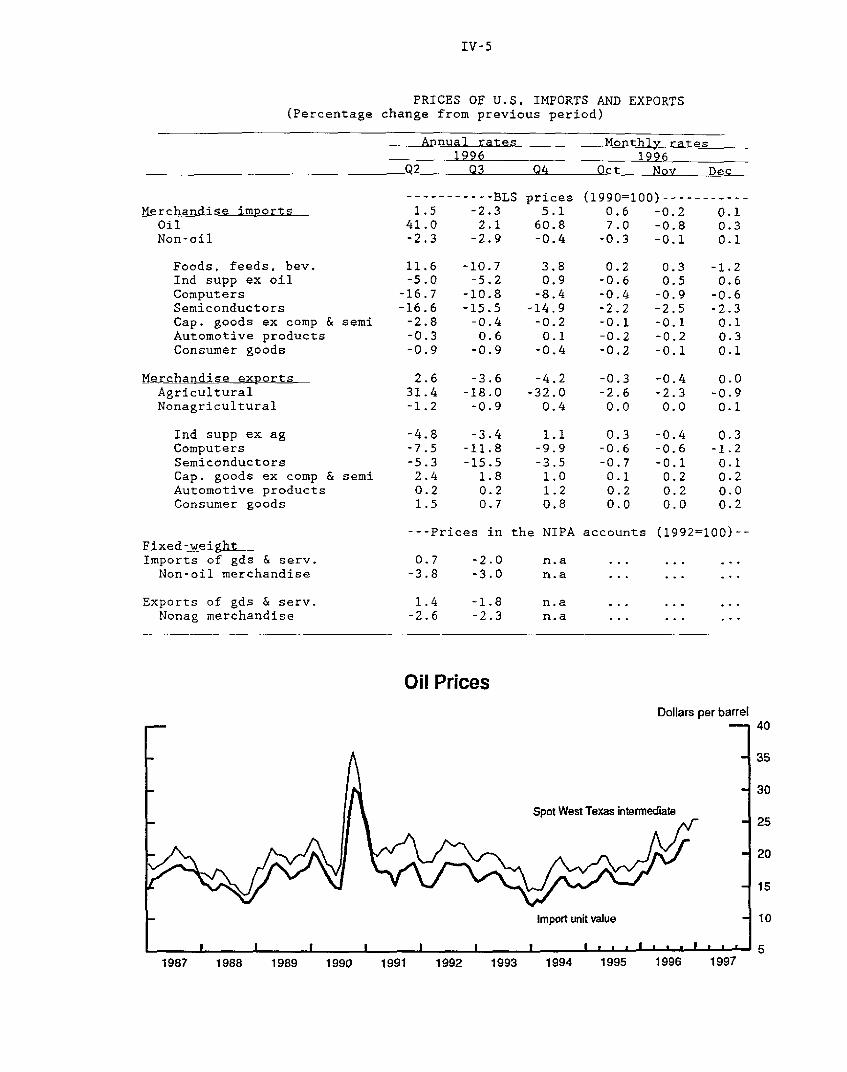
IV-5
PRICES OF U.S. IMPORTS AND EXPORTS(Percentage change from previous period)
Annual rates1996 t
Q2 Q3 Q4
Merchandise imports _OilNon-oil
Foods, feeds, bev.Ind supp ex oilComputersSemiconductorsCap. goods ex comp & semiAutomotive productsConsumer goods
Merchandise exportsAgriculturalNonagricultural
Ind supp ex agComputersSemiconductorsCap. goods ex comp & semiAutomotive productsConsumer goods
----------- BLS1.5 -2.3
41.0 2.1-2.3 -2.9
11.6-5.0
-16.7-16.6-2.8-0.3-0.9
2.631.4-1.2
-4.8-7.5-5.32.40.21.5
-10.7-5.2
-10.8-15.5-0.40.6-0.9
-3.6-18.0-0.9
-3.4-11.8-15.5
1.80.20.7
prices5.1
60.8-0.4
3.80.9-8.4
-14.9-0.20.1-0.4
-4.2-32.0
0.4
1.1-9.9-3.51.01.20.8
Monthly_ rates1996
Oct Nov Dec
(1990=100) ----------0.67.0-0.3
0.2-0.6-0.4-2.2-0.1-0.2-0.2
-0.3-2.60.0
0.3-0.6-0.70.10.20.0
-0.2-0.8-0.1
0.30.5-0.9-2.5-0.1-0.2-0.1
-0.4-2.30.0
-0.4-0.6-0.10.20.20.0
Fixed-weightImports of gds & serv.
Non-oil merchandise
Exports of gds & serv.Nonag merchandise
---Prices in the NIPA accounts (1992=100)--
0.7 -2.0 n.a ... ...-3.8 -3.0 n.a ... . . .
1.4 -1.8 n.a ...-2.6 -2.3 n.a .. .
Oil PricesDollars per barrel
Spot West Texas intermediate
Import unit value
1987 1988 1989 1990 1991 1992 1993 1994 1995 1996 1997
-1.20.6-0.6-2.30.10.30.1
0.0-0.90.1
0.3-1.20.10.20.00.2
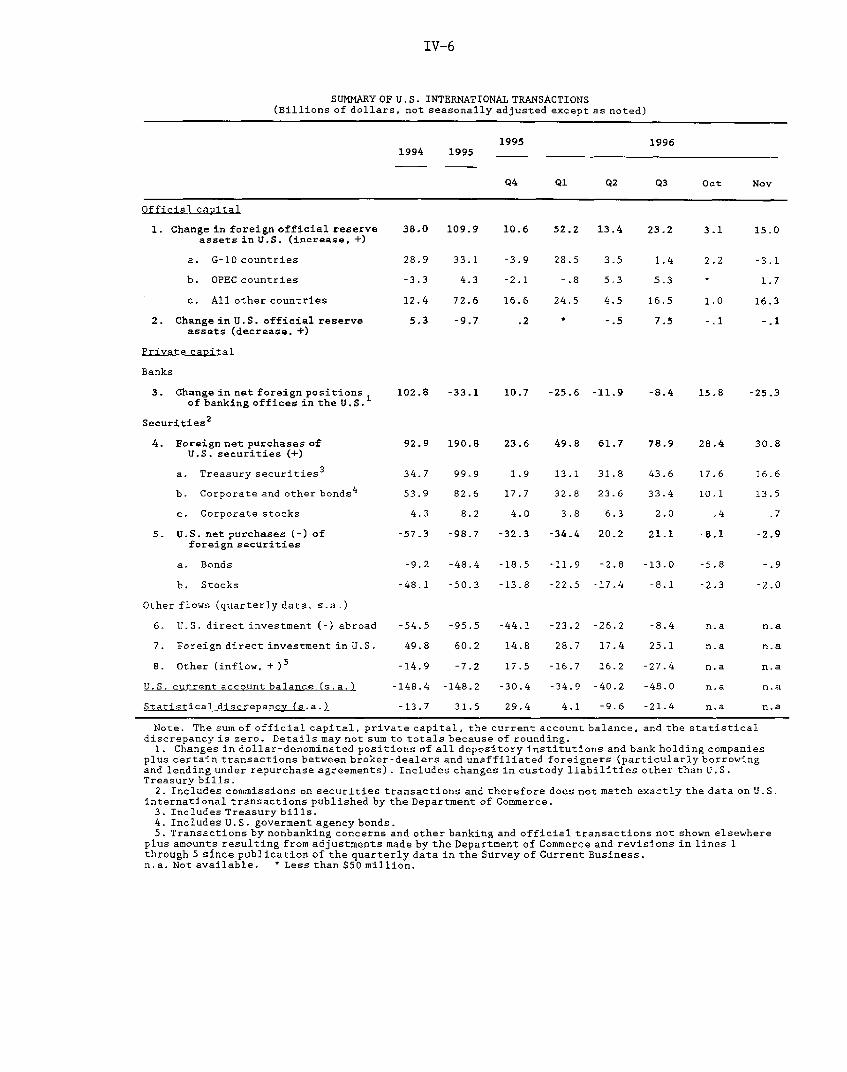
IV-6
SUMMARY OF U.S. INTERNATIONAL TRANSACTIONS(Billions of dollars, not seasonally adjusted except as noted)
1995 19961994 1995
Q4 Q1 Q2 Q3 Oct Nov
Official capital
1. Change in foreign official reserveassets in U.S. (increase, +)
a. G-10 countries
b. OPEC countries
c. All other countries
2. Change in U.S. official reserveassets (decrease. +)
Private capital
Banks
3. Change in net foreign positionsof banking offices in the U.S.
Securities2
4. Foreign net purchases ofU.S. securities (+)
a. Treasury securities3
b. Corporate and other bonds4
c. Corporate stocks
5. U.S. net purchases (-) offoreign securities
a. Bonds
b. Stocks
Other flows (quarterly data, s.a.)
6. U.S. direct investment (-) abroad
7. Foreign direct investment in U.S.
8. Other (inflow, +)5
U.S. culrent account balance (s.a.)
>.R+r4ctiril [CrH n n r f Coa .
38,0 109.9 10.6 52.2 13.4 23.2
28.9
-3.3
12.4
5,3
33.1
4.3
72.6
-9.7
-3.9
-2.1
16.6
.2
28.5
-. 8
24.5
*
1.4
5.3
16.5
7.5
3.1 15.0
2.2 -3.1
S 1.7
1.0 16.3
-. 1 -. 1
102.8 -33.1 10.7 -25.6 -11.9 -8.4 15.8 -25.3
92.9 190.8 23.6 49.8 61.7 78.9 28.4 30.8
34.7
53.9
4.3
-57.3
99.9
82.6
8.2
-98.7
1.9
17.7
4.0
-32.3
13.1
32.8
3.8
-34.4
31.8
23.6
6.3
-20.2
43.6
33.4
2.0
21.1
17.6
10.1
.4
-8.1
-9.2 -48.4 -18.5 -11.9 -2.8 -13.0 -5.8
-48.1 -50.3 -13.8 -22.5 -17.4 -8.1 -2.3
-54.5
49.8
-14.9
-148.4
-13.7
-95.5
60.2
-7.2
-148.2
31.5
-44.1
14.8
17.5
-30.4
29.4
-23.2
28.7
-16.7
-34.9
4.1
-26.2
17.4
16.2
-40.2
-9.6
-8.4
25.1
-27.4
-48.0
-21.4
16.6
13.5
.7
-2.9
-. 9
-2.0
n.a
n.a
n.a
n.a
n.a
Note. The sum of official capital, private capital, the current account balance, and the statisticaldiscrepancy is zero. Details may not sum to totals because of rounding.
1. Changes in dollar-denominated positions of all depository institutions and bank holding companiesplus certain transactions between broker-dealers and unaffiliated foreigners (particularly borrowingand lending under repurchase agreements). Includes changes in custody liabilities other than U.S.Treasury bills.
2. Includes commissions on securities transactions and therefore does not match exactly the data on U.S.international transactions published by the Department of Commerce.
3. Includes Treasury bills.4. Includes U.S. goverment agency bonds.5. Transactions by nonbanking concerns and other banking and official transactions not shown elsewhere
plus amounts resulting from adjustments made by the Department of Commerce and revisions in lines 1through 5 since publication of the quarterly data in the Survey of Current Business.n.a. Not available. * Less than $50 million.
IV-7
increases in prices of industrial supplies and automotive products
offset declines in other categories.
Prices of exports remained unchanged in December, primarily
because the continuing decline in prices of agricultural products
offset the rise in prices of nonagricultural exports. In the fourth
quarter, prices of agricultural exports dropped 32 percent at an
annual rate. Prices of nonagricultural exports rose slightly in the
fourth quarter with increases spread among all major trade
categories except computers and semiconductors.
U.S. International Financial Transactions
Foreign official reserve assets in the United States rose by
$15 billion in November (line 1 of the Summary of U.S. International
Transactions table). This increase is entirely attributable to
countries outside of the G-10. Spain, Brazil, China, and Taiwan all
recorded substantial increases. Partial data for December from
FRBNY show a further increase in foreign official reserves of $13
billion. Again, the increase came from countries outside the G-10.
OPEC reserves rose as did those of China, Spain, and several Latin
American countries.
Foreign private purchases of U.S. securities remained strong
in November (line 4). Of the $31 billion in net purchases in the
month, roughly one half was in Treasury securities, one-sixth in
agency securities, and most of the rest in corporate bonds. These
proportions are similar to the year 1996 through November. As
is generally the case, about half of the foreign purchases of
corporate and agency bonds in November (line 4b) were recorded in
the United Kingdom. Japanese residents recorded net purchases of
about $2 billion in November, slightly above their average share for
the year through November.
Of the $17 billion in foreign purchases of Treasuries in
November (line 4a), almost $13 billion was attributable to offshore
financial centers in the Caribbean. Purchases and sales of
Treasuries by these centers tend to be large and volatile, and they
have shown little net accumulation over the course of 1996.
Transactions by these offshore centers are also reflected in
the monthly movements of international bank flows, as U.S. banks and
securities dealers provide some of the financing for these
purchases. Of the $25 billion net outflow recorded by banking
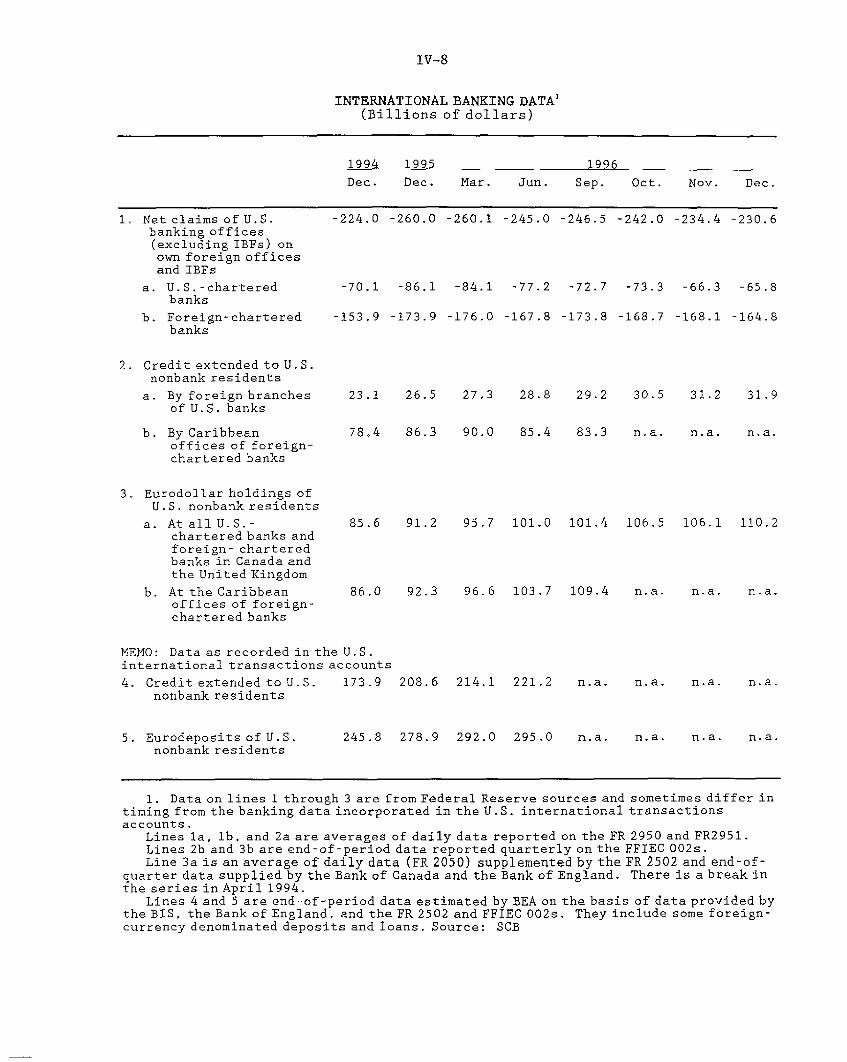
IV-8
INTERNATIONAL BANKING DATA 1(Billions of dollars)
1994 1995 1996
Dec. Dec. Mar. Jun. Sep. Oct. Nov. Dec.
1. Net claims of U.S. -224.0 -260.0 -260.1 -245.0 -246.5 -242.0 -234.4 -230.6banking offices(excluding IBFs) onown foreign officesand IBFs
a. U.S.-chartered -70.1 -86.1 -84.1 -77.2 -72.7 -73.3 -66.3 -65.8banks
b. Foreign-chartered -153.9 -173.9 -176.0 -167.8 -173.8 -168.7 -168.1 -164.8banks
2. Credit extended to U.S.nonbank residents
a. By foreign branches 23.1 26.5 27.3 28.8 29.2 30.5 31.2 31.9of U.S. banks
b. By Caribbean 78.4 86.3 90.0 85.4 83.3 n.a. n.a. n.a.offices of foreign-chartered banks
3. Eurodollar holdings ofU.S. nonbank residents
a. At all U.S.- 85.6 91.2 95.7 101.0 101.4 106.5 106.1 110.2chartered banks andforeign- charteredbanks in Canada andthe United Kingdom
b. At the Caribbean 86.0 92.3 96.6 103.7 109.4 n.a. n.a. n.a.offices of foreign-chartered banks
MEMO: Data as recorded in the U.S.international transactions accounts
4. Credit extended to U.S. 173.9 208.6 214.1 221.2 n.a. n.a. n.a. n.a.nonbank residents
5. Eurodeposits of U.S. 245.8 278.9 292.0 295.0 n.a. n.a. n.a. n.a.nonbank residents
1. Data on lines 1 through 3 are from Federal Reserve sources and sometimes differ intiming from the banking data incorporated in the U.S. international transactionsaccounts.
Lines la, lb, and 2a are averages of daily data reported on the FR 2950 and FR2951.Lines 2b and 3b are end-of-period data reported quarterly on the FFIEC 002s.Line 3a is an average of daily data (FR 2050) supplemented by the FR 2502 and end-of-
quarter data supplied by the Bank of Canada and the Bank of England. There is a break inthe series in April 1994.
Lines 4 and 5 are end-of-period data estimated by BEA on the basis of data provided bythe BIS, the Bank of England, and the FR 2502 and FFIEC 002s. They include some foreign-currency denominated deposits and loans. Source: SCB

IV-9
offices in November (line 3) roughly half is attributable to lending
by securities dealers.
Smoothing through the monthly swings, there have been large
net outflows through banking transactions over the course of the
year. As shown in line 1 of the International Banking Table, on a
monthly average basis, U.S. banking offices increased their net
claims on related foreign offices and IBFs by almost $30 billion
during 1996. In addition, Eurodollar holdings of U.S. non-bank
residents increased substantially during the year (line 3). BEA has
not fully incorporated the increase in Eurodollar holdings into the
accounts for the third quarter, which explains part of the large
negative statistical discrepancy in that quarter (last line of the
Summary Table).
U.S. private purchases of foreign bonds slowed markedly in
November, while purchases of foreign equities remained at roughly
their subdued third-quarter pace (lines 5a and 5b of the Summary
Table). Large net securities purchases in Asia, outside of Japan,
were offset by sales in the Caribbean.
Foreign Exchange Markets
The weighted-average value of the dollar in terms of the other
G-10 currencies has risen 4-3/4 percent since the December 17 FOMC
meeting. The dollar strengthened 6-3/4 percent against the yen and
5-3/4 percent against the mark and most other ERM currencies. The
dollar appreciated 2-1/2 percent on balance against sterling, but
depreciated 1-1/2 percent against the Canadian dollar.
Concerns over the near-term health of the Japanese economy and
the attendant implications for Japanese monetary policy have
contributed to the dollar's rise against the yen. These concerns
appear to be related to the restrictive budget for the fiscal year
beginning in April that was approved by the Japanese cabinet in late
December. In addition, renewed worries about the financial
condition of Japanese banks may have weighed on the yen. "Verbal
intervention" by Japanese officials in January did little to reverse
the yen's decline.
The dollar's strength over the intermeeting period against the
mark and other ERM currencies is related to the apparent divergence
in economic activity between the United States and most continental
European countries. Recent data releases in the United States have
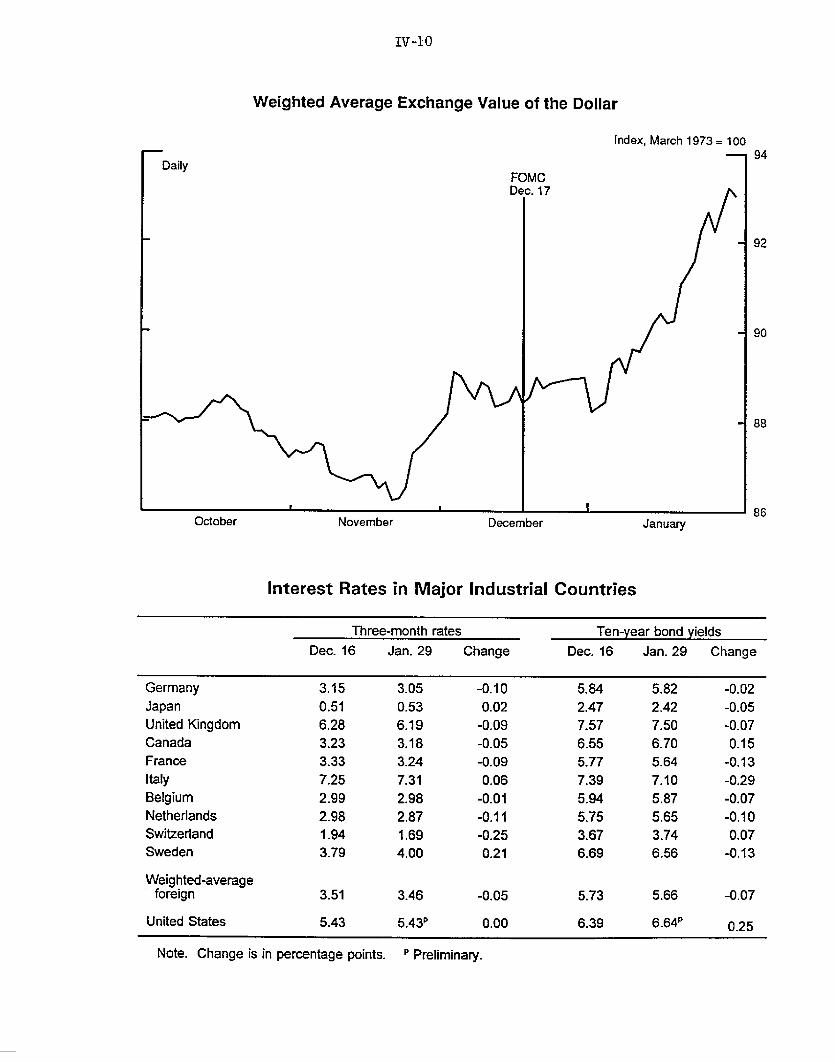
IV-10
Weighted Average Exchange Value of the Dollar
Index, March 1973 = 100
FOMCDec. 17
October November December January
Interest Rates in Major Industrial Countries
Three-month rates Ten-year bond yieldsDec. 16 Jan. 29 Change Dec. 16 Jan. 29 Change
Germany 3.15 3.05 -0,10 5.84 5.82 -0.02Japan 0.51 0.53 0.02 2.47 2.42 -0.05United Kingdom 6.28 6.19 -0.09 7.57 7.50 -0.07Canada 3.23 3.18 -0.05 6.55 6.70 0.15France 3.33 3.24 -0.09 5,77 5.64 -0.13Italy 7.25 7.31 0.06 7.39 7.10 -0.29Belgium 2.99 2.98 -0.01 5.94 5.87 -0.07Netherlands 2.98 2.87 -0.11 5.75 5.65 -0.10Switzerland 1.94 1.69 -0.25 3.67 3.74 0.07Sweden 3.79 4.00 0.21 6.69 6.56 -0.13
Weighted-averageforeign 3.51 3.46 -0.05 5.73 5.66 -0.07
United States 5.43 5.43" 0.00 6.39 6.64P 0.25
Note. Change is in percentage points.
Daily
P Preliminary.
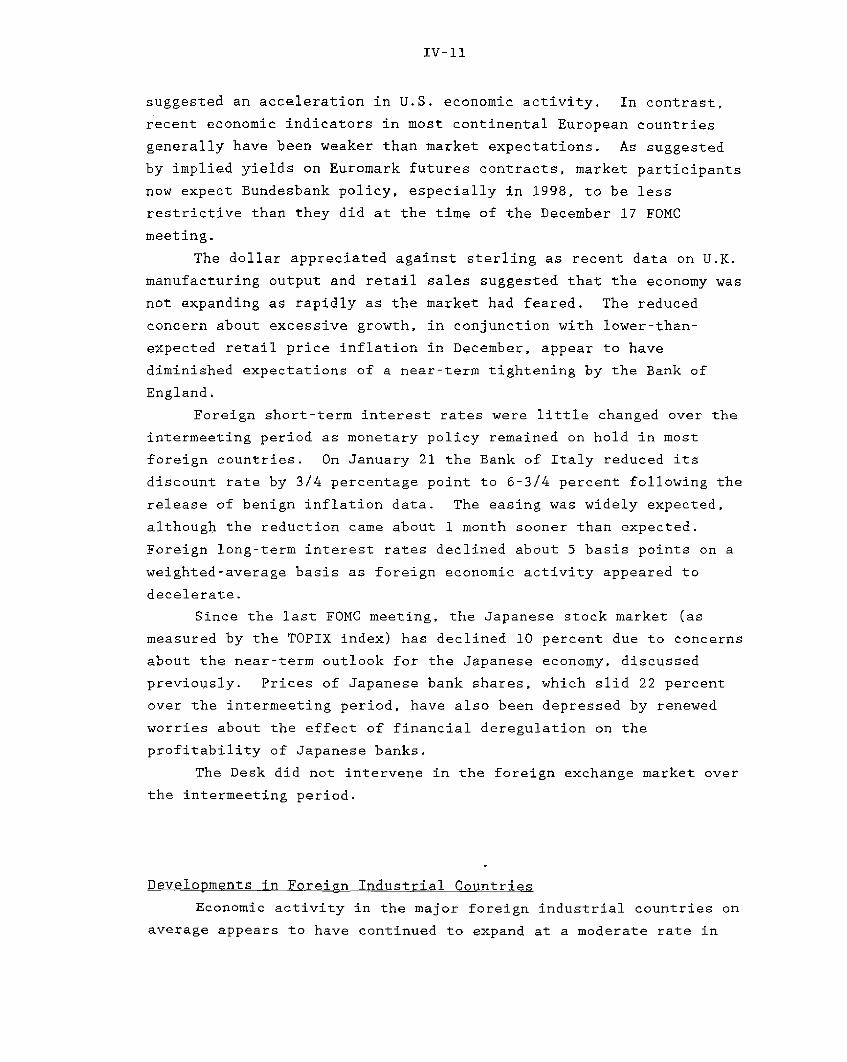
IV-11
suggested an acceleration in U.S. economic activity. In contrast,
recent economic indicators in most continental European countries
generally have been weaker than market expectations. As suggested
by implied yields on Euromark futures contracts, market participants
now expect Bundesbank policy, especially in 1998, to be less
restrictive than they did at the time of the December 17 FOMC
meeting.
The dollar appreciated against sterling as recent data on U.K.
manufacturing output and retail sales suggested that the economy was
not expanding as rapidly as the market had feared. The reduced
concern about excessive growth, in conjunction with lower-than-
expected retail price inflation in December, appear to have
diminished expectations of a near-term tightening by the Bank of
England.
Foreign short-term interest rates were little changed over the
intermeeting period as monetary policy remained on hold in most
foreign countries. On January 21 the Bank of Italy reduced its
discount rate by 3/4 percentage point to 6-3/4 percent following the
release of benign inflation data. The easing was widely expected,
although the reduction came about 1 month sooner than expected.
Foreign long-term interest rates declined about 5 basis points on a
weighted-average basis as foreign economic activity appeared to
decelerate.
Since the last FOMC meeting, the Japanese stock market (as
measured by the TOPIX index) has declined 10 percent due to concerns
about the near-term outlook for the Japanese economy, discussed
previously. Prices of Japanese bank shares, which slid 22 percent
over the intermeeting period, have also been depressed by renewed
worries about the effect of financial deregulation on the
profitability of Japanese banks.
The Desk did not intervene in the foreign exchange market over
the intermeeting period.
Developments in Foreign Industrial Countries
Economic activity in the major foreign industrial countries on
average appears to have continued to expand at a moderate rate in
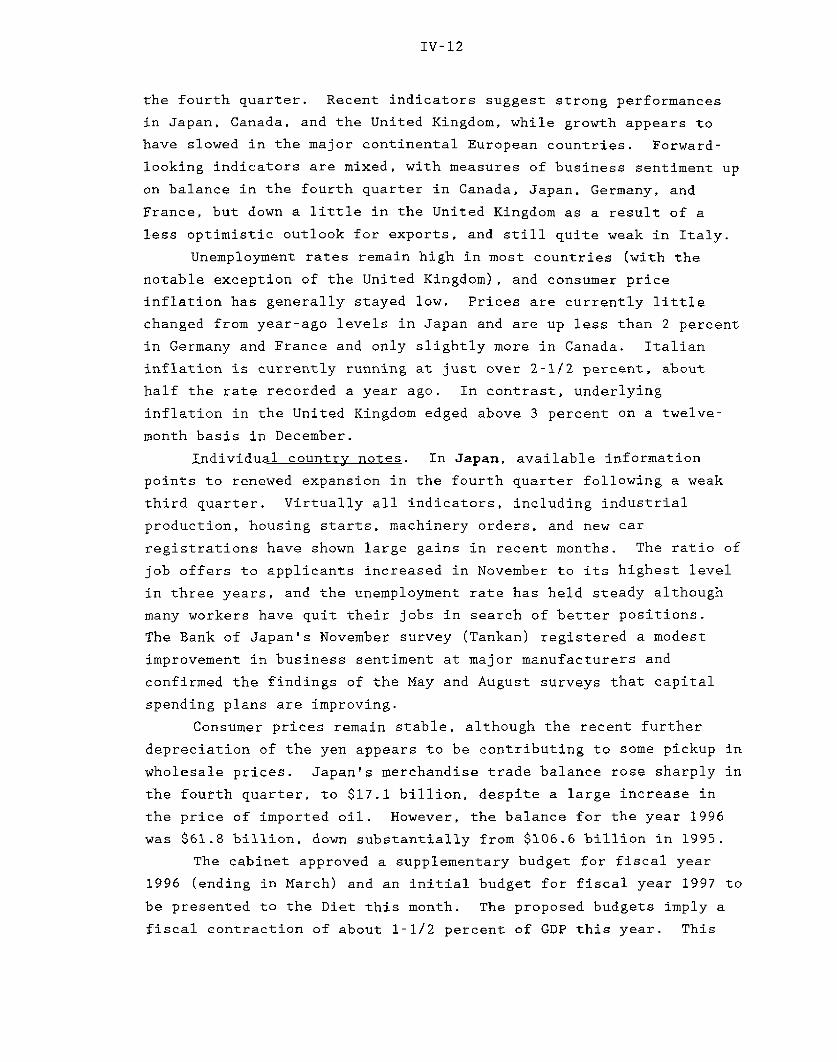
IV-12
the fourth quarter. Recent indicators suggest strong performances
in Japan, Canada, and the United Kingdom, while growth appears to
have slowed in the major continental European countries. Forward-
looking indicators are mixed, with measures of business sentiment up
on balance in the fourth quarter in Canada, Japan, Germany, and
France, but down a little in the United Kingdom as a result of a
less optimistic outlook for exports, and still quite weak in Italy.
Unemployment rates remain high in most countries (with the
notable exception of the United Kingdom), and consumer price
inflation has generally stayed low. Prices are currently little
changed from year-ago levels in Japan and are up less than 2 percent
in Germany and France and only slightly more in Canada. Italian
inflation is currently running at just over 2-1/2 percent, about
half the rate recorded a year ago. In contrast, underlying
inflation in the United Kingdom edged above 3 percent on a twelve-
month basis in December.
Individual country notes. In Japan, available information
points to renewed expansion in the fourth quarter following a weak
third quarter. Virtually all indicators, including industrial
production, housing starts, machinery orders, and new car
registrations have shown large gains in recent months. The ratio of
job offers to applicants increased in November to its highest level
in three years, and the unemployment rate has held steady although
many workers have quit their jobs in search of better positions.
The Bank of Japan's November survey (Tankan) registered a modest
improvement in business sentiment at major manufacturers and
confirmed the findings of the May and August surveys that capital
spending plans are improving.
Consumer prices remain stable, although the recent further
depreciation of the yen appears to be contributing to some pickup in
wholesale prices. Japan's merchandise trade balance rose sharply in
the fourth quarter, to $17.1 billion, despite a large increase in
the price of imported oil. However, the balance for the year 1996
was $61.8 billion, down substantially from $106.6 billion in 1995.
The cabinet approved a supplementary budget for fiscal year
1996 (ending in March) and an initial budget for fiscal year 1997 to
be presented to the Diet this month. The proposed budgets imply a
fiscal contraction of about 1-1/2 percent of GDP this year. This
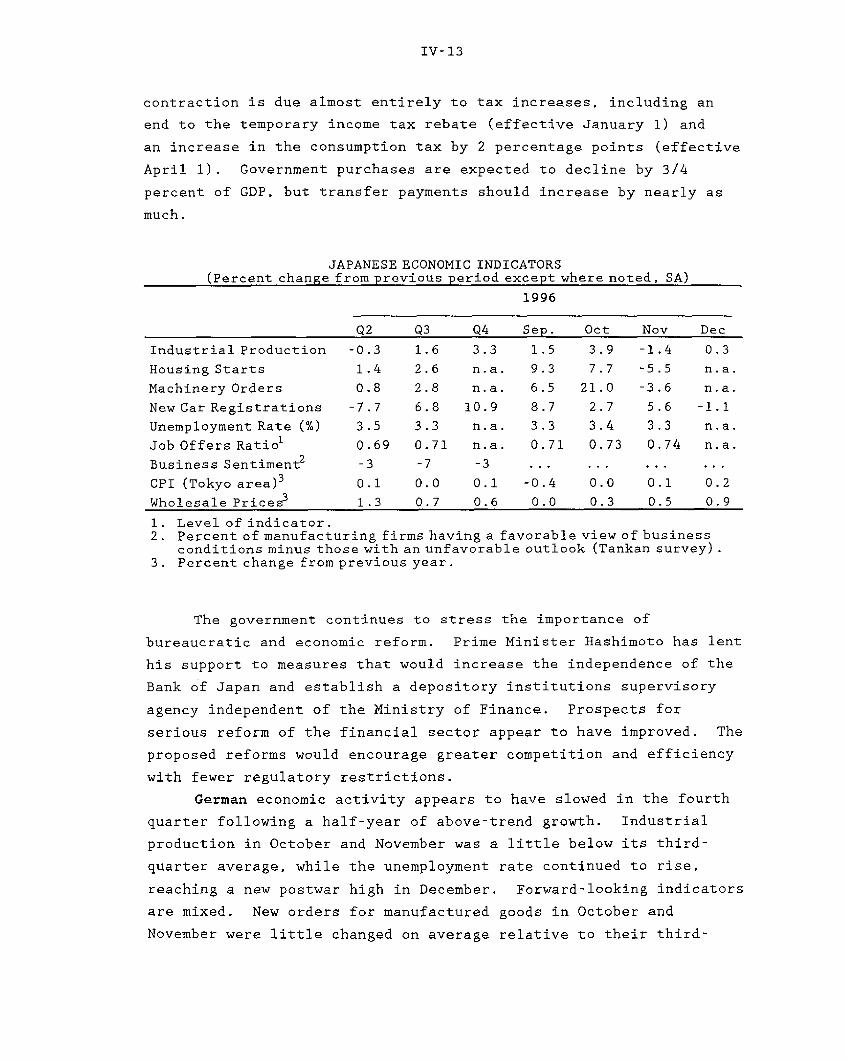
IV-13
contraction is due almost entirely to tax increases, including an
end to the temporary income tax rebate (effective January 1) and
an increase in the consumption tax by 2 percentage points (effective
April 1). Government purchases are expected to decline by 3/4
percent of GDP, but transfer payments should increase by nearly as
much.
JAPANESE ECONOMIC INDICATORS(Percent change from previous period except where noted, SA)
1996
Q2 Q3 Q4 Sep. Oct Nov Dec
Industrial Production -0.3 1.6 3.3 1.5 3.9 -1.4 0.3
Housing Starts 1.4 2.6 n.a. 9.3 7.7 -5.5 n.a.
Machinery Orders 0.8 2.8 n.a. 6.5 21.0 -3.6 n.a.
New Car Registrations -7.7 6.8 10.9 8.7 2.7 5.6 -1.1
Unemployment Rate (%) 3.5 3.3 n.a. 3.3 3.4 3.3 n.a.
Job Offers Ratio1 0.69 0.71 n.a. 0.71 0.73 0.74 n.a.
Business Sentiment2 -3 -7 -3 .. ...
CPI (Tokyo area)3 0.1 0.0 0.1 -0.4 0.0 0.1 0.2
Wholesale Prices 1.3 0.7 0.6 0.0 0.3 0.5 0.9
1. Level of indicator.2. Percent of manufacturing firms having a favorable view of business
conditions minus those with an unfavorable outlook (Tankan survey).3. Percent change from previous year.
The government continues to stress the importance of
bureaucratic and economic reform. Prime Minister Hashimoto has lent
his support to measures that would increase the independence of the
Bank of Japan and establish a depository institutions supervisory
agency independent of the Ministry of Finance. Prospects for
serious reform of the financial sector appear to have improved. The
proposed reforms would encourage greater competition and efficiency
with fewer regulatory restrictions.
German economic activity appears to have slowed in the fourth
quarter following a half-year of above-trend growth. Industrial
production in October and November was a little below its third-
quarter average, while the unemployment rate continued to rise,
reaching a new postwar high in December. Forward-looking indicators
are mixed. New orders for manufactured goods in October and
November were little changed on average relative to their third-
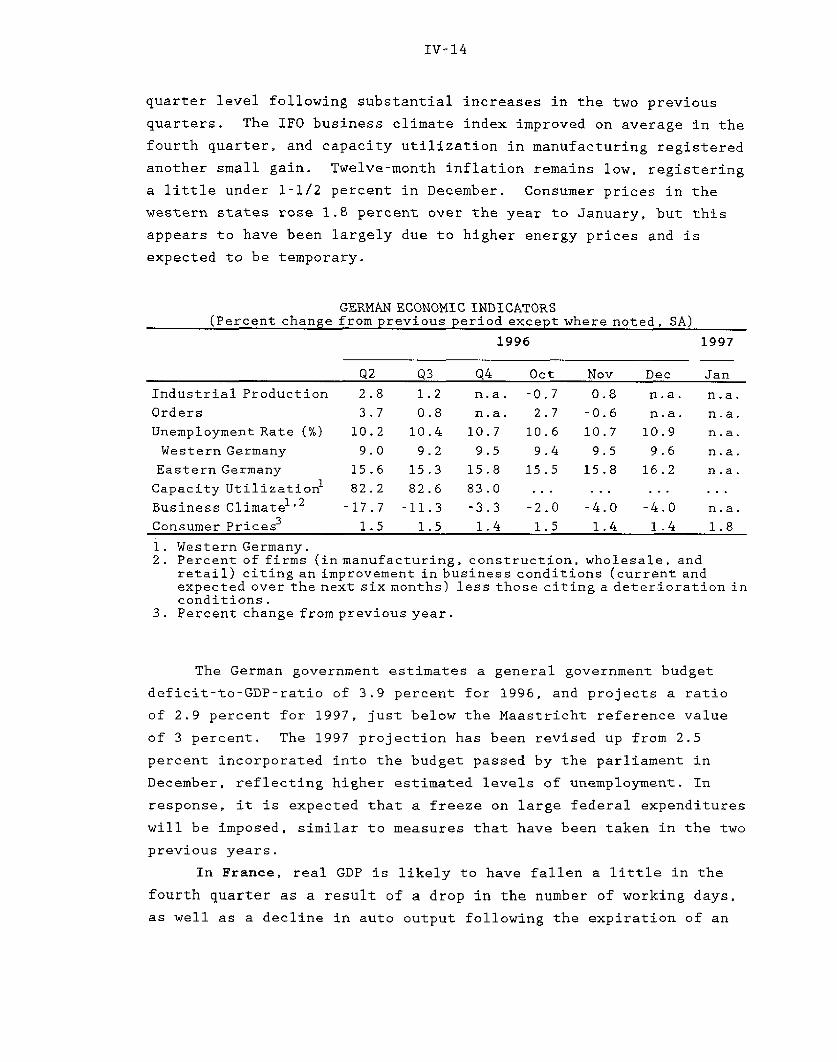
IV-14
quarter level following substantial increases in the two previous
quarters. The IFO business climate index improved on average in the
fourth quarter, and capacity utilization in manufacturing registered
another small gain. Twelve-month inflation remains low, registering
a little under 1-1/2 percent in December. Consumer prices in the
western states rose 1.8 percent over the year to January, but this
appears to have been largely due to higher energy prices and is
expected to be temporary.
GERMAN ECONOMIC INDICATORS(Percent change from previous period except where noted, SA)
1996 1997
Q2 Q3 Q4 Oct Nov Dec Jan
Industrial Production 2.8 1.2 n.a. -0.7 0.8 n.a. n.a.
Orders 3.7 0.8 n.a. 2.7 -0.6 n.a. n.a.
Unemployment Rate (%) 10.2 10.4 10.7 10.6 10.7 10.9 n.a.
Western Germany 9.0 9.2 9.5 9.4 9.5 9.6 n.a.
Eastern Germany 15.6 15.3 15.8 15.5 15.8 16.2 n.a.
Capacity Utilization 82.2 82.6 83.0 . .. ... ...
Business Climatel' 2 -17.7 -11.3 -3.3 -2.0 -4.0 -4.0 n.a.
Consumer Prices3 1.5 1.5 1.4 1.5 1.4 1.4 1.8
1. Western Germany.2. Percent of firms (in manufacturing, construction, wholesale, and
retail) citing an improvement in business conditions (current andexpected over the next six months) less those citing a deterioration inconditions.
3. Percent change from previous year.
The German government estimates a general government budget
deficit-to-GDP-ratio of 3.9 percent for 1996, and projects a ratio
of 2.9 percent for 1997, just below the Maastricht reference value
of 3 percent. The 1997 projection has been revised up from 2.5
percent incorporated into the budget passed by the parliament in
December, reflecting higher estimated levels of unemployment. In
response, it is expected that a freeze on large federal expenditures
will be imposed, similar to measures that have been taken in the two
previous years.
In France, real GDP is likely to have fallen a little in the
fourth quarter as a result of a drop in the number of working days,
as well as a decline in auto output following the expiration of an
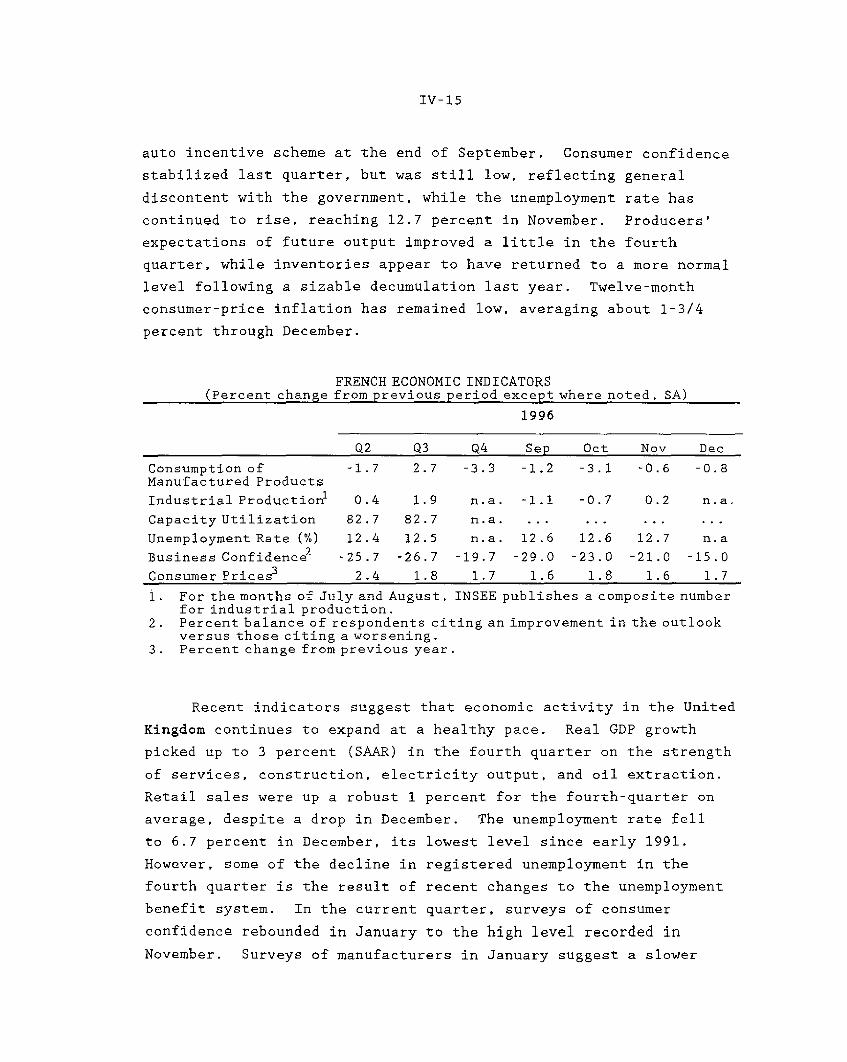
IV-15
auto incentive scheme at the end of September. Consumer confidence
stabilized last quarter, but was still low, reflecting general
discontent with the government, while the unemployment rate has
continued to rise, reaching 12.7 percent in November. Producers'
expectations of future output improved a little in the fourth
quarter, while inventories appear to have returned to a more normal
level following a sizable decumulation last year. Twelve-month
consumer-price inflation has remained low, averaging about 1-3/4
percent through December.
FRENCH ECONOMIC INDICATORS(Percent change from previous period except where noted, SA)
1996
Q2 Q3 Q4 Sep Oct Nov Dec
Consumption of -1.7 2.7 -3.3 -1.2 -3.1 -0.6 -0.8Manufactured Products
Industrial Production1 0.4 1.9 n.a. -1.1 -0.7 0.2 n.a.
Capacity Utilization 82.7 82.7 n.a. ... .. ... ...
Unemployment Rate (%) 12.4 12.5 n.a. 12.6 12.6 12.7 n.a
Business Confidence2 -25.7 -26.7 -19.7 -29.0 -23.0 -21.0 -15.0
Consumer Prices3 2.4 1.8 1.7 1.6 1.8 1.6 1.7
1. For the months of July and August, INSEE publishes a composite numberfor industrial production.
2. Percent balance of respondents citing an improvement in the outlookversus those citing a worsening.
3. Percent change from previous year.
Recent indicators suggest that economic activity in the United
Kingdom continues to expand at a healthy pace. Real GDP growth
picked up to 3 percent (SAAR) in the fourth quarter on the strength
of services, construction, electricity output, and oil extraction.
Retail sales were up a robust 1 percent for the fourth-quarter on
average, despite a drop in December. The unemployment rate fell
to 6.7 percent in December, its lowest level since early 1991.
However, some of the decline in registered unemployment in the
fourth quarter is the result of recent changes to the unemployment
benefit system. In the current quarter, surveys of consumer
confidence rebounded in January to the high level recorded in
November. Surveys of manufacturers in January suggest a slower
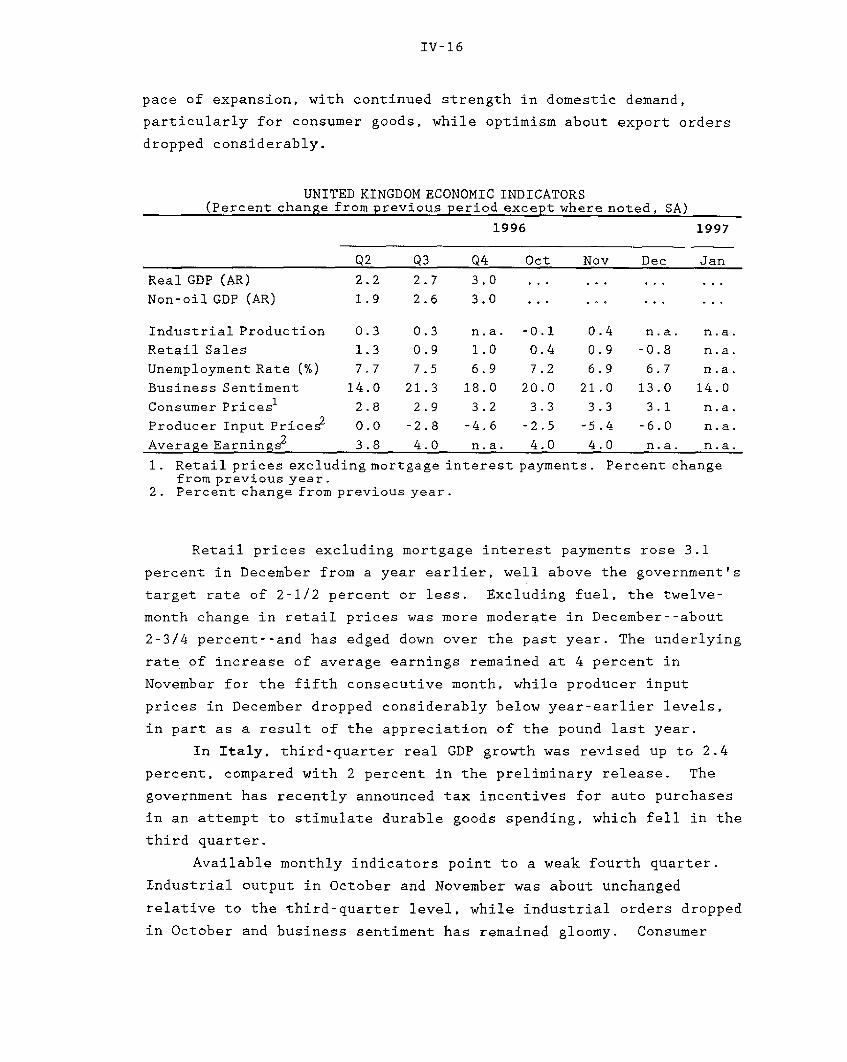
IV-16
pace of expansion, with continued strength in domestic demand,
particularly for consumer goods, while optimism about export orders
dropped considerably.
UNITED KINGDOM ECONOMIC INDICATORS(Percent change from previous period except where noted, SA)
1996 1997
Q2 Q3 Q4 Oct Nov Dec Jan
Real GDP (AR) 2.2 2.7 3.0 ... ... ...
Non-oil GDP (AR) 1.9 2.6 3.0... ...
Industrial Production 0.3 0.3 n.a. -0.1 0.4 n.a. n.a.
Retail Sales 1.3 0.9 1.0 0.4 0.9 -0.8 n.a.
Unemployment Rate (%) 7.7 7.5 6.9 7.2 6.9 6.7 n.a.
Business Sentiment 14.0 21.3 18.0 20.0 21.0 13.0 14.0
Consumer Prices1 2.8 2.9 3.2 3.3 3.3 3.1 n.a.
Producer Input Price 2 0.0 -2.8 -4.6 -2.5 -5.4 -6.0 n.a.
Average Earnings2 3.8 4.0 n.a. 4.0 4.0 n.a. n.a.
1. Retail prices excluding mortgage interest payments. Percent changefrom previous year.
2. Percent change from previous year.
Retail prices excluding mortgage interest payments rose 3.1
percent in December from a year earlier, well above the government's
target rate of 2-1/2 percent or less. Excluding fuel, the twelve-
month change in retail prices was more moderate in December--about
2-3/4 percent--and has edged down over the past year. The underlying
rate of increase of average earnings remained at 4 percent in
November for the fifth consecutive month, while producer input
prices in December dropped considerably below year-earlier levels,
in part as a result of the appreciation of the pound last year.
In Italy, third-quarter real GDP growth was revised up to 2.4
percent, compared with 2 percent in the preliminary release. The
government has recently announced tax incentives for auto purchases
in an attempt to stimulate durable goods spending, which fell in the
third quarter.
Available monthly indicators point to a weak fourth quarter.
Industrial output in October and November was about unchanged
relative to the third-quarter level, while industrial orders dropped
in October and business sentiment has remained gloomy. Consumer
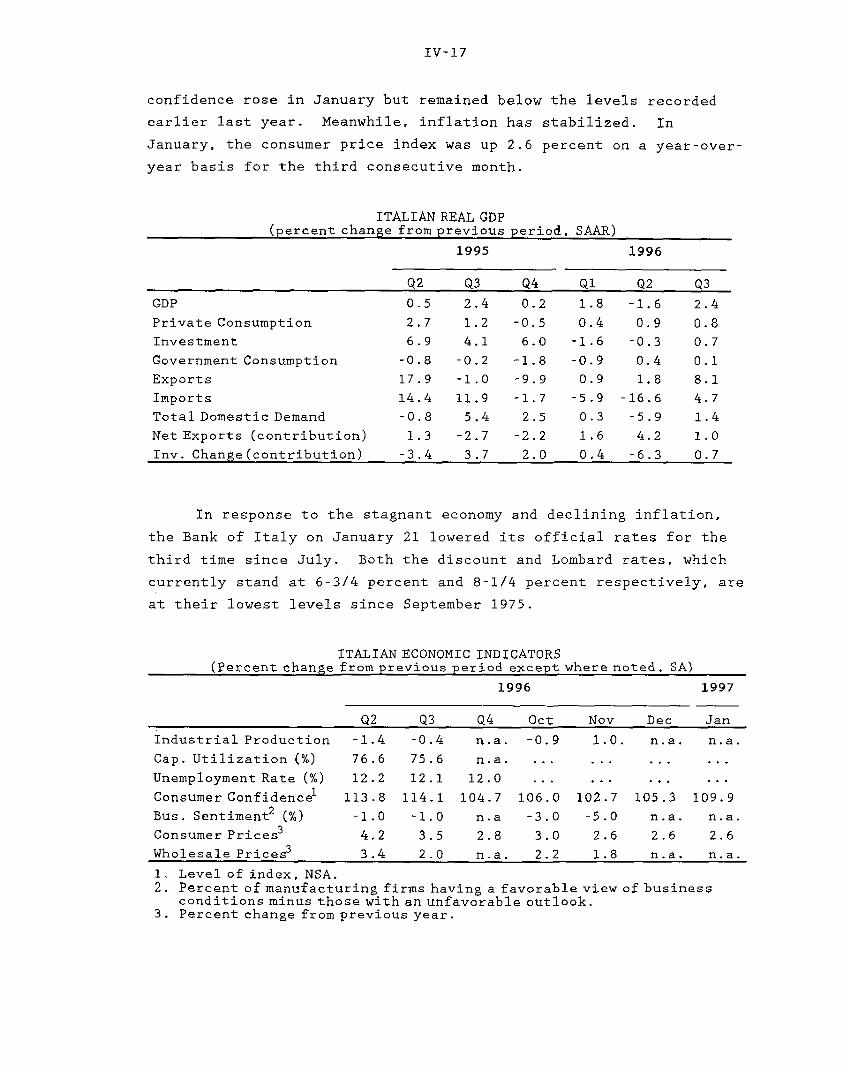
IV-17
confidence rose in January but remained below the levels recorded
earlier last year. Meanwhile, inflation has stabilized. In
January, the consumer price index was up 2.6 percent on a year-over-
year basis for the third consecutive month.
ITALIAN REAL GDP(percent change from previous previous period, SAAR)
1995 1996
Q2 Q3 04 Q1 Q2 Q3
GDP 0.5 2.4 0.2 1.8 -1.6 2.4
Private Consumption 2.7 1.2 -0.5 0.4 0.9 0.8
Investment 6.9 4.1 6.0 -1.6 -0.3 0.7
Government Consumption -0.8 -0.2 -1.8 -0.9 0.4 0.1
Exports 17.9 -1.0 -9.9 0.9 1.8 8.1
Imports 14.4 11.9 -1.7 -5.9 -16.6 4.7
Total Domestic Demand -0.8 5.4 2.5 0.3 -5.9 1.4
Net Exports (contribution) 1.3 -2.7 -2.2 1.6 4.2 1.0
Inv. Change (contribution) -3.4 3.7 2.0 0.4 -6.3 0.7
In response to the stagnant economy and declining inflation,
the Bank of Italy on January 21 lowered its official rates for the
third time since July. Both the discount and Lombard rates, which
currently stand at 6-3/4 percent and 8-1/4 percent respectively, are
at their lowest levels since September 1975.
ITALIAN ECONOMIC INDICATORS(Percent change from previous period except where noted, SA)
1996 1997
Q2 Q3 Q4 Oct Nov Dec Jan
Industrial Production -1.4 -0.4 n.a. -0.9 1.0. n.a. n.a.
Cap. Utilization (%) 76.6 75.6 n.a. ... .. ... .
Unemployment Rate (%) 12.2 12.1 12.0 .... ... ...
Consumer Confidence1 113.8 114.1 104.7 106.0 102.7 105.3 109.9
Bus. Sentiment2 (%) -1.0 -1.0 n.a -3.0 -5.0 n.a. n.a.
Consumer Prices3 4.2 3.5 2.8 3.0 2.6 2.6 2.6
Wholesale Prices 3.4 2.0 n.a. 2.2 1.8 n.a. n.a.
1. Level of index, NSA.2. Percent of manufacturing firms having a favorable view of business
conditions minus those with an unfavorable outlook.3. Percent change from previous year.
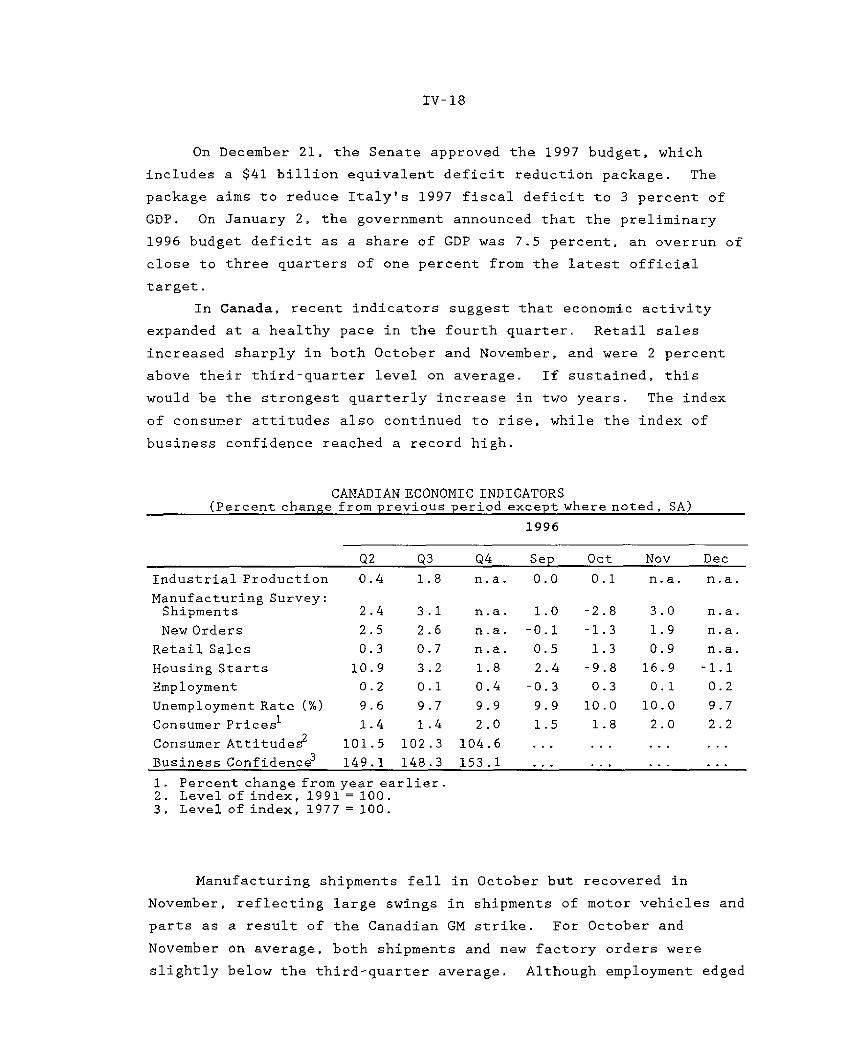
IV-18
On December 21, the Senate approved the 1997 budget, which
includes a $41 billion equivalent deficit reduction package. The
package aims to reduce Italy's 1997 fiscal deficit to 3 percent of
GDP. On January 2, the government announced that the preliminary
1996 budget deficit as a share of GDP was 7.5 percent, an overrun of
close to three quarters of one percent from the latest official
target.
In Canada, recent indicators suggest that economic activity
expanded at a healthy pace in the fourth quarter. Retail sales
increased sharply in both October and November, and were 2 percent
above their third-quarter level on average. If sustained, this
would be the strongest quarterly increase in two years. The index
of consumer attitudes also continued to rise, while the index of
business confidence reached a record high.
CANADIAN ECONOMIC INDICATORS(Percent change from previous period except where noted, SA)
1996
Q2 Q3 Q4 Sep Oct Nov Dec
Industrial Production 0.4 1.8 n.a. 0.0 0.1 n.a. n.a.
Manufacturing Survey:Shipments 2.4 3.1 n.a. 1.0 -2.8 3.0 n.a.
New Orders 2.5 2.6 n.a. -0.1 -1.3 1.9 n.a.
Retail Sales 0.3 0.7 n.a. 0.5 1.3 0.9 n.a.
Housing Starts 10.9 3.2 1.8 2.4 -9.8 16.9 -1.1
Employment 0.2 0.1 0.4 -0.3 0.3 0.1 0.2
Unemployment Rate (%) 9.6 9.7 9.9 9.9 10.0 10.0 9.7
Consumer Prices1 1.4 1.4 2.0 1.5 1.8 2.0 2.2
Consumer Attitude 2 101.5 102.3 104.6 ... .Business Confidence3 149.1 148.3 153.1 ...
1. Percent change from year earlier.2. Level of index, 1991 = 100.3. Level of index, 1977 = 100.
Manufacturing shipments fell in October but recovered in
November, reflecting large swings in shipments of motor vehicles and
parts as a result of the Canadian GM strike. For October and
November on average, both shipments and new factory orders were
slightly below the third-quarter average. Although employment edged
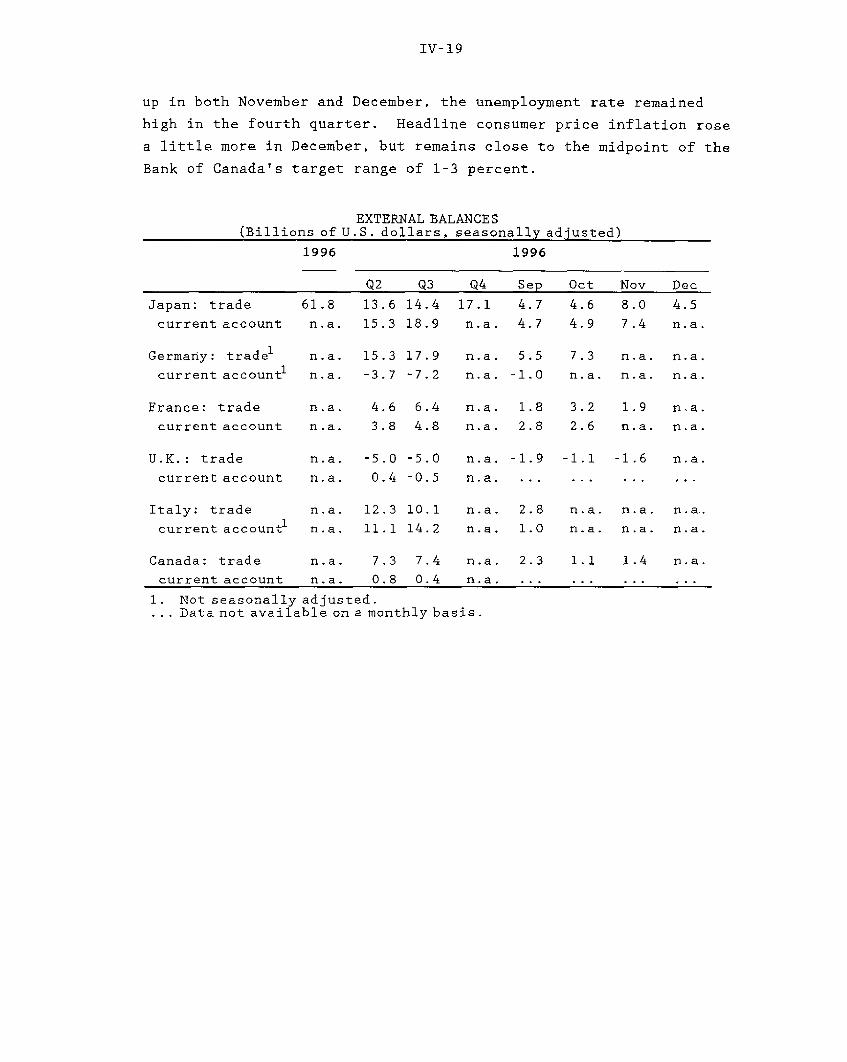
IV-19
up in both November and December, the unemployment rate remained
high in the fourth quarter. Headline consumer price inflation rose
a little more in December, but remains close to the midpoint of the
Bank of Canada's target range of 1-3 percent.
EXTERNAL BALANCES(Billions of U.S. dollars, seasonally adjusted)
1996 1996
Q2 Q3 Q4 Sep Oct Nov Dec
Japan: trade 61.8 13.6 14.4 17.1 4.7 4.6 8.0 4.5
current account n.a. 15.3 18.9 n.a. 4.7 4.9 7.4 n.a.
Germany: trade n.a. 15.3 17.9 n.a. 5.5 7.3 n.a. n.a.
current account1 n.a. -3.7 -7.2 n.a. -1.0 n.a. n.a. n.a.
France: trade n.a. 4.6 6.4 n.a. 1.8 3.2 1.9 n.a.
current account n.a. 3.8 4.8 n.a. 2.8 2.6 n.a. n.a.
U.K.: trade n.a. -5.0 -5.0 n.a. -1.9 -1.1 -1.6 n.a.
current account n.a. 0.4 -0.5 n.a. ... ... ... ...
Italy: trade n.a. 12.3 10.1 n.a. 2.8 n.a. n.a. n.a.
current account n.a. 11.1 14.2 n.a. 1.0 n.a. n.a. n.a.
Canada: trade n.a. 7.3 7.4 n.a. 2.3 1.1 1.4 n.a.
current account n.a. 0.8 0.4 n.a. ... ... ...
1. Not seasonally adjusted.... Data not available on a monthly basis.
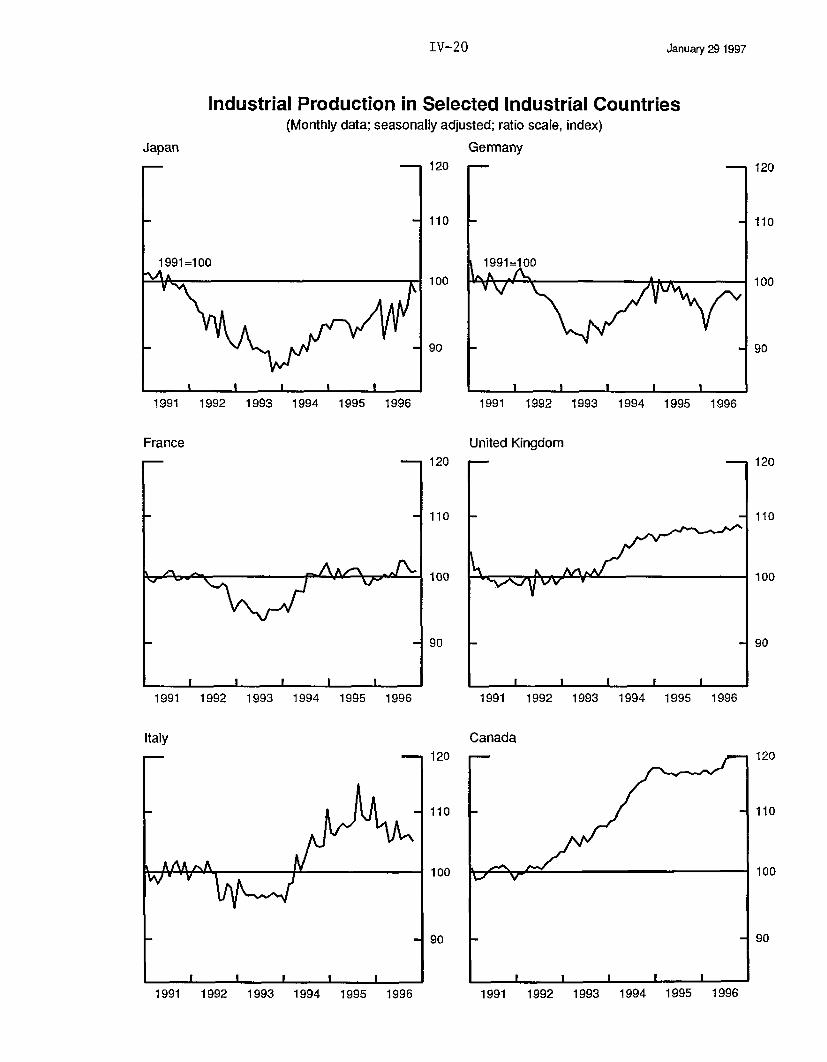
January 29 1997
Industrial Production in Selected Industrial Countries(Monthly data; seasonally adjusted; ratio scale, index)
Germany120
110
100
90
Italy
1991 1992 1993 1994 1995 1996
France
1991 1992 1993 1994 1995 1996
-- 120
1991=100
vy
1991 1992 1993 1994 1995 19961991 1992 1993 1994 1995 1996
United Kingdom
A. - MA
1991 1992 1993 1994 1995 1996
Canada
1991 1992 1993 1994 1995 1996
Japan
IV-20
1991 1992 1993 1994 1995 1996
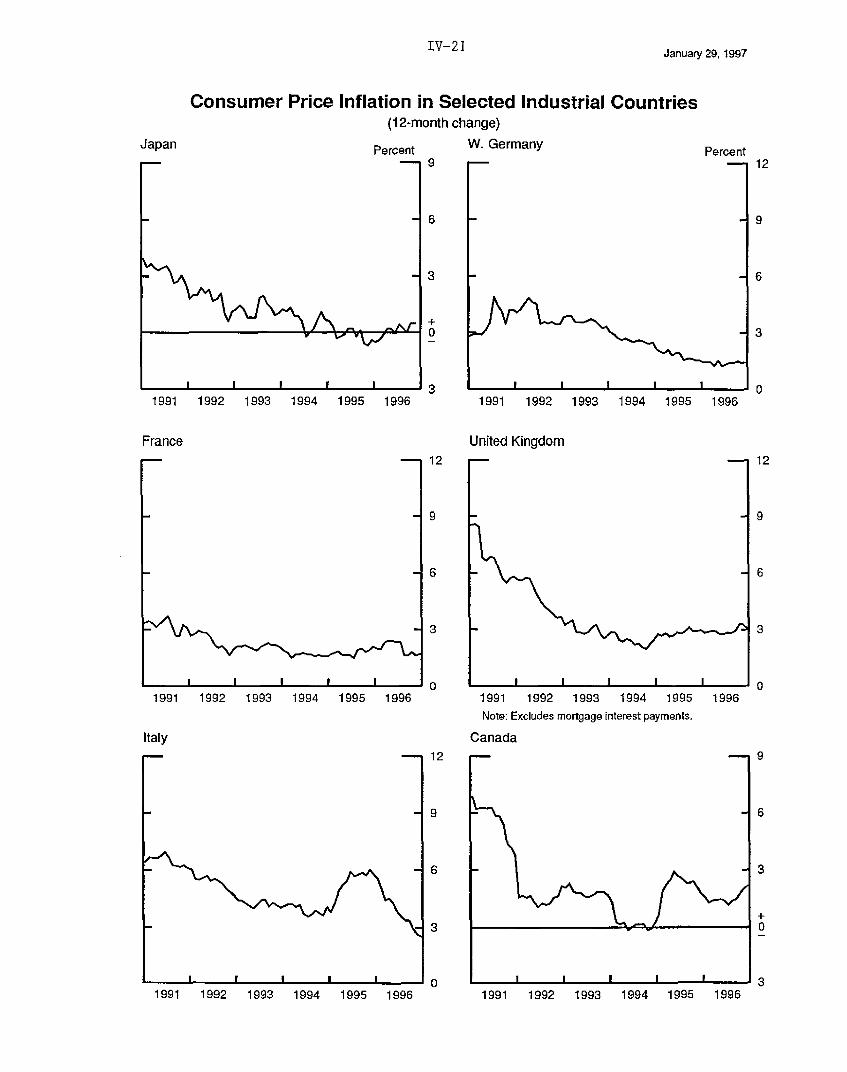
IV-21 January 29, 1997
Consumer Price Inflation in Selected Industrial Countries(12-month change)
Japan Percent
1991 1992 1993 1994 1995 1996
W. Germany9
6
3
+0
3
France
Percent-i 12
1991 1992 1993 1994 1995 19961991 1992 1993 1994 1995 1996
United Kingdom- 12
I I M II
1991 1992 1993 1994 1995 1996
Italy
1991 1992 1993 1994 1995 1996
1991 1992 1993 1994 1995 1996
Note: Excludes mortgage interest payments.
Canada
1991 1992 1993 1994 1995 1996
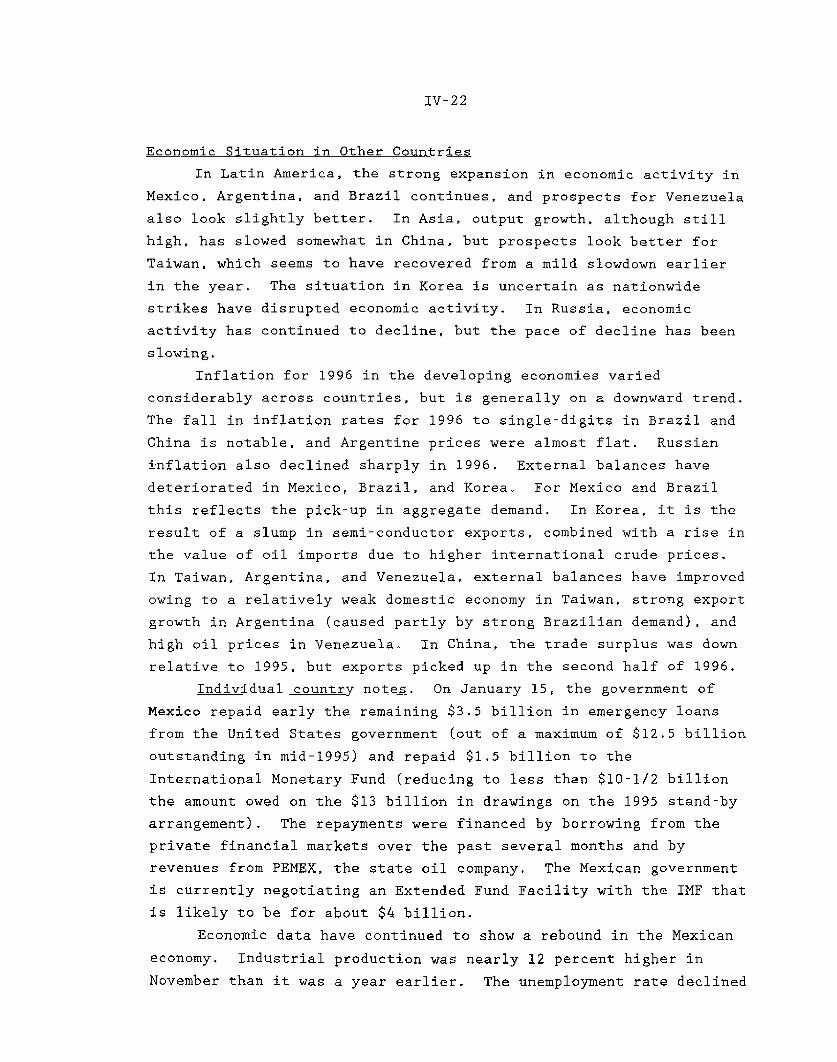
IV-22
Economic Situation in Other Countries
In Latin America, the strong expansion in economic activity in
Mexico, Argentina, and Brazil continues, and prospects for Venezuela
also look slightly better. In Asia, output growth, although still
high, has slowed somewhat in China, but prospects look better for
Taiwan, which seems to have recovered from a mild slowdown earlier
in the year. The situation in Korea is uncertain as nationwide
strikes have disrupted economic activity. In Russia, economic
activity has continued to decline, but the pace of decline has been
slowing.
Inflation for 1996 in the developing economies varied
considerably across countries, but is generally on a downward trend.
The fall in inflation rates for 1996 to single-digits in Brazil and
China is notable, and Argentine prices were almost flat. Russian
inflation also declined sharply in 1996. External balances have
deteriorated in Mexico, Brazil, and Korea. For Mexico and Brazil
this reflects the pick-up in aggregate demand. In Korea, it is the
result of a slump in semi-conductor exports, combined with a rise in
the value of oil imports due to higher international crude prices.
In Taiwan, Argentina, and Venezuela, external balances have improved
owing to a relatively weak domestic economy in Taiwan, strong export
growth in Argentina (caused partly by strong Brazilian demand), and
high oil prices in Venezuela. In China, the trade surplus was down
relative to 1995, but exports picked up in the second half of 1996.
Individual country notes. On January 15, the government of
Mexico repaid early the remaining $3.5 billion in emergency loans
from the United States government (out of a maximum of $12.5 billion
outstanding in mid-1995) and repaid $1.5 billion to the
International Monetary Fund (reducing to less than $10-1/2 billion
the amount owed on the $13 billion in drawings on the 1995 stand-by
arrangement). The repayments were financed by borrowing from the
private financial markets over the past several months and by
revenues from PEMEX, the state oil company. The Mexican government
is currently negotiating an Extended Fund Facility with the IMF that
is likely to be for about $4 billion.
Economic data have continued to show a rebound in the Mexican
economy. Industrial production was nearly 12 percent higher in
November than it was a year earlier. The unemployment rate declined
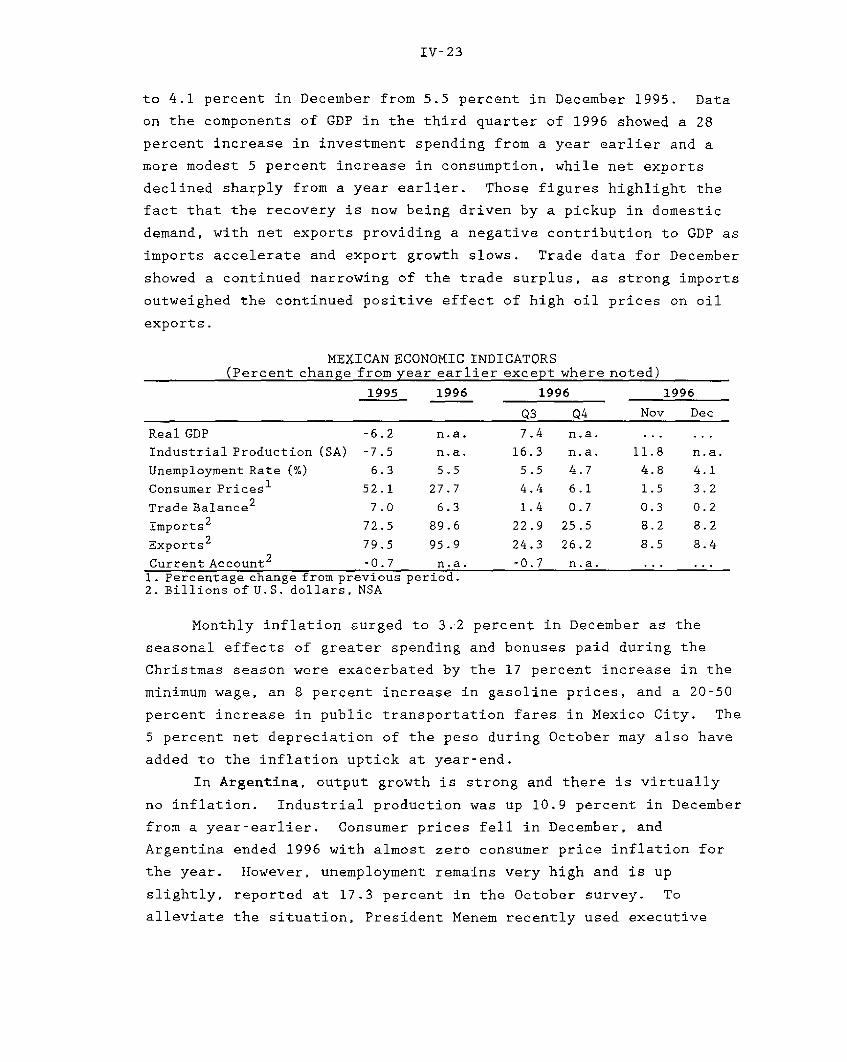
IV-23
to 4.1 percent in December from 5.5 percent in December 1995. Data
on the components of GDP in the third quarter of 1996 showed a 28
percent increase in investment spending from a year earlier and a
more modest 5 percent increase in consumption, while net exports
declined sharply from a year earlier. Those figures highlight the
fact that the recovery is now being driven by a pickup in domestic
demand, with net exports providing a negative contribution to GDP as
imports accelerate and export growth slows. Trade data for December
showed a continued narrowing of the trade surplus, as strong imports
outweighed the continued positive effect of high oil prices on oil
exports.
MEXICAN ECONOMIC INDICATORS(Percent change from year earlier except where noted)
1995 1996 1996 1996
Q3 Q4 Nov Dec
Real GDP -6.2 n.a. 7.4 n.a. ... ...
Industrial Production (SA) -7.5 n.a. 16.3 n.a. 11.8 n.a.
Unemployment Rate (%) 6.3 5.5 5.5 4.7 4.8 4.1
Consumer Prices 1 52.1 27.7 4.4 6.1 1.5 3.2
Trade Balance 2 7.0 6.3 1.4 0.7 0.3 0.2
Imports 2 72.5 89.6 22.9 25.5 8.2 8.2
Exports 2 79.5 95.9 24.3 26.2 8.5 8.4
Current Account 2 -0.7 n.a. -0.7 n.a. ... ...1. Percentage change from previous2. Billions of U.S. dollars, NSA
period.
Monthly inflation surged to 3.2 percent in December as the
seasonal effects of greater spending and bonuses paid during the
Christmas season were exacerbated by the 17 percent increase in the
minimum wage, an 8 percent increase in gasoline prices, and a 20-50
percent increase in public transportation fares in Mexico City. The
5 percent net depreciation of the peso during October may also have
added to the inflation uptick at year-end.
In Argentina, output growth is strong and there is virtually
no inflation. Industrial production was up 10.9 percent in December
from a year-earlier. Consumer prices fell in December, and
Argentina ended 1996 with almost zero consumer price inflation for
the year. However, unemployment remains very high and is up
slightly, reported at 17.3 percent in the October survey. To
alleviate the situation, President Menem recently used executive
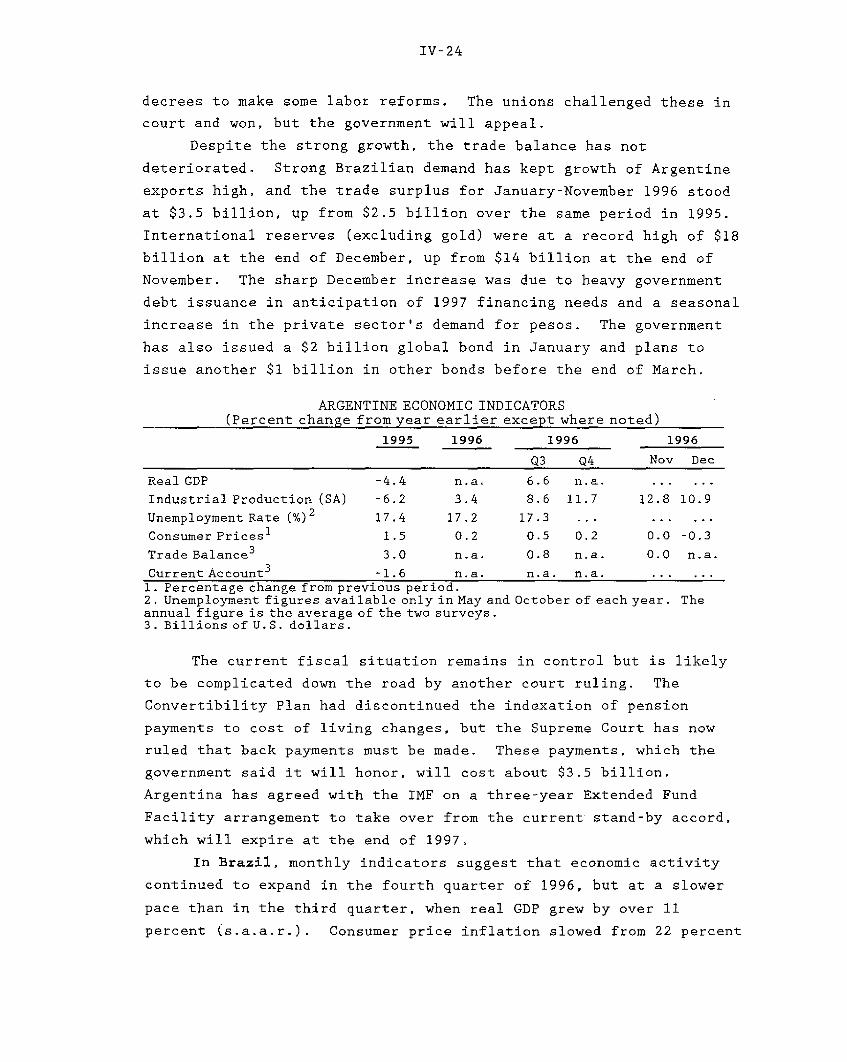
IV-24
decrees to make some labor reforms. The unions challenged these in
court and won, but the government will appeal.
Despite the strong growth, the trade balance has not
deteriorated. Strong Brazilian demand has kept growth of Argentine
exports high, and the trade surplus for January-November 1996 stood
at $3.5 billion, up from $2.5 billion over the same period in 1995.
International reserves (excluding gold) were at a record high of $18
billion at the end of December, up from $14 billion at the end of
November. The sharp December increase was due to heavy government
debt issuance in anticipation of 1997 financing needs and a seasonal
increase in the private sector's demand for pesos. The government
has also issued a $2 billion global bond in January and plans to
issue another $1 billion in other bonds before the end of March.
ARGENTINE ECONOMIC INDICATORS(Percent change from year earlier except where noted)
1995 1996 1996 1996
Q3 Q4 Nov Dec
Real GDP -4.4 n.a. 6.6 n.a. ... ...Industrial Production (SA) -6.2 3.4 8.6 11.7 12.8 10.9
Unemployment Rate (%)2 17.4 17.2 17.3 .. ...
Consumer Prices 1 1.5 0.2 0.5 0.2 0.0 -0.3
Trade Balance 3 3.0 n.a. 0.8 n.a. 0.0 n.a.
Current Account 3 -1.6 n.a. n.a. n.a. .. ...1. Percentage change from previous period.2. Unemployment figures available only in May and October of each year. Theannual figure is the average of the two surveys.3. Billions of U.S. dollars.
The current fiscal situation remains in control but is likely
to be complicated down the road by another court ruling. The
Convertibility Plan had discontinued the indexation of pension
payments to cost of living changes, but the Supreme Court has now
ruled that back payments must be made. These payments, which the
government said it will honor, will cost about $3.5 billion.
Argentina has agreed with the IMF on a three-year Extended Fund
Facility arrangement to take over from the current stand-by accord,
which will expire at the end of 1997.
In Brazil, monthly indicators suggest that economic activity
continued to expand in the fourth quarter of 1996, but at a slower
pace than in the third quarter, when real GDP grew by over 11
percent (s.a.a.r.). Consumer price inflation slowed from 22 percent
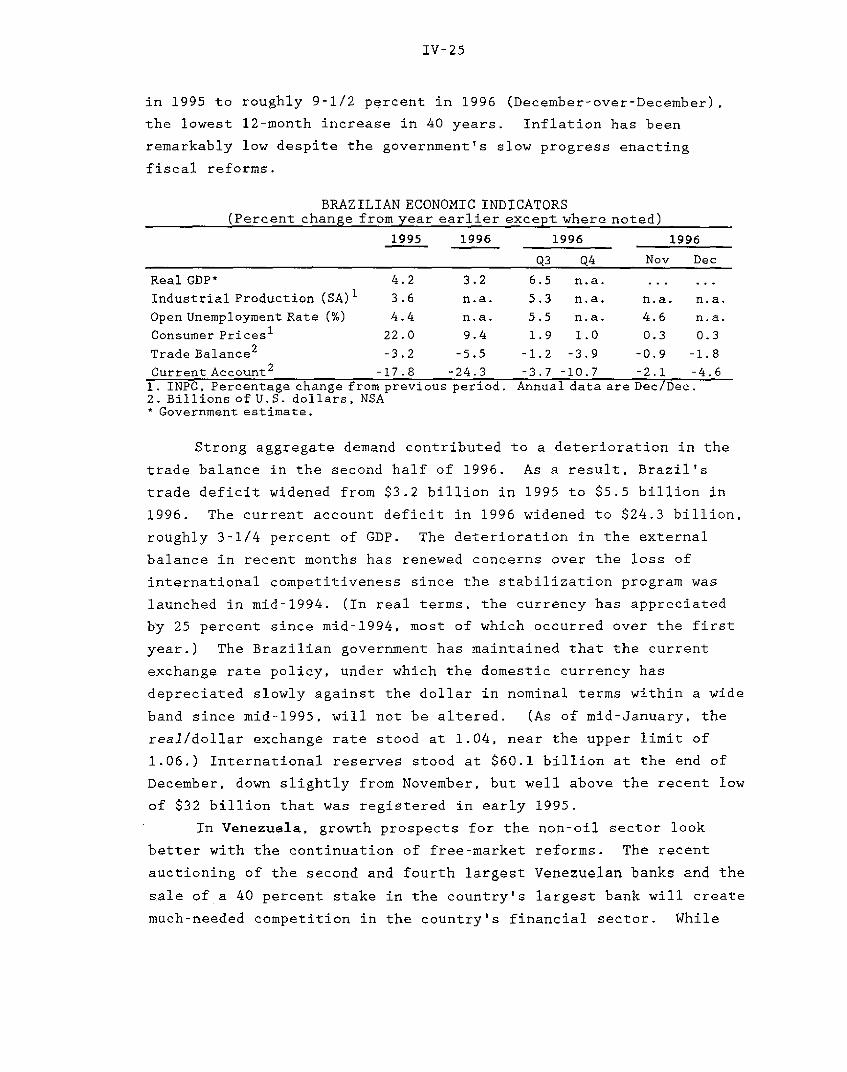
IV-25
in 1995 to roughly 9-1/2 percent in 1996 (December-over-December),
the lowest 12-month increase in 40 years. Inflation has been
remarkably low despite the government's slow progress enacting
fiscal reforms.
BRAZILIAN ECONOMIC INDICATORS(Percent change from year earlier except where noted)
1995 1996 1996 1996
Q3 Q4 Nov Dec
Real GDP* 4.2 3.2 6.5 n.a. ...
Industrial Production (SA) 1 3.6 n.a. 5.3 n.a. n.a. n.a.
Open Unemployment Rate (%) 4.4 n.a. 5.5 n.a. 4.6 n.a.
Consumer Prices 1 22.0 9.4 1.9 1.0 0.3 0.3
Trade Balance 2 -3.2 -5.5 -1.2 -3.9 -0.9 -1.8
Current Account 2 -17.8 -24.3 -3.7 -10.7 -2.1 -4.61. INPC, Percentage change from previous period. Annual data are Dec/Dec.2. Billions of U.S. dollars, NSA* Government estimate.
Strong aggregate demand contributed to a deterioration in the
trade balance in the second half of 1996. As a result, Brazil's
trade deficit widened from $3.2 billion in 1995 to $5.5 billion in
1996. The current account deficit in 1996 widened to $24.3 billion,
roughly 3-1/4 percent of GDP. The deterioration in the external
balance in recent months has renewed concerns over the loss of
international competitiveness since the stabilization program was
launched in mid-1994. (In real terms, the currency has appreciated
by 25 percent since mid-1994, most of which occurred over the first
year.) The Brazilian government has maintained that the current
exchange rate policy, under which the domestic currency has
depreciated slowly against the dollar in nominal terms within a wide
band since mid-1995, will not be altered. (As of mid-January, the
real/dollar exchange rate stood at 1.04, near the upper limit of
1.06.) International reserves stood at $60.1 billion at the end of
December, down slightly from November, but well above the recent low
of $32 billion that was registered in early 1995.
In Venezuela, growth prospects for the non-oil sector look
better with the continuation of free-market reforms. The recent
auctioning of the second and fourth largest Venezuelan banks and the
sale of a 40 percent stake in the country's largest bank will create
much-needed competition in the country's financial sector. While
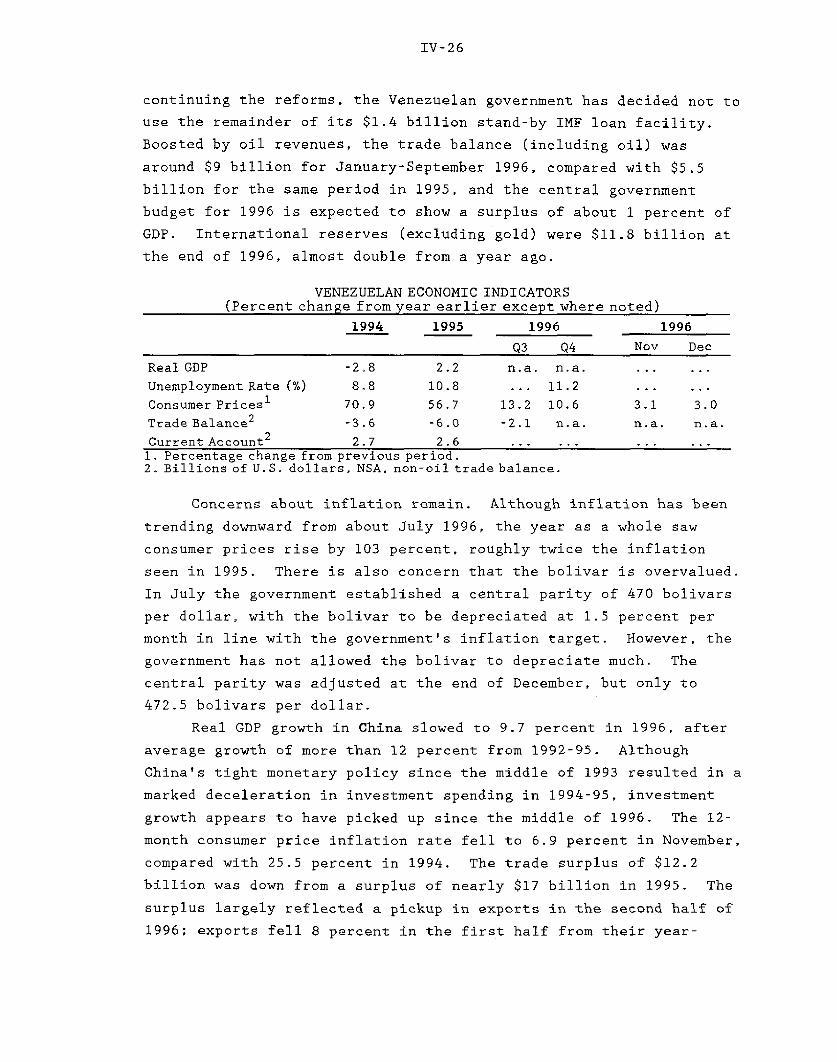
IV-26
continuing the reforms, the Venezuelan government has decided not to
use the remainder of its $1.4 billion stand-by IMF loan facility.
Boosted by oil revenues, the trade balance (including oil) was
around $9 billion for January-September 1996, compared with $5.5
billion for the same period in 1995, and the central government
budget for 1996 is expected to show a surplus of about 1 percent of
GDP. International reserves (excluding gold) were $11.8 billion at
the end of 1996, almost double from a year ago.
VENEZUELAN ECONOMIC INDICATORS(Percent change from year earlier except where noted)
1994 1995 1996 1996
Q3 Q4 Nov Dec
Real GDP -2.8 2.2 n.a. n.a. ... ...
Unemployment Rate (%) 8.8 10.8 ... 11.2 ... ...
Consumer Prices 1 70.9 56.7 13.2 10.6 3.1 3.0
Trade Balance 2 -3.6 -6.0 -2.1 n.a. n.a. n.a.
Current Account2 2.7 2.6 .. .. ... .1. Percentage change from previous period.2. Billions of U.S. dollars, NSA, non-oil trade balance.
Concerns about inflation remain. Although inflation has been
trending downward from about July 1996, the year as a whole saw
consumer prices rise by 103 percent, roughly twice the inflation
seen in 1995. There is also concern that the bolivar is overvalued.
In July the government established a central parity of 470 bolivars
per dollar, with the bolivar to be depreciated at 1.5 percent per
month in line with the government's inflation target. However, the
government has not allowed the bolivar to depreciate much. The
central parity was adjusted at the end of December, but only to
472.5 bolivars per dollar.
Real GDP growth in China slowed to 9.7 percent in 1996, after
average growth of more than 12 percent from 1992-95. Although
China's tight monetary policy since the middle of 1993 resulted in a
marked deceleration in investment spending in 1994-95, investment
growth appears to have picked up since the middle of 1996. The 12-
month consumer price inflation rate fell to 6.9 percent in November,
compared with 25.5 percent in 1994. The trade surplus of $12.2
billion was down from a surplus of nearly $17 billion in 1995. The
surplus largely reflected a pickup in exports in the second half of
1996; exports fell 8 percent in the first half from their year-
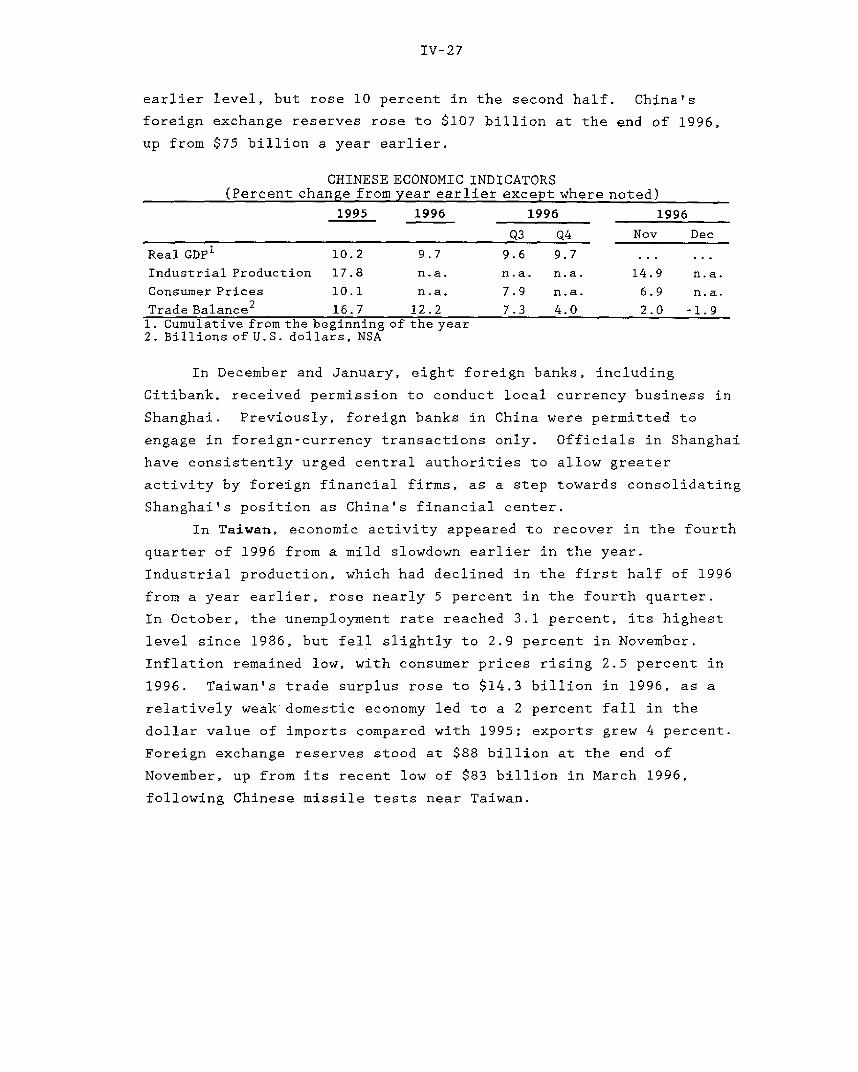
IV-27
earlier level, but rose 10 percent in the second half. China's
foreign exchange reserves rose to $107 billion at the end of 1996,
up from $75 billion a year earlier.
CHINESE ECONOMIC INDICATORS(Percent change from year earlier except where noted)
1995 1996 1996 1996
Q3 Q4 Nov Dec
Real GDP 1 10.2 9.7 9.6 9.7Industrial Production 17.8 n.a. n.a. n.a. 14.9 n.a.
Consumer Prices 10.1 n.a. 7.9 n.a. 6.9 n.a.
Trade Balance 2 16.7 12.2 7.3 4.0 2.0 -1.91. Cumulative from the beginning of the year2. Billions of U.S. dollars, NSA
In December and January, eight foreign banks, including
Citibank, received permission to conduct local currency business in
Shanghai. Previously, foreign banks in China were permitted to
engage in foreign-currency transactions only. Officials in Shanghai
have consistently urged central authorities to allow greater
activity by foreign financial firms, as a step towards consolidating
Shanghai's position as China's financial center.
In Taiwan, economic activity appeared to recover in the fourth
quarter of 1996 from a mild slowdown earlier in the year.
Industrial production, which had declined in the first half of 1996
from a year earlier, rose nearly 5 percent in the fourth quarter.
In October, the unemployment rate reached 3.1 percent, its highest
level since 1986, but fell slightly to 2.9 percent in November.
Inflation remained low, with consumer prices rising 2.5 percent in
1996. Taiwan's trade surplus rose to $14.3 billion in 1996, as a
relatively weak domestic economy led to a 2 percent fall in the
dollar value of imports compared with 1995; exports grew 4 percent.
Foreign exchange reserves stood at $88 billion at the end of
November, up from its recent low of $83 billion in March 1996,
following Chinese missile tests near Taiwan.
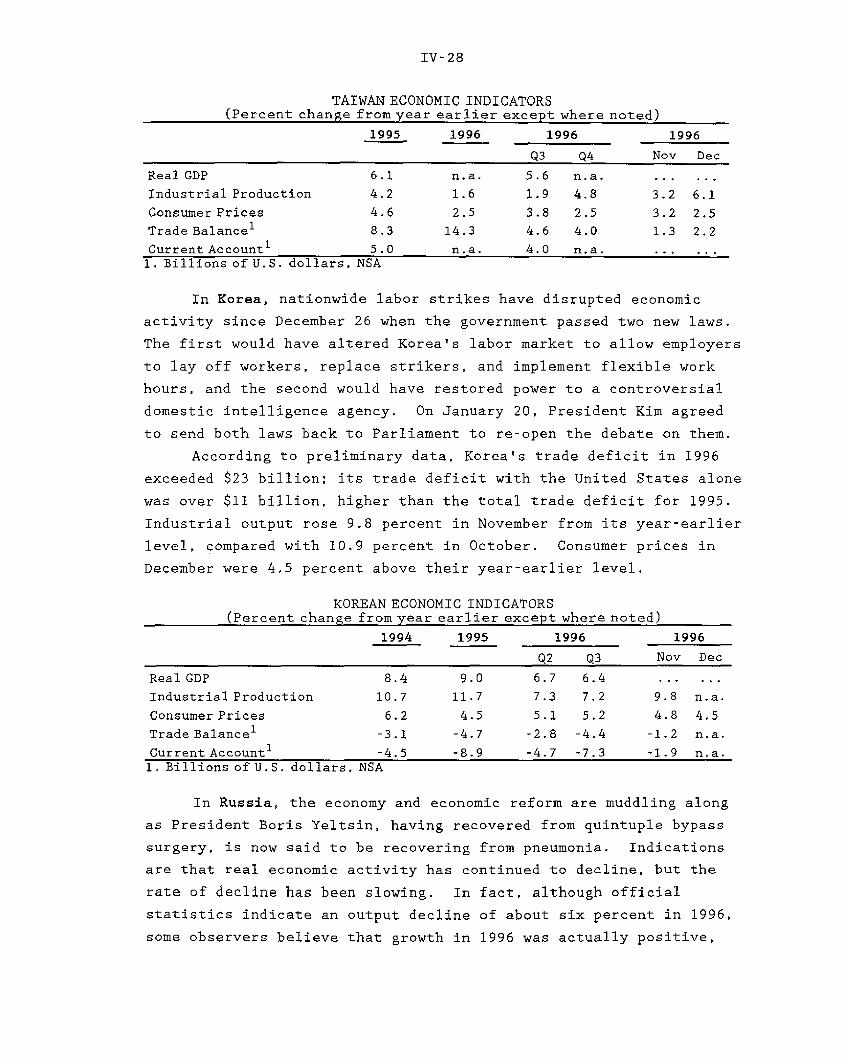
IV-28
TAIWAN ECONOMIC INDICATORS(Percent change from year earlier except where noted)
1995 1996 1996 1996
Q3 Q4 Nov Dec
Real GDP 6.1 n.a. 5.6 n.a. ... ...Industrial Production 4.2 1.6 1.9 4.8 3.2 6.1
Consumer Prices 4.6 2.5 3.8 2.5 3.2 2.5
Trade Balance 1 8.3 14.3 4.6 4.0 1.3 2.2
Current Account1 5.0 n.a. 4.0 n.a. .. ...1. Billions of U.S. dollars. NSA
In Korea, nationwide labor strikes have disrupted economic
activity since December 26 when the government passed two new laws.
The first would have altered Korea's labor market to allow employers
to lay off workers, replace strikers, and implement flexible work
hours, and the second would have restored power to a controversial
domestic intelligence agency. On January 20, President Kim agreed
to send both laws back to Parliament to re-open the debate on them.
According to preliminary data, Korea's trade deficit in 1996
exceeded $23 billion; its trade deficit with the United States alone
was over $11 billion, higher than the total trade deficit for 1995.
Industrial output rose 9.8 percent in November from its year-earlier
level, compared with 10.9 percent in October. Consumer prices in
December were 4.5 percent above their year-earlier level.
KOREAN ECONOMIC INDICATORS(Percent change from year earlier except where noted)
1994 1995 1996 1996
Q2 Q3 Nov Dec
Real GDP 8.4 9.0 6.7 6.4 ...
Industrial Production 10.7 11.7 7.3 7.2 9.8 n.a.
Consumer Prices 6.2 4.5 5.1 5.2 4.8 4.5
Trade Balancel -3.1 -4.7 -2.8 -4.4 -1.2 n.a.
Current Account 1 -4.5 -8.9 -4.7 -7.3 -1.9 n.a.1. Billions of U.S. dollars, NSA
In Russia, the economy and economic reform are muddling along
as President Boris Yeltsin, having recovered from quintuple bypass
surgery, is now said to be recovering from pneumonia. Indications
are that real economic activity has continued to decline, but the
rate of decline has been slowing. In fact, although official
statistics indicate an output decline of about six percent in 1996,
some observers believe that growth in 1996 was actually positive,
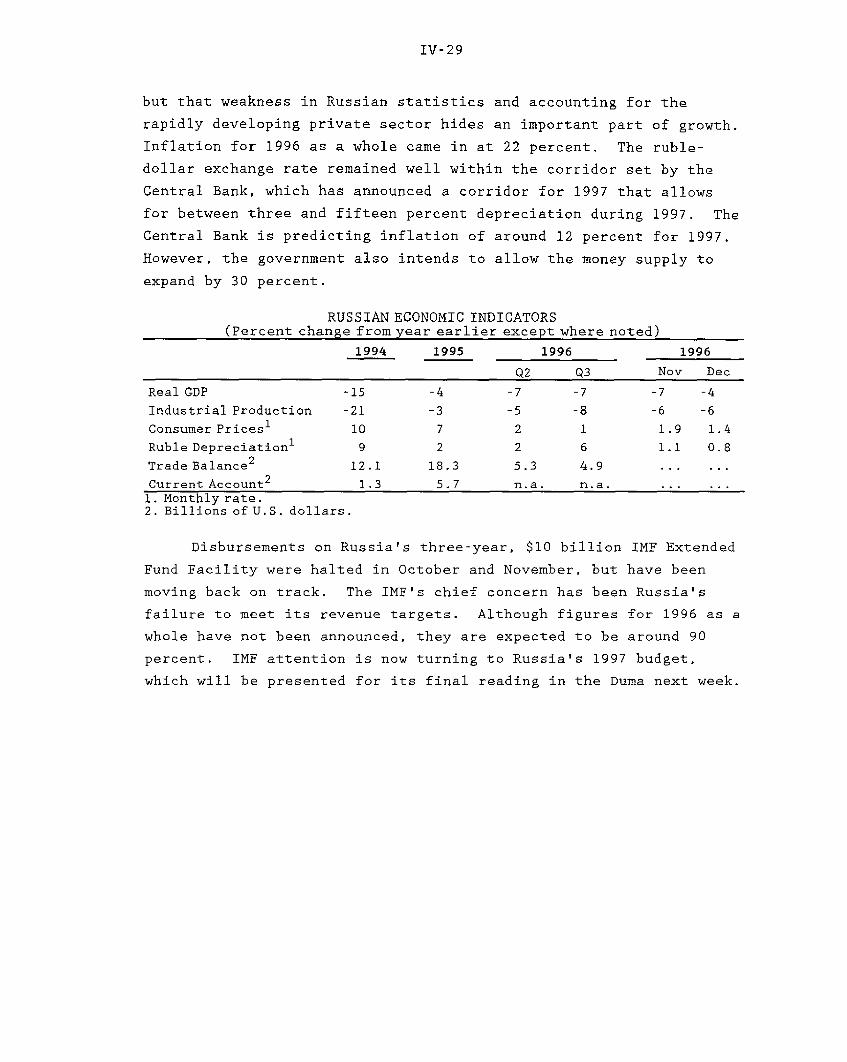
IV-29
but that weakness in Russian statistics and accounting for the
rapidly developing private sector hides an important part of growth.
Inflation for 1996 as a whole came in at 22 percent. The ruble-
dollar exchange rate remained well within the corridor set by the
Central Bank, which has announced a corridor for 1997 that allows
for between three and fifteen percent depreciation during 1997. The
Central Bank is predicting inflation of around 12 percent for 1997.
However, the government also intends to allow the money supply to
expand by 30 percent.
RUSSIAN ECONOMIC INDICATORS(Percent change from year earlier except where noted)
1994 1995 1996 1996
Q2 Q3 Nov Dec
Real GDP -15 -4 -7 -7 -7 -4Industrial Production -21 -3 -5 -8 -6 -6
Consumer Prices 1 10 7 2 1 1.9 1.4
Ruble Depreciation 1 9 2 2 6 1.1 0.8
Trade Balance 2 12.1 18.3 5.3 4.9
Current Account 2 1.3 5.7 n.a. n.a....1. Monthly rate.2. Billions of U.S. dollars.
Disbursements on Russia's three-year, $10 billion IMF Extended
Fund Facility were halted in October and November, but have been
moving back on track. The IMF's chief concern has been Russia's
failure to meet its revenue targets. Although figures for 1996 as a
whole have not been announced, they are expected to be around 90
percent. IMF attention is now turning to Russia's 1997 budget,
which will be presented for its final reading in the Duma next week.