Fomc 19911105 g Bpt 219911030
104
Prefatory Note The attached document represents the most complete and accurate version available based on original copies culled from the files of the FOMC Secretariat at the Board of Governors of the Federal Reserve System. This electronic document was created through a comprehensive digitization process which included identifying the best- preserved paper copies, scanning those copies, 1 and then making the scanned versions text-searchable. 2 Though a stringent quality assurance process was employed, some imperfections may remain. Please note that this document may contain occasional gaps in the text. These gaps are the result of a redaction process that removed information obtained on a confidential basis. All redacted passages are exempt from disclosure under applicable provisions of the Freedom of Information Act. 1 In some cases, original copies needed to be photocopied before being scanned into electronic format. All scanned images were deskewed (to remove the effects of printer- and scanner-introduced tilting) and lightly cleaned (to remove dark spots caused by staple holes, hole punches, and other blemishes caused after initial printing). 2 A two-step process was used. An advanced optimal character recognition computer program (OCR) first created electronic text from the document image. Where the OCR results were inconclusive, staff checked and corrected the text as necessary. Please note that the numbers and text in charts and tables were not reliably recognized by the OCR process and were not checked or corrected by staff.
-
Upload
fraser-federal-reserve-archive -
Category
Documents
-
view
213 -
download
0
Transcript of Fomc 19911105 g Bpt 219911030

Prefatory Note
The attached document represents the most complete and accurate version available based on original copies culled from the files of the FOMC Secretariat at the Board of Governors of the Federal Reserve System. This electronic document was created through a comprehensive digitization process which included identifying the best-preserved paper copies, scanning those copies,1 and then making the scanned versions text-searchable.2 Though a stringent quality assurance process was employed, some imperfections may remain.
Please note that this document may contain occasional gaps in the text. These gaps are the result of a redaction process that removed information obtained on a confidential basis. All redacted passages are exempt from disclosure under applicable provisions of the Freedom of Information Act.
1 In some cases, original copies needed to be photocopied before being scanned into electronic format. All scanned images were deskewed (to remove the effects of printer- and scanner-introduced tilting) and lightly cleaned (to remove dark spots caused by staple holes, hole punches, and other blemishes caused after initial printing). 2 A two-step process was used. An advanced optimal character recognition computer program (OCR) first created electronic text from the document image. Where the OCR results were inconclusive, staff checked and corrected the text as necessary. Please note that the numbers and text in charts and tables were not reliably recognized by the OCR process and were not checked or corrected by staff.

Confidential (FR) Class III FOMC
October 30, 1991
RECENT DEVELOPMENTS
Prepared for the Federal Open Market Committee
By the staff of the Board of Governors of the Federal Reserve System

DOMESTIC NONFINANCIALDEVELOPMENTS
CONTENTS
II DOMESTIC NONFINANCIAL DEVELOPMENTSEmployment and unemployment....................................... 1Labor costs................... . ..... ... ........ ..... ......... 5Industrial production and capacity utilization..................... 11Personal income and consumption...................................... . 13Business fixed investment.......................................... 17Business inventories. ............................................. 23Housing markets............ ....... ........... ........... ........... . 25Federal sector.................................................... 27State and local government sector................................. 31Prices................ ..................... .... .................... 33
TablesChanges in employment .............................................. 2Unemployment and labor force participation rates.................. 2Employment cost index
Three-month changes ............................................. 6Private industry workers.................................... ..... 6
Major collective bargaining settlementsNegotiated wage rate changes.................................... 8Size distribution of first-year rate adjustments................ 8
Average hourly earnings ............................................ 8Growth in selected components of industrial production............ 10Capacity utilization in manufacturing.............................. 10Domestic production of autos and trucks.......................... 12New orders for durable goods ......... ............................. .. 13Personal income.............. .................. ..... .......... 14Real personal consumption expenditures ............................. 14Sales of automobiles and light trucks.............................. 16Business capital spending indicators............................. 18Changes in manufacturing and trade inventories................... 22Inventories relative to sales..................................... 22Private housing activity........................................... 24Housing vacancy rates.............................................. 26Federal government outlays and receipts........................... 28Federal purchases of goods and services ........................... 29Recent changes in consumer prices................................. 34Recent changes in producer prices................................. 34Price indexes for commodities and materials....................... 38
ChartsSelected labor market indicators...................... .......... 3Labor cost measures............................................... . 7Production of autos and trucks..................................... 12Personal consumption expenditures.................................. 15Consumer sentiment................................................. 16Nonresidential construction and selected indicators............... 20Nominal office property values in the United States............... 21Effective nominal rental income for U.S. office properties......... 21Private housing starts ......... .................................. . 24Consumer homebuying attitudes......... .. ........................... 26State and local sector surplus or deficit......................... 32CPI, excluding food and energy................................... . 35Index weights............................... ..................... . 38Commodity price measures.......................................... 39CRB spot industrials.............................................. 40Index of industrial production, manufacturing.................. 40

III DOMESTIC FINANCIAL DEVELOPMENTSMonetary aggregates and bank credit............................... 3Business finance..................... ...... ....................... 7Treasury and sponsored-agency financing ........................... 13Municipal securities................. .............................. 15Mortgage markets................................................... 17Consumer installment credit ...................................... . 21
TablesMonetary aggregates............ .................. ............... 2Commercial bank credit and short- and intermediate-term business
credit...................... ......... ......................... 6Gross offerings of securities by U.S. corporations................ 10Treasury and agency financing...................................... 12Gross offerings of municipal securities......................... 15Mortgage-backed security issuance................................. . 19Consumer credit.......... ............ .............................. 22Consumer interest rates........................................... 22Public securitization of consumer loans ......................... 23
ChartsM2 growth and measures of RTC financial activity..................... 4Spreads between retail deposit rates at commercial banks........... 4Movement of S&P 500 around business cycle troughs................. 8Mortgage commitment rates, 1971-91 ............................... 18MBA indexes of mortgage lending activity.......................... 18ARM share of loans closed vs. spread of FRM rate to ARM rate...... 19
IV INTERNATIONAL DEVELOPMENTSMerchandise trade.................................................. 1Prices of non-oil imports and exports.............................. 5U.S. international financial transactions......................... 5Foreign exchange markets.......................................... 10Developments in foreign industrial countries...................... 12Developments in Eastern European countries........................ 23Economic situation in other countries............................. 24
TablesU.S. merchandise trade: Monthly data.............................. 1U.S. merchandise trade: Quarterly data...... ........ .... ........ 2Major trade categories...................................... ...... 3Oil imports......... ............................................ 4Import and export price measures ................................... 6Summary of U.S. international transactions........................ 8International banking data........................................ 9Major industrial countries
Real GNP and industrial production.............................. 14Consumer and wholesale prices.................................... 15Trade and current account balances............................. 16
ChartsWeighted average exchange value of the dollar..................... 11
DOMESTIC NONFINANCIAL DEVELOPMENTS
BEA's advance figures suggest that real GNP increased about
2-1/2 percent at an annual rate in the third quarter, and industrial
production posted a 6 percent (annual rate) rise on a quarterly
average basis. However, these increases largely reflected strong
gains around midyear; the more recent indicators of production and
spending generally have been no better than lackluster, suggesting a
slackening of activity over the course of the third quarter and into
the early part of the fourth quarter. Moreover, consumers and
businesses evidently have become even more pessimistic about the
economic outlook. Price and wage inflation remains on a gradual
downward trend.
Employment and Unemployment
Labor market conditions improved a bit in September but
continued to show no real strength. Private payroll employment rose
51,000, and the figures for July and August were revised up
slightly. With a further rise in the average workweek, aggregate
hours of production or nonsupervisory workers increased 0.5 percent
(monthly rate) in September, and, for the third quarter as a whole,
rose at a 1.1 percent annual rate. Since the September survey week,
initial claims for unemployment insurance have remained in a range
that suggests no appreciable gain in employment. Moreover, the
proportion of respondents to the October Conference Board Consumer
Survey noting that jobs were "hard to get" rose to its highest level
since the summer of 1983.
The increase in employment in September was concentrated in the
private service-producing sector; there, employment in health
services posted another strong gain, business services continued to
grow, and retail jobs turned up. In manufacturing, employment fell
22,000, after two months of increases; by industry, the declines in
II-1
II-2
CHANGES IN EMPLOYMENT 1
(Thousands of employees; based on seasonally adjusted data)
1991 1991
Q1 Q2 03 July Aug. Sep.
------------ Average Monthly Changes-------
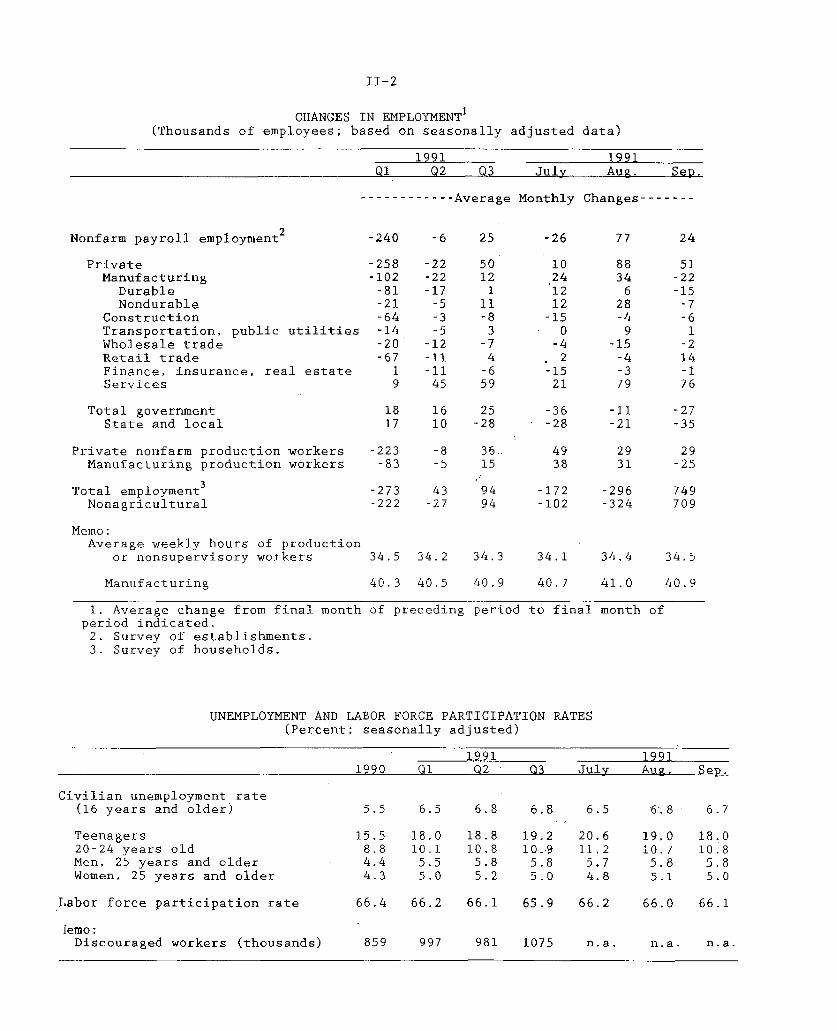
Nonfarm payroll employment2 -240 -6 25 -26 77 24
Private -258 -22 50 10 88 51Manufacturing -102 -22 12 24 34 -22
Durable -81 -17 1 12 6 -15Nondurable -21 -5 11 12 28 -7
Construction -64 -3 -8 -15 -4 -6Transportation, public utilities -14 -5 3 0 9 1Wholesale trade -20 -12 -7 -4 -15 -2Retail trade -67 -11 4 2 -4 14Finance, insurance, real estate 1 -11 -6 -15 -3 -1Services 9 45 59 21 79 76
Total government 18 16 25 -36 -11 -27State and local 17 10 -28 -- 28 -21 -35
Private nonfarm production workers -223 -8 36.. 49 29 29Manufacturing production workers -83 -5 15 38 31 -25
Total employment3 -273 43 94 -172 -296 749Nonagricultural -222 -27 94 -102 -324 709
Memo:Average weekly hours of production
or nonsupervisory workers 34.5 34.2 34.3 34.1 34.4 34.5
Manufacturing 40.3 40.5 40.9 40.7 41.0 40.9
1. Average change from final month of preceding period to final month ofperiod indicated.2. Survey of establishments.3. Survey of households.
UNEMPLOYMENT AND LABOR FORCE PARTICIPATION RATES(Percent; seasonally adjusted)
1991 19911990 Q1 02 03 July Aug. Sep.
Civilian unemployment rate(16 years and older) 5.5 6.5 6.8 6.8 6.5 6.8 6.7
Teenagers 15.5 18.0 18.8 19.2 20.6 19.0 18.020-24 years old 8.8 10.1 10.8 10..9 11.2 10.7 10.8Men, 25 years and older 4.4 5.5 5.8 5.8 5.7 5.8 5.8Women, 25 years and older 4.3 5.0 5.2 5.0 4.8 5.1 5.0
Labor force participation rate 66.4 66.2 66.1 65.9 66.2 66.0 66.1
lemo:Discouraged workers (thousands) 859 997 981 1075 n.a. n.a. n.a.

II-3
SELECTED LABOR MARKET INDICATORS
JOB LOSERS *Percent
1979 1981 1983 1985 1987 1989 1991' Job losers as a percent of unemployed.
DISCOURAGED WORKERS *Thousands
1979 1981 1983 1985 1987 1989 1991
* Quartedy data
INITIAL CLAIMS FOR UNEMPLOYMENT INSURANCE *Thousands
ALL REGULAR PROGRAMS
80
70
60
50
40
30
2500
2000
1500
1000
500
800
600
400
2001979 1981 1983 1985 1987 1989 1991
SWeekly data; seasonally adjusted, FRB basis.

II-4
September were small but widespread. Both the factory workweek and
overtime hours fell a bit in September, but, given the surge in
August, they remained well above the level recorded last spring.
In the government sector, state and local employment fell
another 35,000. Although revised data show that the declines over
the summer were smaller than reported earlier, the cumulative drop
between May and September is estimated to have exceeded 85,000, the
largest since 1982.
In the household survey, both employment and the civilian labor
force jumped more than 700,000 in September, reversing declines
posted earlier in the summer. On net, growth in the labor force has
been quite weak since last spring, attributable in part to declines
in the participation of young people. This continues the pattern
seen over the preceding year and likely reflects both cyclical and
longer-term influences on labor force participation.
The unemployment rate has changed little over the past several
months, consistent with the flat picture suggested by the payroll
data. However, other data from the September household survey point
to continued weakness in labor demand. Job losers, as a percent of
the unemployed, climbed to 56.3 percent--a new cyclical high.
In addition, the number of individuals looking for full-time jobs
but able to find only part-time positions continued to grow. In the
third quarter, the average level of involuntary part-time employment
was almost 100,000 above the second-quarter level. Finally, the
number of discouraged workers (those who have stopped looking for
work because they believe that none is available) increased in the
third quarter to its highest level since 1987.
1. Generally, this series begins to move lower at roughly thetime of the cyclical trough.

II-5
Labor Costs
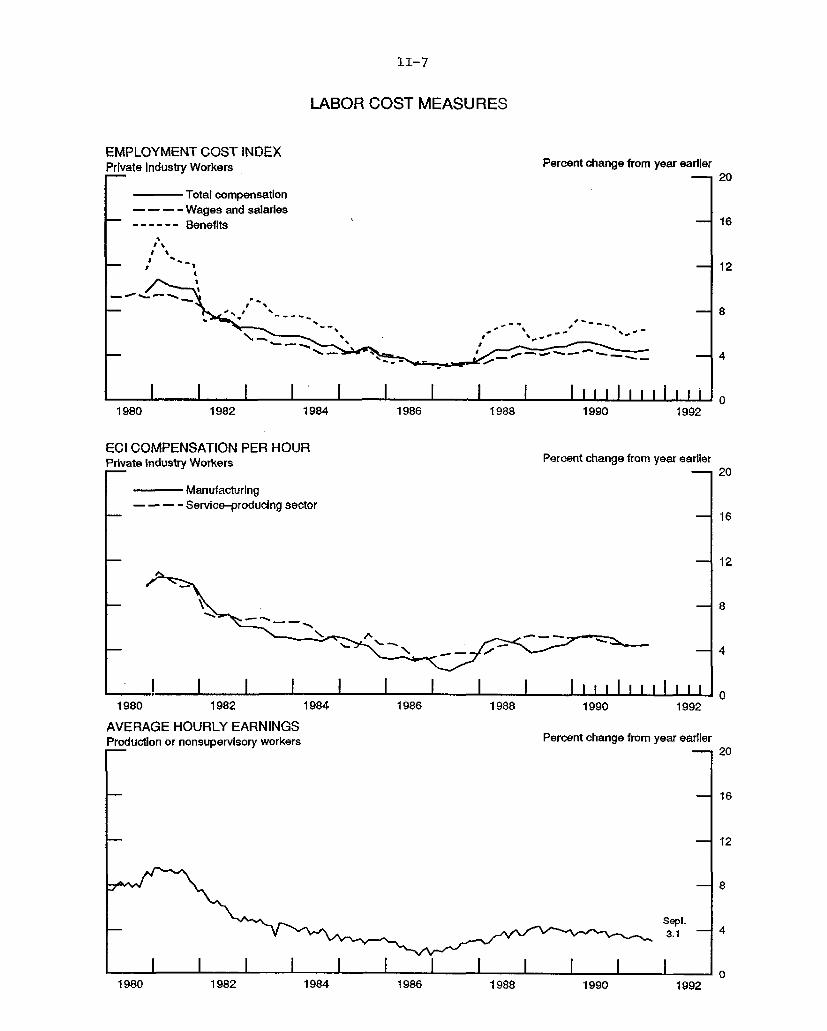
Data on labor costs suggest that continued labor market slack
has held down wage increases recently, but that persistently large
increases in benefit costs have retarded the overall slowing in
hourly compensation. The employment cost index for hourly
compensation in private industry rose 4.4 percent at a seasonally
adjusted annual rate in the third quarter--the same as the average
pace over the preceding year, but 3/4 percentage point below the
peak twelve-month change in early 1990. Wages have exhibited a
clear deceleration: The 3 percent (annual rate) increase in the
third quarter probably overstates the trend, but the change in the
twelve-month period ended in September is well below that of the
year-earlier period. In contrast, benefits posted their second
consecutive rise of 7 percent (annual rate) or more last quarter,
fueled by continued sharp increases in payments for employer-
provided health insurance and workers' compensation; on a twelve-
month change basis, the deceleration is 1/2 percentage point from
the peak rate in 1990.
By industry, the recent slowing in the wage and salary
component of the ECI was widespread. Most notable were an
especially small increase in construction last quarter, where
declining activity had already pushed the twelve-month change in
wages below 3 percent, and a small decline in finance, insurance,
and real estate. Among occupations, wages of white-collar employees
have shown the most deceleration in recent quarters, especially in
the managerial and administrative support categories, which
anecdotal reports indicate are the focus of efforts to cut labor
costs. Wage growth has slowed somewhat for blue-collar workers as
well, particularly among lower-skilled occupations.
The large benefit cost increases have hit nearly every
industrial and occupational sector. Although explicit data on

II-6
EMPLOYMENT COST INDEXES(Three month percent changes at compound annual rates; seasonally adjusted)
1990 1991June Sep. Dec. Mar. June Sep.
Total compensation costs:
Private industry workers 5.1 4.3 3.8 4.6 4.9 4.4
By industry:Goods-producing 5.1 4.3 3.8 4.6 4.9 4.4Service-producing 5.1 4.3 3.8 4.9 4.5 4.4
By occupation:White-collar 5.5 4.6 2.7 6.1 4.9 4.0Blue-collar 4.7 3.9 3.8 4.6 4.1 4.9Service workers 5.1 3.5 5.0 4.2 6.4 6.7
By bargaining status:Union 3.1 3.9 4.3 5.0 4.9 4.9Nonunion 5.5 4.2 2.7 5.7 4.9 4.1
Memo:Wages and salaries 4.3 3.9 3.1 4.2 4.2 3.0Benefits 6.2 6.5 5.7 5.2 7.0 7.6
EMPLOYMENT COST INDEXES(Percent change from year earlier; not seasonally adjusted)
1990 19911989 June Sep. Dec. Mar. June Sep.
Total compensation costs:
Private industry workers
By industry:Goods-producingService-producing
By occupation:White-collarBlue-collarService workers
By bargaining status:UnionNonunion
Memo:Wages and salariesBenefits
4.8
4.35.1
5.24.14.4
3.75.1
4.16.1
5.2 4.9 4.6 4.4 4.4 4.5
5.2 5.0 4.8 4.4 4.4 4.55.2 4.8 4.6 4.5 4.4 4.5
5.5 5.2 4.9 4.7 4.5 4.44.7 4.5 4.4 4.3 4.1 4.44.9 4.5 4.7 4.2 4.8 5.5
4.1 4.2 4.3 4.1 4.5 4.85.5 5.1 4-8 4.5 4.4 4.3
4.5 4.26.9 6.8
4.0 4.0 3.76.6 5.8 6.2
II-7
LABOR COST MEASURES
EMPLOYMENT COST INDEXPrivate Industry Workers
-- Total compensation- - - - Wages and salaries------ Benefits
t cmeai
Percent change from year earlier
8
1
C-I \
Z ~---,
c-- ,,e
rr
r c
~t-
I _I I I I I I 1 I I I I I I I I ill I i1984 1988 1990 1992
ECI COMPENSATION PER HOURPrivate Industry Workers
- Manufacturing- - - - Service-producing sector
Percent change from year earlier-20
N- - -, -
I I I I I i I I IIIII IIIIlII1980 1982 1984 1986 1988 1990 1992
AVERAGE HOURLY EARNINGSProduction or nonsupervlsory workers Percent change from year earlier
Sept.3.1
198l182194 98 l188190l99
1980
S8
- 4
I
1980 1982 1984 1986 1988 1990 1992

II-8
NEGOTIATED WAGE RATE CHANGESUNDER MAJOR COLLECTIVE BARGAINING SETTLEMENTS
(Percent change)
1991Q3 parties
under prior1990 Q1 Q2 Q3 settlements
All industriesFirst-year adjustments 4.0 4.3 3.5 3.4 2.9Average over life of contract 3.2 3.3 3.4 3.0 2.9
Workers affected (in thousands) 2004 227 649 437
1. Contracts covering 1,000 or more workers; estimates exclude lump-sumpayments and potential gains under cost-of-living clauses.
SIZE DISTRIBUTION OF FIRST-YEAR WAGE RATE ADJUSTMENTS INMAJOR COLLECTIVE BARGAINING SETTLEMENTS
(Percent)
1987 1988 1989 1990 1991 1
Decreases 4 2 1 0 0No wage change 23 20 8 4 90 to 4 percent 50 51 45 61 57
4 to 6 percent 17 24 28 27 256 percent and over 5 4 18 8 9
Mean adjustment 2.2 2.5 4.0 4.0 3.8
1. Based on settlements concluded over the four quarters ended 1991:Q3.
AVERAGE HOURLY EARNINGS(Percent change; based on seasonally adjusted data)
1991 19911989 1990 Q1 Q2 Q3 Aug . Sep.
--Annual rate-- --Monthly rate--
Total private nonfarm 4.0 3.7 2.8 5.2 1.9 .4 .2Manufacturing 2.7 3.6 2.2 5.2 1.8 .4 -.2
Excluding overtime 3.0 3.7 2.7 3.8 1.5 .2 -.1
1. Changes over periods longer than one month are measured from finalmonth of preceding period to final month of period indicated.

II-9
benefits for union and nonunion firms are not available in the ECI,
benefit increases apparently were especially sizable in the union
sector, where contracts limit the ability of employers to adjust
benefit provisions. By contrast, in the nonunion sector, where
employers have greater flexibility, benefit costs appear to have
decelerated somewhat this year.
Data on major collective bargaining settlements provide
additional evidence of a slowing in wage increases this year in the
unionized segment of the labor market. In settlements covering
1,000 or more workers, average first-year adjustments have declined
from 4 percent in 1990 to roughly 3-1/2 percent in the second and
third quarters. Total compensation costs negotiated in new major
contracts (this series is limited to contracts covering 5,000 or
more workers) also have decelerated, from about 4-1/2 percent last
year to around 4 percent through the third quarter of this year.
Bureau of National Affairs' data that include smaller contracts
point to a slowing in union wages as well. Factoring in lump sum
provisions, this series estimates median first-year settlements in
contracts reached between January and mid-October of this year at
4 percent,. down from the 4.3 percent average increase negotiated in
1990.
In the state and local government sector, the severe fiscal
pressures facing many jurisdictions have led to a sharp reduction in
compensation inflation. The employment cost index for this sector
rose just 1.7 percent at an annual rate in the third quarter, after
more than three years of increases in the 5 to 6 percent range. The
sharp deceleration in state and local labor costs has been quite
widespread--including previously stubborn areas such as health
services and educational services--and is consistent with
information available on recent collective bargaining settlements in
the state and local sector.

II-10
GROWTH IN SELECTED COMPONENTS OF INDUSTRIAL PRODUCTION(Percent change from preceding comparable period)
Proportion 1991in
totalIP Sep. 90- Mar. 91-
1990:Q4 19901 Mar. 91 July 91 July Aug. Sep.
Average--Monthly Change-- ---Monthly Change---
Total index 100.0 .3 -.9 .7 .6 .0 .1Motor vehicles and parts 3.8 -9.9 -4.6 4.9 4.5 -5.3 8.1Utilities 7.6 -2.1 -.6 1.1 -.5 .4 -2.5
EXCLUDING UTILITIES & MOTORVEHICLES AND PARTS:
Total index 88.6 1.0 -.7 .5 .6 .2 .0Products, total 58.2 0.9 -.6 .4 .1 .0 .2
Final products 43.7 1.6 -.5 .3 .1 -.1 .3Consumer goods 21.8 0.2 -.3 .5 .1 .6 .3
Durables 4.0 -3.5 -1.0 1.5 .4 .3 .7Nondurables 18.5 1.0 -.1 .3 .0 .6 .2
Business equipment 14.8 5.3 -.5 .1 .2 .1 .0Office and computing 2.7 9.0 .2 .2 1.3 -1.3 -6Industrial 4.3 1.3 -1.1 .0 .3 -.2 -.1Other 7.8 6.3 -.3 .2 -.3 .8 -.3
Defense and space equip. 4.8 -.2 -.6 '-1.0 -.8 -.3 -.8
Intermediate products 13.0 -1.2 -1.0 .6 .4 .3 .1Construction supplies 5.7 -4.6 -1.6 .8 -.3 .6 .5
Materials 27.3 .5 -1.2 1.0 1.6 .4 .2Durables 18.5 .4 -1.5 .9 1.2 ..8 .3Nondurables 8.8 .5 -.6 1.1 2.4 -.6 .0
1. From 1989:Q4 to 1990:Q4.
CAPACITY UTILIZATION IN MANUFACTURING(Percent of capacity; seasonally adjusted)
1967-90 1988-89 1990 1991
Avg. High Sep. Apr. July Aug. Sep.
Total industry 82.2 85.0 83.6 79.1 80.0 79.8 79.7
Manufacturing 81.5 85.1 82.8 77.8 78.7 78.5 78.7
Primary processing 82.4 89.0 85.1 79.0 81.0 81.1 81.2Advanced processing 81,1 83.6 81.8 77.3 77.8 77.5 77.7

II-11
Industrial Production and Capacity Utilization
The index of industrial production was unchanged in August and
edged up 0.1 percent in September. Available information for
October indicates that IP was again about flat. Domestic auto and
light truck assemblies look to have run at about the scheduled pace
of 10.1 million units (annual rate), 2 only a small--increase from
the September rate. Other indicators--electricity generation,
output of big-ticket home appliances, and selected materials, such
as paper, paperboard, lumber, and steel--also are about flat.
In recent months, the production index has been buffeted by
wide swings in the output of motor vehicles and parts. In addition,
the output of utilities fell back sharply in September from the high
levels that had been associated with the unseasonably hot weather
since May. Apart from these sectors, production rose 0.2 percent in
August and was flat in September, after posting gains of 0.5 percent
per month, on average, between March and July.
In part, the recent flattening of industrial production has
reflected a slackening of stimulus from the motor vehicles industry.
In addition, output of construction supplies and of non-auto
consumer durables has been rising much less rapidly than it did last
spring. Moreover, the steep decline in the output of defense and
space equipment has persisted.
The production of business equipment other than motor vehicles
was unchanged again in September, as a moderate increase in the
output of office and computing equipment offset declines elsewhere;
this series has not shown much improvement since reaching its low
last March. However, the staff's adjusted durable orders series,
which is a useful indicator of near-term movements in production,
2. Manufacturers' current schedules call for assemblies to be atan annual rate of 10.1 million units in November and 10.4 millionunits in December. These schedules are only a tad lower than thepreviously announced plans, despite rumors of larger cutbacks.

II-12
PRODUCTION OF AUTOS AND TRUCKSMillions of units, annual rate
16Seasonally adjusted, FRB
S14
Schedules12
i.10
Autos and Trucks
6'v -.-- 4
Autos
- 2
1987 1988 1989 1990 1991
DOMESTIC PRODUCTION OF AUTOS AND TRUCKS(Millions of units at an annual rate; FRB.seasonal basis)
1991 1 199101 02 03 04 Aug, Sep. Oct.1
Total 7.7 8.6 9.4 10.2 8.7 9.9 10.1Autos 5.1 5.2 5.8 6.0 5.3 6.0 5.9Trucks 2.6 3.4 - 3,6 4.2 3.4 3.9 4.2
1. Figures for October through the remainder of the year are based oncurrent manufacturers' schedules.
II-13
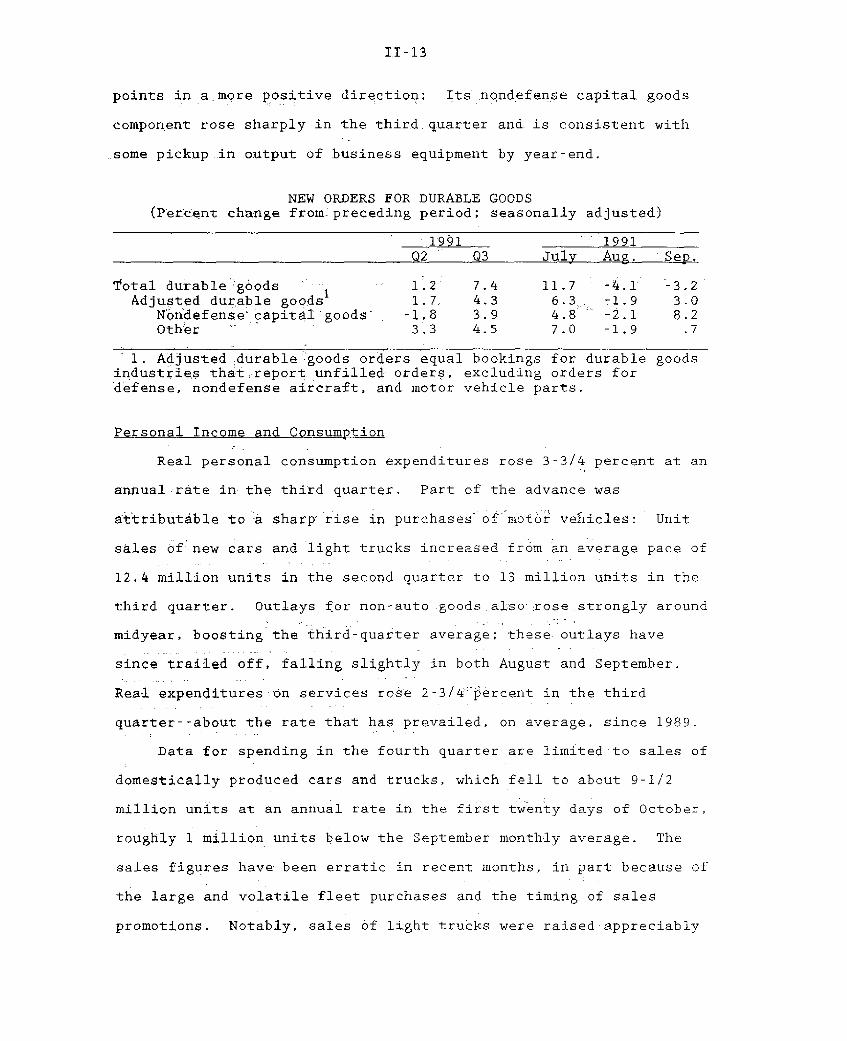
points in a more positive direction: Its nondefense capital goods
component rose sharply in the third quarter and is consistent with
some pickup in output of business equipment by year-end.
NEW ORDERS FOR DURABLE GOODS(Percent change from preceding period; seasonally adjusted)
1991 1991Q2 Q3 July Aug. Sep.
Total durable'goods 1 1.2 7.4 11.7 -4.1 -3.2Adjusted durable goods 1.7. 4.3 6.3 -1.9 3.0
N'ndefense'capital goods -1.8 3.9 4.8 -2.1 8.2Other 3,3 4.5 7.0 -1.9 .7
1. Adjusted durable goods orders equal bookings for durable goodsindustries that,report unfilled orders, excluding orders fordefense, nondefense aircraft, and motor vehicle parts.
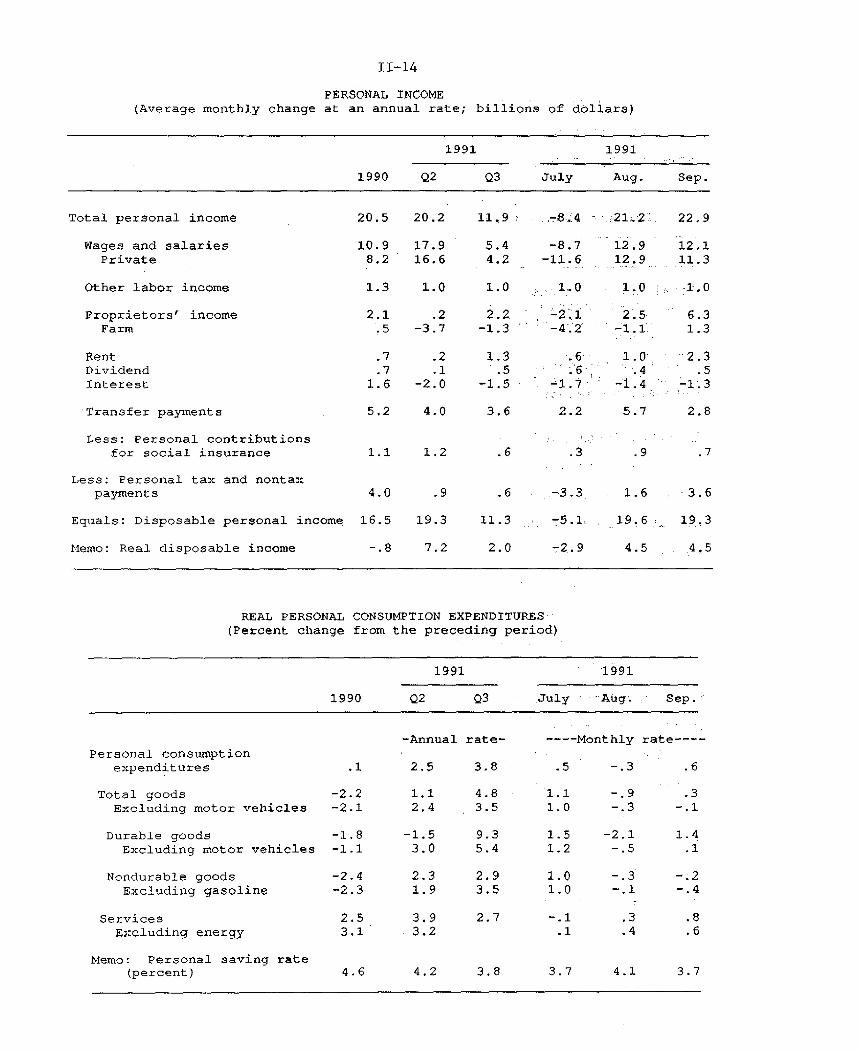
Personal Income and Consumption
Real personal consumption expenditures rose 3-3/4 percent at an
annual rate in the third quarter. Part of the advance was
attributable to a sharp rise in purchases of motor vehicles: Unit
sales of new cars and light trucks increased from an average pace of
12.4 million units in the second quarter to 13 million units in the
third quarter. Outlays for non-auto goods also rose strongly around
midyear, boosting the third-quarter average; these outlays have
since trailed off, falling slightly in both August and September.
Real expenditures on services rose 2-3/4 percent in the third
quarter--about the rate that has prevailed, on average, since 1989.
Data for spending in the fourth quarter are limited to sales of
domestically produced cars and trucks, which fell to about 9-1/2
million units at an annual rate in the first twenty days of October,
roughly 1 million units below the September monthly average. The
sales figures have been erratic in recent months, in part because of
the large and volatile fleet purchases and the timing of sales
promotions. Notably, sales of light trucks were raised appreciably
II-14
PERSONAL INCOME(Average monthly change at an annual rate; billions of dollars)
1991 1991
1990 Q2 Q3 July Aug. Sep.
Total personal income 20.5 20.2 11.9 ,-8_.4 .I21.21' 22.9
Wages and salaries 10.9 17.9 5.4 -8.7 12.9 12.1Private 8.2 16.6 4.2 -11.6 12.9 11.3
Other labor income 1.3 1.0 1.0 1.0 1.0 ,1.0
Proprietors' income 2.1 .2 2.2 -2.1 2.5 6.3Farm .5 -3.7 -1.3 ' -4.2 -1.1 1.3
Rent .7 .2 1.3 .6 1.0 2.3Dividend .7 .1 .5 '6 .4 .5Interest 1.6 -2.0 -1.5 -1.7 -1.4 -1.3
Transfer payments 5.2 4.0 3.6 2.2 5.7 2.8
Less: Personal contributionsfor social insurance 1.1 1.2 .6 .3 .9 .7
Less: Personal tax and nontaxpayments 4.0 .9 .6 -3.3 1.6 3.6
Equals: Disposable personal income 16.5 19.3 11.3 . -5.1,. 19.6: 19.3
Memo: Real disposable income -.8 7.2 2.0 -2.9 4.5 4.5
REAL PERSONAL CONSUMPTION EXPENDITURES(Percent change from the preceding period)
1991 1991
1990 Q2 Q3 July -Aug. Sep.
-Annual rate- ----Monthly rate----Personal consumption
expenditures .1 2.5 3.8 .5 -.3 .6
Total goods -2.2 1.1 4.8 1.1 -. 9 .3Excluding motor vehicles -2.1 2.4 3.5 1.0 -.3 -.1
Durable goods -1.8 -1.5 9.3 1.5 -2.1 1.4Excluding motor vehicles -1.1 3.0 5.4 1.2 -.5 .1
Nondurable goods -2.4 2.3 2.9 1.0 -.3 -. 2Excluding gasoline -2.3 1.9 3.5 1.0 -.1 -.4
Services 2.5 3.9 2.7 -.1 .3 .8Excluding energy 3.1 ,3.2 .1 .4 .6
Memo: Personal saving rate(percent) 4.6 4.2 3.8 3.7 4.1 3.7

II-15
Personal Consumption Expenditures
Total PCEBillions of 1982 dollars
* quarterly value
2760
2720
2680
2640
26001989 1990 1991
PCE Goods excl. Motor VehiclesBillions of 1982 dollars
i- 1200
1180
1160
1140
11111II I11 1 I I LIi iiI LIIL_. I Il1111989
Services excluding Energy
1990
Billions of 1982 dollars
1120
1400
1350
1300
1250
1200

II-16
SALES OF AUTOMOBILES AND LIGHT TRUCKS(Millions of units at an annual rate, BEA seasonal basis)
1991 1991
Q1 Q2 Q3 Aug. Sep. Oct.'
1. Total autos and light trucks 11.8 12.4 13.0 12.4 13.2 n.a.
2. Domestically produced 2 9.3 9.7 10.3 9.8 10.6 9.4
3. Autos 6.0 6.1 6.4 6.1 6.3 6.14. Light trucks 3.3 3.6 3.9 3.7 4.3 3.3
5. Imports 2.5 2.7 2.6 2.6 2.6 n.a.
6. Auto 2.2 2.4 2.3 2.2 2.3 n.a.7. Light trucks .3 .3 .3 .3 .3 n.a.
1. First twenty days; uses FRB seasonal factors prorated to BEA monthly factors.2. Includes vehicles produced in Canada and Mexico for General Motors, Ford, and Chrysler as well as foreign makes
produced in the United States.n.a. = not available.Note: Components may not add to totals due to rounding.
CONSUMER SENTIMENT 1
IndexS140
Conference Board survey
120
'e ,- 100
Michigan survey "' tS\ I I
S '' '? , o ct .
60
1981 1983 1985 1987 1989 1991
1, For Michigan and Conference Board surveys, index equals 100 in 1966 and 1985, respectively.
II-17
in September by incentives at Ford and General Motors on 1991-model-
year pickup trucks, and there has been some retrenchment in October.
The average sales pace since early September for domestically made
light vehicles--about 10 million units at an annual rate--is
somewhat higher than in the early part of 1991, but nearly a million
units below the average for 1990 as a whole.
Most of the basic determinants of consumer spending have shown
little strength of late. In particular, real disposable income grew
only 2 percent at an annual rate in the third quarter, and it
remains a shade below its level of a year ago.
Consumer sentiment, as measured in the Michigan survey,
deteriorated in October after three months of essentially no change;
since the end of the war in the Persian Gulf, this series has
fluctuated around a sub-par level, and the October reading ties the
lowest reading for the period (chart). This month's survey
indicates softness both in consumers' assessments of the current
situation and in their expectations of future economic conditions.
Appraisals of buying conditions for autos and other durables were
little changed, but consumers reportedly have become much less
willing to use credit or to dip into savings to finance purchases.
In the Conference Board's October Survey, consumer confidence
plunged to recessionary levels. In addition to the deterioration in
assessments of labor market conditions noted earlier, consumers'
views about current and prospective business conditions worsened.
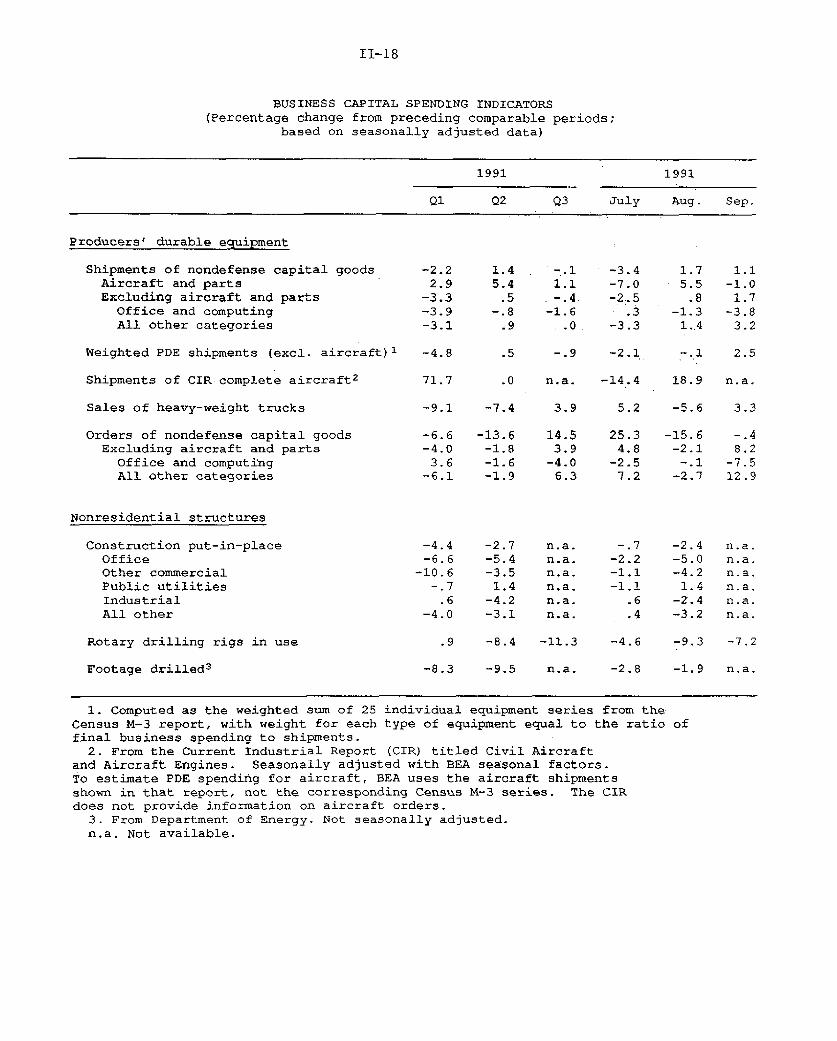
Business Fixed Investment
Real business fixed investment rose 6-1/2 percent at an annual
rate in the third quarter, as a jump in spending on equipment more
than offset another steep drop in outlays for nonresidential
construction. Spending on computing equipment--much of it
apparently imported--was particularly strong. Real business
II-18
BUSINESS CAPITAL SPENDING INDICATORS(Percentage change from preceding comparable periods;
based on seasonally adjusted data)
1991 1991
Q1 Q2 Q3 July Aug. Sep.
Producers' durable equipment
Shipments of nondefense capital goods -2.2 1.4 -.1 -3.4 1.7 1.1Aircraft and parts 2.9 5.4 1.1 -7.0 5.5 -1.0Excluding aircraft and parts -3.3 .5 -.4 -2.5 .8 1.7
Office and computing -3.9 -.8 -1.6 .3 -1.3 -3.8All other categories -3.1 .9 .0. -3.3 1.4 3.2
Weighted PDE shipments (excl. aircraft) 1 -4.8 .5 -.9 -2.1 -.1 2.5
Shipments of CIR complete aircraft2 71.7 .0 n.a. -14.4 18.9 n.a.
Sales of heavy-weight trucks -9.1 -7.4 3.9 5.2 -5.6 3.3
Orders of nondefense capital goods -6.6 -13.6 14.5 25.3 -15.6 -.4Excluding aircraft and parts -4.0 -1.8 3.9 4.8 -2.1 8.2
Office and computing 3.6 -1.6 -4.0 -2.5 -.1 -7.5All other categories -6.1 -1.9 6.3 7.2 -2.7 12.9
Nonresidential structures
Construction put-in-place -4.4 -2.7 n.a. -.7 -2.4 n.a.Office -6.6 -5.4 n.a. -2.2 -5.0 n.a.Other commercial -10.6 -3.5 n.a. -1.1 -4.2 n.a.Public utilities -.7 1.4 n.a. -1.1 1.4 n.a.Industrial .6 -4.2 n.a. .6 -2.4 n.a.All other -4.0 -3.1 n.a. .4 -3.2 n.a.
Rotary drilling rigs in use .9 -8.4 -11.3 -4.6 -9.3 -7.2
Footage drilled 3 -8.3 -9.5 n.a. -2.8 -1.9 n.a.
1. Computed as the weighted sum of 25 individual equipment series from theCensus M-3 report, with weight for each type of equipment equal to the ratio offinal business spending to shipments.
2. From the Current Industrial Report (CIR) titled Civil Aircraftand Aircraft Engines. Seasonally adjusted with BEA seasonal factors.To estimate PDE spending for aircraft, BEA uses the aircraft shipmentsshown in that report, not the corresponding Census M-3 series. The CIRdoes not provide information on aircraft orders.
3. From Department of Energy. Not seasonally adjusted.n.a. Not available.

II-19
spending on aircraft3 and motor vehicles also recorded another
sizable gain, while outlays for industrial machinery fell further.
Real spending on nonresidential structures fell again at a double-
digit rate; outlays for every major type of building weakened, but
the decline in the commercial sector was especially steep.
Looking ahead, recent indicators suggest that equipment
spending is likely to grow moderately in the near future, and that
the mix of spending will shift away from computing and transporta-
tion equipment toward other items. Orders for nondefense capital
goods excluding aircraft advanced 4 percent (not at an annual rate)
in the third quarter on the strength of big increases for
communication equipment and for several categories of industrial
machinery. New orders for office and computing equipment fell about
4 percent in nominal terms, but at least some of the drop
undoubtedly was attributable to the reported sizable declines in
prices of high-technology items. Moreover, fourth-quarter purchases
of computers are expected to be bolstered by deliveries of a new
generation of IBM mainframes--many of which were ordered some time
ago. Some of these shipments will displace sales of other
mainframes, but industry sources indicate that pent-up demand for
the new machines is fairly strong and likely will result in
increased spending overall.
On the structures side, the plunge in new commitments for the
industrial and "other commercial" sectors appears to have eased in
the last few months (chart). The outlook for office construction
3. BEA once again is using the CIR on shipments of completeaircraft to estimate investment in this category. (Public release ofdata from the CIR survey had been prohibited since September 1990because of confidentiality restrictions, but the Census has nowreceived waivers from the manufacturers that allow publication.)Based on CIR data through August, shipments of aircraft appear tohave been stronger in the third quarter than in the M3 survey.
4. IBM started to ship the new machines at the end of September.They cost about $15 million apiece (in current dollars) and takeabout five or six weeks to assemble.

II-20
Nonresidential Construction and Selected Indicators 1(Dec. 1982 = 100, ratio scale)
Total building
1979 1981 1983 1985 1987 1989 1991
Office
Construction
,1 'I' in .
I I I I II I I
1983 1985 1987 1989 1991
Industrial
S New commitments ,'
C u
Construction
160Other commercial
1983 1985 1987 1989 1991
Institutional
Contracts .'""
Construction
I ! I I I t1983 1985 1987 1989 1991 1983 1985 1987 1989 1991
1. Six-month moving average for all series shown. For contracts, total only includes private, while Individual sectors Include private and publicNew commitments are the sum of pemits and contracts. Contracts and permits extend through September.
I I I
.- v

II-21
NOMINAL OFFICE PROPERTY VALUES IN U.S. 1Index = 100 In 83:1
.1979 1981 1983 1985 1987 1989 1991
1. Russel-NCREIF capital index.
EFFECTIVE NOMINAL RENTAL INCOME FOR U.S. OFFICE PROPERTIES 1Index = 100 in 83:1
-- 80
-- 60
I I .I I I I I I I I I I I1978 1979 1980 1981 1982
1. Calculated from Russell-NCRElF data.
1983 1984 1985 1986 1987 1988 1989 1990 1991
II-22
CHANGES IN MANUFACTURING AND TRADE INVENTORIES(Billions of dollars at annual rates;based on seasonally adjusted data)
1990
Q4
1991 1991
Q1 Q2 June July Aug.
Current-cost basis:
Total
Total excluding retail autoManufacturingWholesale
RetailAutomotive
Excluding auto
-. 89.1
-8.710.5-2.6-9.9
7.3
Constant-dollar basis:
TotalTotal excluding retail autoManufacturingWholesaleRetail
AutomotiveExcluding auto
-21.8-11.4-18.3
5.8-9.3
-10.41.1
-29.3-14.4-11.3
4.7-22.7-14.9-7.8
-20.0-2.3-1.36.0
-24.7-17.6-7.1
-50.0-42.2-24.1-18.8
-7.2-7.9
.7
-27.8-28.6-12.7-14.0-1.0
.8
-1.8
-55.3-42.4
-22.9-19.1-13.3-12.9
-. 4
-34.4-33.2-15.5-16.0
-3.0-1.2
-1.8
-3.6-7.2
-23.69.2
10.83.67.2
-1.0-2.1
-17.710.6
6.01.14.9
-6.3-9.1
-13.26.3
.72.8
-2.1
-12.3-12.8-12.6
2.6-2.3
.5-2.7
INVENTORIES RELATIVE TO SALES 1
(Months supply; based on seasonally adjusted data)
1990 1991 1991
Q4 Q1 Q2 June July Aug.
Range inpreceding 12 months:
2
Low High
Current-cost basis:
Total 1.49 1.58 1.52 1.56 1.51 1.50 1.49 1.49
Total excluding retail auto 1.46 1.55 1.49 1.53 1.49 1.48 1.47 1.47
Manufacturing 1.55 1.69 1.59 1.66 1.60 1.59 1.57 1.56
Wholesale 1.28 1.38 1.31 1.37 1.32 1.32 1.31 1.32
Retail 1.54 1.65 1.60 1.58 1.55 1.54 1.54 1.55
Automotive 1.82 2.18 2.01 1.96 1.84 1.82 1.85 1.90
Excluding auto 1.46 1.52 1.49 1.48 1.47 1.47 1.46 1.46
Constant-dollar basis:
Total 1.42 1.51 1.46 1.49 1.44 1.44 1.42 1.43
Total excluding retail auto 1.41 1.49 1.44 1.48 1.43 1.43 1.41 1.41
Manufacturing 1.45 1.55 1.48 1.53 1.47 1.46 1.45 1.44
Wholesale 1.30 1.40 1.34 1.39 1.33 1.32 1.30 1.32
Retail 1.50 1.60 1.55 1.52 1.50 1.50 1.50 1.51
Automotive 1.63 1.89 1.77 1.68 1.65 1.63 1.66 1.70
Excluding auto 1.46 1.53 1.50 1.48 1.47 1.47 1.46 1.46
1. Ratio of end of period inventories to average monthly sales for the period.2. Highs and
coincidental.which data are
lows are specific to each series and are not necessarilyRange is for the 12-month period preceding the latest month for
available.
__
II-23
has not improved, however, as the persistent oversupply of existing
office space continues to depress rents and property values in this
market. Rental income for existing office buildings has declined
nearly 30 percent since 1985, and it trended down further in the
second quarter (chart). 5 The appraised values of office
properties have shown a similar drop.
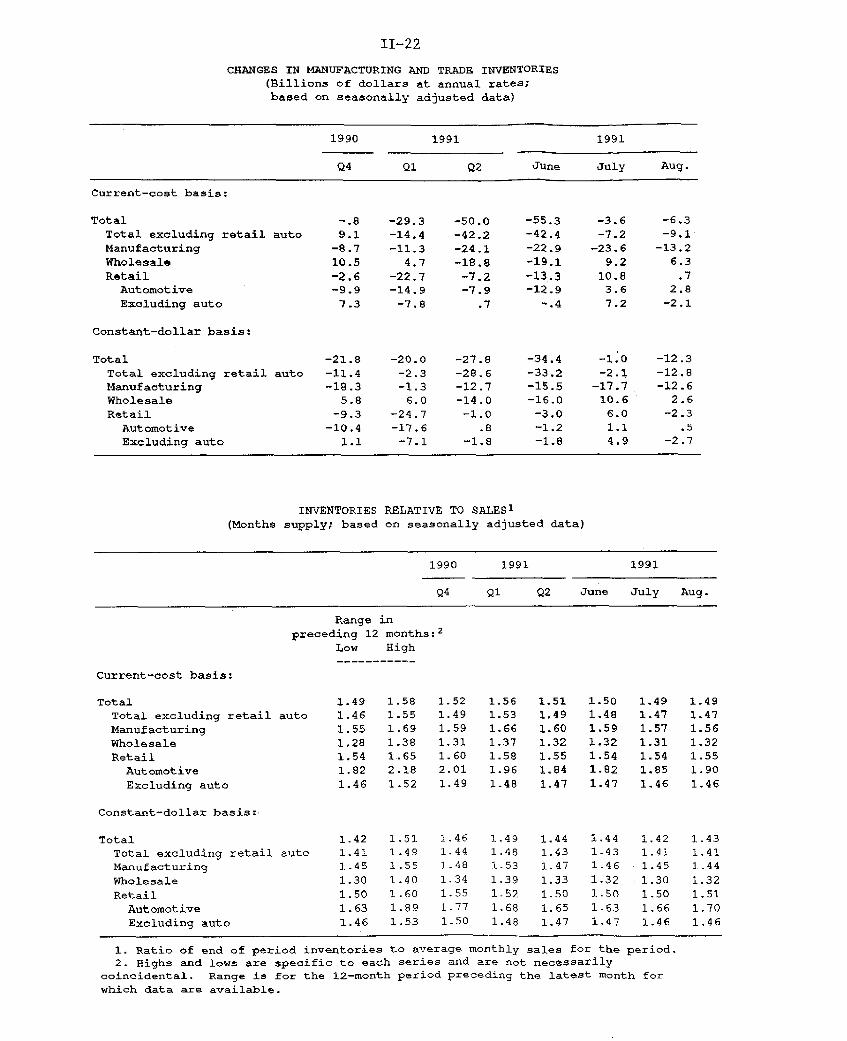
Business Inventories
The pace of business inventory liquidation slowed significantly
this past summer. In constant-dollar terms, manufacturing and trade
firms (excluding retail auto dealers) reduced stocks at only a
$7-1/2 billion annual rate in July and August, compared with a
liquidation averaging nearly $30 billion in the second quarter. 6
The sharp slowing in the pace of overall inventory liquidation
can be traced primarily to a moderate rise in stocks in the
wholesale trade sector, where inventories had been liquidated
substantially in the second quarter. Although the shift toward
accumulation was accompanied by a net increase in sales, the
inventory-sales ratio for wholesale trade at the end of August was
still above its prerecession low.
Manufacturers continued to run off stocks in the summer at
about the same pace as in the second quarter. These reductions in
stocks, along with a rise in shipments, have reversed the runup in
stock-sales ratios that occurred during the recession. While the
5. These data are compiled by the Frank Russell Company inconjunction with the National Council of Real Estate InvestmentFiduciaries (Russell-NCREIF) and are based on rents and appraisedvalues of about 350 office properties owned by major institutionalinvestors.
6. In putting together the GNP estimates for the third quarter,BEA assumed that inventories in manufacturing and trade would fallat an annual rate of $17-1/2 billion (current cost) in September,and that the reduction in nonfarm business inventories for thequarter as a whole would amount to $13 billion (annual rate) in realterms, $14 billion less liquidation than in the second quarter. Theinventory swing added about 1-1/2 percentage points (annual rate) togrowth of real GNP last quarter.
II-24
PRIVATE HOUSING ACTIVITY(Seasonally adjusted annual rates; millions of units)
1990 1991 1991
Annual 01 Q2 Q3P Julvr Augf Sep?
All unitsPermits 1.11 .86 .96 .98 1.01 .95 .98Starts 1.19 .92 1.00 1.05 1.05 1.06 1.03
Single-family unitsPermits .79 .67 .76 .78 .79 .77 .78Starts .90 .73 .83 .88 .88 .89 .87
SalesNew homes .53 .47 .51 .49 .50 .51 .45Existing homes 3.30 3.09 3.48 3.23 3.32 3.25 3.11
Multifamily unitsPermits .32 .19 .20 .20 .21 .18 .20Starts .30 .19 .16 .17 .17 .17 .17
p Preliminary. r Revised estimates. n.a. Not available.
PRIVATE HOUSING STARTS(Seasonally adjusted annual rate)
Millions of units
1982 1983 1984 1985 1986 1987 1988 1989 1990 1991

II-25
improvement in inventory positions has been broadly based, it has
been particularly notable in materials industries. Although the
inventory-to-shipments ratios of these industries in August still
were above their pre-recession lows, they nonetheless have fallen
considerably from their recent peaks.
Inventories in the non-auto retail trade sector have posted
little net change since April; sales have risen, on balance, over
this period, and the inventory-to-sales ratio has edged down.
According to current-cost figures, the inventory-sales ratio in
August at general merchandise, apparel, and furniture stores, where
spending is considered largely discretionary, was at the low end of
the range registered over the past year.
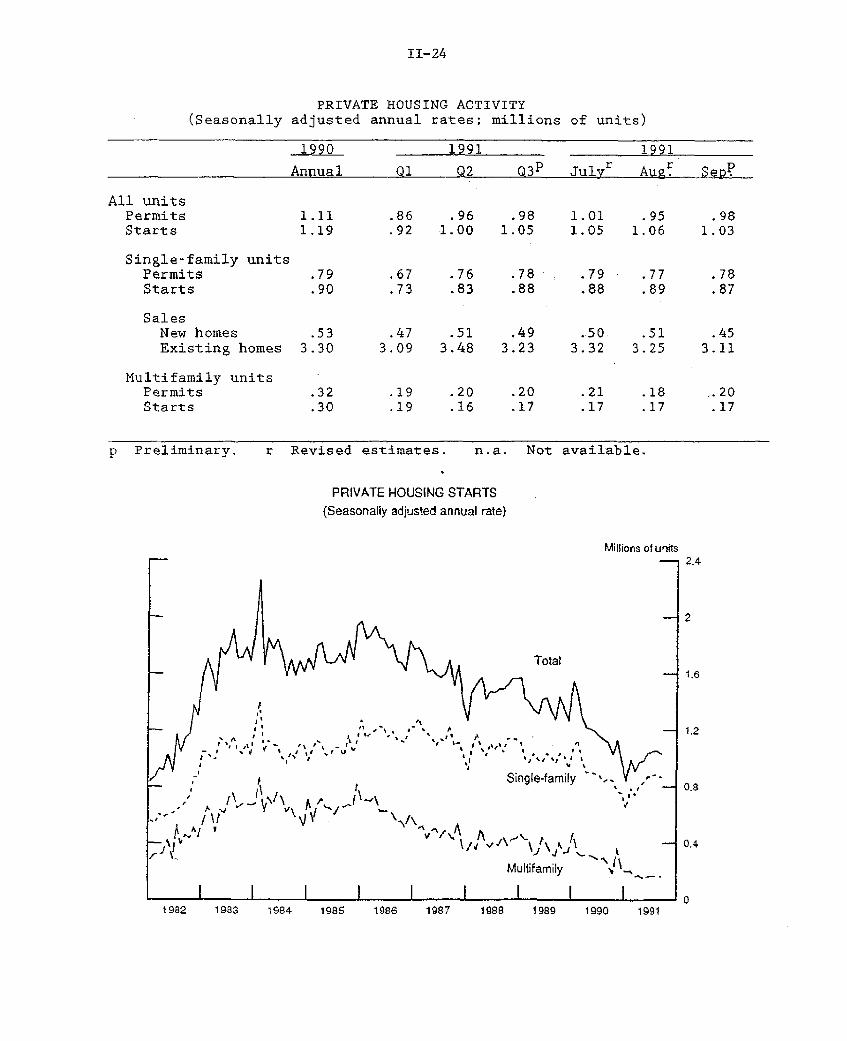
Housing Markets
Total private housing starts declined in September to an annual
rate of 1.03 million units after edging up to 1.06 million units in
August. Nonetheless, the level of starts for the third quarter as a
whole--1.05 million units--was about 5 percent above the second-
quarter pace and was reflected in the 20 percent (annual rate) rise
in real expenditures on residential construction estimated by BEA
for the third quarter.
In the single-family sector, starts decreased 2 percent in
September to 868,000 units, while permits, which are measured with
less statistical error than are starts, edged up--bringing the two
series back into more normal alignment. Sales of new and existing
homes dropped sharply last month to the slowest pace since January.
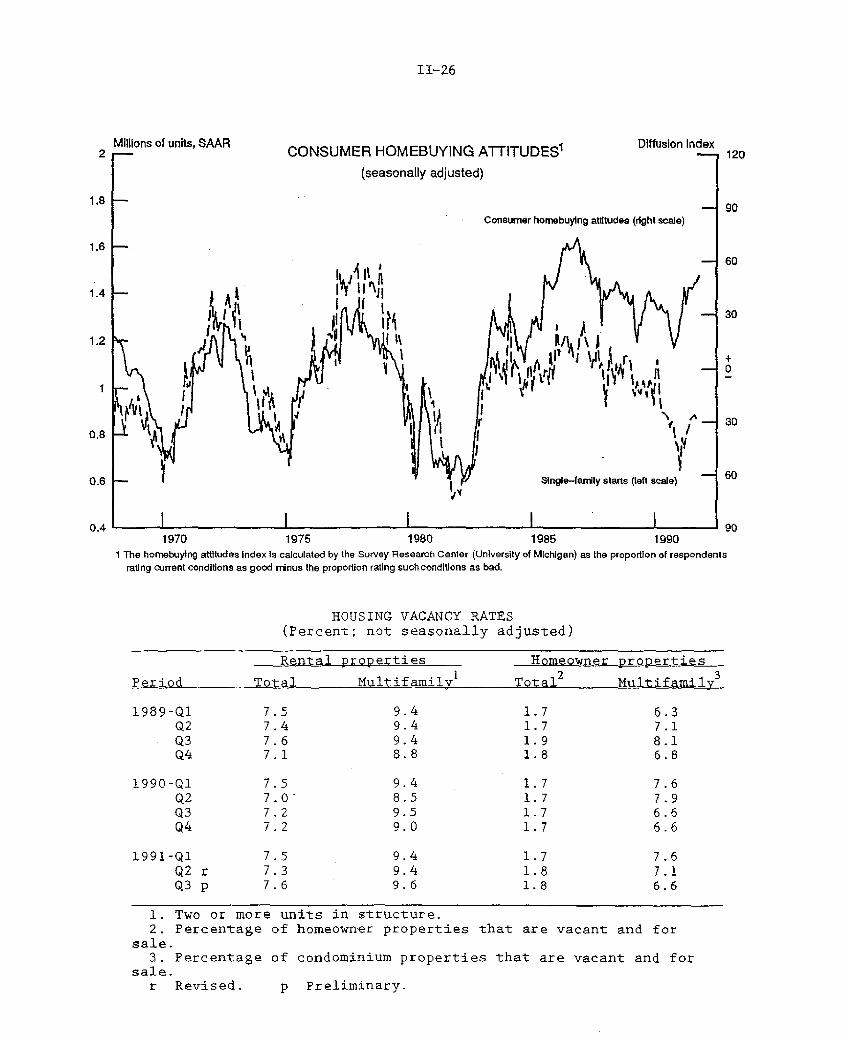
Nonetheless, many of the underpinnings for an expansion in the
single-family market still seem to be in place. Nominal rates on
both fixed-rate and adjustable-rate mortgages are down about 130
basis points over the past year. The cuts in mortgage rates, in
combination with quiescent house prices, have helped to reduce the
II-26
Millions of units, SAAR Diffuslon index2 of units SAA R CONSUMER HOMEBUYING ATTITUDES 1 ff s on 120
(seasonally adjusted)
1.8 90Consumer homebuying attitudes (right scale)
1.660
1.2 j n r 0
1.420.8 '\ I I -Ao^- i b w ' ' 30
0.6 - Single-family starts (left scale) 60
0.4 901970 1975 1980 1985 1990
1 The homebuying attitudes Index is calculated by the Survey Research Center (University of Michigan) as the proportion of respondentsrating current conditions as good minus the proportion rating such conditions as bad.
HOUSING VACANCY RATES(Percent; not seasonally adjusted)
Rental properties Homeowner properties
Period Total Multifamily1 Total2 Multifamily3
1989-Q1 7.5 9.4 1.7 6.3Q2 7.4 9.4 1.7 7.1Q3 7.6 9.4 1.9 8.1Q4 7.1 8.8 1.8 6.8
1990-Q1 7.5 9.4 1.7 7.6Q2 7.0' 8.5 1.7 7.9Q3 7.2 9.5 1.7 6.6Q4 7.2 9.0 1.7 6.6
1991-Q1 7.5 9.4 1.7 7.6Q2 r 7.3 9.4 1.8 7.1Q3 p 7.6 9.6 1.8 6.6
1. Two or more units in structure.2. Percentage of homeowner properties that are vacant and for
sale.3. Percentage of condominium properties that are vacant and for
sale.r Revised. p Preliminary.
II-27
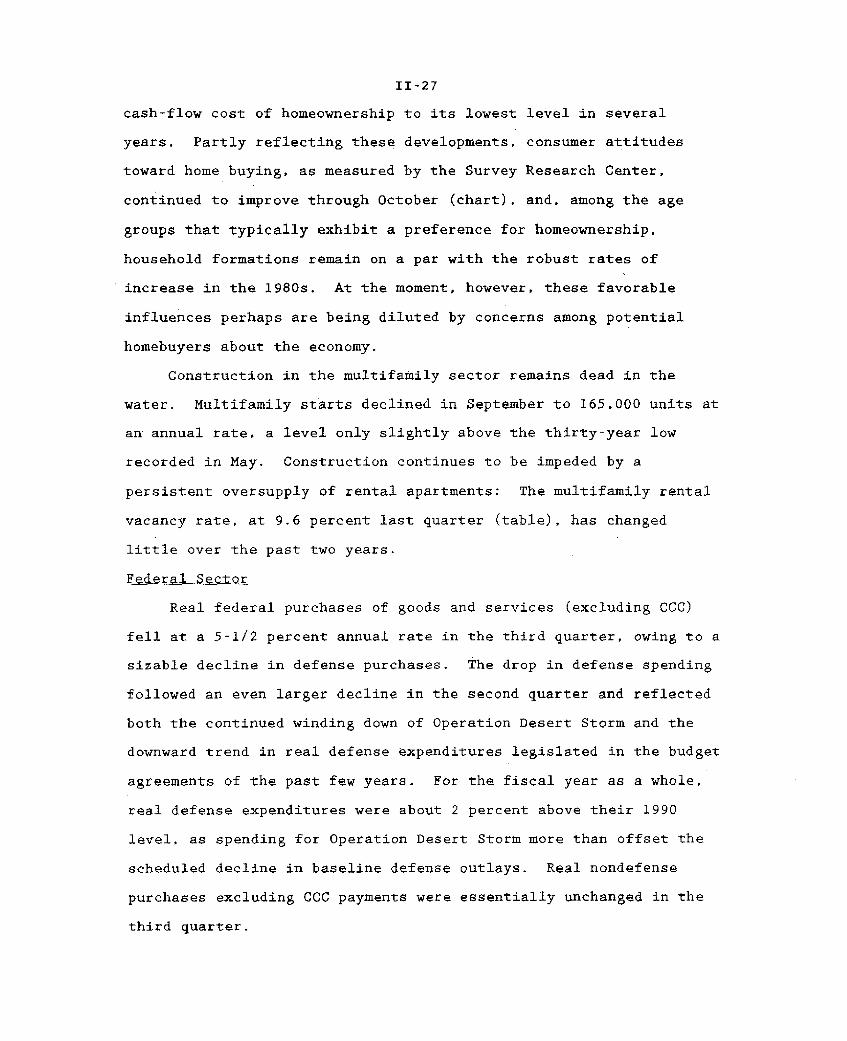
cash-flow cost of homeownership to its lowest level in several
years. Partly reflecting these developments, consumer attitudes
toward home buying, as measured by the Survey Research Center,
continued to improve through October (chart), and, among the age
groups that typically exhibit a preference for homeownership,
household formations remain on a par with the robust rates of
increase in the 1980s. At the moment, however, these favorable
influences perhaps are being diluted by concerns among potential
homebuyers about the economy.
Construction in the multifamily sector remains dead in the
water. Multifamily starts declined in September to 165,000 units at
an annual rate, a level only slightly above the thirty-year low
recorded in May. Construction continues to be impeded by a
persistent oversupply of rental apartments: The multifamily rental
vacancy rate, at 9.6 percent last quarter (table), has changed
little over the past two years.
Fedderal Sector
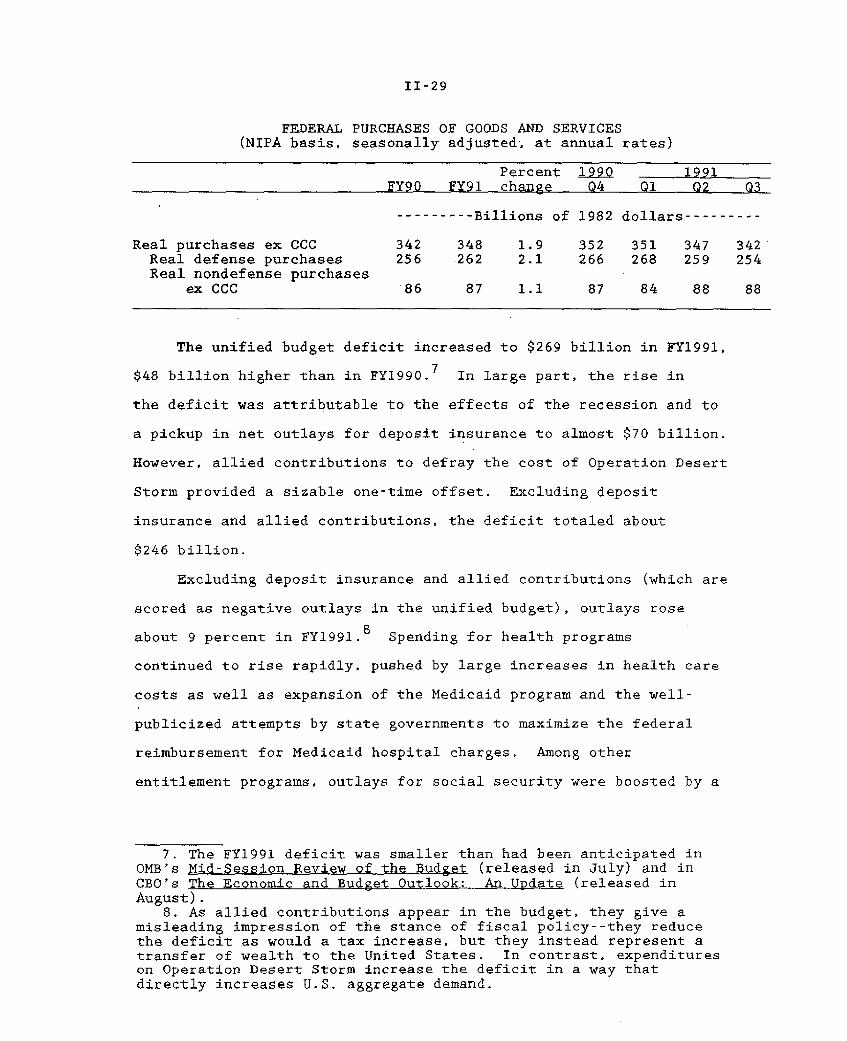
Real federal purchases of goods and services (excluding CCC)
fell at a 5-1/2 percent annual rate in the third quarter, owing to a
sizable decline in defense purchases. The drop in defense spending
followed an even larger decline in the second quarter and reflected
both the continued winding down of Operation Desert Storm and the
downward trend in real defense expenditures legislated in the budget
agreements of the past few years. For the fiscal year as a whole,
real defense expenditures were about 2 percent above their 1990
level, as spending for Operation Desert Storm more than offset the
scheduled decline in baseline defense outlays. Real nondefense
purchases excluding CCC payments were essentially unchanged in the
third quarter.

II-28
FEDERAL GOVERNMENT OUTLAYS AND RECEIPTS(Unified basis, billions of current dollars, not seasonally adjusted,
except where otherwise noted)
Third QuarterPercent Percent
1990 1991 change FY90 FY91 change
Outlays 311.6 355.6 14.1 1251.8 1323.0 5.7Deposit insurance (DI) 16.5 36.0 118.2 58.3 66.6 14.3Defense cooperation account
contributions (DCA) (-) 0.0 -4.7 -- 0.0 -43.6
Outlays ex DI and DCA 295.1 324.3 9.9 1193.6 1300.0 8.9National defense ex DCA 72.9 78.5 7.7 299.3 316.1 5.6Net interest 48.4 49.4 2.1 184.2 195.0 5.9Social Security 62.7 67.9 8.3 248.6 269.0 8.2Medicare and health 41.6 47.4 13.9 155.8 175.7 12.8Income security 35.5 42.4 19.4 147.3 171.6 16.5Agriculture 0.6 1.0 66.7 12.0 14.9 24.6Other 33.5 37.7 12.5 146.2 157.8 7.9
Receipts 253.7 264.4 4,2 1031.3 1054.3 2.2Personal income taxes 116.4 120.9 3.9 466.9 467.8 0.2Social insurance taxes 92.7 95.9 3.5 380.0 396.0 4.2Corporate income taxes 21.0 21.7 3.1 93.5 98.1 4.9Other 23.6 25.9 9.6 90.9 92.3 1.6
Deficit 57.9 91.3 57.7 220.6 268.7 21.9Deficit ex DI and DCA 41.4 60.0 44.9 162.3 245.7 51.5
II-29
FEDERAL PURCHASES OF GOODS AND SERVICES(NIPA basis, seasonally adjusted, at annual rates)
Percent 1990 1991FY90 FY91 change 04 Q1 Q2 Q3
--------- Billions of 1982 dollars---------
Real purchases ex CCC 342 348 1.9 352 351 347 342Real defense purchases 256 262 2.1 266 268 259 254Real nondefense purchases
ex CCC 86 87 1.1 87 84 88 88
The unified budget deficit increased to $269 billion in FY1991,
$48 billion higher than in FY1990.7 In large part, the rise in
the deficit was attributable to the effects of the recession and to
a pickup in net outlays for deposit insurance to almost $70 billion.
However, allied contributions to defray the cost of Operation Desert
Storm provided a sizable one-time offset. Excluding deposit
insurance and allied contributions, the deficit totaled about
$246 billion.
Excluding deposit insurance and allied contributions (which are
scored as negative outlays in the unified budget), outlays rose
about 9 percent in FY1991. Spending for health programs
continued to rise rapidly, pushed by large increases in health care
costs as well as expansion of the Medicaid program and the well-
publicized attempts by state governments to maximize the federal
reimbursement for Medicaid hospital charges. Among other
entitlement programs, outlays for social security were boosted by a
7. The FY1991 deficit was smaller than had been anticipated inOMB's Mid-Session Review of the Budget (released in July) and inCBO's The Economic and Budget Outlook: An Update (released inAugust).
8. As allied contributions appear in the budget, they give amisleading impression of the stance of fiscal policy--they reducethe deficit as would a tax increase, but they instead represent atransfer of wealth to the United States. In contrast, expenditureson Operation Desert Storm increase the deficit in a way thatdirectly increases U.S. aggregate demand.
II-30
5-1/2 percent COLA9 and by growth in the number of beneficiaries:
spending for unemployment benefits also rose sharply. Defense
outlays--excluding foreign contributions for Operation Desert
Storm--were up moderately because the spending cuts enacted as part
of last fall's budget legislation were more than offset by the
additional outlays for Operation Desert Storm.
Receipts rose only about 2 percent in FY1991--the smallest gain
in many years--despite last year's changes to the tax laws that were
projected to raise about $16 billion in new revenues (and another
$2 billion from extensions of expiring provisions). Personal income
receipts were especially weak, held down by the relatively slow
growth in nominal taxable income as well as the unusually low level
of final payments on 1990 liabilities last spring. The plunge in
final payments follows an unusually high level of withheld taxes
relative to NIPA wages and salaries in calendar year 1990; because
taxes are withheld at rates based on the anticipation of a full
year's pay, and because the withholding schedule is progressive,
many workers who had jobs in the first part of 1990, but were laid
off during the recession, probably were significantly overwithheld
for the year as a whole.
Legislation providing funding for FY1992 is nearing completion.
Four of the thirteen regular appropriations bills have not yet been
enacted, and the affected programs are currently being funded in
accordance with a continuing resolution that was extended on
October 28 and expires on November 14. Two of these appropriations
bills are out of conference but are not yet approved by both houses
of Congress, and two are still in conference. The nine
appropriations bills so far enacted abide by the spending caps
9. The social security COLA was based on the change in the CPI-Wover the four quarters ending in September 1990. Given the datathrough September 1991, the COLA for 1992 will be 3-3/4 percent.
II-31
contained in last year's budget agreement, and it appears that the
remaining four bills will also pass in a form that satisfies the
budget agreement.
State and Local Government Sector
Real purchases of goods and services by state and local
governments edged down in the third quarter, after a small decline
over the first half of the year. Outlays for "other" goods and
services--that is, those outside of construction and labor
compensation--fell 3 percent at an annual rate--the first reduction
since mid-1987. In addition, the cutbacks in employment last summer
contributed to a marked slowing in real outlays for compensation.
In contrast, construction spending is estimated to have risen about
4 percent at an annual rate in the third quarter after a sizable
decline over the first half of the year. 10
So far this year, real purchases have declined at about a
1 percent annual rate, while receipts have risen moderately--in part
reflecting the spate of tax increases that went into effect during
the third quarter; as a result, the deficit of operating and capital
accounts, which excludes social insurance funds, is estimated to
have narrowed from $45 billion at an annual rate in the fourth
quarter of last year to about $30 billion last quarter.
Despite widespread spending cuts and tax hikes, many state and
local governments are confronting new budget gaps, and some are
taking corrective actions. For example, California has trimmed
payrolls in view of a shortfall in tax receipts of nearly 4 percent,
and layoffs have been reported by several states in the mid-Atlantic
and Northeast regions, as well as Ohio. In addition, Michigan and
Maryland recently announced the termination of general assistance
10. The third-quarter estimate incorporates the large increases inoutlays for construction put in place in July and August, but BEAassumes a steep decline in this series in September.

II-32
STATE AND LOCAL SECTOR SURPLUS (DEFICIT) *(NIPA basis)
Billions of dollars
uarterly , .
II :-11 . 1
S 1
1 "
k11'1 I 1 IIilm il
•Ii IIi
i I i I I i i I i iI ii! ii1980 1981 1982 1983 1984 1985 1986 1987 1988 1989 1990 1991
As a Percent of GNPPercent
quarterly * 5
S1i i Ai I 11; * I.
1: t. I. \. i! I fI i
1981 1983 1985
*For operating and capital accounts, excludes socal Insurance funds," Slaff estimate.
Level
1 1;;·';.:
I I
Ir~. Iri~-·..,~:
* Ir":-;
40
so
20
10
1987 1989
II-33
welfare programs for able-bodied adults without children; Illinois,
Massachusetts, and Ohio restricted their welfare programs earlier
this year.
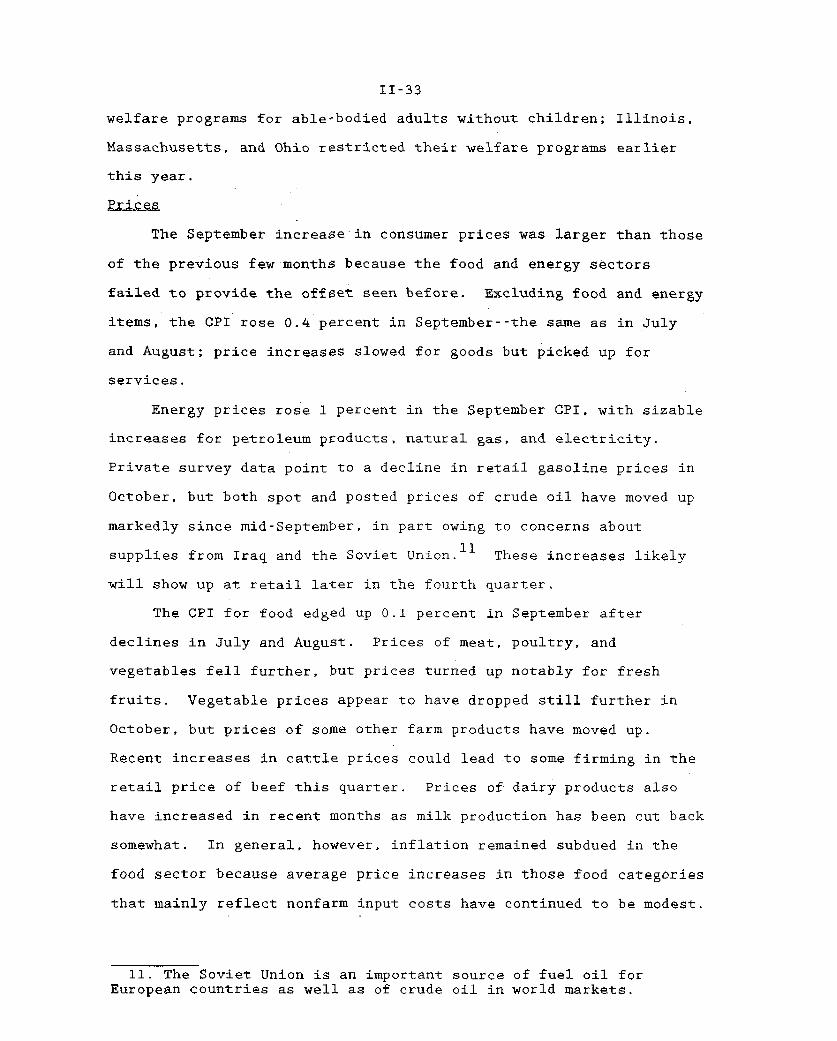
Prices
The September increase in consumer prices was larger than those
of the previous few months because the food and energy sectors
failed to provide the offset seen before. Excluding food and energy
items, the CPI rose 0.4 percent in September--the same as in July
and August; price increases slowed for goods but picked up for
services.
Energy prices rose 1 percent in the September CPI, with sizable
increases for petroleum products, natural gas, and electricity.
Private survey data point to a decline in retail gasoline prices in
October, but both spot and posted prices of crude oil have moved up
markedly since mid-September, in part owing to concerns about
supplies from Iraq and the Soviet Union. 11 These increases likely
will show up at retail later in the fourth quarter.
The CPI for food edged up 0.1 percent in September after
declines in July and August. Prices of meat, poultry, and
vegetables fell further, but prices turned up notably for fresh
fruits. Vegetable prices appear to have dropped still further in
October, but prices of some other farm products have moved up.
Recent increases in cattle prices could lead to some firming in the
retail price of beef this quarter. Prices of dairy products also
have increased in recent months as milk production has been cut back
somewhat. In general, however, inflation remained subdued in the
food sector because average price increases in those food categories
that mainly reflect nonfarm input costs have continued to be modest.
11. The Soviet Union is an important source of fuel oil forEuropean countries as well as of crude oil in world markets.

II-34
RECENT CHANGES IN CONSUMER PRICES
(Percentage change; based on seasonally adjusted data) 1
Relative 1991 1991
importanceDec. 1990 1989 1990 Q1 Q2 Q3 Aug. Sept.
----- Annual rate------ -Monthly rate-
All items2 100.0 4.6 6.1 2.4 3.0 3.3 .2 .4Food 16.2 5.6 5.3 2.4 5.1 -3.2 -.3 .1Energy 8.2 5.1 18.1 -30.7 -1.2 1.6 -.2 1.0All items less food
and energy 75.6 4.4 5.2 6.8 3.2 4.6 .4 .4Commodities 24.5 2.7 3.4 7.9 3.2 4.1 .5 .2Services 51.1 5.3 6.0 6.4 3.0 4.6 .3 .5
Memorandum:
CPI-W3 100.0 4.5 6.1 1.5 3.3 2.7 .1 .4
1. Changes are from final month2. Official index for all urban3. Index for urban wage earners
of preceding period to final monthconsumers.
and clerical workers.
of period indicated.
RECENT CHANGES IN PRODUCER PRICES
(Percentage change; based on seasonally adjusted data) 1
Relative 1991 1991
importanceDec. 1990 1989 1990 Q1 Q2 Q3 Aug. Sept.
-----Annual rate------ -Monthly rate-
Finished goods 100.0 4.9 5.7 -3.5 .7 .3 .2 .1Consumer foods 23.7 5.2 2.6 1.0 -.3 -6.6 -.4 -.5
Consumer energy 16.8 9.5 30.7 -35.5 .0 5.3 1.8 .8
Other finished goods 59.5 4.2 3.5 5.4 1.2 1.8 .2 .0Consumer goods 36.4 4.4 3.7 5.9 .9 2.7 .3 .0
Capital equipment 23.1 3.8 3.4 4.6 1.3 1.3 .1 .2
Intermediate materials 2 95.2 2.5 4.6 -9.8 -1.0 .7 .4 .1Excluding food and energy 78.5 .9 1.9 -2.3 -1.0 -.3 .0 .0
Crude food materials 34.4 2.8 -4.2 .0 -12.5 -8.1 -1.8 1.5Crude energy 50.7 17.9 19.1 -54.0 -1.5 2.1 1.3 -2.7Other crude materials 14.9 -3.6 .6 -4.7 -13.0 -4.3 .5 -.9
1. Changes are from final month of preceding
2. Excludes materials for food manufacturingperiod to final month of period indicated.and animal feeds.

II-35
CPI EXCLUDING FOOD AND ENERGY
TotalPercent change from 12 months earlier
- .5
6
4.5Sept.
1,5
! I 101984 1986 1988 1990
GoodsPercent change from 12 months earlier
- 7.5
6
4.5Sept.
3
1.5
1984 1986 1988 1990
ServicesPercent change from 12 months earlier
7.5
6
Sept-4.5
3
1.5
11984 1986 1988 1990

II-36
The CPI for nonfood, nonenergy goods advanced only 0.2 percent
in September, after two months of large increases. Apparel prices
retreated, as expected, on a seasonally adjusted basis; a further
seasonally adjusted decline is likely in October. The early pricing
of fall and winter clothing had boosted the index in July and
August. Prices of new vehicles rose 0.2 percent in September for
the fifth consecutive month, as discounting was less than what the
12BLS seasonal factors anticipate for this time of the model year. 12
On a twelve-month basis, the rise in the CPI for nonfood,
nonenergy goods receded a bit in September (chart). Nonetheless,
the year-over-year change in September--4-1/4 percent--was well
above the pace over the preceding year, which is unusual at the
current stage of the cycle; in part, the acceleration reflected some
special factors including hikes in federal excise taxes early this
year, increases in state and local sales and excise taxes around
midyear, and an acceleration in prices of new motor vehicles (year-
over-year). 13 Those increases more than offset declines in a
number of other categories, notably apparel.
In contrast to goods, the CPI for nonenergy services rose
0.5 percent in September--more than in recent months--because of a
sizable jump in rents after four months of small increases. Never-
theless, the indexes for owners' equivalent rent and residential
rent remained only 3.1 percent and 3.3 percent respectively above
their levels of twelve months earlier. This represents a decelera-
tion from the rate over the preceding year of about 3 percentage
12. Over the next few months, the prices of 1992 models will bephased into the CPI for new vehicles as they replace the 1991 modelsat the dealers in the sample. In the PPI, by contrast, new-modelvehicles enter the sample each October and are maintained throughSeptember of the following year. Both indexes are adjusted by BLSestimates (based on manufacturers' cost data) of the value of thequality changes.
13. Relatively low auto dealers' inventories may have contributedto the latter by limiting discounting.

II-37
points for the former and 1-1/4 percentage points for the latter.
That slowing accounts for most of the deceleration in the twelve-
month change in the CPI for nonenergy services, although decelera-
tion also was evident, on balance, for other services, notably for
out-of-town lodging, airfares, and to a lesser extent, medical care.
In September, some further large increases were registered for
tuition and medical care, while airfares and auto finance costs
retreated.
At the producer level, the PPI for capital equipment posted
another modest increase of 0.2 percent in September. On a twelve-
month change basis, the rise in this component has slowed to about
2-1/2 percent, 3/4 percentage point less than over the preceding
year. Prices of intermediate materials less food and energy have
been flat, on balance, over the past four months. The PPI for crude
nonfood materials less energy was down further in September, after a
small increase in August; it remained about 10 percent below its
level of a year earlier.
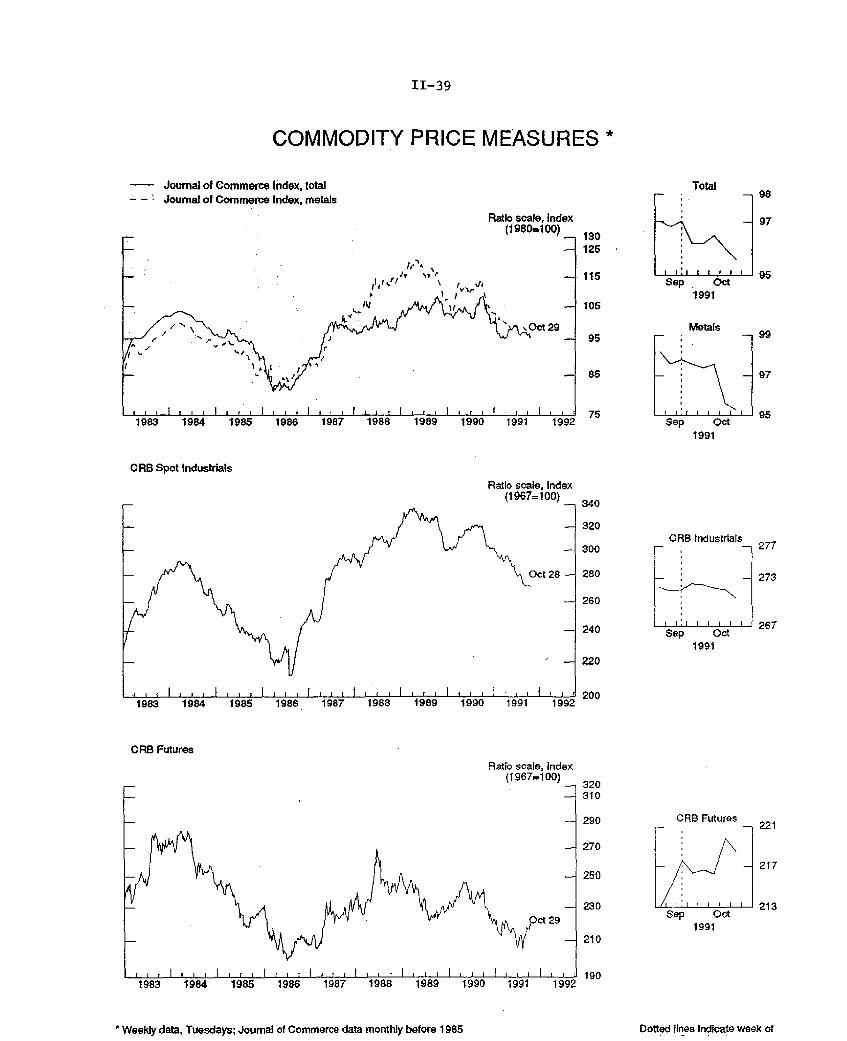
Since the week of the September Greenbook, movements in
commodity price measures for industrial materials have given little
indication of a break from the relatively flat to declining trend of
the past few months. 14 Aluminum prices firmed notably in mid-
October--reportedly in response to news of production cutbacks. But
with demand soft and stocks ample, prices have since turned back
down.
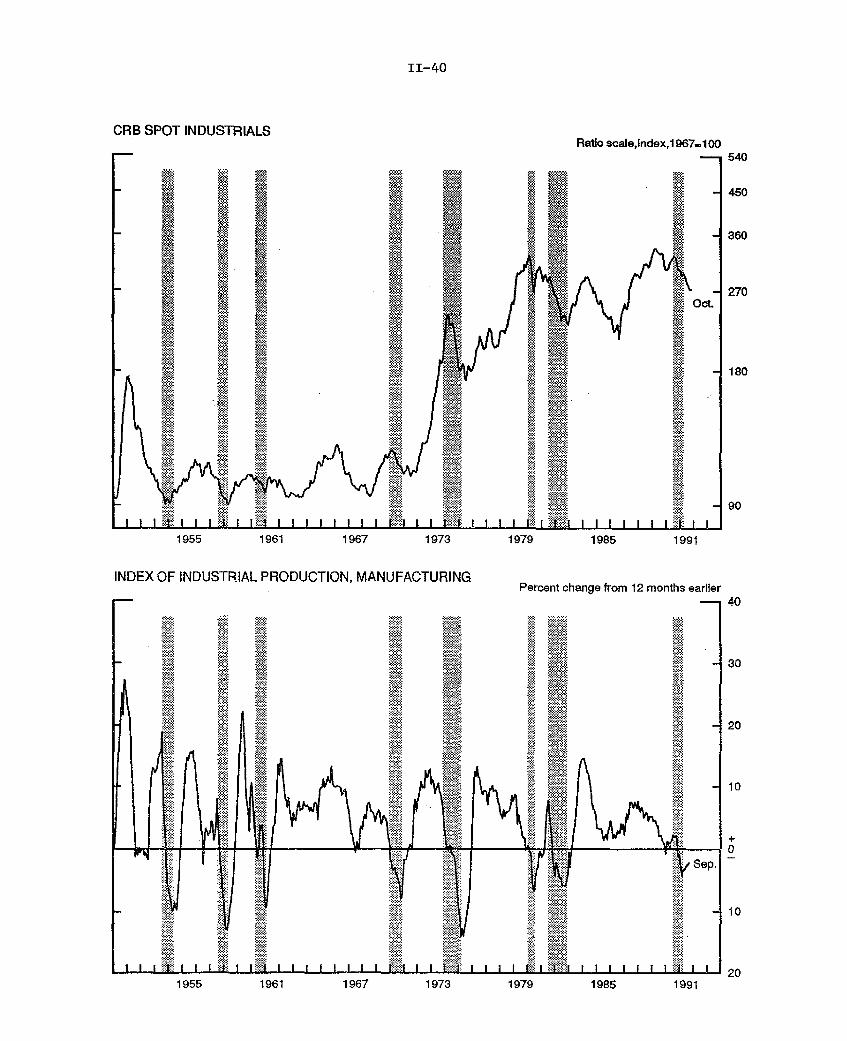
In most, but not all, post-World War II cycles (chart),
industrial commodity price measures have turned up around or soon
14. The Journal of Commerce subindex for metals fell sharply inthe third week of October, but this decline (and a smaller declinein the index total) actually reflected a change in the zinc seriesused for the index. Another quotation for zinc posted a similardecline between the end of 1990 and May of this year and has sincebeen relatively flat. Recent increases in the CRB futures index aredue largely to higher prices of crude oil and fuel oil.

II-38
PRICE INDEXES FOR COMMODITIES AND MATERIALS 1
aercent .chanae2
1991
ToSept.
,13
Sept. 243to
A 4ta
1. PPI for crude materials4
la. Foods and feedslb. EnergyIc. Excluding food and energyId. Excluding food and energy.
seasonally adjusted
2. Commodity Research Bureau2a. Futures prices2b. Industrial spot prices
3. Journal of Commerce industrials3a. Metals
4. Dow-Jones Spot
5. IMF commodity index4
5a. Metals5b. Nonfood agric.
6. Economist (U.S. dollar index)6a. Industrials
Sept.
Sept.Sept.Sept.
Sept.
Oct. 29Oct. 28
Oct. 29Oct. 29
7.1
2.817.9-3.6
-3.6
-9.0-5.9
6.0 -11.3
-4.219.1
.6
-4.617.5-5.3
.5 -5.6
-2.7 -2.3.6 -10.1
n.a.
n.a.n.a.n.a.
n.a.
1.3 -2.4 -3.4 -1.4-7.2 -3.9 -5.0 -2.6
Oct. 29 -10.1 -1.7 -5.6
Sept.Sept.Sept.
-12.9-23.4-4.6
-5.6-3.0-3.5
-. 1-8.3
2.2
-3.4
n.a.n.a.n.a.
Oct. 22 -22.8 -4.4 -8.0Oct. 22 -23.8 -3.2 -13.5
1. Not seasonally adjusted.2. Change is measured to end of period, from3. Week of the September Greenbook.4. Monthly observations. IMF index includesn.a. Not available.
last observation of previous period.
items not shown separately.
Index Weights
Food Commodities
0EPrecious Metals
0PPI for crude materials
CRB futures
CRB industrials
Joumal of Commerce index
Dow-Jones
IMF index
Economist
1. Forest products, industrial metals, and other industrial materials.
Lastobservr 4i n r lQRO 1Qon
Memo:
Yearearlier.
to date
-15.0
-7.1-21.7-10.2
-10.2
-4.9-11.8
-9.4-11.5
-9.1
-6.4-22.'-3
-14.7-20.5
Energy
E'Others
Oe
51 34 15
10 62 14 14
100
12 88
58 17 25
55 045
so50 n
___5i__6 M sa -- _ r .L
II-39
COMMODITY PRICE MEASURES *
- Journal of Commerce Index, total- - : Journal of Commerce Index, metals
Ratio scale, Index(1980=100)
Metals
Sep Oct1991
CRB Spot IndustrialsRatio scale, index
(1967=100)
CRB industrials
Sep Oct1991
CRB Futures
CRB Futures
Sep Oct1991
* Weekly data, Tuesdays; Journal of Commerce data monthly before 1985 Dotted lines Indicate week of
II-40
CRB SPOT INDUSTRIALSRatio scale,Index,1967-100
1955 1961 1967 1973
INDEX OF INDUSTRIAL PRODUCTION, MANUFACTURING
1979 1985 1991
Percent change from 12 months earlier
1967 1973 19791955 1961 1985 1991

II-41
after the trough. The slow recovery after the November 1970
cyclical trough is the most notable outlier; in this instance, there
was no clear uptrend in spot prices for industrial materials (CRB
index) until 1972. The upturn after the March 1975 trough also
lagged substantially. Then, an exceptionally large overhang of
world stocks--the aftermath of the 1973-74 commodities boom--likely
contributed to the relatively long period of price weakness in that
recovery.

DOMESTIC FINANCIALDEVELOPMENTS
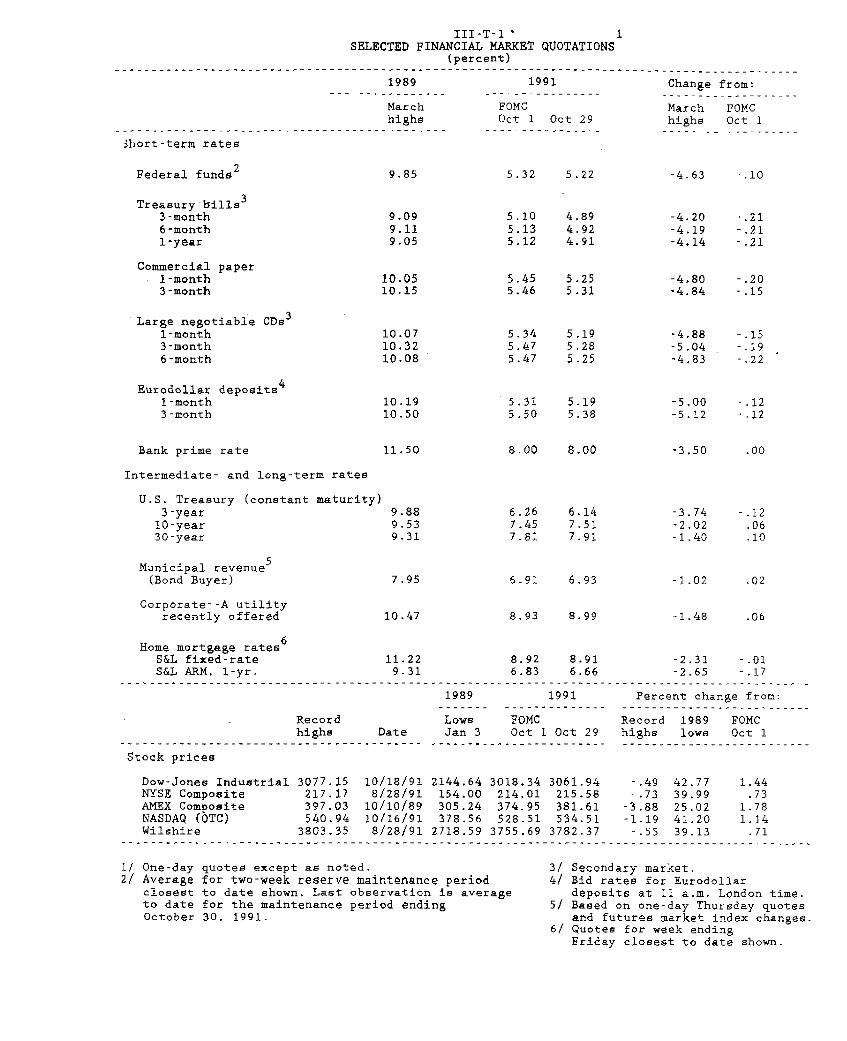
III-T-1 1SELECTED FINANCIAL MARKET QUOTATIONS
(percent)...--.--------.--.---.---.--.--..............................................................
1989 1991 Change from:
March FOMC March FOMChighs Oct 1 Oct 29 highs Oct 1
3hort-term rates
Federal funds 2
Treasury bills 3
3-month6-month1-year
Commercial paper1-month3-month
Large negotiable CDs 3
1-month3-month6-month
Eurodollar deposits4
1-month3-month
Bank prime rate
Intermediate- and long-term rates
9.85
9.099.119.05
10.0510.15
10.0710.3210.08
10.1910.50
11.50
5.32 5.22
5.105.135.12
-4.63 -. 10
4.894.924.91
5.45 5.255.46 5.31
5.345.475.47
-4.20-4.19-4.14
-.21-.21-.21
-4.80 -.20-4.84 -.15
5.195.285.25
-4.88-5.04-4.83
5.31 5.195.50 5.38
8.00 8.00
-.15-.19-.22
-5.00 -.12-5.12 -.12
-3.50
U.S. Treasury (constant maturity)3-year10-year30-year
Municipal revenue(Bond Buyer)
Corporate--A utilityrecently offered
9.889.539.31
6.267.457.81
7.95
10.47
6.147.517.91
-3.74-2.02-1.40
-1.02
-1.48
6.91 6.93
8.93 8.99
Home mortgage rates6
S&L fixed-rate 11.22 8.92 8.91 -2.31S&L ARM. 1-yr. 9.31 6.83 6.66 -2.65
1989 1991 Percent chan1989 1991 Percent chan
Recordhighs Date
Stock prices
Lows FOMCJan 3 Oct 1 Oct 29
------------------------
-. 12.06.10
-.01-. 17
.ge from:
Dow-Jones Industrial 3077.15 10/18/91 2144.64 3018.34 3061.94 -.49 42.77 1.44NYSE Composite 217.17 8/28/91 154.00 214.01 215.58 -.73 39.99 .73AMEX Composite 397.03 10/10/89 305.24 374.95 381.61 -3.88 25.02 1.78NASDAQ (OTC) 540.94 10/16/91 378.56 528.51 534.51 -1.19 41.20 1.14Wilshire 3803.35 8/28/91 2718.59 3755.69 3782.37 -.55 39.13 .71
..............................................................................................
1/ One-day quotes except as noted.2/ Average for two-week reserve maintenance period
closest to date shown. Last observation is averageto date for the maintenance period endingOctober 30, 1991.
3/ Secondary market.4/ Bid rates for Eurodollar
deposits at 11 a.m. London time.5/ Based on one-day Thursday quotes
and futures market index changes.6/ Quotes for week ending
Friday closest to date shown.
Record 1989 FOMChighs lows Oct 1--------------------------

Selected Interest Rates *(percent)
Daily
Federal Funds
3-month Treasury
1989 1990 1991
9 I-
Corporate Bond(weekly)
Primary Fixed -Rate Mortgage
(weekly)
30-year Treasury Bond(daily)
I I I I I1989 1990 1991
Friday weeks through October 25, Wednesday weeks through October 23.

DOMESTIC FINANCIAL DEVELOPMENTS
The Treasury yield curve has steepened since the October FOMC
meeting. The release of generally weaker-than-anticipated data on
the economy and the continued sluggishness of the monetary
aggregates have fostered market expectations of a near-term easing
of monetary policy and pushed short-term rates down about 20 basis
points on balance over the intermeeting period. Meanwhile, long-
term rates are up a touch: The yield on thirty-year Treasury bonds
increased over much of October owing to disappointing news on
consumer prices and rising oil prices along with tax-cut proposals,
but these increases have largely unwound in recent days on news
pointing to a weak economy. Major stock market indexes, some of
which touched new highs over the intermeeting period, are up
slightly on net.
M2 and M3 increased in October, but not very much. Depositors
evidently have continued to shift into higher yielding assets
outside of M2. In addition, the third-quarter surge in RTC
resolution activity may have had a lingering depressing influence on
M2 in October. The upturn in M3 in October accompanied some
strengthening of bank credit growth.
Borrowing by the private sectors may have firmed a bit
recently, but it remains rather sluggish. In the business sector,
borrowing likely increased in October; commercial paper ran off at a
reduced pace, while public bond issuance remained robust and bank
loans posted a second monthly increase. The continued heavy pace of
equity issuance by many nonfinancial firms has led to a
strengthening of balance sheets, slowing the deterioration of credit
quality. Data on household borrowing is sketchy, but they suggest
that consumer credit probably has remained about flat or edged down
a little, while net mortgage borrowing evidently has remained
III-1
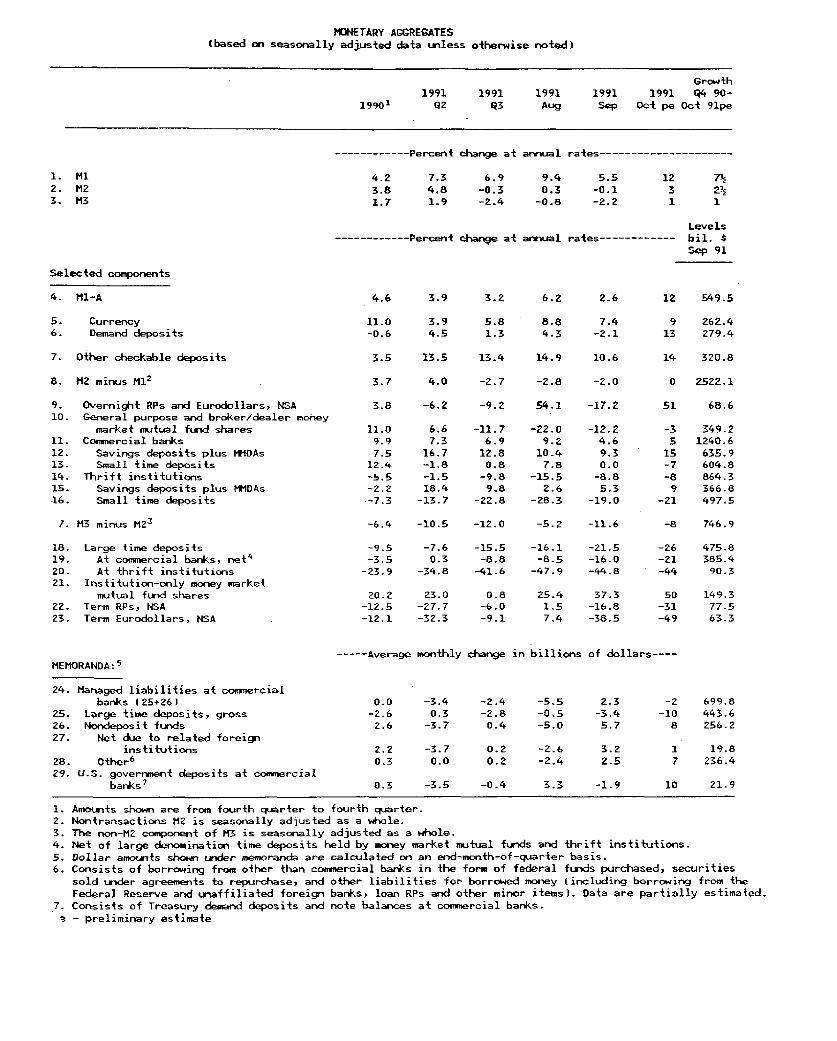
MONETARY AGGREGATES(based on seasonally adjusted data unless otherwise noted)
19919219901
Growth1991 1991 1991 1991 Q4 90-
Q3 Aug Sep Oct pe Oct 91pe
------------ Percent change at annual rates-------------------
4.2 7.3 6.93.8 4.8 -0.31.7 1.9 -2.4
9.4 5.50.3 -0.1
-0.8 -2.2
----------- Percent change at annual rates
Selected components
4. M1-A
5. Currency6. Demand deposits
7. Other checkable deposits
8. M2 minus M12
9. Overnight RPs and Eurodollars, NSA10. General purpose and broker/dealer money
market mutual fund shares11. Commercial banks12. Savings deposits plus MMOAs13. Small time deposits14. Thrift institutions15. Savings deposits plus MMDAs16. Small time deposits
7. M3 minus nM3
18. Large time deposits19. At commercial banks, net'20. At thrift institutions21. Institution-only money market
mutual fund shares22. Term RPs, NSA23. Term Eurodollars, NSA
MEMORANDA:s
24. Managed liabilities at commercialbanks 125+26)
25. Large time deposits, gross26. Nondeposit funds27. Net due to related foreign
institutions28. Other
6
29. U.S. government deposits at commercialbanks
7
4.6 3.9 3.2 6.2
3.9 5.8 8.84.5 1.3 4.3
Levels----------- bil. $
Sep 91
2.6 12 549.5
7.4-2.1
3.5 13.5 13.4 14.9 10.6
3.7 4.0 -2.7 -2.8 -2.0
3.8 -6.2 -9.2 54.1 -17.2
11.09.97.5
12.4-5.5-2.2-7.3
6.67.3
16.7-1.8-1.518.4
-13.7
-11.76.912.8
0.8-9.8
9.8-22.8
-22.09.210.47.8
-15.52.6
-28.3
-12.24.6
9.30.0
-8.85.3
-19.0
-6.4 -10.5 -12.0 -5.2 -11.6
-9.5-3.5
-23.9
-7.6
0.3-34.8
20.2 23.0-12.5 -27.7-12.1 -32.3
-15.5-8.8
-41.6
0.8-6.0-9.1
-16.1-8.5-47.9
25.41.57.4
-21.5-16.0-44.8
37.3-16.8-38.5
9 262.413 279.4
14 320.8
0 2522.1
51 68.6
-3 349.25 1240.6
15 635.9-7 604.8-8 864.3
9 366.8-21 497.5
-8 746.9
-26 475.8-21 385.4-44 90.3
50 149.3-31 77.5-49 63.3
----- Average monthly change in billions of dollars----
0.0 -3.4 -2.4 -5.5-2.6 0.3 -2.8 -0.52.6 -3.7 0.4 -5.0
2,2 -3.7 0.2 -2.6 3.20.3 0.0 0.2 -2.4 2.5
0.3 -3.5 -0.4 3.3 -1.9
699.8443.6256.2
1 19.87 236.4
10 21.9
1. Amounts shown are from fourth quarter to fourth quarter.2. Nontransactions M2 is seasonally adjusted as a whole.3. The non-M2 component of M3 is seasonally adjusted as a whole.4. Net of large denomination time deposits held by money market mutual funds and thrift institutions.5. Dollar amounts shown under memoranda are calculated on an end-month-of-quarter basis.6. Consists of borrowing from other than commercial banks in the form of federal funds purchased, securities
sold under agreements to repurchase, and other liabilities for borrowed money (including borrowing from theFederal Reserve and unaffiliated foreign banks, loan RPs and other minor items). Data are partially estimated.
7. Consists of Treasury demand deposits and note balances at commercial banks.a - preliminary estimate
1. MI2. M23. M3
12 7½3 231 1
_

III-3
subdued, despite a flurry of refinancings recently. In contrast, in
the government sector, Treasury borrowing remains outsized, and
state and local governments continue to issue substantial amounts of
bonds.
Monetary Aggregates and Bank Credit
After showing essentially no change over the preceding two
months, M2 is estimated to have grown at a 3 percent pace in
October, leaving it around the lower bound of its target cone. The
continued weakness in this aggregate likely stems in part from an
ongoing portfolio adjustment, as depositors are reaching for higher
returns and shifting to assets outside of M2. Available data
suggests that the heavy inflows to stock and bond mutual funds
experienced since the spring have continued into the fall.
The more rapid pace of resolution activity by the RTC in recent
months also may have contributed to the weakness in M2. Since the
RTC's inception in August 1989, periods of slow M2 growth have
tended to follow periods of heavy RTC activity (chart). In part,
the slower growth may be a result of acquiring institutions seeking
to reduce their funding costs by substituting purchased thrift core
deposits for higher-cost retail and brokered CDs. Also, some
customers may reevaluate their portfolio positions, including
holdings of deposits and other assets, when long-standing banking
relationships are disrupted. In both cases, RTC actions might be
expected to affect M2 growth with a lag.
With interest rates generally on a downward trend in recent
quarters, the compositional shift within M2 toward liquid retail
deposits and away from small time deposits has continued. The rate
spread between retail CDs and liquid retail deposits narrowed
further (chart)--banks have been especially reluctant to risk
alienating customers by cutting rates on savings deposits--further

III-4
M2 Growth and Measures of RTC Financial Activity$ Billions
Deposits held by RTC-resolved thrifts
Treasury RTC outlays
Monthly change in M2 deposits
ASO NDJ F M A M J J A S O N D J F M A M J J A1989 1990 1991
NOTE: Measures of deposits held by RTC-resolved thrifts and Treasury RTCoutlays are two-month moving averages.
Spreads Between Retail Deposit Rates at Commercial Banks
Monthly
- /
__ I \I Six-month CD rate less NOW ac
/ 1I
-- 1\ I\\ / \ A
A /
Basis Points--- 400
/ \
/
count rate ;
-month re less
Six-month CD rate less MMDA rate \
- I i I I198 19 I 198 198 198 I 89019I
1984 1985 1990 19911986 1987 1988 1989
1111111111111111111111

III-5
encouraging this compositional shift. Savings deposit growth
quickened in October, and the runoff of retail CDs accelerated.
Various reports have suggested that an unusually large chunk of
retail CDs was scheduled to mature in October; however, an informal
survey of regional banks across the country found only modest
evidence corroborating these reports.
The pickup in M2 showed through in a turnaround in M3, which
posted its first monthly increase since May. The gain was only
marginal, however, and this aggregate remains slightly below the
lower bound of its 1991 target cone. The upturn in M3 partly
reflected a larger increase in claims on commercial banks, likely
associated with the strengthening of bank credit growth. It also
owed to a continued rapid rise in institution-only money funds,
which have experienced strong inflows in recent months as investors
have sought to exploit the funds' transitory yield advantage over
declining short-term market rates.
Preliminary data suggest that bank credit grew at an annual
rate of 7 percent in October, marking two straight months of
appreciable growth. Most of the increase occurred in bank holdings
of government securities, including federal agency CMOs, which
expanded at an annual rate of 34 percent. In contrast, total loans
were little changed from September. Business loans increased at a
7 percent pace; as in September, all of the increase occurred at
foreign-related institutions. In September, about one-half of the
increase in this series was the result of one foreign-related
institution rebooking its offshore loans; in October, however, the
increase was widespread among foreign institutions, with only about
1 percentage point reflecting rebookings. C&I loans at domestic
banks have not shown similar strength, but the runoff of these loans
has slowed in recent months. Consumer loans fell at about a
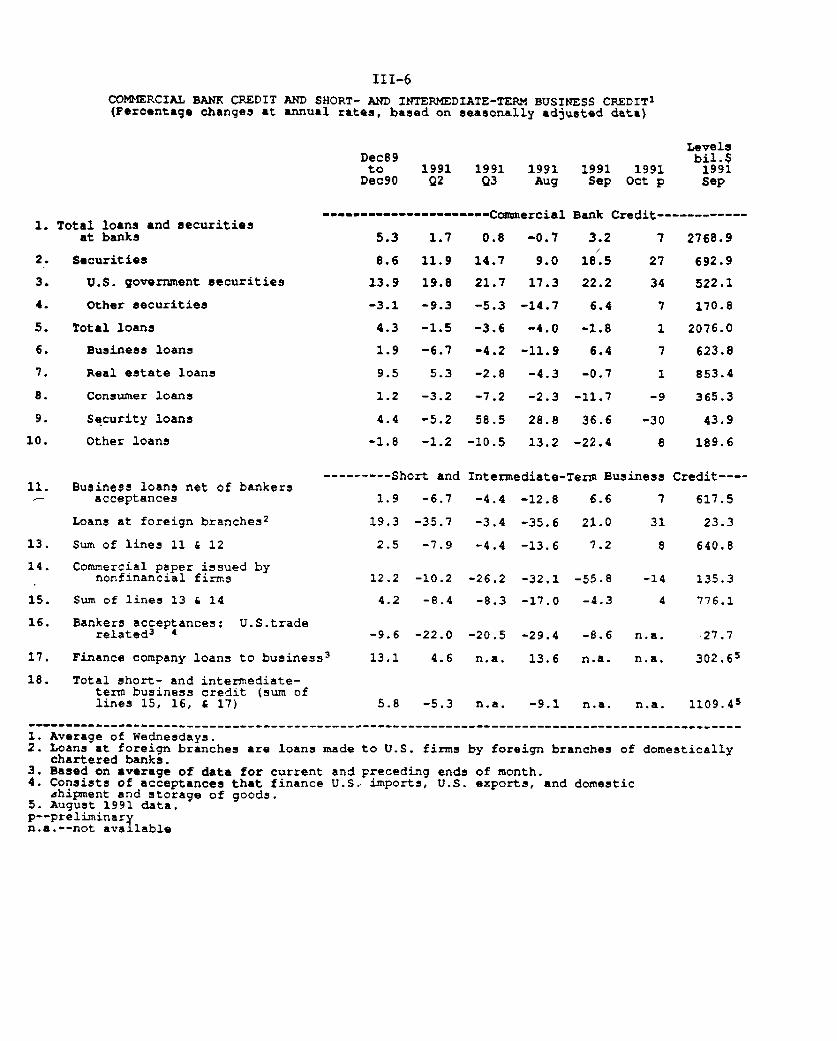
III-6
COMMERCIAL BANK CREDIT AND SHORT- AND INTERMEDIATE-TERM BUSINESS CREDIT 1(Percentage changes at annual rates, based on seasonally adjusted data)
Dec89to
Dec901991 1991 1991 1991 1991Q2 Q3 Aug Sep Oct p
Levelsbil.$1991Sep
1. Total loans and securitiesat banks
2. Securities
3. U.S. government securities
4. Other securities
5. Total loans
6. Business loans
7. Real estate loans
8. Consumer loans
9. Security loans
10. Other loans
------------ ----- Commercial Bank Credit------------
5.3
8.6
13.9
-3.1
4.3
1.9
9.5
1.2
4.4
-1.8
1.7
11.9
19.8
-9.3
-1.5
-6.7
5.3
-3.2
-5.2
-1.2
0.8 -0.7 3.2
14.7
21.7
-5.3
-3.6
-4.2
-2.8
-7.2
58.5
-10.5
9.0
17.3
-14.7
-4.0
-11.9
-4.3
-2.3
28.8
13.2
18.5
22.2
6.4
-1.8
6.4
-0.7
-11.7
36.6
-22.4
7 2768.9
27 692.9
34 522.1
7 170.8
1 2076.0
7 623.8
1 853.4
-9 365.3
-30 43.9
8 189.6
11. Business loans net of bankersS acceptances
Loans at foreign branches 2
13. Sum of lines 11 & 12
14. Commercial paper issued bynonfinancial firms
15. Sum of lines 13 & 14
16. Bankers acceptances: U.S.traderelated 3 4
17. Finance company loans to business 3
18. Total short- and intermediate-term business credit (sum oflines 15, 16, & 17)
-------- Short and
1.9 -6.7
19.3 -35.7
2.5 -7.9
12.2 -10.2 -26.2
4.2 -8.4 -8.3
-9.6
13.1
-22.0
4.6
5.8 -5.3
-20.5
n.a.
Intermediate-Tern Business
-4.4 -12.8 6.6 7
-3.4 -35.6 21.0 31
-4.4 -13.6 7.2 8
-32.1
-17.0
-29.4
13.6
-55.8
-4.3
-8.6
n.a.
n.a. -9.1 n.a.
Credit----
617.5
23.3
640.8
-14 135.3
4 776.1
n.a.
n.a.
27.7
302.65
n.a. 1109.45
1. Average of Wednesdays.2. Loans at foreign branches are loans made to U.S. firms by foreign branches of domestically
chartered banks.3. Based on average of data for current and preceding ends of month.4. Consists of acceptances that finance U.S., imports, U.S. exports, and domestic
shipment and storage of goods.5. August 1991 data.p--preliminaryn.a.--not available

III-7
9 percent pace during the month; excluding the effects of
securitizations, they were down about 3 percent. The recent Senior
Loan Officer Opinion Survey suggests that the demand for bank credit
by businesses and consumers has continued to weaken in recent
months. The survey also indicated that while banks have not
recently changed standards for approving such loans, some banks have
continued to increase the cost of credit lines and to tighten other
terms of lending for businesses.
Business Finance
Borrowing by nonfinancial firms probably strengthened somewhat
in October, as the runoff in commercial paper abated while public
bond issuance remained healthy and bank loans rose. Weakness in
commercial paper issuance primarily reflects substitution into bonds
and medium-term notes, although more favorable pricing of bank loans
reportedly has lured several A-2/P-2 issuers back to banks. In an
attempt to avoid year-end pressures, many commercial paper issuers
are structuring maturities to secure funding past December 31.
Public bond issuance in October by nonfinancial corporations
was strongest in the longer maturities, where, despite heavy
issuance, yield spreads on investment grade bonds have remained
narrow. The favorable conditions for bond issuance currently appear
to extend down at least into the upper ranges of the junk bond
market, where spreads on junk bond indexes have narrowed almost 60
basis points over the last four weeks and are now close to 600 basis
points. Junk bond issuance in October was the largest since June,
although still light compared with that of a few years ago.
On balance, stock prices are slightly above their levels at the
last FOMC meeting, with the DJIA and the NASDAQ index setting new
highs during the intermeeting period. Some sectors, such as the
transportation industry, benefited from stronger-than-expected
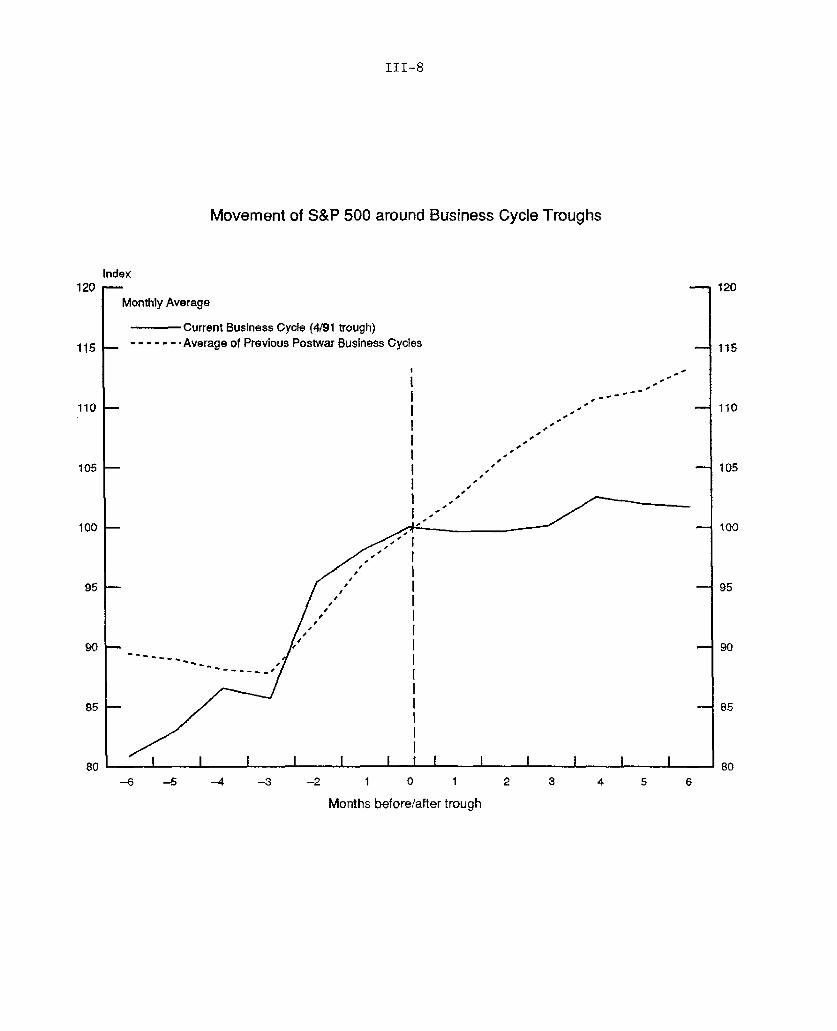
III-8
Movement of S&P 500 around Business Cycle Troughs
x
lonthly Average
Current Business Cycle (4/91 trough)- - - - Average of Previous Postwar Business Cycles
-ft j
t I
ft-itt
----
I 1 1 I I I I I I I I
-6 -5 -4 -3 -2 1 0 1
Months before/after trough
2 3 4 5 6
Inde
K115 I-
110 -
95 "
90
85 I
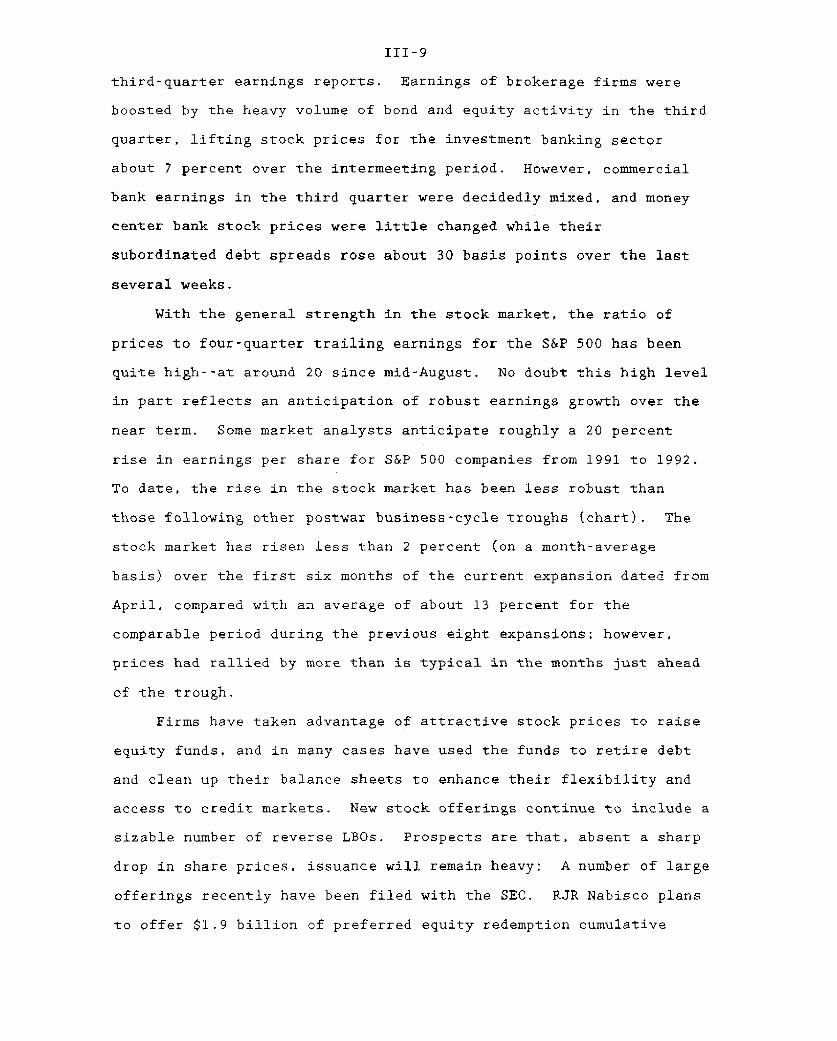
III-9
third-quarter earnings reports. Earnings of brokerage firms were
boosted by the heavy volume of bond and equity activity in the third
quarter, lifting stock prices for the investment banking sector
about 7 percent over the intermeeting period. However, commercial
bank earnings in the third quarter were decidedly mixed, and money
center bank stock prices were little changed while their
subordinated debt spreads rose about 30 basis points over the last
several weeks.
With the general strength in the stock market, the ratio of
prices to four-quarter trailing earnings for the S&P 500 has been
quite high--at around 20 since mid-August. No doubt this high level
in part reflects an anticipation of robust earnings growth over the
near term. Some market analysts anticipate roughly a 20 percent
rise in earnings per share for S&P 500 companies from 1991 to 1992.
To date, the rise in the stock market has been less robust than
those following other postwar business-cycle troughs (chart). The
stock market has risen less than 2 percent (on a month-average
basis) over the first six months of the current expansion dated from
April, compared with an average of about 13 percent for the
comparable period during the previous eight expansions; however,
prices had rallied by more than is typical in the months just ahead
of the trough.
Firms have taken advantage of attractive stock prices to raise
equity funds, and in many cases have used the funds to retire debt
and clean up their balance sheets to enhance their flexibility and
access to credit markets. New stock offerings continue to include a
sizable number of reverse LBOs. Prospects are that, absent a sharp
drop in share prices, issuance will remain heavy: A number of large
offerings recently have been filed with the SEC. RJR Nabisco plans
to offer $1.9 billion of preferred equity redemption cumulative
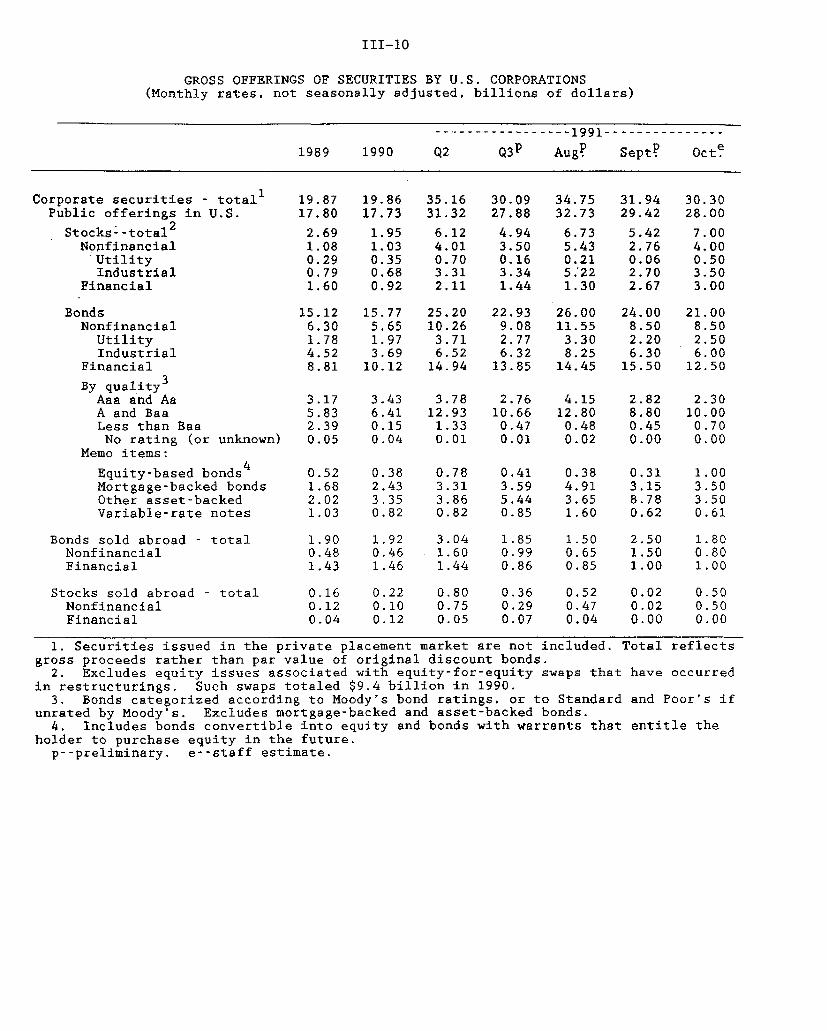
III-10
GROSS OFFERINGS OF SECURITIES BY U.S. CORPORATIONS(Monthly rates, not seasonally adjusted, billions of dollars)
------------------1991 ---------------
1989 1990 Q2 Q3P Aug? Sept? Oct.
Corporate securities - total 1 19.87 19.86 35.16 30.09 34.75 31.94 30.30Public offerings in U.S. 17.80 17.73 31.32 27.88 32.73 29.42 28.00
Stocks--total 2 2.69 1.95 6.12 4.94 6.73 5.42 7.00Nonfinancial 1.08 1.03 4.01 3.50 5.43 2.76 4.00
Utility 0.29 0.35 0.70 0.16 0.21 0.06 0.50Industrial 0.79 0.68 3.31 3.34 5.22 2.70 3.50
Financial 1.60 0.92 2.11 1.44 1.30 2.67 3.00
Bonds 15.12 15.77 25.20 22.93 26.00 24.00 21.00Nonfinancial 6.30 5.65 10.26 9.08 11.55 8.50 8.50
Utility 1.78 1.97 3.71 2.77 3.30 2.20 2.50Industrial 4.52 3.69 6.52 6.32 8.25 6.30 6.00
Financial 8.81 10.12 14.94 13.85 14.45 15.50 12.50
By quality 3
Aaa and Aa 3.17 3.43 3.78 2.76 4.15 2.82 2.30A and Baa 5.83 6.41 12.93 10.66 12.80 8.80 10.00Less than Baa 2.39 0.15 1.33 0.47 0.48 0.45 0.70No rating (or unknown) 0.05 0.04 0.01 0.01 0.02 0.00 0.00
Memo items:
Equity-based bonds 4 0.52 0.38 0.78 0.41 0.38 0.31 1.00Mortgage-backed bonds 1.68 2.43 3.31 3.59 4.91 3.15 3.50Other asset-backed 2.02 3.35 3.86 5.44 3.65 8.78 3.50Variable-rate notes 1.03 0.82 0.82 0.85 1.60 0.62 0.61
Bonds sold abroad - total 1.90 1.92 3.04 1.85 1.50 2.50 1.80Nonfinancial 0.48 0.46 1.60 0.99 0.65 1.50 0.80Financial 1.43 1.46 1.44 0.86 0.85 1.00 1.00
Stocks sold abroad - total 0.16 0.22 0.80 0.36 0.52 0.02 0.50Nonfinancial 0.12 0.10 0.75 0.29 0.47 0.02 0.50Financial 0.04 0.12 0.05 0.07 0.04 0.00 0.00
1. Securities issued in the private placement market are not included. Total reflectsgross proceeds rather than par value of original discount bonds.2. Excludes equity issues associated with equity-for-equity swaps that have occurred
in restructurings. Such swaps totaled $9.4 billion in 1990.3. Bonds categorized according to Moody's bond ratings, or to Standard and Poor's if
unrated by Moody's. Excludes mortgage-backed and asset-backed bonds.4. Includes bonds convertible into equity and bonds with warrants that entitle the
holder to purchase equity in the future.p--preliminary. e--staff estimate.

III-11
stock (PERCS), the proceeds of which will be used to retire
outstanding debt. RJR also has proposed an exchange offer of common
stock for $1.8 billion of 11.5 percent preferred; it hopes this
restructuring will remove its bank loans from the classification of
"highly leveraged transaction" under regulatory guidelines, allowing
it to renegotiate its loans at more favorable rates. Owens-
Illinois, which was taken private in a leveraged buyout in 1987, has
filed to offer almost $1 billion of common stock to retire some of
its outstanding high-yield bonds.
The restructuring of balance sheets by nonfinancial firms has
been reflected in some measures of their financial condition.
According to Moody's, the pace of credit quality deterioration
subsided somewhat in the third quarter. The number of downgrades of
nonfinancial firms dropped significantly, while the number of
upgrades stayed roughly the same as earlier in the year. Many of
the upgrades stemmed from equity issuance or the retirement of
outstanding debt while downgrades continued to be affected by weak
operating earnings.
Among financial firms, downgrades have been driven by the
continued deterioration of commercial real estate holdings. Half of
the downgrades of financial firms in the third quarter were among
insurance companies.
Behind the announcement by Westinghouse Electric Corp. of a
$1.5 billion third-quarter loss were commercial real estate problems
in the portfolio of its finance subsidiary. With a few exceptions,
most other large finance companies appear considerably more
diversified than Westinghouse Credit which at year-end 1990 had
23 percent of its portfolio in commercial real estate and another
42 percent in loans designated as highly leveraged transactions.
Most rating agencies report that they expect other finance companies

III-12
TREASURY AND AGENCY FINANCING 1
(Total for period; billions of dollars)
1991
Q2 Q3 Q4p Oct? Nov. Dec.
Treasury financing
Total surplus/deficit (-)
Means of financing deficit:
Net cash borrowingfrom the public
Marketable borrowings/repayments (-)
BillsCoupons
Nonmarketable
Decrease in the cashbalance
Memo: Cash balanceat end of period
Other
-25.7 -90.3 -107.4
43.1 95.0
38.6-11.7
50.34.5
-11.6
103.543.060.4-8.4
43.5 41.5
-5.8 -6.8
-36.9 -51.0 -19.5
83.8 39.6 24.2 20.0
80.827.153.73.1
38.221.117.11.4
24.24.8
19.4.1
18.41.2
17.21.6
26.0 -7.0 38.4 -5.4
15.5 48.5 10.1 15.5
-2.4 4.3 -11.6 4.9
Federally sponsored creditagencies, net cashborrowing
FHLBsFHLMCFNMAFarm Credit BanksSLMA
-7.1
-6.5-2.6
1.7-.2
.5
5.1
.72.7.9.3.6
1. Data reported on a not seasonally adjusted, payment basis.2. Includes checks issued less checks paid, accrued items and other transactions.3. Excludes mortgage pass-through securities issued by FNMA and FHLMC.p--projected.Note: Details may not add to totals due to rounding.

III-13
to sustain some credit losses, but not of the magnitude experienced
by Westinghouse. Conversations with industry observers indicate
that finance companies have tightened standards owing to economic
weakness. Indeed, some customers turned away by banks reportedly
have had difficulty in obtaining loans from finance companies.
These same sources suggest, however, that finance companies remain
willing to lend to creditworthy borrowers.
Treasury and Sponsored Agency Financing
The staff anticipates a fourth-quarter federal deficit of $107
billion, to be financed by $84 billion of borrowing and a sizable
draw on the government's cash balance. The Treasury has cut back on
the gross sizes of the weekly bill auctions from $21.6 billion to
$20.8 billion in October. On October 9, the Treasury announced
that, for the first time since 1962, it would call a bond issue
before final maturity. On February 15, 1992, it will redeem $1.8
billion of 20-year bonds issued in August 1973. To lock in the
interest savings on the call of the 7-1/2 percent notes, the
Treasury increased the gross size of the October two-year note
auction by $500 million and earmarked about $1 billion of the issue
to hedge the amount of the called bonds held by private investors.
The Treasury's rulemaking authority under the Government
Securities Act of 1986 expired on October 1. The Senate recently
passed legislation that extends the Treasury's authority for one
year and, additionally, makes it illegal to provide false or
inaccurate information in bids at Treasury auctions or in
allocations of securities issued by government sponsored enterprises
(GSEs). A draft bill in the House would extend the Treasury's
authority for five years and allow regulatory agencies to write
sales practice rules. The bill also would increase the authority of

III-14
the Securities and Exchange Commission in the government securities
market.
Following the Salomon Brothers' admission in August that it had
regularly overstated to several GSEs the amount of customer orders
it claimed to have prearranged, many other dealers have admitted
similar practices. In response, the Federal Home Loan Mortgage
Corporation (Freddie Mac) has required those dealers to repay about
$1 million in aggregate as a condition for remaining in the selling
group. Other GSEs are said to be contemplating similar action.
During the intermeeting period, various bills regulating the
GSEs have been moving through Congress. A bill passed by the House
would create an independent bureau in HUD to regulate the safety and
soundness of the Fannie Mae and Freddie Mac, giving the bureau the
authority to request assistance from the Board of Governors in
conducting examinations. A draft bill in the Senate would form a
new three-member Federal Housing Finance Board composed of the
Secretary of the Treasury, the Chairman of the Federal Reserve
Board, and a chairperson appointed by the President. The new board
would have safety and soundness authority over Fannie Mae, Freddie
Mac, and the Federal Home Loan Banks. One of the bills that
establishes minimum capital requirements for the Student Loan
Marketing Association calls for the phased replacement of the
private-sector funded Guaranteed Student Loan Program by a loan
program funded by new Treasury borrowing. The Senate version of a
bill regulating the Farm Credit System puts a Federal Reserve
Governor "familiar with agricultural economics" on the board of
directors of the Farm Credit Administration.

III-15
Municipal Securities
Gross issuance of tax-exempt securities is likely to be down
slightly in October from the pace in September. The only sizable
short-term offering this month has been New York City's $1.25
billion of revenue anticipation notes. The securities were priced
to yield 4.90 percent, down from the 7.80 percent secondary-market
rate on the city's short-term notes in June when the city faced a
near-term crisis caused by the state's inability to adopt a budget.
Despite the drop in yield, the interest rate on the notes is almost
70 basis points above that on high-grade notes.
GROSS OFFERINGS OF MUNICIPAL SECURITIES(Monthly rates, not seasonally adjusted, billions of dollars)
1989 1990 1991
Year Year 01 Q2 Q03 Aug. Sept.P Oct.f
Total offerings 11.90 13.10 11.39 17.51 18.92 23.82 15.35
Total tax-exempt 11.65 12.85 11.25 17.20 18.16 22.14 15.20 14.00Long-term 9.47 10.03 9.81 13.16 13.21 15.74 12.27 12.00Short-term 2.17 2.82 1.44 4.04 4.95 6.40 2.93 2.00
Total taxable .25 .25 .14 .31 .76 1.68 .15
p--preliminary f--forecast.
Long-term volume this month appears to be little changed from
that in September, which was down from the lofty levels seen in late
spring and summer. Thus far in 1991, the volume of long-term
offerings has run at its strongest pace since 1986 and is up more
than 20 percent over the same period in 1990. Refunding volume is
substantially higher this year, reflecting the declines in long-term
municipal bond rates. In addition, a significant portion of the
increase owes to measures adopted by state and local governments to
cope with looming revenue shortfalls. Connecticut and New York have
passed legislation authorizing the issuance of bonds to finance
111-10
their deficits directly. Other states and cities, constrained by
the requirement to balance operating budgets, have shifted
expenditures to capital budgets, where they can be financed by
bonds. Still others have sold assets to tax-exempt agencies that,
in turn, have issued securities to finance the acquisitions.
Finally, to alleviate prospective short-term financing needs,
several states and municipalities have refinanced debt at longer
maturities.
Demand by individuals for tax-exempt securities has been
exceptionally strong, as reflected in the heavy inflows to open-end
municipal bond funds, which through the first nine months of the
year are about 83 percent above those in the same period in 1990.
About half the inflows have been into those funds holding securities
of only one state, which typically give residents of the state the
added exemption of interest income from state and local taxes.
Initial public offerings of closed-end tax-exempt mutual funds have
already exceeded the volume for all of last year by 75 percent.
Changes in long-term debt ratings present a mixed picture of
the overall direction of credit quality in the municipal sector in
the third quarter. At Standard and Poor's, downgradings outstripped
upgradings by a 3-to-1 margin, while upgradings exceeded
downgradings by a 2-to-1 margin at Moody's. One reason for the
discrepancy is the downgrading of New Jersey and Connecticut by
Standard and Poor's, which triggered a large number of similar
rating changes for state agencies. Neither state, however, has been
downgraded by Moody's. Another source of the difference is the
large number of upgrades given by Moody's to single-family housing
bond programs as a result of the favorable performance of the
mortgages supporting the bonds. Officials at both rating agencies,
however, indicate that sectors of previous concern--primarily
III-17
states, several major cities, hospitals, and most housing-related
agencies--remain under stress and have not shown material
improvement.
Mortgage Markets
Interest rates on fixed-rate mortgages have declined to their
lowest levels since 1977, and initial rates on adjustable-rate
mortgages are now at their lowest levels since these loans became
widely available ten years ago (chart). Consequently, the volume of
home mortgage applications has jumped, according to industry data,
press reports, and anecdotal evidence.
While mortgage applications associated with the purchase of
homes have risen, industry sources estimate that as much as one-half
of current mortgage applications represent refinancings. The
Mortgage Bankers Association's index of the volume of refinancing
applications shows a tripling since the end of July, while the
volume of applications for mortgages for home purchases has picked
up only slightly since June (chart).
The surge in applications to refinance old loans suggests that,
as these applications are processed, prepayment rates on outstanding
mortgages may accelerate sharply in the fourth quarter. The actual
timing of prepayments remains somewhat uncertain, however, because
some lenders report that many homeowners are holding their
refinancing applications open in anticipation of further interest
rate declines. Historically, many homeowners wait until mortgage
interest rates reverse direction before rushing to lock in lower
rates.
Unlike some previous refinancing episodes, lenders report that
the current wave of refinancing is characterized by far fewer "cash-
out" refinancings, likely owing to the weakness in real estate
prices. The primary motivating factor in today's market appears to

III-18
Mortgage Commitment Rates (FHLMC Survey), 1971-1991
Weekly A
Percent
Fixed
ARMARM
1973 1976 1979 1982 1985 1988 1991
MBA Indexes of Mortgage Lending ActivityMarch 16, 1990 100
Weeldy Purchase Index (SA)_
II/" III
/ \ /"/ \ /
Refinancing Index (NSA) r I-, /
I \ /
J F M A M J J A S O N D J F M A M J J A S O N1990 1991
fT
1-

III-19
ARM Share of Loans Closed vs. Spread of FRM Rate to ARM Rate
Basis Points Percent
MJ S D M J S D M J S D M J S D M J S D M J S D M J S D M J S1984 1985 1986 1987 1988 1989 1990 1991
MORTGAGE-BACKED(Monthly averages, billions
SECURITY ISSUANCEof dollars, NSA unless noted)
Federally relatedpass-through securities Multiclass securities
Total Fixed- ARM- Private FNMA FHLMC Agency(SA) Rate backed Total issues REMICs REMICS strips
1989 16.5 14.1 2.7 8.4 1.6 3.1 3.2 .31990 19.7 17.2 2.4 11.4 2.4 5.1 3.4 .5
1990-Q2 19.9 16.3 2.2 11.1 3.0 4.7 3.0 .4Q3 18.3 17.4 1.7 12.1 2.7 6.5 2.3 .6Q4 19.0 16.6 4.2 11.0 2.3 4.0 4.5 .3
1991-Q1 16.8 14.0 1.7 9.0 2.1 4.0 2.8 .1Q2 24.7 21.4 1.7 18.6 3.0 8.2 6.8 .5Q3 p 24.5 23.7 2.0 24.4 3.4 11.9 7.1 2.0
1991-Feb. 16.2 14.0 1.2 8.4 1.4 3.2 3.6 0.2Mar. 18.4 15.1 2.9 13.2 3.2 6.3 3.7 0.0Apr. 19.3 16.7 1.2 14.2 2.3 5.9 6.0 0.0May 26.7 21.7 1.1 17.6 2.6 8.1 6.9 0.0June 28.0 25.9 2.8 24.0 4.2 10.6 7.6 1.6July p 23.5 22.5 1.2 19.4 2.7 8.9 6.3 1.6Aug. p 27.1 25.7 2.0 25.8 4.7 12.2 7.5 1.5Sep. p 22.9 22.7 2.6 28.0 2.8 14.6 7.4 3.2
1. Excludes pass-through securities with senior/subordinated structures.p--preliminary

III-20
be rate reduction, with some homeowners also consolidating second
mortgages and home equity loans with their first mortgage. To date,
mortgage lenders evidently have been able to process applications on
schedule and there has been little widening of spreads on FRMs, as
occurred during the surge in refinancing activity in 1986 and 1987.
In addition, trade reports indicate that, despite the current
steepness of the yield curve, many homeowners are refinancing to
convert from adjustable-rate to fixed-rate borrowing. Historically,
adjustable-rate mortgages tend to become more popular as the slope
of the yield curve increases (chart). As demonstrated by the
relatively low proportion of ARM originations in 1991, however, this
relationship is less strong when long-term yields are perceived as
relatively low.
The data that have become available since the last FOMC meeting
suggest that mortgage credit growth remains rather subdued. Real
estate loans at commercial banks remained weak in October.
According to the October Senior Loan Officer Survey, banks have
continued to tighten standards for commercial real estate loans.
However, very few reported tightening standards for mortgage loan
applications from individuals. The survey also indicated that while
the demand for home equity loans was down, demand for other home
mortgage credit was up slightly.
Issuance of agency pass-through securities continued brisk,
likely sustained, at least in part, by the growing popularity of
fixed-rate mortgages and the increased market share of mortgage
bankers, who generally securitize all of their mortgage loans
(table). Issuance of agency multiclass securities in the third
quarter rose to another record, bolstered in part by higher issuance
of interest-only and principal-only stripped mortgage-backed

III-21
securities. The demand for CMOs from commercial banks and
investment companies has remained strong.
Consumer Installment Credit
Consumer installment credit outstanding fell at a 2 percent
annual rate in August (table). This drop marked the eighth decline
in the last nine months and brought outstanding installment credit
to a level 1 percent below its November 1990 peak. A sizable
minority of banks responding to the Senior Loan Officer Survey
reported that demand for consumer installment credit fell in the
three month period ending in October. Most banks indicated no
change in willingness to make such loans with a few indicating
somewhat greater willingness.
As has been the case throughout most of this period, the August
decline in installment credit was led by a sharp drop in automobile
credit, as auto sales have continued to be lackluster. The use by
consumers of alternative financing methods, such as leasing or home
equity loans, also has shaved a little off the growth of auto credit
recently. Revolving credit continued to expand, but all other
installment credit fell again in August. Total consumer credit
(installment plus noninstallment) dropped at a 4-1/2 percent annual
rate in August.
Securitization of consumer loans was strong in the third
quarter, despite investor unease stemming from the first early
amortization of a credit card issue in July as well as concern about
the portfolio quality of some other issues. The third-quarter total
of $11 billion in gross public issuance of securities backed by
consumer loans was second only to the $11.7 billion issued in the
fourth quarter of 1989 (table). On a monthly basis, a record $7
billion in consumer loans was securitized in September--far
surpassing the previous record (chart). Commercial banks, under

III-22
CONSUMER CREDIT(Seasonally adjusted)
Percent change(at annual rate)
199Q 19911 oon
Memo:Outstandings(billions of
_dollars__1~9911991
Al fl9 7 1· tr AnnP
Installment
AutoExcluding auto
RevolvingAll other
Noninstallment
Total
8.8 5.9 2.3 -. 2 -1.4 -1.0
6.910.213.7
7.4
1.39.2
15.24.5
-2.15.2
10.6.6
-1.5.5
1.9-. 7
-5.51.18.6
-6.0
-8.83.85.22.5
-1.0
-4.1.8
2.4.8
-2.1
-8.61.86.2
-2.6
6.0 2.6 -4.9 -6.0 -14.2 -3.3 -30.0 -37.7
7.2 5.8 1.7 -.7 -2.4 -1.2 -3.1 -4.6
1. Growth rates are adjusted for discontinuity in data between December 1988 andJanuary 1989.
r--revised, p--preliminary.Note: Details may not add to totals due to rounding.
CONSUMER INTEREST RATES(Annual percentage rate)
19911989 1990 May June July Aug.
At commercial banksNew cars (48 mo.) 12.07 11.81 11.28 ...... 11.06Personal (24 mo.) 15.44 15.46 15.16 ... ... 15.24Credit cards 18.02 18.17 18.22 ... ... 18.24
2At auto finance cos.
New cars 12.62 12.54 12.95 12.77 12.55 12.40Used cars 16.18 15.99 15.85 15.74' 15.66 15.63
1. Average of "most common" rate charged for specified type and maturity duringthe first week of the mid-month of each quarter.2. Average rate for all loans of each type made during the month regardless of
maturity.
1022 10201
728.7
271.6457.1229.4227.7
53.6
782.2
---------------------- *I GSZQ' - J -I Q > - *J- -' __ ^i ___ «J* - ___ ^ . __ ft f ___
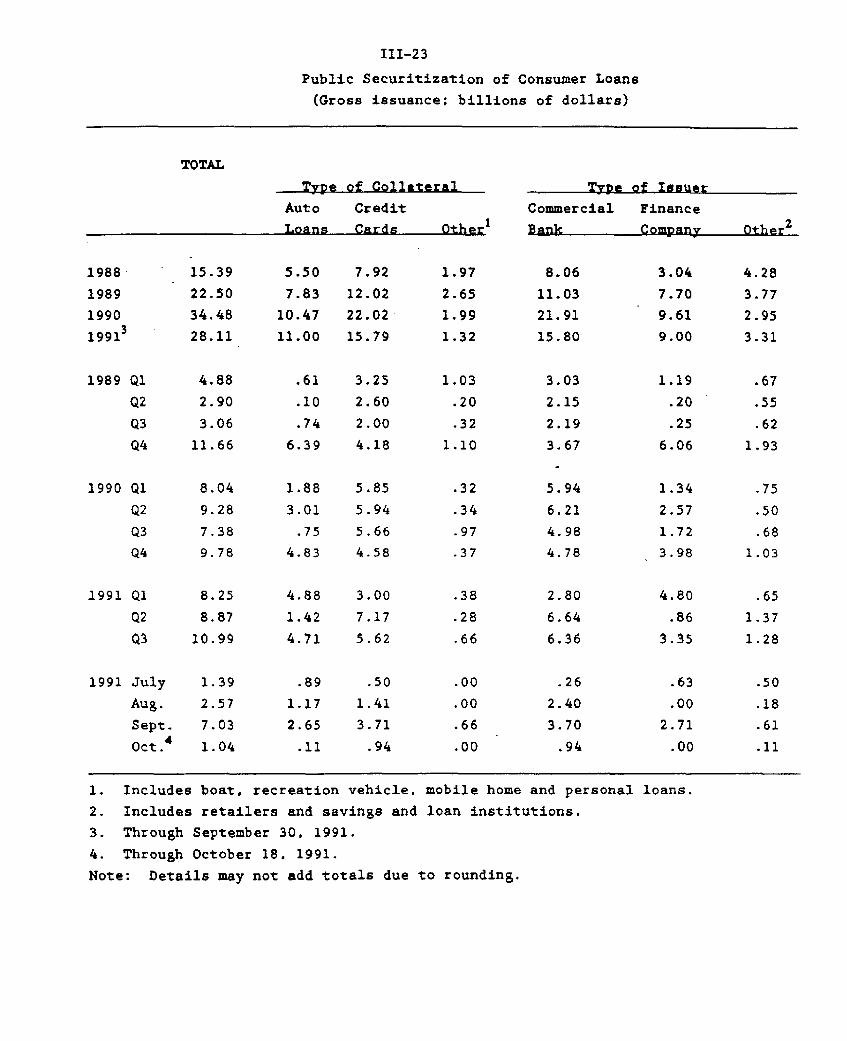
III-23
Public Securitization of Consumer Loans
(Gross issuance; billions of dollars)
TOTAL
Type of Collateral
AutoT.anl
CreditCarA a n+kt 1r
Trpe of Issuer
Commercial Finance
Bank Company Other2
1988
1989
1990
19913
1989 Q1
Q2
Q3
Q4
1990 Q1
Q2
Q3
Q4
1991 Q1
Q2
Q3
1991 July
Aug.
Sept.
Oct.4
15.39
22.50
34.48
28.11
4.88
2.90
3.06
11.66
8.04
9.28
7.38
9.78
8.25
8.87
10.99
1.39
2.57
7.03
1.04
5.50
7.83
10.47
11.00
.61
.10
.74
6.39
1.88
3.01
.754.83
4.88
1.42
4.71
.89
1.17
2.65
.11
7.92
12.02
22.02
15.79
3.25
2.60
2.00
4.18
5.85
5.94
5.66
4.58
3.00
7.17
5.62
.50
1.41
3.71
.94
1.97
2.65
1.99
1.32
1.03
.20
.32
1.10
.32
.34
.97
.37
.38
.28
.66
.00
.00
.66
.00
8.06
11.03
21.91
15.80
3.03
2.15
2.19
3.67
5.94
6.21
4.98
4.78
2.80
6.64
6.36
.26
2.40
3.70
.94
3.04
7.70
9.61
9.00
1.19
.20
.25
6.06
1.34
2.57
1.72
3.98
4.80
.86
3.35
.63
.00
2.71
.00
1. Includes boat, recreation vehicle, mobile home and personal loans.
2. Includes retailers and savings and loan institutions.
3. Through September 30. 1991.
4. Through October 18, 1991.
Note: Details may not add totals due to rounding.
4.28
3.77
2.95
3.31
.67
.55
.62
1.93
.75
.50
.68
1.03
.65
1.37
1.28
.50
.18
.61
.11
~ ""'

III-24
continued pressure from risk-based capital requirements, remained
the largest single institutional issuer of these securities.
Finance companies and retailers also were prominent issuers in the
third quarter. By type of collateral, credit cards again were the
largest component, with auto loans running a close second.
Through the first three weeks of October, there have been two
new issues backed by consumer loans, totaling $1 billion. Market
analysts are looking for gross issuance of as much as $10 billion in
the fourth quarter--somewhat below last year's fourth-quarter
volume. If these expectations are realized, the total volume for
the year would be slightly above the $34.5 billion securitized in
1990 and would bring the total since 1985 to about $130 billion.
Despite the high issuance level of the third quarter, yield spreads
on asset-backed securities have widened only about 10 basis points
since summer.

INTERNATIONAL DEVELOPMENTS

INTERNATIONAL DEVELOPMENTS
Merchandise Trade
The preliminary merchandise trade deficit for August worsened
to $6.8 billion, from a revised July deficit of $5.9 billion. The
August deficit was the largest registered since January of this
year. The deterioration in August reflected a drop-off in export
shipments, while imports were little changed from their high rate in
July.
U.S. MERCHANDISE TRADE: MONTHLY DATA(Billions of dollars, seasonally adjusted, Census basis)
Exports ImportsTotal Ag. NonAg. Total Oil NonOil Balance
(nsa)
1991-Jan 34.1 3.1 31.0 41.5 5.2 36.3 -7.4Feb 33.6 3.4 30.2 39.1 4.1 35.0 -5.5Mar 34.0 3.3 30.7 38.1 3.8 34.3 -4.1
Apr 35.6 3.2 32.5 40.1 4.1 36.1 -4.5May 35.3 3.3 31.9 40.1 4.6 35.4 -4.8Jun 35.0 3.1 31.8 38.8 4.2 34.5 -3.8
Jul 35.2 3.4 31.8 41.2 4.0 37.2 -5.9Aug 34.2 3.2 30.9 40.9 4.6 36.3 -6.8
Source: U.S. Department of Commerce, Bureau of the Census.
Looking at balance-of-payments data for July and August
combined gives a clearer picture of the deterioration in the trade
deficit since the second quarter. The deficit in July-August
worsened $20 billion at an annual rate relative to the second-
quarter average, reversing much of the improvement registered
earlier this year. The worsening of the deficit in July-August was
led by a rebound in the value of non-oil imports, up almost 17
percent at an annual rate relative to the second-quarter average.
At the same time, exports were down slightly in July-August from
their average in the second quarter.
IV-1

IV-2
U.S MERCHANDISE TRADE: QUARTERLY DATABillions of dollars, BOP-basis
Seasonally Adjusted A Memo: Percent ChangeYears 1990 1991 1991: Q3-e from
1989 1990 Q4 Q1 Q2 Q3-e Year Ago Prev. Qtr.
Exports 361 390 402 404 416 414 7 -1
Imports 477 498 513 477 479 496 -1 4Oil 51 62 72 53 52 52 -17 0Non-oil 426 436 441 424 427 444 1 4
Balance -116 -108 -111 -74 -62 -82Ex Oil -65 -46 -39 -21 -11 -30
e--Average of first 2 months of quarter at an annual rate.Source: U.S. Department of Commerce, Bureau of Economic Analysis,
Balance-of-Payments Accounts.
The surge in the value of non-oil imports in July-August was
concentrated entirely in automotive products and consumer goods, as
small declines were registered in other major trade categories.
While all components of the automotive import category rose in July-
August relative to the second quarter, more than half of the
increase was in imports of passenger cars from Canada and other
trading partners, particularly Japan. The increase from Canada
appears to have resulted largely from the increased production by
U.S. subsidiaries, and is consistent with the overall recovery of
U.S. automobile production during the third quarter. The number of
cars imported from Japan (not seasonally adjusted) was unusually low
in the second quarter of this year relative to earlier years,
following a bunching of shipments into the first quarter. The
rebound in these imports during July-August returned them to about
the same rate as registered in the third quarter of 1990. Seasonal
adjustment factors also tended to magnify the swing between the
second quarter and July-August of this year. The substantial rise
in imports of consumer goods during July-August was mostly in

IV-3
MAJOR TRADE CATEGORIES(Billions of dollars, BOP basis, SAAR)
Year 1990 1991 $Change1990 Q3 04 Q1 Q2 Q3-e 03-Q3 Q3-Q2
Total U.S. Exports 389.6 386.6 402.3 403.6 416.4 414 27 -3
Agricultural Export 40.2 39.3 37.8 39.8 38.0 40 1 2Nonagric. Exports 349.3 347.3 364.5 363.8 378.4 373 26 -5
Industrial Suppl. 96.7 95.4 106.0 105.1 101.6 102 6 0Gold 3.0 3.0 4.4 4.1 3.3 4 1 0Fuels 14.0 13.9 18.1 16.8 13.0 13 -1 0Other Ind. Suppl. 79.6 78.6 83.5 84.2 85.4 85 6 0
Capital Goods .153.8 153.1 156.0 155.8 170.5 162 9 -9Aircraft & Parts 32.3 31.6 30.9 30.8 38.9 34 2 -5Computers & Parts 25.9 26.5 26.4 27.3 27.3 26 0 -1Other Machinery 95.6 95.0 98.7 97.7 104.4 102 7 -3
Automotive Product 37.4 38.4 37.1 34.2 40.3 45 6 4To Canada 22.6 23.5 21.5 19.5 22.3 25 2 3To Other 14.8 14.9 15.6 14.7 18.0 19 5 1
Consumer Goods 43.3 42.8 45.8 45.9 44.5 44 1 0Other Nonagric. 18.2 17.6 19.6 22.9 21.5 21 3 0
Total U.S. Imports
Oil ImportsNon-Oil Imports
Industrial Suppl.GoldOther FuelsOther Ind. Suppl.
Capital GoodsAircraft & PartsComputers & PartsOther Machinery
Automotive ProductFrom CanadaFrom Other
Consumer GoodsFoodsAll Other
497.7 501.6 513.2 477.2 478.9 496
62.1 61.8 72.1 52.9 51.6 52435.6 439.8 441.1 424.3 427.3 444
82.52.53.6
76.4
116.410.623.082.8
87.329.756.5
106.226.616.4
83.32.83.5
77.0
116.29.9
23.083-3
90.332.258.1
106.625.8
17.5
83.93.34.3
76.4
120.212.823.384.1
86.127.358.8
106.926.018.1
80.43.33.9
73.2
119.311.224.283.9
82.123.558.5
100.525.616.6
80.83.04.3
73.5
121.112.426.082.7
78.928.550.5
100.328.018.2
813474
121132781
923656
1082616
e--Average of first 2 months of quarter at an annual rate.Source: U.S. Department of Commerce, Bureau of Economic Analysis.
-6 17

IV-4
textiles, apparel, and household and kitchen appliances, and was
consistent with the pickup in personal consumption expenditures.
The value of total exports fell 2 percent at an annual rate in
July-August from the second quarter, as a greater decline in
nonagricultural exports was partially offset by a strong increase in
agricultural shipments from depressed levels in the second quarter.
The increase was mostly in corn, and resulted from credit guarantees
extended to the Soviet Union. The decline in nonagricultural
exports can be traced to the partial reversal of a sharp increase in
exports of aircraft and parts during the second quarter, and to
smaller declines in exports of semiconductors and drilling
equipment. Automotive exports to Canada as well as other
destinations were up somewhat during July-August, but not enough to
offset fully the decline in capital goods.
OIL IMPORTS(BOP basis, value at annual rates)
1991 MonthsQ1 Q2 Q3-e Apr May Jun Jul Aug
Value (Bil. $) 52.88 51.62 51.58 49.03 55.35 50.47 48.26 54.90Price ($/BBL) 20.33 17.32 17.05 17.34 17.58 17.00 16.66 17.43Quantity (mb/d) 7.13 8.16 8.28 7.74 8.62 8.13 7.93 8.62
e--Average of first 2 months of quarter at an annual rate.Source: U.S. Department of Commerce, Bureau of Economic Analysis.
In July-August, the value of oil imports was essentially
unchanged from the second-quarter average, as a rebound in both the
price and quantity of imported oil in August reversed declines in
June and July. The price of imported oil has begun to respond to
the general firming of oil prices that began in June. Given the
pattern of spot, posted, and futures prices between August and mid-
October, import prices are likely to increase through December. The
increase in oil prices is largely attributable to Iraq's apparent

IV-5
refusal to take advantage of the U.N. resolution allowing it to
export limited quantities of oil (with the expenditure of the
revenues controlled in large part by the United Nations). In
addition, there is considerable uncertainty about the availability
of Soviet exports of petroleum and products. The quantity of oil
imports rose in August, according to preliminary Department of
Energy (DOE) data, as stocks continued to be built and consumption
picked up. DOE data for September suggest a roughly 0.3 mb/d
decline in the quantity of imports, the result of a slowdown in
stockbuilding activity.
Prices of Non-oil Imports and Exports
According to data compiled by the Bureau of Labor Statistics
(BLS), prices of non-oil imports continued to decline in the third
quarter at about 3 percent at an annual rate. While prices in all
categories of non-oil imports dropped during the third quarter, the
most significant declines were recorded in industrial supplies and
capital goods. The monthly pattern underlying the third quarter
reveals that prices of non-oil imports edged up in September, the
first monthly increase since early this year.
Export prices also declined in the third quarter, largely
reflecting a drop in agricultural prices of over 8 percent at an
annual rate. Prices of nonagricultural exports fell almost 2
percent at an annual rate, somewhat less than the decline registered
in the second quarter. The pattern of nonagricultural export prices
so far this year has roughly followed the pattern of U.S. producer
prices weighted by their shares in U.S. exports.
U.S. International Financial Transactions
U.S. banks and securities firms reported a $7 billion net
capital outflow in August (line 1 of the Summary Table). The bulk
of this outflow arose from RP transactions between securities firms

IV-6
IMPORT AND EXPORT PRICE MEASURES(percent change from previous period, annual rate)
Year Quarters Months1991-Q3 1991 19911990-03 Q1 02 03 Aug Sep
(Quarterly Average, AR) (Monthly Rates)
------------------BLS Prices-------------------
Imports. TotalFoods, Feeds, Bev.Industrial Supplies
Ind Supp Ex Oil*Capital GoodsAutomotive ProductsConsumer Goods
Memo:OilNon-oil
Exports. TotalFoods, Feeds, Bev.Industrial SuppliesCapital GoodsAutomotive ProductsConsumer Goods
Memo:AgriculturalNonagricultural
Fixed-WeightImports, Total
OilNon-oil
Exports, Total
DeflatorsImports,
Exports,
AgNonag
TotalOilNon-oil
TotalAgNonag
-0.43.1-5.4-2.40.74.20.4
-11.41.0
0.3-2.0-4.03.12.83.3
-2.80.6
-11.97.8
-40.4-0.24.96.62.5
-73.13.7
0.68.3-9.6
5.63.56.0
6.7-0.6
-7.23.1
-19.0-4.5-5.21.2
-4.3
-41.1-2.7
-1.28.1
-11.93.52.06.3
6.6 -8.5-2.6 -1.8
----------- Prices in the GNP Accounts-------------
-0.9-11.90.9
0.7-1.0
1.1
-5.9-12.0-5.5
-2.0-1.0-2.0
-18.3-75.04.0
0.47.8-1.0
-20.8-75.0
-4.7
-5.27.8-6.6
-11.3-47.5-3.7
-0.413.6-2.9
-18.3-47.4-10.7
0.813.60.1
*/ Months not for publication.
-3.4-3.5-6.2-7.2-4.6-1.1-0.6
-4.4-3.2
-2.5-5.8-8.01.52.1
-2.4
0.3-0.10.8-0.80.40.20.1
4.0-0.1
0.45.3-1.0
0.00.00.0
3.2-0.2
0.30.20.0
-0.70.10.40.7
1.50.2
-0.1-1.6-0.4
0.40.00.5
-1.20.1
-1.13.0-1.7
-2.6-11.1-0.8
-4.82.9
-7.0
-6.7-11.1
-6.5

IV-7
in the United States and borrowers in Bermuda. This outflow differs
in nature from the large outflow recorded in the second quarter,
which reflected a shift in funding, especially by foreign-based
banks, away from own foreign offices toward domestic sources. In
September, foreign-based banks turned again to their own foreign
offices as a sources of funds, borrowing $6 billion net, on a
monthly average basis (line 1b of the International Banking Data
table).
Net foreign purchases of U.S. stocks and bonds picked up
further in August to total $5-1/2 billion (lines 2a and 2b of the
Summary table). While Eurobond issuance by U.S. corporations was
down slightly in the month, domestic issuance of both stocks and
bonds was strong. Net foreign purchases of Treasury securities
totaled $2-1/2 billion in the month (line 3). These were more than
accounted for by purchases attributed to the Netherlands Antilles,
indicating little about the residence of the beneficial owners.
U.S. residents continued to acquire foreign securities in August
(line 2c). Most of the $5-1/2 billion in net purchases was in the
form of foreign stocks purchased in Japan, Canada, and the United
Kingdom. Foreign bond issuance in the United States was very light
in August, though it picked up markedly in September.
Foreign official reserves in the United States increased $6-1/2
billion in August (line 4). Increases by Taiwan and the BIS account
for nearly all of the increase. Partial data from FRBNY indicate
little change in official reserves in September.
Eurodollar holdings of U.S. nonbank residents continued to
decline in August and September (line 3, International Banking
table). Since the beginning of the year, declines in this series
have roughly corresponded to increases in domestic large time

IV-8
SUMMARY OF U.S. INTERNATIONAL TRANSACTIONS
(Billions of dollars)
1989 1990 1990
Year Year Q3 Q4
1991
01 02
1991
Jun. Jul. Aug.
Private Capital
Banks
1. Change in net foreign1
positions of banking offices
in the U.S. (+ = inflow)
Securities
2. Private securities2
transactions, net
a) foreign net purchases3
(+) of U.S. corporate bonds
b) foreign net purchases
(+) of U.S. corporate stocks
c) U.S. net purchases (-) of
foreign securities
3. Foreign net purchases (+) of U.S.
Treasury obligations
Official Capital
4. Changes in foreign official
reserves assets in U.S.
(+ = increase)
a) By area
G-10 countries
OPEC
All other countries
b) By type
U.S. Treasury securities4
Other
5. Changes in U.S. official reserve
assets (+ = decrease)
5Other transactions (Quarterly data)
6. U.S. direct investment (-) abroad
7. Foreign direct investment (+) in U.S.6
8. Other capital flows (+ = inflow)
9. U.S. current account balance
10. Statistical discrepancy
MEMO:
U.S. merchandise trade balance -- part
of line 9 (Balance of payments basis,
seasonally adjusted)
27.2 31.0 21.4 -1.4 0.6 -29.9 -7.9 4.3 -7.0
15.7 -29.2 -4.3 -7.8 -5.0 2.1 -0.2 -0.9 -0.2
31.8 16.2 -0.4 6.3 3.5 7.6 3.5 1.9 3.8
7.9 -13.7 -2.2 -5.0 1.8 7.7 1.4 1.0 1.6
24.0 -31.7 -1.7 -9.0 -10.3 -13.2 -5.1 -3.9 -5.5
30.1 -0.5 0.3 -2.8 4.2 13.6 0.8 0.7 2.6
8.3 32.0 14.3 18.9 5.5 -3.5 -4.5 3.3 6.5
-5.2 10.0
10.1 1.2
3.4 20.8
8.6 8.6 -12.1
-1.4 -0.5 0.3
7.1 10.8 17.3
12.3 19.7 2.4
2.0 -0.8 3.1
-4.7
-2.9
4.1
-2.3
-1.2
-0.9 -0.8 1.5
-0.8 * -2.8
-2.8 4.1 7.9
-3.7 0.9 2.3
-0.8 2,4 4.3
-25.3 -2.2 1.7 -1.1 -0.4 1.4 1.8 1.5 1.3
-33.4
70.6
-5.3
-106.3
18.4
-33.4
37.2
-6.3
-92.1
63.5
115.9 -108.1
-17.8
7.1
-0.3
-23.9
1.5
-3.8
4.5
-2.2
-23.4
19.1
-11.9
4.3
1.0
10.5
-8.8
-28.8 -27.7 -18.4 -15.6 n-a. n.a. n.a.
1. Includes changes in positions of all depository institutions, bank-holding companies, and certain transactions between
brokers/dealers and unaffiliated foreigners (particularly borrowing and Lending under repurchase agreements.)
2. These data have not been adjusted to exclude commissions on securities transactions and, therefore, do not match
exactly the data on U.S. international transactions as published by the Department of Commerce.
3. Includes all U.S. bonds other than Treasury obligations.
4. Includes deposits in banks, commercial paper, acceptances, borrowing under repurchase agreements, and other securities.
, Seasonally adjusted,
S. Includes U.S. government assets other than official reserves, transactions by nonbanking concerns, and other banking ana
official transactions not shown elsewhere. In addition, it includes amounts resulting from adjustments to the data made by
the Department of Commerce and revisions to the data in lines 1 through 5 since publication of the quarterly data in the
Survey of Current Business.
*--Less than $50 million.
NOTE: Details may not add to total because of rounding.
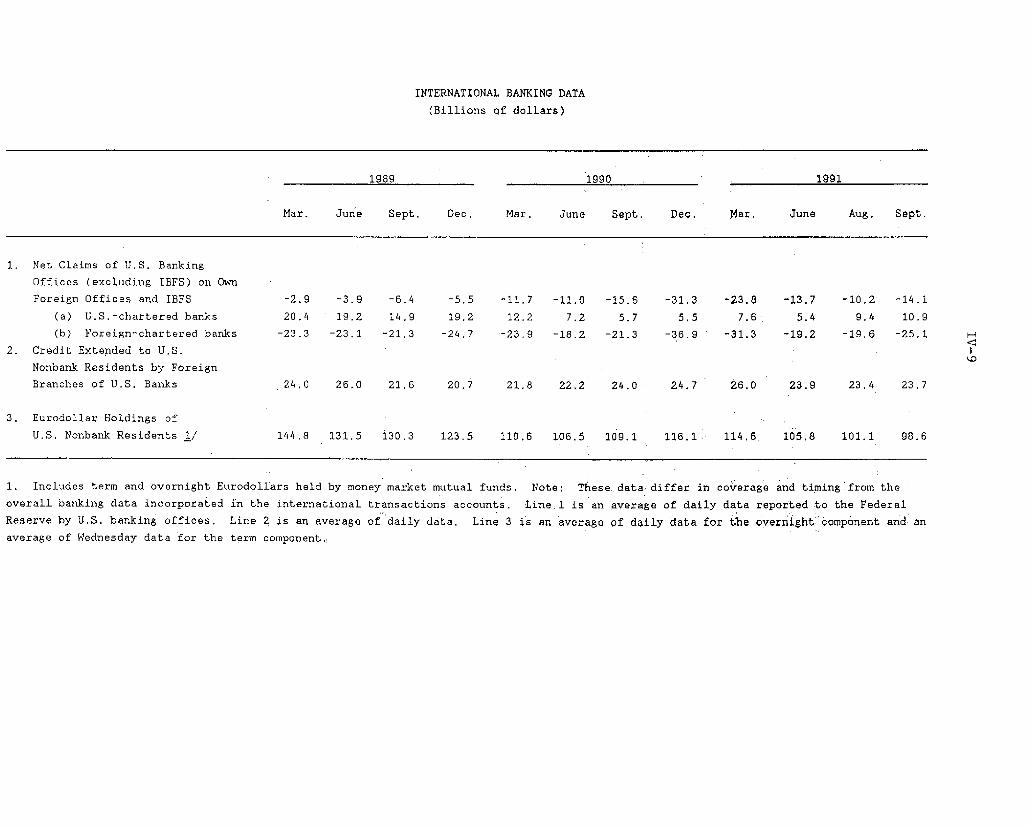
INTERNATIONAL BANKING DATA
(Billions of dollars)
1989 1990 . 1991
Mar. June Sept. Dec. Mar. June Sept. Dec. Mar. June Aug. Sept.
1. Net Claims of U.S. Banking
Offices (excluding IBFS) on Own
Foreign Offices and IBFS -2.9 -3.9 -6.4 -5.5 -11.7 -11.0 -15.6 -31.3 -23.8 -13.7 -10.2 -14.1
(a) U.S.-chartered banks 20.4 19.2 14.9 19.2 12.2 7.2 5.7 5.5 7.6 5.4 9.4 10.9
(b) Foreign-chartered banks -23.3 -23.1 -21.3 -24.7 -23.9 -18.2 -21.3 -36.9 -31.3 -19,2 -19.6 -25.1
2. Credit Extended to U.S.
Nonbank Residents by Foreign
Branches of U.S. Banks 24.0 26.0 21.6 20.7 21.8 22.2 24.0 24.7 26.0 23.9 23.4 23.7
3. Eurodollar Holdings of
U.S. Nonbank Residents 1/ 144.8 131.5 130.3 123.5 110.6 106.5 109.1 116.1 114.6 105.8 101.1 98.6
1. Includes term and overnight Eurodollars held by money market mutual funds. Note: These data differ in coverage and timing'from the
overall banking data incorporated
Reserve by U.S. banking offices,
average of Wednesday data for the
in the international transactions accounts. Line.1 is an average of daily data reported to the Federal
Line 2 is an average of daily data, Line 3 is an average of daily data for the overnight component and an
term component.

IV-10
deposits issued by agencies and branches of foreign banks. These
large time deposits rose markedly in September but ran off some in
the first part of October.
Foreign Exchange Markets
The weighted-average foreign-exchange value of the dollar, in
terms of the other G-10 currencies, is about unchanged, on balance,
since the October FOMC meeting, as shown in the accompanying chart.
Throughout much of the intermeeting period, the dollar was supported
by the belief that the expected easing in U.S. monetary policy had
been postponed, in light of proposals to cut U.S. taxes and less-
than-expected progress on reducing U.S. consumer price inflation.
The dollar retreated somewhat late in the period amid evidence that
the U.S. economic recovery may be sluggish.
The dollar has risen more than 1/4 percent against the mark
since the last FOMC meeting. The mark was weakened by concern that
events in the former Soviet Union are moving out of control and that
the government may default on its foreign debt, much of which is
owned or guaranteed by the German government. Concern over high
German wage settlements also may have hurt the mark.
The dollar has declined more than 1-1/2 percent, on balance,
against the Japanese yen. Early in the intermeeting period, the yen
strengthened in response to increased focus on the growing Japanese
trade surplus and expectations that the G-7 meeting in Bangkok would
result in a concerted effort to strengthen the yen in order to
reduce the Japanese trade imbalance. More recently, the yen has
given up some of its gains, amid speculation that the Bank of Japan
will soon cut its official discount rate. That speculation was
fueled by a further slowing of growth in the targeted Japanese
monetary aggregate, M2+CDs, to 2.2 percent year-on-year in
September.

IV-11
WEIGHTED AVERAGE EXCHANGE VALUE OF THE DOLLARMarch 1973 = 100
FOMC
lct. 1
July August September October
SELECTED DOLLAR EXCHANGE RATESJuly 1 = 100
Daily
FOMCOct. 1
Japanese Yen
lb./\
German Mark
August September October
IV-12
The Canadian dollar rose 3/4 percent against the U.S. dollar
over the intermeeting period, reaching 13-year highs, amid reduced
expectations of inflation in Canada. The Canadian dollar's strength
occurred despite a decline in Canada-U.S. interest differentials,
which still remain high relative to historical interest
differentials. Within the EMS, the French franc eased slightly
against the mark. The Bank of France reduced its money market
intervention rate 1/4 percentage point.
Long-term interest differentials moved slightly in favor of the
dollar, as the U.S. 10-year bond yield rose, on balance, while
German and Japanese bond yields were little changed. The 17 basis
point decline in Japanese 3-month interest rates mostly matched the
net decline in U.S. 3-month rates, while German 3-month rates firmed
15 basis points. The price of gold rose about $6 (to $360 per
ounce) since the last FOMC meeting, as reports that Soviet gold
reserves are smaller than previously estimated reduced expectations
of Soviet gold sales.
The Desk
did not intervene.
Developments in Foreign Industrial Countries
Recent indicators of economic activity in foreign industrial
countries suggest a continued weak pace of growth in the third
quarter, little changed from the previous quarter. In the latest
month for which data are available, industrial production declined
in western Germany, Italy, and the United Kingdom, but rose in
Japan, Canada, and France. However, in countries where production
advanced, other indicators were mixed. Unemployment rates continued
to rise in the United Kingdom and France, while they remained
relatively high in Canada, Italy and eastern Germany.

IV-13
Corresponding to sluggish economic activity has been the recent
slowdown in growth of broad monetary aggregates in Japan, the United
Kingdom, and Canada. In the twelve months ending in September,
Japanese M2+CDs grew only 2.2 percent, the lowest year/year rate
since the series began in 1981. Growth of U.K. M4 is at its lowest
rate in the past two decades. Canadian M3 growth slowed to a
year/year rate of 5.8 percent in September, the slowest pace in five
years. In contrast, growth of pan-German M3 has edged up towards
the top of its 3-5 percent target range, while Italian money growth
continues to exceed its 5-8 percent target range.
The trend towards lower inflation abroad continued in recent
months. Rates of inflation have declined as last year's oil price
increases have fallen out of the 12-month calculations, but in most
of these countries underlying inflation appears to have moderated as
well.
Individual country notes. In Japan, most recent indicators
suggest that the pace of activity has remained weak. Industrial
production (s.a.) increased 0.2 percent in September, but the third-
quarter average was only 0.2 percent above the average level in the
second quarter. New machinery orders (s.a.) increased 8.8 percent
in August but were still 3.4 percent below their average level in
the second quarter. Housing starts (s.a.) declined 6.1 percent in
August, to a level nearly 7 percent below their second-quarter
level. New car registrations (s.a.) dropped 12.5 percent in
September and their average level in the third quarter was down
slightly from the previous quarter. In September, corporate
bankruptcies (s.a.) declined by 5.2 percent but were 4.7 percent
higher than they were in the second quarter. In August, the index
of leading indicators (s.a.) continued to point to weakness.
Despite these signs of weakness, labor markets and industrial

REAL GNP AND INDUSTRIAL PRODUCTION IN MAJOR INDUSTRIAL COUNTRIES(Percentage change from previous period, seasonally adjusted) 1
Q4/Q4 Q4/Q41989 1990
1990
Q4
1991-----------------
1991
Q1 Q2 03 May June July Aug. Sept.Latest 3 months
from year ago 2
Canada
GDPIP
France
GDPIP
West Germany
GNPIP
United Kingdom
GDPIP
United States
GNPIP
2.1 -1.1-1.1 -6.3
3.9 1.92.8 -. 3
3.2 5.34.8 5.4
2.9 1.33.2 -3.8
4.8 4.84.2 6.9
1 .3 -. 7.3 -3.4
-1.2 -1.2 1.2 n.a,-3.3 -2.2 1.6 n.a.
-.1 .2 .7 n.a.-2.7 .3 1.3 n.a.
.6 2.4 -.6 n.a.
.4 2.0 -.1 n.a.
.2 .2 .3 n.a.-2.0 .4 -2.1 n.a.
.6 2.7 .5 n.a.1.7 -. 1 -.7 n.a.
-.2 -.8 -.6 n.a.-1.8 -.3 -1.2 n.a.
1.8 .5 -.4 -.7 -. 1 .61.1 .3 -1.8 -2.5 .6 1.5
X X x X X
.7 .4 .5 n.a. n.a.
x x X X x-.4 .2 .8 .0 n.a.
X x X-1.0 3.8 -1.4 -2.1 n.a.
x X X X x
1.3 5.6 -3.8 -1.7 n.a.
x x x x K2.0 -2.8 3.2 -2.5 .2
x x x X-.4 3.0 .1 -1.5 n.a.
9 . .6 -. ..9 .8 .6 -. 0 .1
1. Asterisk indicates that monthly data are not .available.2. For quarterly data, latest quarter from year ago.
-1.5-4.5
4.33.8
1.4-2.0
5.01 .1
-3.7-3.4
-.7-2.2
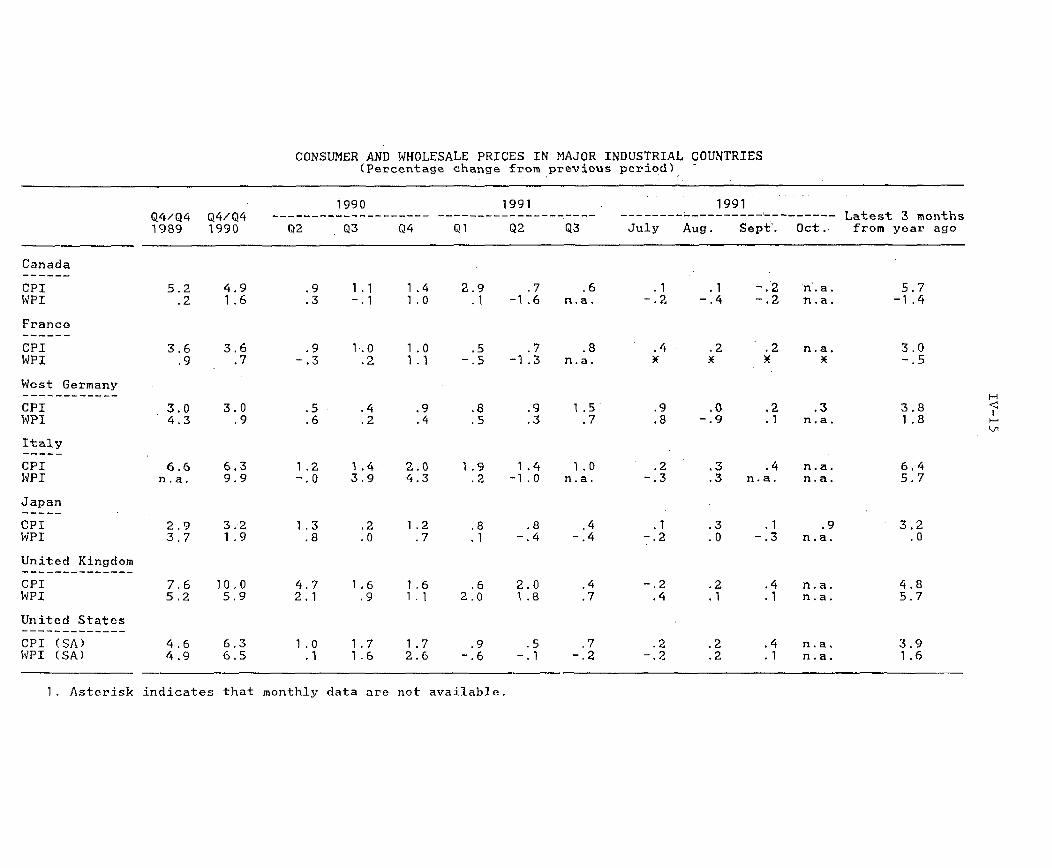
CONSUMER AND WHOLESALE PRICES IN MAJOR INDUSTRIAL COUNTRIES(Percentage change from previous period)
Q4/Q4 Q4/Q41989 1990
1990 1991 1991-------------------- ---------------- ------------------------- Latest 3 months
Q2 Q3 Q4 Q1 Q2 Q3 July Aug. Sept'. Oct. from year ago
5.2 4.9.2 1.6
3.6 3.6.9 .7
.9 1.1 1.4
.3 -. 1 1.0
1.0 1 .0.2 1.1
2.9.1
.7-1.6
.5 .7-. 5 -1.3
.6n.a.
.8n.a.
. 1 .1 -. 2 n.a.-.2 -.4 -.2 n.a.
.4 .2 .2 n.a.X x X x
West Germany
CPIWPI
3.04.3
3.0.9
.5 .4 .9 .8 .9 1.5
.6 .2 .4 .5 .3 .7
United Kingdom
CPIWPI
United States
CPI (SA)WPI (SA)
6.6 6.3n.a. 9.9
2.9 3.23.7 1.9
7.6 10.05.2 5.9
4.6 6.34.9 6.5
1.2 1.4 2.0-.0 3.9 4.3
,2 1.2.0 .7
4.7 1.6 1.62.1 .9 1 1
1.0 1.7 1.7.1 1.6 2.6
1.9 1.4 1.0.2 -1.0 n.a.
.8 .8
.1 -. 4
.6 2.02.0 1.8
.9-. 6
.3 .4 n.a.
.3 n.a. n.a.
.3 .1 .9
.0 -. 3 n.a.
.2 .4 n.a.
.1 .1 n.a.
.2 .4 n.a.
.2 .1 n.a.
indicates that monthly data are not available.
5.7-1.4
.9 .0
.8 -. 9.2 .3.1 n.a.
6.45.7
3.2.0
4.85.7
1, Asterisk
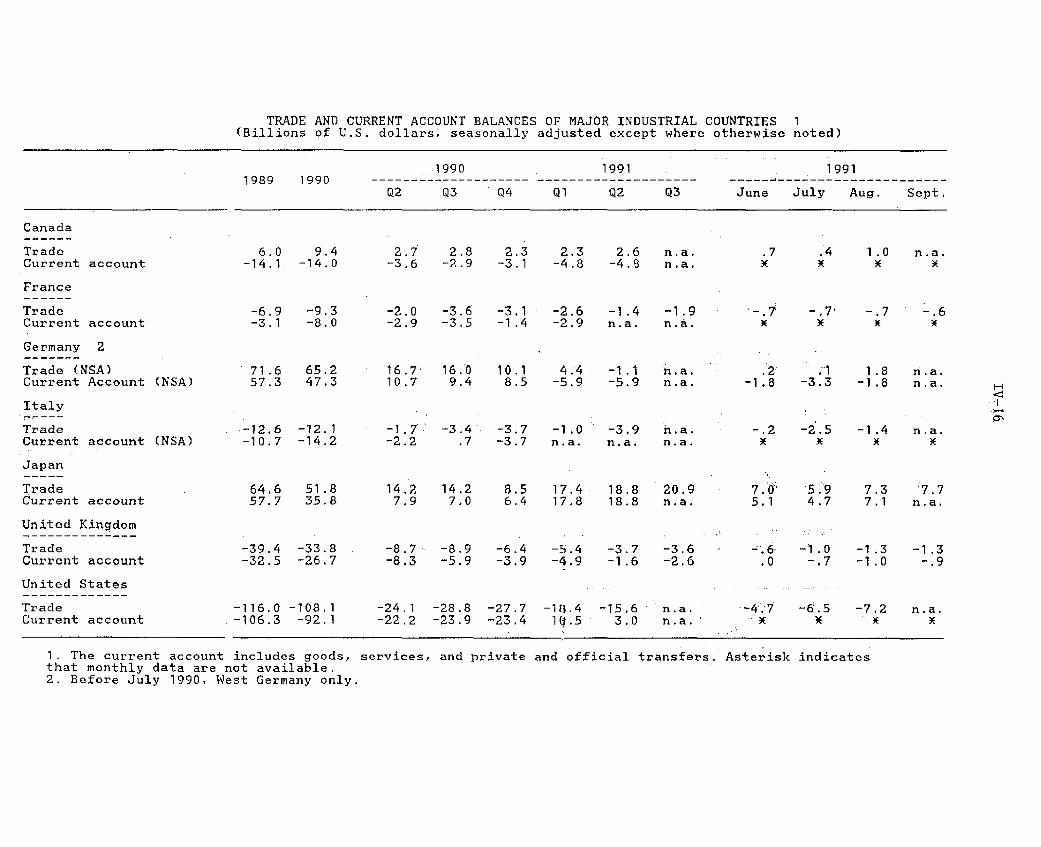
TRADE AND CURRENT ACCOUNT BALANCES OF MAJOR INDUSTRIAL COUNTRIES 1(Billions of U.S. dollars, seasonally adjusted except where otherwise noted)
1989 19901990 1991
Q2 -3 Q-4 Q1 Q2 Q3Q2 Q3 .Q4 Q1 Q2 Q3
1991
June July Aug. Sept,June July Aug.. Sept.
Canada
TradeCurrent account
France
TradeCurrent account
Germany 2
Trade (NSA)Current Account
Italy
TradeCurrent account
(NSA)
(NSA)
Japan
TradeCurrent account
United Kingdom
TradeCurrent account
United States
TradeCurrent account
6.0 9.4-14.1. -14.0
-6.9 -9.3-3.1 -8.0
S71.6 65.257.3 47.3
-12.6 -72.1-10.7 -14.2
64.6 51.857.7 35.8
-39.4 -33.8-32.5 -26.7
-116.0 -108.1-106.3 -92.1
2.7 2.8 2.3 2.3 2.6 n.a. .7-3.6 -2.9 -3.1 -4.8 -4.3 n.a.
-2.0 -3.6 -3.1 -2.6 -1.4 -1.9 '-.7-2.9 -3.5 -1.4 -2.9 n.a. n.a.
16.7 16.0 10.1 4.4 -1.1 n.a. .210.7 9.4 8.5 -5.9 -5.9 n.a. -1.8
-1.7 -3.4 -3.7 -1.0 -3.9 n.a. -.2-2.2 .7 -3.7 n.a. n.a. n.a. x
14.2 14.2 8.5 17.4 18.8 20.9 7.07.9 7.0 6.4 17.8 18.8 n.a. 5.1
-8.7 -8.9 -6.4 -5.4 -3.7 -3.6 -.6-8.3 -5.9 -3.9 -4.9 -1.6 -2.6 .0
-24.1 -28.8 -27.7 -186.4 -15.6 n.a. -4.7-22.2 -23.9 -23.4 10.5 3.0 n.a.
.4 1.0 n.a.X X X
-. 73
-. 7 -. 6Wx
.1 1.8 n.a.-3.3 -1.8 n.a.
-2.5 -1.4K x
n.a.X
5.9 7.3 7.74.7 7.1 n.a.
-1.0 -1.3 -1.3-. 7 -1 .0 -. 9
-6.5 -7,2 n.a.X X X
1. The current account includes goods,that monthly data are not available.2. Before July 1990, West Germany only.
services, and private and official transfers. Asterisk indicates
i
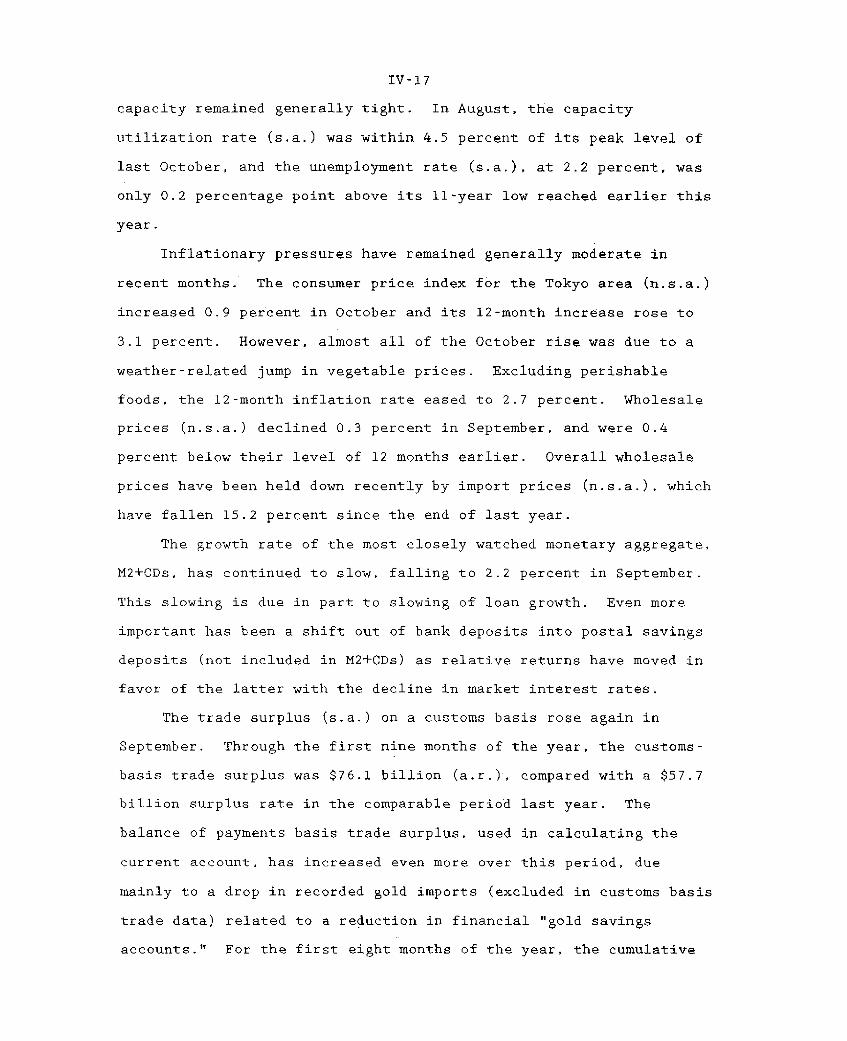
IV-17
capacity remained generally tight. In August, the capacity
utilization rate (s.a.) was within 4.5 percent of its peak level of
last October, and the unemployment rate (s.a.), at 2.2 percent, was
only 0.2 percentage point above its 11-year low reached earlier this
year.
Inflationary pressures have remained generally moderate in
recent months. The consumer price index for the Tokyo area (n.s.a.)
increased 0.9 percent in October and its 12-month increase rose to
3.1 percent. However, almost all of the October rise was due to a
weather-related jump in vegetable prices. Excluding perishable
foods, the 12-month inflation rate eased to 2.7 percent. Wholesale
prices (n.s.a.) declined 0.3 percent in September, and were 0.4
percent below their level of 12 months earlier. Overall wholesale
prices have been held down recently by import prices (n.s.a.), which
have fallen 15.2 percent since the end of last year.
The growth rate of the most closely watched monetary aggregate,
M2+CDs, has continued to slow, falling to 2.2 percent in September.
This slowing is due in part to slowing of loan growth. Even more
important has been a shift out of bank deposits into postal savings
deposits (not included in M2+CDs) as relative returns have moved in
favor of the latter with the decline in market interest rates.
The trade surplus (s.a.) on a customs basis rose again in
September. Through the first nine months of the year, the customs-
basis trade surplus was $76.1 billion (a.r.), compared with a $57.7
billion surplus rate in the comparable period last year. The
balance of payments basis trade surplus, used in calculating the
current account, has increased even more over this period, due
mainly to a drop in recorded gold imports (excluded in customs basis
trade data) related to a reduction in financial "gold savings
accounts." For the first eight months of the year, the cumulative

IV-18
current account surplus was $72.5 billion (a.r.), well above the
$40.6 billion surplus rate in the same period last year.
Industrial production in western Germany (s.a.) fell 2.1
percent in August, after falling 1.4 percent in July. The average
level of industrial production for July and August was 0.4 percent
below the average level for the second quarter. The volume of new
orders for west German manufactured goods (s.a.) increased 1.1
percent in August, after falling slightly in July. New orders have
increased by more than 1 percent in three of the last four months,
and August's level was 4.3 percent above where it was in April.
Since March, domestic orders (including orders from eastern Germany)
have fallen 0.6 percent, while foreign orders have increased 5.7
percent. In August the volume of retail sales (s.a.) in western
Germany fell 4.1 percent after falling 1.3 percent in July, and the
average level of retail sales for the two months was 2 percent below
the average level in the second quarter.
Industrial production in eastern Germany (n.s.a.) increased 7
percent between April and June. New orders for east German
manufactured goods also increased sharply in June. Official east
German unemployment (n.s.a.) fell in September to 11.6 percent. New
construction orders in eastern Germany (n.s.a.) have increased
steadily since February, and June's level was 61 percent above the
average level for the second half of 1990.
Inflation has moderated since August after sharp increases in
June and July. West German consumer prices (n.s.a.) increased 0.3
percent in October and on a year/year basis consumer price inflation
fell to 3.5 percent, down from 4.4 percent in July, when new excise
taxes on energy were introduced. Excluding energy products, west
German consumer prices (s.a.) increased 0.2 percent in September,
resulting in an annual rate of inflation of 4.1 percent for the

IV-19
first nine months of the year. In August west German producer
prices (n.s.a.) were 2.6 percent above the level a year ago. There
are continuing concerns about wage pressures. West German unions
are demanding wage increases of 10 percent for 1992 compared with
increases of 6 percent in 1990 and 7 percent in 1991.
Through September, M3 (s.a.) in western and eastern Germany had
increased at an annual rate of 4.6 percent in 1991, relative to the
fourth quarter of 1990, up from an annual rate of 3.7 percent
through July.
The combined German trade balance (s.a.) moved from deficit
into surplus this summer, resulting in a July-August surplus of $13
billion (a.r.) compared with a second-quarter deficit of $2 billion.
The cumulative trade surplus for the first eight months of the year
is $10 billion (a.r.). The combined German current account (n.s.a.)
improved in August to a deficit of $22 billion (a.r.), compared with
a deficit rate of $39 billion in July. The cumulative current
account deficit through August is $17 billion including $8 billion
of transfers associated with Gulf War payments.
The strength registered by second-quarter French GDP, which
rose 2.8 percent (s.a.a.r.) after growing 0.8 percent in the first
quarter, has shown signs of continuing. The July-August average
level of industrial production rose 0.8 percent (s.a.) largely
because of strong growth in production of consumption goods, but the
average remained below its year-earlier level. Other indicators
were mixed. The unemployment rate (s.a.) rose slightly in September
to 9.6 percent. Retail sales rose during the summer. However,
after declining in August, household consumption of manufactured
products (s.a.) fell again in September to its lowest level this
year.
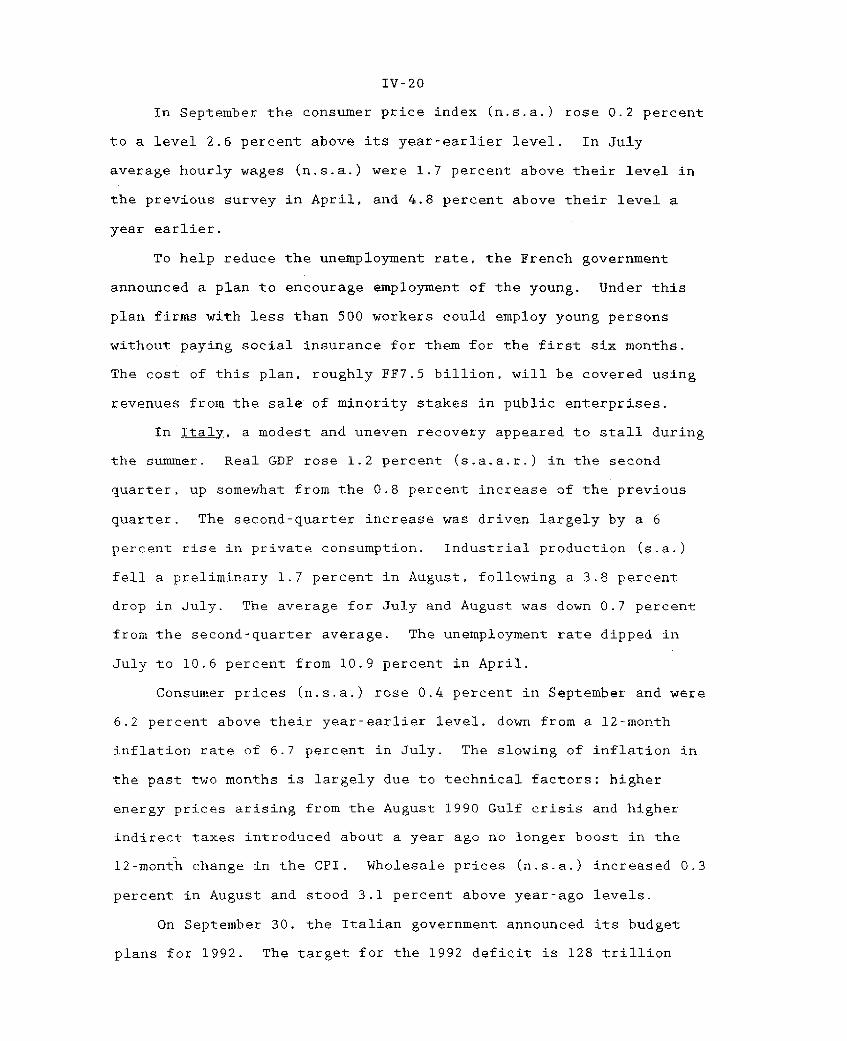
IV-20
In September the consumer price index (n.s.a.) rose 0.2 percent
to a level 2.6 percent above its year-earlier level. In July
average hourly wages (n.s.a.) were 1.7 percent above their level in
the previous survey in April, and 4.8 percent above their level a
year earlier.
To help reduce the unemployment rate, the French government
announced a plan to encourage employment of the young. Under this
plan firms with less than 500 workers could employ young persons
without paying social insurance for them for the first six months.
The cost of this plan, roughly FF7.5 billion, will be covered using
revenues from the sale of minority stakes in public enterprises.
In Italy, a modest and uneven recovery appeared to stall during
the summer. Real GDP rose 1.2 percent (s.a.a.r.) in the second
quarter, up somewhat from the 0.8 percent increase of the previous
quarter. The second-quarter increase was driven largely by a 6
percent rise in private consumption. Industrial production (s.a.)
fell a preliminary 1.7 percent in August, following a 3.8 percent
drop in July. The average for July and August was down 0.7 percent
from the second-quarter average. The unemployment rate dipped in
July to 10.6 percent from 10.9 percent in April.
Consumer prices (n.s.a.) rose 0.4 percent in September and were
6.2 percent above their year-earlier level, down from a 12-month
inflation rate of 6.7 percent in July. The slowing of inflation in
the past two months is largely due to technical factors; higher
energy prices arising from the August 1990 Gulf crisis and higher
indirect taxes introduced about a year ago no longer boost in the
12-month change in the CPI. Wholesale prices (n.s.a.) increased 0.3
percent in August and stood 3.1 percent above year-ago levels.
On September 30, the Italian government announced its budget
plans for 1992. The target for the 1992 deficit is 128 trillion
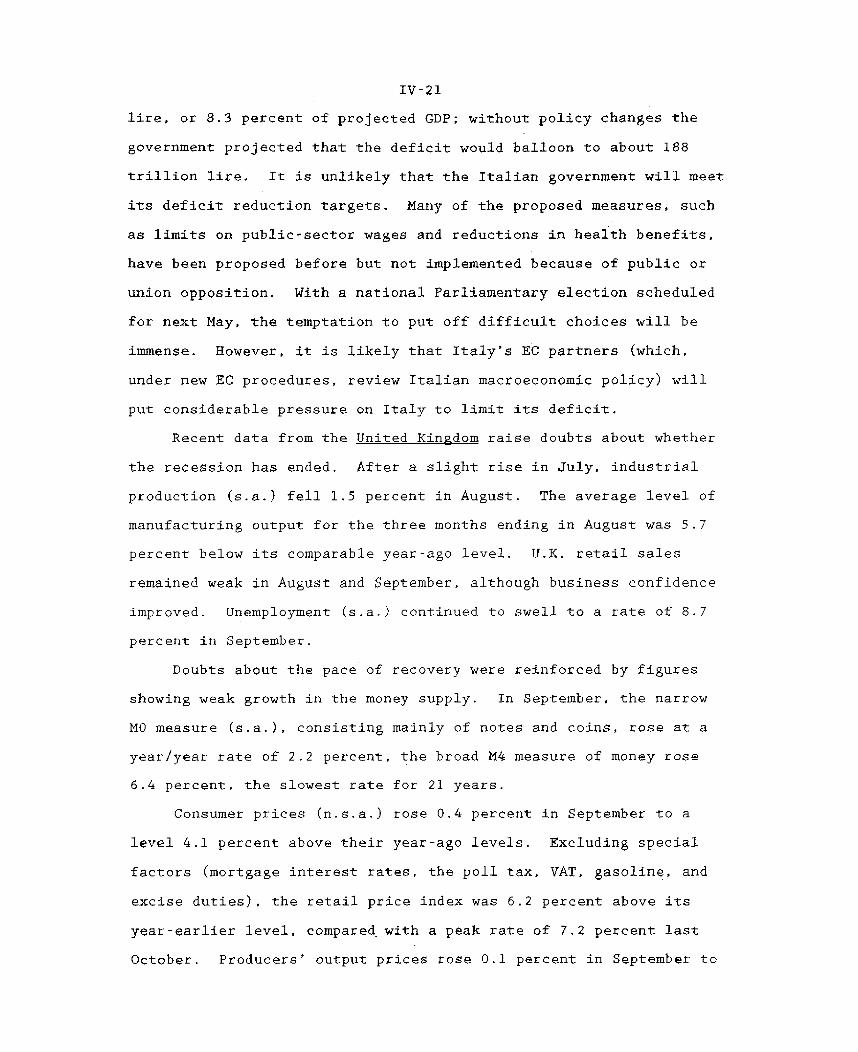
IV-21
lire, or 8.3 percent of projected GDP; without policy changes the
government projected that the deficit would balloon to about 188
trillion lire. It is unlikely that the Italian government will meet
its deficit reduction targets. Many of the proposed measures, such
as limits on public-sector wages and reductions in health benefits,
have been proposed before but not implemented because of public or
union opposition. With a national Parliamentary election scheduled
for next May, the temptation to put off difficult choices will be
immense. However, it is likely that Italy's EC partners (which,
under new EC procedures, review Italian macroeconomic policy) will
put considerable pressure on Italy to limit its deficit.
Recent data from the United Kingdom raise doubts about whether
the recession has ended. After a slight rise in July, industrial
production (s.a.) fell 1.5 percent in August. The average level of
manufacturing output for the three months ending in August was 5.7
percent below its comparable year-ago level. U.K. retail sales
remained weak in August and September, although business confidence
improved. Unemployment (s.a.) continued to swell to a rate of 8.7
percent in September.
Doubts about the pace of recovery were reinforced by figures
showing weak growth in the money supply. In September, the narrow
MO measure (s.a.), consisting mainly of notes and coins, rose at a
year/year rate of 2.2 percent, the broad M4 measure of money rose
6.4 percent, the slowest rate for 21 years.
Consumer prices (n.s.a.) rose 0.4 percent in September to a
level 4.1 percent above their year-ago levels. Excluding special
factors (mortgage interest rates, the poll tax, VAT, gasoline, and
excise duties), the retail price index was 6.2 percent above its
year-earlier level, compared with a peak rate of 7.2 percent last
October. Producers' output prices rose 0.1 percent in September to

IV-22
a level 5.6 percent above a year ago; this year-on-year increase is
the lowest since March 1990. Average manufacturing pay settlements
slowed to 5.5 percent in the third quarter from rises of 6.4 percent
and 8.1 percent in the preceding two quarters.
In Canada, recent monthly data suggest that the economic
recovery remains tenuous. In August, retail sales (s.a.) fell 1.3
percent, motor vehicle sales (s.a.) dropped 13 percent, and
manufacturers' unfilled orders (s.a.) slipped 0.4 percent as
shipments rose 0.9 percent. However, housing starts (s.a.)
rebounded 7 percent in September and the average level grew 14.4
percent between the second and third quarters. Industrial
production (s.a.) increased 0.5 percent in July, rising for the
fourth consecutive month. The unemployment rate (s.a.) fell from
10.6 percent to 10.2 percent in September, although about half of
the decline was due to a decrease in the labor force participation
rate.
Recent price data continue to show that the government's anti-
inflation program is taking hold. The consumer price index (n.s.a.)
decreased 0.2 percent in September, causing twelve-month inflation
to fall to 5.4 percent. The CPI excluding food and energy (n.s.a.)
was up 0.1 percent in September, and has increased only 3.7 percent
(a.r.) in the eight month period from January, when the 7 percent
goods and services tax took effect. Industrial product prices
(n.s.a.) posted their eighth straight monthly decline, falling 0.2
percent in September.
Recent announcements have added credibility to the government's
anti-inflation rhetoric. In late September, as part of a
constitutional reform package dubbed the National Unity Plan, the
government proposed simplifying the mandate of the Bank of Canada
from the pursuit of general economic welfare to a more specific goal

IV-23
of achieving and preserving price stability. Under this proposal,
an amendment of the Bank of Canada Act would be necessary to force
the Bank of Canada to abandon its current emphasis on low inflation.
In mid-October, the Ministry of Finance announced that it will begin
to issue inflation-indexed bonds later this year. If inflation
turns out to be less than market expectations of inflation that are
implied by nominal bond yields, indexed bonds may be a cheaper
source of funds for the government, ex post. The issuance of such
bonds decreases the government's incentive to reduce the real value
of the public debt via inflation.
Developments in Eastern European Countries
In Poland, pro-reform parties failed to gain a clear majority
of seats in the October 27 parliamentary elections, and will have to
negotiate with a variety of splinter parties to form a new coalition
government. Also, the former communist party did surprisingly well.
The election results have generated concerns that the new government
will slow or turn back the pace of economic reform.
Industrial sales rose 2.6 percent in September but remain 20.4
percent below a year earlier. The unemployment rate rose 0.6
percent to 10.4 percent in September. Led by a 6.4 percent increase
in food prices, September inflation was 4.3 percent following
monthly consumer price increases of 0.1 and 0.6 percent in July and
August, respectively. Consumer prices have risen about 45 percent
since December 1990. The trade balance registered a small surplus
in the first nine months of 1991. The fiscal deficit continued to
increase in August and September, and now is expected to reach 3-4
percent of GDP for 1991. The need for an improved fiscal position
is likely to be a key ingredient of discussions with the IMF on
targets for Poland's 1992 program.

IV-24
In Hungary, industrial production rose 2.4 percent in August
but has declined 17.8 percent in the first eight months of 1991
compared with the same period in 1990. In September, the
unemployment rate rose 0.9 percent to 6.1 percent. Consumer prices
rose 0.2 percent in August to a level 34.2 percent above their year-
ago level. Inflation has declined steadily since January 1991. The
current account registered a small surplus in the first nine months
of 1991 against earlier predictions of a deficit for the year
exceeding $1 billion.
In the Czech and Slovak Federal Republic, industrial production
fell 19 percent during the first nine months of 1991 compared with
the same period last year. The unemployment rate rose 0.5 percent
to 5.6 percent in September. One bright spot in the economic
setting was that prices have been roughly stable since June, rising
0.3 percent in September following a decline of 0.4 percent in
August.
Economic Situation in Other Countries
The Mexican government is planning to use privatization
proceeds to retire 12 percent of the country's internal debt.
International reserves fell in the third quarter after rising
steadily for five quarters. In Brazil, the government sold its
shares in a large steel firm after many months of delays. A drain
on reserves, caused by a narrowing of the trade surplus and the
payment of overdue interest to foreign banks, led to a 15 percent
devaluation on September 30. In late October, the markets were
expecting another large devaluation. Preliminary data indicate that
Argentina missed the third-quarter fiscal targets of its IMF program
and may require a waiver to continue drawing on the Fund. Venezuela
missed some of the June performance criteria of its IMF program.
However, corrective measures, endorsed by the IMF staff, have begun

IV-25
to be taken. Preliminary indications are that the Philippines
missed the base money target of its IMF program for the third
quarter after missing it for the second quarter. Drawings under the
stand-by agreement remain suspended. In Korea, high economic growth
continues to put pressure on prices and imports. The current
account deficit in the first eight months of 1991 was a record $7.9
billion. In Taiwan, economic activity has picked up moderately this
year due to stronger exports and rising public investment.
Individual country notes. Mexico's Finance Secretary Aspe
announced early in October that the government would retire 20
trillion pesos ($6.7 billion) of the country's internal debt, 12
percent of the total, using the bulk of the peso proceeds from the
privatization of the telephone system, the commercial banks, and
other public enterprises. In recent months, the stronger cash
position of the public sector has enabled the government to reduce
sharply the amount of new issues of securities in its weekly
auctions. This contributed to the steady decline in interest rates
through August. However, rates firmed in September, when a cash
squeeze developed. While rates eased somewhat in October, they
remain above earlier lows. At the auction of October 22, the 28-day
Treasury bill rate was 17.4 percent, 165 basis points above the
August low.
International reserves fell during the third quarter after
rising steadily since March 1990, when the bank financing package
was implemented. Lacking recent trade and capital account data, it
is not known what lies behind the reversal. The decline may be
estimated at about $1.5 billion. It was obscured by data reporting
peculiarities and by adding to reported reserves most of the
proceeds of the privatization of the telephone system, which were
excluded up to now, although they were received before mid-year.

IV-26
In the second quarter, the latest available period, real GDP
was 5.3 percent higher than a year earlier. This was the highest
second-quarter year-over-year increase since 1981. Consumer prices
rose by 1 percent in September, when they were 11.9 percent higher
than at the end of 1990 and 20 percent higher than in September
1990. In contrast, in September 1990, consumer prices were 28.7
percent higher than a year earlier.
The financial markets are awaiting President Salinas' state of
the nation speech on November 1, his budget message on November 15,
and the policy changes that may be made when the anti-inflation pact
between government, business, and labor is renewed ahead of its
scheduled year-end expiration date. However, the stock market index
remains buoyant, most recently on expectations of favorable company
earnings reports. The index was 116 percent higher on October 28
than at the end of 1990.
In Brazil, the first public sector firm to be privatized was
sold on October 24, after many months of delays caused mainly by
strong political opposition to the privatization program. The firm
was the steel company USIMINAS, the largest of the first 19 firms
slated for privatization. Only 6 percent of the shares were bought
by foreign investors. 30 percent of the shares were bought by an
industrial firm in which the government has a 51 percent interest
and by a pension fund of a government-owned commercial bank.
In June, the latest available month, industrial production was
5.9 percent higher than a year earlier, a recession low, but it was
little changed from February 1990, the month before the Collor
government took office. Anecdotal evidence suggests that economic
activity has fallen since June. Consumer prices rose 17 percent in
September and about 23 percent in October. New selective price
controls were imposed in mid-October.
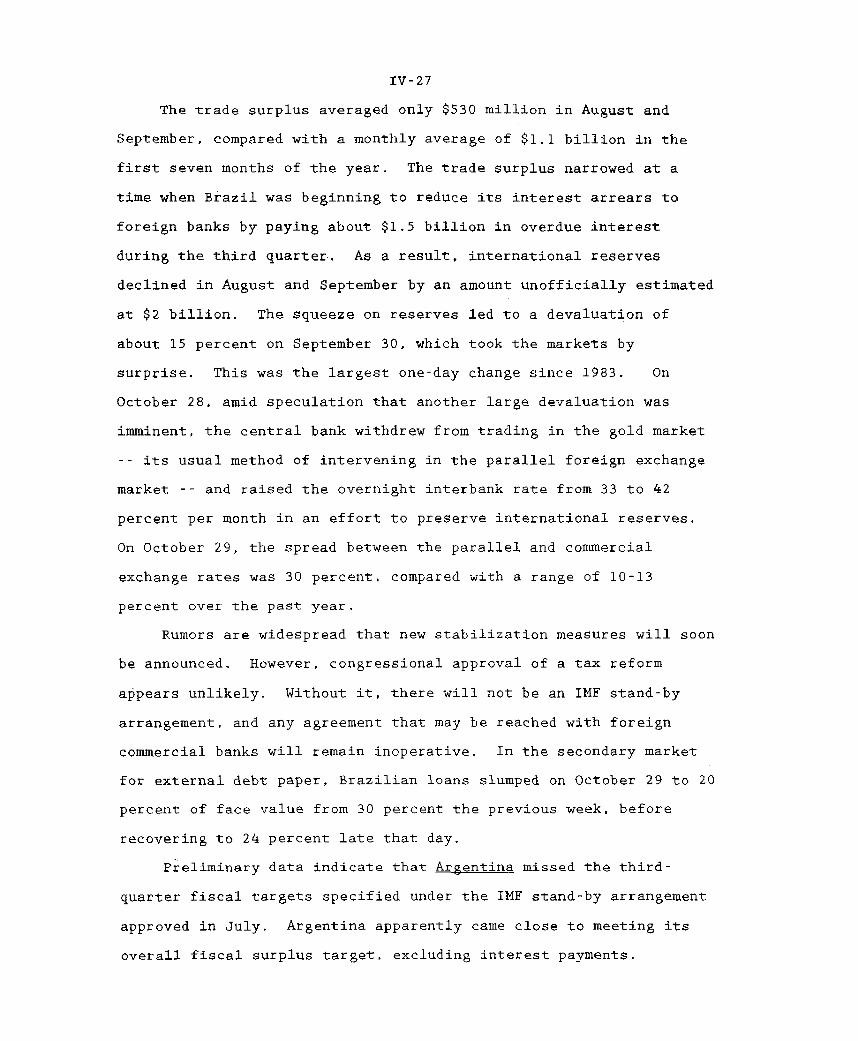
IV-27
The trade surplus averaged only $530 million in August and
September, compared with a monthly average of $1.1 billion in the
first seven months of the year. The trade surplus narrowed at a
time when Brazil was beginning to reduce its interest arrears to
foreign banks by paying about $1.5 billion in overdue interest
during the third quarter. As a result, international reserves
declined in August and September by an amount unofficially estimated
at $2 billion. The squeeze on reserves led to a devaluation of
about 15 percent on September 30, which took the markets by
surprise. This was the largest one-day change since 1983. On
October 28, amid speculation that another large devaluation was
imminent, the central bank withdrew from trading in the gold market
-- its usual method of intervening in the parallel foreign exchange
market -- and raised the overnight interbank rate from 33 to 42
percent per month in an effort to preserve international reserves.
On October 29, the spread between the parallel and commercial
exchange rates was 30 percent, compared with a range of 10-13
percent over the past year.
Rumors are widespread that new stabilization measures will soon
be announced. However, congressional approval of a tax reform
appears unlikely. Without it, there will not be an IMF stand-by
arrangement, and any agreement that may be reached with foreign
commercial banks will remain inoperative. In the secondary market
for external debt paper, Brazilian loans slumped on October 29 to 20
percent of face value from 30 percent the previous week, before
recovering to 24 percent late that day.
Preliminary data indicate that Argentina missed the third-
quarter fiscal targets specified under the IMF stand-by arrangement
approved in July. Argentina apparently came close to meeting its
overall fiscal surplus target, excluding interest payments.

IV-28
However, a greater fraction of this surplus derived from the
proceeds of asset sales, including the sales of shares in the state
telephone company and of oil-exploration concessions, than was
permitted under the stand-by arrangement. An IMF mission will visit
Argentina in November to establish a definitive evaluation of its
third-quarter fiscal performance. If the preliminary data are
confirmed, the IMF Executive Board will need to approve a waiver in
order to release the second drawing under the stand-by arrangement.
Monthly consumer price inflation edged up to 1.8 percent in
September from 1.3 percent in August, largely due to increases in
food prices and home rentals; however, the August price rise had
been the lowest in 15 years. Short-term call money rates have
continued to fluctuate near 1 percent per month, very low by recent
standards. The stock market has continued its run-up, rising about
14 percent in the first three weeks in October after rising 11
percent during September. As a result of the improved outlook for
financial conditions, seasonally adjusted industrial production in
July, the latest available month, was 21 percent higher than the
recent low in March and 17 percent higher than a year earlier.
Venezuela missed some of the June fiscal and monetary
performance criteria of its IMF Extended Fund Facility arrangement.
In part, this resulted from increased public investment, which,
together with increased construction activity, pushed real GDP
growth to a 10 percent annual rate in the first half of 1991,
compared with 5.3 percent in all of 1990.
However, corrective measures, endorsed by the IMF staff, began
to be implemented in August. The measures include spending
reductions, tax revenue increases, and higher domestic prices for
petroleum derivatives. In addition, required reserves for most
components of the money stock are being raised in stages, not only

IV-29
to limit monetary growth, but also to allow a portion of outstanding
central bank bills to be retired. These bills were issued to
sterilize capital inflows. However, since they carried nominal
interest rates of 35-40 percent, their growing stock added to the
overall public sector deficit in the first half of 1991.
The restrictive measures already taken have contributed to a
reduction in the average monthly inflation rate from 2.7 percent for
January-July to 2.1 percent in August-September. The measures are
estimated to restrict the 1991 fiscal deficit to 1.2 percent of GDP.
In light of these developments, the IMF Executive Board is expected
to approve a Venezuelan drawing from the Fund before year-end and to
extend the program so as to restore the availability of two other
drawings that were scheduled to occur earlier, but were suspended
because Venezuela deviated from the program.
The Philippines, which missed the June base money target of its
IMF program, also appears to have missed the September target, but
by a smaller margin. An IMF team will visit Manila during the
second week of November to discuss what steps need to be taken to
put the program back on track. In the interim, drawings under the
stand-by arrangement will remain suspended. An IMF Executive Board
review of the Philippine program is not expected to be held until
January at the earliest. Adherence to the IMF program is a
condition of the debt restructuring agreement reached in principle
with commercial banks on August 30.
In Korea, rapid economic activity in excess of potential
continues to put pressure on prices and imports. In the first half
of 1991, real GDP grew 9-1/4 percent at an annual rate. Consumer
prices were 9.3 percent higher in September than a year earlier.
The current account deficit rose to a record $7.9 billion in the
first eight months of 1991 from $0.9 billion in the same period of

IV-30
last year, as a steep rise in imports of oil and capital goods more
than offset a recovery in exports.
In Taiwan, economic activity has picked up moderately this year
due to stronger exports and rising public investment. In the first
half of 1991, real GDP grew 6.9 percent at an annual rate, compared
with 4.9 percent in all of 1990. In the first three quarters of
1991, exports rose 14.1 percent, due in part to large increases in
shipments to China (through Hong Kong). Over the same period, the
cumulative trade surplus (on a customs basis) was $9.6 billion, up
slightly from $9.3 billion in the first three quarters-of 1990.
Inflation has abated this year; consumer prices were 0.3 percent
lower in September than a year earlier. The main opposition party's
call on October 13 for independence from China (contrasted with the
claim of the authorities on Taiwan that they are the legitimate
government of all of China) led to a decline in Taiwan's stock price
index of nearly 6 percent on October 14 and an additional 4 percent
through October 29.