Fomc 19860819 Gb Sup 19860815
17
Prefatory Note The attached document represents the most complete and accurate version available based on original copies culled from the files of the FOMC Secretariat at the Board of Governors of the Federal Reserve System. This electronic document was created through a comprehensive digitization process which included identifying the best- preserved paper copies, scanning those copies, 1 and then making the scanned versions text-searchable. 2 Though a stringent quality assurance process was employed, some imperfections may remain. Please note that this document may contain occasional gaps in the text. These gaps are the result of a redaction process that removed information obtained on a confidential basis. All redacted passages are exempt from disclosure under applicable provisions of the Freedom of Information Act. 1 In some cases, original copies needed to be photocopied before being scanned into electronic format. All scanned images were deskewed (to remove the effects of printer- and scanner-introduced tilting) and lightly cleaned (to remove dark spots caused by staple holes, hole punches, and other blemishes caused after initial printing). 2 A two-step process was used. An advanced optimal character recognition computer program (OCR) first created electronic text from the document image. Where the OCR results were inconclusive, staff checked and corrected the text as necessary. Please note that the numbers and text in charts and tables were not reliably recognized by the OCR process and were not checked or corrected by staff.
-
Upload
fraser-federal-reserve-archive -
Category
Documents
-
view
214 -
download
0
Transcript of Fomc 19860819 Gb Sup 19860815

Prefatory Note
The attached document represents the most complete and accurate version available based on original copies culled from the files of the FOMC Secretariat at the Board of Governors of the Federal Reserve System. This electronic document was created through a comprehensive digitization process which included identifying the best-preserved paper copies, scanning those copies,1 and then making the scanned versions text-searchable.2 Though a stringent quality assurance process was employed, some imperfections may remain.
Please note that this document may contain occasional gaps in the text. These gaps are the result of a redaction process that removed information obtained on a confidential basis. All redacted passages are exempt from disclosure under applicable provisions of the Freedom of Information Act.
1 In some cases, original copies needed to be photocopied before being scanned into electronic format. All scanned images were deskewed (to remove the effects of printer- and scanner-introduced tilting) and lightly cleaned (to remove dark spots caused by staple holes, hole punches, and other blemishes caused after initial printing). 2 A two-step process was used. An advanced optimal character recognition computer program (OCR) first created electronic text from the document image. Where the OCR results were inconclusive, staff checked and corrected the text as necessary. Please note that the numbers and text in charts and tables were not reliably recognized by the OCR process and were not checked or corrected by staff.
CONFIDENTIAL (FR)CLASS III - FOMC
August 15, 1986
SUPPLEMENT
CURRENT ECONOMIC AND FINANCIAL CONDITIONS
Prepared for theFederal Open Market Committee
By the StaffBoard of Governors
of the Federal Reserve System

TABLE OF CONTENTS
THE DOMESTIC FINANCIAL ECONOMY
Industrial production. . . . . . ..Producer prices. . . . . ... . .Retail inventories . . . . . . .
TablesIndustrial production . . . . .Recent changes in producer prices.Business inventories . . . . . .Inventory/sales ratios . . . ...
*
* S S S S
* S S S S
* S S S S S S
* S S S S S S
THE FINANCIAL ECONOMY
TablesMonetary aggregates .... . . . .........Commercial bank credit and short- and intermediate-
term business credit . . . . . . . . . . . . .. .Selected financial market quotations .. . . . . . . ..
Page

SUPPLEMENTAL NOTES
THE DOMESTIC NONFINANCIAL ECONOMY
Industrial production
Industrial production edged down 0.1 percent in July after declining
0.3 percent in June and 0.5 percent in May. Despite strike related rebounds,
mainly in communication equipment, activity remained generally sluggish.
Output of consumer goods and durable materials was off in July and weakness
in most business equipment industries continued.
Output of consumer goods decreased 0.3 percent in July after a similar
decline in June. Auto assemblies fell to a 7.6 million unit rate, from an
8.0 million unti rate in June, although the decline was largely offset by
gains in production of light trucks. Production of home goods edged down
in July and nondurable goods output fell 0.3 percent. Most business
equipment groups posted declines except commercial equipment, which rebounded
1.4 percent in July owing largely to a resumption of production of telephone
equipment after the strike-related curtailment in June. Elsewhere in the
equipment sector, the defense and space component continued to edge up,
while oil and gas well drilling was reduced again, although much less
than in the recent months and with a negligible effect on overall industrial
output. Production of construction supplies rose 0.4 percent in July after
a 1.6 percent drop in June. Materials production was little changed in
July as durable good materials decreased while nondurable goods, such as
chemicals and paper, as well as energy materials both rose.

2
Producer Prices
Producer prices of finished goods fell 0.4 percent in July-the fifth
decline of this year-as energy prices dropped 12 percent. Food prices,
however, posted a substantial increase, and prices of other finished goods
advanced 0.3 percent.
In the finished energy component, refinery prices of gasoline and
fuel oil plunged 19 and 17 percent, respectively; both were little more
than half of their July 1985 levels. At the wellhead level, crude oil
prices dropped 9 percent to less than half their year-earlier level. More
recently, spot prices of crude oil have picked up in domestic and world
markets, in response to the recent OPEC agreement on a temprorary production
cutback, suggesting an upturn in domestic producer prices of petroleum and
products in coming months.
Producer prices of finished foods rose about 2 percent in July,
reflecting reduced meat supplies as well as weather-related influences on
prices of poultry, eggs, and apparently, fresh fruits and vegetables.
At the farm level, prices were up sharply for livestock and broilers; but
corn prices plummeted, and wheat and soybeans also fell. Price trends in
agricultural commodity markets since the mid-July PPI pricing date indicate
further increases for livestock and poultry and declines for grains and
soybeans.
Excluding food and energy items, producer prices of finished consumer
goods rose 0.3 percent in July,--more than in recent months-with notable
increases for tobacco products, pharmaceuticals, and passenger cars.
The index for capital equipment advanced 0.2 percent-similar to the average

pace over the past year; substantial increases were posted for trucks,
cars, and commercial furniture.
At earlier stages of processing, prices of intermediate materials
less food and energy rose 0.2 percent while prices of crude nonfood materials
less energy edged up 0.1 percent. Both are little different from their
year-earlier levels.
Retail inventories
The book value of retail inventories rose at an annual rate of $11.7
billion in June, after a $15.5 billion decline in the preceding month.
About three-fourths of the June accumulation was at automotive outlets.
Most types of stores selling nondurable goods reported inventory declines.
In particular, the book value of general merchandise stocks fell at a $3.3
billion rate in June, after a similar drop one month earlier. These
consecutive reductions have notably improved the general merchandisers'
overall inventory position: the inventory-sales ratio for stores in this
category dropped to 2.26 in June-down from the recent high of 2.37 observed
in January this year. Similar improvement was also seen for stores in the
broader G.A.F. (general merchandise, apparel, and furniture and appliances)
grouping, where the ratio dropped to 2.27 in June, compared with the January
high of 2.38.
For all manufacturing and trade, inventories rose in June at a $27.4
billion annual rate, more than reversing the $22.5 billion drop in the
preceding month. Total sales by manufacturers and retail and wholesale
establishments rose 0.5 in June, leaving the overall inventory-sales ratio
unchanged at 1.39. For the second quarter as a whole, inventories in all
manufacturing and trade rose at a $3.3 billion rate in book-value terms,
somewhat more than the accumulation BEA had assumed when the preliminary
second-quarter GNP estimates were prepared.

INDUSTRIAL PRODUCTION(Percentage change from preceding period;
based on seasonally adjusted data)
1986 19861986
Q1 Q2
-Annual rate-
Total Index .7 -2.8
Products .2 -1.4Final products -1.3 -2.9Consumer goods 1.9 4.3Durable 2.7 -3.3Nondurable 1.6 7.0
Equipment -4.8 -10.5Business .3 -6.8Defense and space -4.0 1.9Oil and gas drilling -59.7 -86.9
Intermediate products 5.7 3.9Construction supplies 10.8 .9
Materials 1.4 -5.0Durable goods .7 -8.1Nondurable goods 7.1 2.3Energy materials -2.3 -5.3
1986May June July
--Monthly rate-
-.5 -.3 -.1
-.4 -.6 -.1-.6 -.7 -.1-.1 -.3 -.3
-2.5 .4 -.1.7 -.5 -.3
-1.3 -1.1 .0-1.3 -1.2 .0
.2 .1 .1-12.8 -10.1 -4.0
.4 -.3 .0
.2 -1.6 .4
-.7 .1 .0-1.2 -.4 -.2-.1 .6 .2-.1 .5 .4

RECENT CHANGES IN PRODUCER PRICES(Percentage change; based on seasonally adjusted data) 1
RelativeImportance 1985 1986 1986
Dec. 1985 1985 Q4 Q1 Q2 June July
-Annual rate- -Monthly rate-
Finished goods 100.0 1.8 9.2 -12.5 0.0 0.0 -0.4Consumer foods 24.5 0.5 16.0 -8.1 6.0 0.0 1.9Consumer energy 12.5 -0.3 20.7 -66.9 -25.1 -0.6 -11.9Other consumer goods 40.3 2.7 4.4 2.5 1.7 0.0 0.3Capital equipment 22.7 2.7 5.6 0.7 1.9 0.1 0.2
Intermediate materials2 95.3 0.0 2.9 -11.8 -4.8 0.0 -0.7Exc. energy 79.6 -0.1 0.0 -1.0 -1.3 0.0 0.2
Crude food materials 52.5 -6.4 47.0 -24.7 -0.2 -0.8 3.4Crude energy 31.6 -4.9 -4.0 -51.3 -33.8 -3.0 -2.8Other crude materials 15.9 -4.3 1.5 -0.2 6.6 1.1 0.1
1. Changes are from final month of preceding period to final monthof period indicated.2. Excludes materials for food manufacturing and animal feeds.

BUSINESS INVENTORIES(Change at annual rates in seasonally
adjusted book value; billions of dollars)
1985 1985 1986 1986 1986 1986 1986 1986Q3 Q4 Q1 Q2 Mar Apr May June
Manufacturing and trade -6.4 17.6 20.1 3.3 36.0 5.1 -22.5 27.4(Pervious) -23.8
Manufacturing -6.6 -8.6 -9.3 -5.2 4.0 -2.6 -12.1 -1.1Trade, total .2 26.2 29.4 8.6 32.0 7.6 -10.4 28.6Wholesale -2.1 6.1 4.5 7.4 5.9 .3 5.1 16.8Retail 2.3 20.1 24.9 1.2 26.1 7.3 -15.5 11.7
Durable -3.0 17.8 21.0 1.3 27.2 1.6 -12.8 15.0Auto -6.8 19.9 15.1 -2.1 20.5 -6.0 -9.2 8.8
Nondurable 5.3 2.3 3.9 -.1 -1.2 5.7 -2.7 -3.2
Totals may not add because of rounding.
INVENTORY/SALES RATIOS
1985 1985 1986 1986 1986 1986 1986 1986Q3 Q4 Q1 Q2 Mar Apr May June
r p
Manufacturing and trade 1.36 1.36 1.38 1.39 1.40 1.37 1.39 1.39
Manufacturing 1.46 1.42 1.43 1.43 1.46 1.42 1.44 1.44Trade, total 1.28 1.30 1.34 1.35 1.35 1.33 1.35 1.35Wholesale 1.18 1.18 1.20 1.24 1.22 1.20 1.25 1.24Retail 1.37 1.43 1.47 1.45 1.47 1.46 1.44 1.45
r - Revised.p - Preliminary.

MONETARY AGGREGATES(Based on seasonally adjusted data unless otherwise noted)1
1984:04to 1986
1985:Q4 Q1 Q2 May June JulyP
--- Percentage change at annual rates --
August 15, 1986
Growth from04 1985 toJuly 1986P
11.9 7.7 15.8 23.4 14.6 16.98.6 4.3 10.4 12.4 9.5 12.67.6 7.4 8.0 5.7 6.6 12.9
Selected components
4. Currency
5. Demand deposits
6. Other checkable deposits
7. M2 minus M12
8. Overnight RPs and Eurodollars, NSA9. General purpose and broker/dealer money
market mutual fund shares, NSA10. Commercial banks11. Savings deposits, SA,
plus MMDAs, NSA 3
12. Small time deposits13. Thrift institutions14. Savings deposits, SA,
plus MMDAs, NSA 3
Small time deposits
6. M3 minus M24
17. Large time deposits18. At commercial banks, net 5
19. At thrift institutions20. Institution-only money market
mutual fund shares, NSA21. Term RPs, NSA22. Term Eurodollars, NSA
Levels in billionsof dollarsJuly 1986P
7.5 7.5 6.2 9.6 5.5 6.1
8.6 3.0 15.2 25.7 14.1 14.3
22.3 15.0 25.8 32.9 24.0 30.2
7.6 3.2 8.7
18.9
9.39.1
3.0 -7.1
10.9 27.87.2 5.8
8.8 7.8 11.3
3.6 -55.4 99.4
26.7 14.67.5 6.5
19.0 8.7 13.2 15.8 21.4 15.8-0.6 5.3 -3.1 -9.6 -9.7 -5.3
5.1 4.3 7.4 6.3 7.5 6.5
13.7 1.3 13.8 21.4 24.9 18.0-0.4 6.6 2.8 -4.5 -5.2 -1.9
3.7 20.3 -1.5 -20.8 -5.1 13.9
15.6 -1.718.5 -8.610.0 11.0
11.1 26.8 39.2-4.6 44.1 -13.2-4.9 7.7 -1.5
-15.4-23.0-0.7
32.4-17.5-40.0
-1.9 2.4-2.1 -0.9-2.2 8.0
-17.3-44.3-10.7
40.0-1.8-23.2
177.5
288.3
204.0
2021.0
69.3
200.1872.6
492.5380.1888.3
385.1503.3
661.4
446.5280.8165.7
77.565.176.1
-- Average monthly change in billions of dollars -
MEMORANDA:T. Managed liabilities at commercial
banks (24+25)24. Large time deposits, gross25. Nondeposit funds26. Net due to related foreign
institutions, NSA27. Other6
28. U.S. government deposits at commercialbanks 7
2.3 7.5 -5.81.0 3.4 -2.61.3 4.1 -3.2
0.4 2.1 -1.61.0 2.0 -1.7
0.2 -0.6 0.9
-5.3 -3.7 0.3-6.5 -0.6 -1.3
1.2 -3.1 1.6
4.1 -2.0 -6.0-2.9 -1.1 7.5
3.9 -2.8 -3.91. Quarterly growth rates are computed on a quarterly average basis. uollar amounts snown under memoranda ror quar-terly changes are calculated on an end-month-of-quarter basis.2. Nontransactions 42 is seasonally adjusted as a whole.
3. Growth rates are for savings deposits, seasonally adjusted, plus money market deposit accounts (MMDs), not sea-
sonally adjusted. Commercial bank savings deposits excluding MMDAs increased during June and July 1986 at ratesof 17.7 percent and 23.8 percent, respectively. At thrift institutions, savings deposits excluding MMDAs increased
during June and July 1986 at rates of 29.1 percent and 22.9 percent, respectively..The non-M2 component of M3 is seasonally adiusted as a whole.Rat of large-denomination time deposits held by money market mutual funds and thrift institutions.
Consists of borrowings from other than commercial banks in the form of federal funds purchased, securities soldder agreements to repurchase, and other liabilities for borrowed money (including borrowings from the Federal
Reserve and unaffiliated foreign banks, loan RPs and other minor items). Data are partially estimated.7. Consists of Treasury demand deposits and note balances at commercial banks.
p--preliminary
1. Ml2. M23. M3
13.58.58.3
469.5338.5131.0
-30.3161.2
14.6

COMMERCIAL BANK CREDIT AND SHORT- AND INTERMEDIATE-TERM BUSINESS CREDIT(Percentage changes at annual rates, based on seasonally adjusted data)1 August 15, 1986
Levels InLevels in
1986 bil. of dollars01 02 May June JulyP JulyPe
Commercial Bank Credit
1. Total loans and securitiesat banks
2. Securities
3. U.S. government securities
4. Other securities
5. Total loans
6. Business loans
7. Security loans
8. Real estate loans
9. Consumer loans
10. Other loans
11. Business loans net of bankersacceptances
12. Loans at foreign branches2
13. Sum of lines 11 & 12
14. Commercial paper issued bynonfinancial firms 3
15. Sums of lines 13 & 14
16. Bankers acceptances: U.S. traderelated4
5
17. Line 15 plus bankers acceptances:U.S. trade related
18. Finance company loans to business4
19. Total short- and intermediate-term business credit (sum oflines 17 & 18)
11.5 9.3 3.9 5.9 3.8
19.9 2.0 4.9 10.4 6.3
-3.5 -5.3 7.9 18.2 3.1
62.5 12.8 0.7 -1.3 11.2
8.9 11.6 3.6 4.6 3.0
6.0 5.3 2.1 -2.6 4.7
4.0 101.7 -62.0 -40.1 -98.5
12.6 13.0 13.4 15.5 11.6
8.5 11.0 6.7 7.6 5.9
10.2 7.3 -1.6 4.8 -0.6
Short- and Intermediate-Term
6.0 5.2 1.0
-16.5 0.0 -21.5
5.2 5.1 0.2
55.5 -14.4 -10.3
-3.8
-26.1
-4.4
-2.9
11.8 2.1 -1.2 -4.2
3.6
-26.7
2.5
13.1
12.5 1984.2
33.5 471.2
45.9 285.3
15.0 185.9
6.1 1513.0
0.0 508.7
64.9 44.8
13.0 455.6
4.3 305.6
-3.6 198.3
Business Credit - -
0.7
34.1
1.8
-21.6
4.0 -1.4
-30.8 -6.2 16.3 18.8 25.8 n.a.
9.5 1.7 -0.4 -3.0
19.2 16.4 3.8 -2.3
11.3 4.5 0.5 -2.0
5.1 n.a.
-2.3 n.a.
3.8 n.a.
503.8
18.1
522.0
81.8
603.8
33.2 (Jun)
637.7 (Jun)
158.5 (Jun)
796.3 (Jun)
n.a.-not available.p-preliminary1. Average of Wednesdays for domestically chartered banks and average of current and preceding ends of months forforeign-related institutions.2. Loans at foreign branches are loans made to U.S. firms by foreign branches of domestically chartered banks.3. Average of Wednesdays.
4. ased on average of current and preceding ends of month.5. Consists of acceptances that finance U.S. imports, U.S. exports and domestic shipment and storage of goods.
198504

SELECTED FINANCIAL MARKET QUOTATIONS 1
(Percent)
1984 1985 1986 Change from:March April FOMC April FOMC
Highs highs Lows July 9 Aug. 14 Lows July 9Short-term rates
Federal funds2
Treasury bills3
3-month6-month1-year
Commercial paper1-month3-month
Large negotiable CDs 3
1-month3-month6-month
Eurodollar deposits4
1-month3-month
Bank prime rateTreasury bill futures
Sept. 1986 contractDec. 1986 contract
11.63
10.6710.7711.13
11.4211.35
11.5211.7912.30
11.8912.20
8.58
8.809.139.25
8.949.12
8.899.299.92
8.899.58
13.00 10.50
10.74
6.95
5.775.815.79
6.426.30
6.516.396.35
6.69 6.33 -0.62 -0.36
5.885.905.94
5.595.565.66
-0.18-0.25-0.13
-0.29-0.34-0.28
6.65 6.14 -0.28 -0.516.51 6.01 -0.29 -0.50
6.616.456.44
6.035.965.95
-0.48-0.43-0.40
-0.58-0.49-0.49
6.59 6.84 6.33 -0.26 -0.516.55 6.65 6.26 -0.29 -0.39
8.50 8.50
5.16 5.605.27 5.59
8.00
5.405.29
-0.50 -0.50
0.24 -0.200.02 -0.30
Intermediate- and long-term rates
U.S. Treasury (constant3-year
10-year30-year
Municipal revenue5
(Bond Buyer index)
Corporate--A utilityRecently offered
Home mortgage rates6
S&L fixed-rateS&L ARM, 1-yr.
maturity)13.4913.9913.94
11.2212.0211.97
11.44 10.25
15.30 13.23
14.68 13.2912.31 11.14
6.496.987.14
7.55
6.937.317.15
7.91
6.517.167.29
7.64
9.15 9.54e 9.55
9.60 10.59 10.18.41 8.57 8.
0.020.180.15
-0.42-0.150.14
0.09 -0.27
0.40 0.01
0.80 -0.190.03 -0.13
1984 1985 1986 1986 Percent change from:March Record FOMC Record FOMC
Lows Lows Highs July 9 Aug. 14 Highs July 9Stock pricesDow-Jones Industrial 1086.57 1247.35 1909.03 1826.07 1844.91 -3.36 1.03NYSE Composite 85.13 102.46 145.15 139.55 141.79 -2.31 1.61AMEX Composite 187.16 222.28 285.19 273.71 271.22 -4.90 -0.91NASDAQ (OTC) 225.30 276.18 411.16 393.39 379.52 -7.70 -3.53
1. One-day quotes except as noted. 4. Averages for statement week closest2. Averages for two-week reserve maintenance periodclosest to date shown. Last observation is theaverage to date for the maintenance period endingAugust 13, 1986.3. Secondary market.
to date shown.5. One-day quotes for preceding Thursday.6. One-day quotes for preceding Friday.e--estimate
4044

CONFIDENTIAL F.R.CLASS II - FOMC
Flow of Funds Projections
August 15, 1986
Division of Research and StatisticsBoard of Governors of the Federal Reserve System
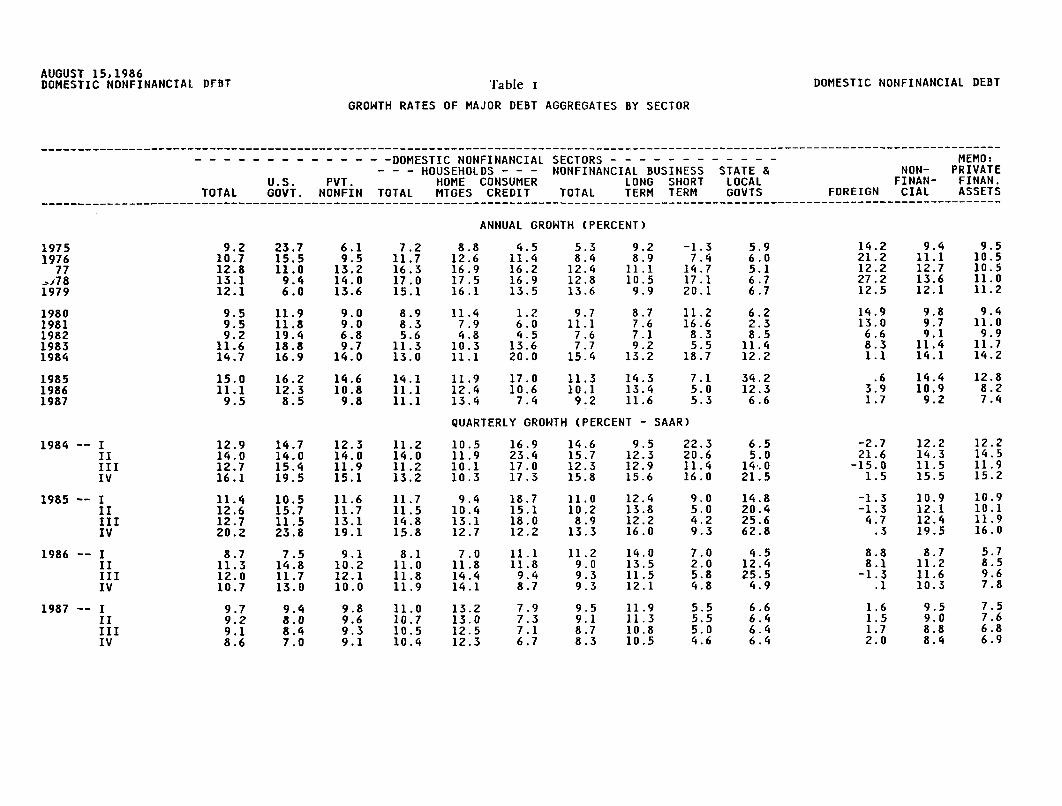
AUGUST 15,1986DOMESTIC NONFINANCIAL DFBT
GROWTH RATES OF MAJOR DEBT AGGREGATES BY SECTOR
----------------------------------------------------------------DOETCNNIACA ETR----------------------------------------------------0- - - - - - - - - - - - - -DOMESTIC NONFINANCIAL SECTORS - - - - - - - - - - - - MEMO:- - - HOUSEHOLDS - - - NONFINANCIAL BUSINESS STATE & NON- PRIVATE
U.S. PVT. HOME CONSUMER LONG SHORT LOCAL FINAN- FINAN.TOTAL GOVT. NONFIN TOTAL MTGES CREDIT TOTAL TERM TERM GOVTS FOREIGN CIAL ASSETS
------------------- ANNUAL GROTH (PERCENT)
ANNUAL GROWTH (PERCENT)
DOMESTIC NONFINANCIAL DEBT
19751976
77-1781979
19801981198219831984
198519861987
9.210.712.813.112.1
9.59.59.2
11.614.7
15.011.19.5
12.914.012.716.1
11.412.612.720.2
8.711.312.010.7
1984 -- IIIIIIIV
1985 -- IIIIIIIV
1986 -- IIIIIIIV
1987 -- IIIIIIIV
23.715.511.09.46.0
11.911.819.418.816.9
16.212.38.5
14.714.015.419.5
10.515.711.523.8
7.514.811.713.0
9.7 9.49.2 8.09.1 8.48.6 7.0
6.19.5
13.214.013.6
9.09.06.89.7
14.0
14.610.89.8
12.314.011.915.1
11.611.713.119.1
9.110.212.110.0
7.211.716.317.015.1
8.98.35.6
11.313.0
14.111.111.1
11.214.011.213.2
11.711.514.815.8
8.111.011.811.9
9.8 11.09.6 10.79.3 10.59.1 10.4
8.812.616.917.516.1
11.47.94.8
10.311.1
11.912.413.4
4.511.416.216.913.5
1.26.04.5
13.620.0
17.010.67.4
5.38.4
12.412.813.6
9.711.17.67.7
15.4
11.310.19.2
9.28.9
11.110.59.9
8.77.67.19.2
13.2
14.313.411.6
-1.37.4
14.717.120.1
11.216.68.35.5
18.7
14.221.212.227.212.5
14.913.0
6.68.31.1
6.22.38.5
11.412.2
7.1 34.25.0 12.35.3 6.6
9.411.112.713.612.1
9.89.79.1
11.414.1
.6 14.43.9 10.91.7 9.2
QUARTERLY GROWTH (PERCENT - SAAR)
10.511.910.110.3
9.410.413.112.7
7.011.814.414.1
13.213.012.512.3
16.923.417.017.3
18.715.118.012.2
11.111.8
9.48.7
14.615.712.315.8
11.010.2
8.913.3
11.29.09.39.3
9.512.312.915.6
12.413.812.216.0
14.013.511.512.1
7.9 9.5 11.97.3 9.1 11.37.1 8.7 10.86.7 8.3 10.5
22.320.611.416.0
6.55.0
14.021.5
9.0 14.85.0 20.44.2 25.69.3 62.8
7.0 4.52.0 12.45.8 25.54.8 4.9
5.5 6.65.5 6.45.0 6.44.6 6.4
-2.721.6
-15.01.5
-1.3-1.3
4.7.3
8.88.1-1.3
.1
12.214.311.515.5
10.912.112.419.5
8.711.211.610.3
9.510.510.511.011.2
9.411.09.9
11.714.2
12.88.27.4
12.214.511.915.2
10.910.111.916.0
5.78.59.67.8
1.6 9.5 7.51.5 9.0 7.61.7 8.8 6.82.0 8.4 6.9
Table I

FLOW OF FUNDS PROJECTIONS' HIGHLIGHTS
QUARTERLY, AT ANNUAL RATES QUARTERLY, AT ANNUAL RATES
C A L E N D A R Y E A R S I 1986 I 19871984 1985 1986 1987 I I II III IV I I II III IV
i'abio 2:
NET FUNDS BORROWED BY DOMESTIC1 NONFINANCIAL SECTORS2 PER CENT OF GNP I%)
BANK CREDIT - F/F BASIS:
3 TOTAL4 BUSINESS LOANS
PERCENT OF TOTAL5 FUNDS BORROWED (1)
NONFINANCIAL CORPORATE BUSINESS:
6 FINANCING GAP (2)
7 NET FUNDS RAISED IN MARKETS8 NET EQUITY ISSUES9 BONDS AND MTGS.
10 ST PAPER AND OTHER DEBT
11 LIQ. ASSETS/S.T.LIABILITIES
765.9 898.2 765.6 723.9 601.9 794.8 869.7 795.8 744.5 720.5 727.0 703.5 120.3 22.5 18.2 16.2 14.5 19.0 20.5 18.5 17.1 16.3 16.2 15.4 2
187.4 207.5 122.0 132.3 147.2 73.9 138.8 128.1 131.8 132.2 131.9 133.4 376.0 28.9 20.6 19.7 37.4 14.4 15.8 14.9 19.7 19.9 19.6 19.4 4
24.4 23.1 15.7 18.2 23.6 9.1 16.0 16.1 17.6 18.3 18.0 18.8 5
59.5 17.9 19.2 42.7 31.5 9.5 13.6 22.2 34.5 40.4 45.5 50.3 6
115.6-77.066.0
126.5
85.6-81.699.467.8
76.9-73.8116.634.0
92.6-57.5118.0
32.1
105.7-60.0105.760.0
61.2-75.0132.14.1
63.0-85.0107.440.6
77.6-75.0121.231.4
92.2-65.0122.434.7
93.6-60.0117.935.6
91.6-55.0116.230.4
93.0-50.0115.327.7
27.4 25.8 26.1 25.5 26.2 26.3 26.1 25.9 25.8 25.6 25.5 25.3 11
HOUSEHOLDS:
NET ACQUISITION OF DEPOSITS ANDCREDIT MARKET INSTRUMENT 424.6
DEPOSITS 298.7CREDIT MKT.INSTRUMENTS (3) 126.0
AS PERCENT OF DPI:NET ACQUISITIONS (L. 12)
DEPOSITS (L. 13)CR.MKT.INSTRUMENTS (L. 14)
15.9 12.911.2 6.34.7 6.5
9.3 9.8 6,3 9.9 9.9 11.1 10.1 10.4 9.2 9.4 15
7.9 7.5 8.1 7.5 8.1 7.9 9.1 7.9 6.0 7.1 16
1.5 2.3 -1.7 2.5 1.8 3.2 1.0 2.5 3.3 2.3 17
(1) TOTAL IN THIS RATIO INCLUDES FOREIGNBORROWING IN THE U.S.
(2) EXCESS OF CAPITAL EXPENDITURES OVERGROSS CASH FLOW
(3) EXCLUDES CORPORATE EQUITIES
364.3179.4184.9
278.7235.343.5
309.3237.272.1
185.2236.4-51.2
296.0
223.073.0
297.4242.754.6
336.4238.997.5
313.1281.032.1
326.3247.279.1
293.5189.6103.9
304.4231.073.4
HIGHLIGHT': HIGHLIGHTS

AUGUST 15, 1986Funds Raised
Funds Raised in Credit Markets
SEASONALLY ADJUSTED ANNUAL RATES SEASONALLY ADJUSTED ANNUAL RATES
I 1985 I 1986 I 19871984 1985 1986 1987 I III IV I I II III IV I H1 H2
Net borrowing in credit markets bydomestic nonfinan. sectors 765.9 898.2 765.6 723.9 809.9 1323.4 601.9 794.8 869.7 795.8 732.5 715.2 1
Funds Raised
U.S. Government
P 'te domestic nonfinan.State + local govts.
Nonfinancial businessBonds + mortgagesLoans + short-term paper
HouseholdsHome mortgagesConsumer creditOther
Net foreign borrowing inU. S. credit markets
Total, all nonfin. sectors
Net credit market borrowing byfinancial sectors
Sponsored credit agenciesMortgage pool securitiesPr. te financeNi ;redit market borrowing by
all sectors
Borrowing as per cent of GNP:Domestic nonfinancialBy U.S. Govt.By private domestic nonfin.
198.8 223.6 196.5 152.1 168.5 358.(1 119.5 241.6 198.6 226.2 158.1 146.2 2
567.1 674.5 569.1 571.7 641.4 964.6 482.4 553.2 671.1 569.6 574.4 569.1 345.0 140.9 67.9 41.0 115.0 300.2: 24.8 69.4 147.0 30.2 40.6 41.4 4
283.4145.7137.7
238.8130.094.814.0
241.8180.4
61.4
291.9152.696.642.7
237.3190.946.4
263.9180.170.912.9
238.7187.251.5
292.1218.754.818.6
201.4163.6
37.8
324.9176.9111.236.8
305.4220.984. 5;
359.01177.2:78.8;
103.01
264.8199.765.1
192.7102.473.916.5
218.0199.2
18.8
265.7175.5
80.89.5
230.8175.555.3
293.3219.7
66.47.2
235.5189.146.4
303.9222.762.718.5
244.0189.654.3
289.9217.056.516.3
233.4184.848.6
294.3220.453.020.9
2.8 1.5 9.8 4.2 11.5 .8 22.0 20.0 -3.2 .3 3.9 4.6 12768.7 899.7 775.3 728.1 821.3 1324.2 623.9 814.8 866.5 796.2 736.3 719.9 13
138.2 193.7 208.4 204.4 210.0 230.2 154.9 231.3 230.1 217.2 206.0 202.7 14
30.444.463.3
21.7 14.279.9 128.992.1 65.3
30.4120.453.6
4.287.3
118.6
30.499.0
100.8
3.695.056.3
5.1147.278.9
21.2138.770.2
26.8134.755.7
30.0121.654.5
30.8 15119.1 1652.8 17
906.9 1093.4 980.9 930.5 1031.4 1554.4 777.1 1040.3 1094.5 1011.7 940.4 920.6 18
20.3 22.5 18.2 16.25.3 5.6 4.7 3.415.1 16.9 13.5 12.8
20.1 32.4 14.5 19.0 20.54.2 8.8 2.9 5.8 4.715.9 23.6 11.6 13.2 15.9
18.55.313.3
16.73.6
13.1
15.8 193.2 20
12.6 21
Table 3

AUGUST 15, 1986Funds Advanced Funds Advanced
Table 4Funds Advanced Directly in Credit Markets
ASONALLY ADJUSTED ANNUAL RATES SEASONALLY ADJUSTED ANNUAL RATES--------- -----------------------------------------------------------------------------------------------------------------------
I 1985 I 1986 I 19871984 1985 1986 1987 I III IV I I II III IV I H H2
----------------------------------------------------------------------
Net direct lendingTo nonfinancial sectorsTo financial sectors
906.9768.7138.2
1093.4899.7193.7
980.9775.3208.4
930.5728.1204.4
1031.4821.3210.0
1554.41324.2230.2
777.1623.9154.9
1040.3814.8231.3
1094.5866.5230.1
1011.7796.2217.2
940.4736.3206.0
920.6719.9202.7
to finance
Commercial banking
Thrift institutionsInsurance + pension fundsOther private finance
U.S.Government relatedDirectSponsored agenciesMortgage poolsFederal Reserve
Foreign
HouseholdsNonfinancial businessState+local governments
555.6 555.2
181.7 196.6
146.3119.0108.6
98.817.128.844.4
8.4
86.0125.2147.4
140.717.421.779.921.6
584.8 545.3 581.9 737.8 591.3 569.3 628.8 549.8 542.3 548.3 4
122.3 131.7 191.5 312.2 120.1 103.4 138.2 127.5 131.4 131.9 5
112.0130.3223.0
170.610.316.4
128.915.0
126.2136.5152.9
167.74.5
30.9120.411.9
146.1137.1
107.2
115.825.6
19.887.3
-16.8
83.5160.2
181.8
161.67.95.099.049.6
66.2108.5298.2
96.012.1-4.295.0-6.9
111.8147.2212.6
206.416.519.4147.223.2
143.8131.1217.8
176.63.2
19.5138.715.3
126.2134.4163.5
203.59.4
31.1134.728.3
123.0135.5154.3
165.04.3
30.7121.6
8.4
129.4137.4151.6
170.34.6
31.0119.1
15.5
45.9 75.7 114.3 95.6 96.8 99.6 97.5 124.3 105.4 130.0 128.9 62.3 14
126.0 184.9 43.5 72.1 110.5 265.9 -51.2 73.0 54.6 97.5 55.6 88.7 1530.8 3.2 2.1 .8 11.8 18.4 12.4 4.7 -7.9 -.7 -.5 2.1 1649.9 133.7 65.5 49.1 114.5 271.1 31.0 62.4 137.0 31.7 49.1 49.0 17
of total advances to nonfinancialCommercial banking 23.6Total private finance 72.3U.S.Government related 12.8
Total net equity issuesDomestic nonfinancial corp.Domestic financial corps.Foreign net sales to U.S.
Net purchases by:HouseholdsForeignFinance
-41.2-2.710.3
sectors:21.961.715.6
15.875.422.0
18.174.923.0
23.370.914.1
23.655.712.2
19.2 12.7 15.9 16.0 17.8 18.394.8 69.9 72.6 69.1 73.6 76.215.4 25.3 20.4 25.6 22.4 23.7
Net Issues of Corporate Equities
-33.6 32.9 117.8 98.5 29.6 50.6 181.6 113.4 89.4 86.9 94.5 102.6 1-77.0 -81.6 -73.8 -57.5 -75.0 -100.0 -60.0 -75.0 -85.0 -75.0 -62.5 -52.5 242.3 110.6 186.0 152.3 100.6 147.4 233.2 186.4 168.4 155.9 152.1 152.4 31.1 4.0 5.6 3.8 4.0 3.2 8.4 2.0 6.0 6.0 4.9 2.7 4
-15.74.7
43.8
51.520.246.2
24.714.359.6
-14.37.7
36.2
22.3 99.0 47.3 46.016.7 22.7 23.0 18.011.6 59.8 43.1 25.5
13.617.056.3
21.615.557.4
27.813.061.7