Follow Up of a subject with Hemiparetic stroke - LIMAlima.utep.edu/JGARZAULLOA/Intervals Computation...
14
Intervals Computation - Human Gait cycle Follow Up of a subject with Hemiparetic stroke Jorge Garza-Ulloa Intervals Computation - Human Gait cycle Follow Up of a subject with Hemiparetic stroke Jorge Garza-Ulloa Nov 10, 2010 Page 1 Project Report: Follow Up of a subject with Hemiparetic stroke Abstract: Hemiparetic is the most frequent neurological deficit after stroke. Hemiparetic stroke patients frequently present balance abnormalities. One of the biggest challenges to therapist is to make a real follow –up of the illness and document the improvement related with the treatment received for the subjects to be used for future reference. Study of a Real Case for the Follow-Up: We have a subject that had a Hemiparetic stroke. Information about the Stroke Patient o 37 year old female o Hemiparetic Stroke o First visit: February 2010 o Second visit: April 2010 o Symptoms: Right hemiparetic o Treatment: Hydrotherapy Actual problem: On this case she presents problem to walk, to keep good balance for movement limitation on her right leg and problem to use her right arm and hand (Right hemiparetic) Data: She has been at the UTEP Human Lab twice with a different of 2 months and we got data on her Gait Human walk cycle using the Special Bertec treadmill that allow to walk on 2 different belts one for each leg to a different speed. One the first visit (February 2010) she moves very slowly because of her limitations. After two months (April 2010) of Hydrotherapy therapy she came back with a noticeable movement improvement but still limited to the stroke damage. At this time the Medical Doctor and therapeutic made a visual inspection for evaluate follow-up after treatment or medication. We expect to define a methodology to do it using Interval Computation and obtain the result graphically and a range-relation-number that indicate the improvement or not of a subject.
Transcript of Follow Up of a subject with Hemiparetic stroke - LIMAlima.utep.edu/JGARZAULLOA/Intervals Computation...

Intervals Computation - Human Gait cycle Follow Up of a subject with Hemiparetic stroke Jorge Garza-Ulloa
Intervals Computation - Human Gait cycle Follow Up of a subject with Hemiparetic stroke Jorge Garza-Ulloa
Nov 10, 2010 Page 1
Project Report:
Follow Up of a subject with Hemiparetic stroke Abstract:
Hemiparetic is the most frequent neurological deficit after stroke. Hemiparetic stroke patients
frequently present balance abnormalities. One of the biggest challenges to therapist is to make a real
follow –up of the illness and document the improvement related with the treatment received for the
subjects to be used for future reference.
Study of a Real Case for the Follow-Up:
We have a subject that had a Hemiparetic stroke.
Information about the Stroke Patient
o 37 year old female
o Hemiparetic Stroke
o First visit: February 2010
o Second visit: April 2010
o Symptoms: Right hemiparetic
o Treatment: Hydrotherapy
Actual problem:
On this case she presents problem to walk, to keep good balance for movement limitation on
her right leg and problem to use her right arm and hand (Right hemiparetic)
Data:
She has been at the UTEP Human Lab twice with a different of 2 months and we got data on her
Gait Human walk cycle using the Special Bertec treadmill that allow to walk on 2 different belts one for
each leg to a different speed.
One the first visit (February 2010) she moves very slowly because of her limitations.
After two months (April 2010) of Hydrotherapy therapy she came back with a noticeable
movement improvement but still limited to the stroke damage.
At this time the Medical Doctor and therapeutic made a visual inspection for evaluate follow-up
after treatment or medication. We expect to define a methodology to do it using Interval Computation
and obtain the result graphically and a range-relation-number that indicate the improvement or not of a
subject.

Intervals Computation - Human Gait cycle Follow Up of a subject with Hemiparetic stroke Jorge Garza-Ulloa
Intervals Computation - Human Gait cycle Follow Up of a subject with Hemiparetic stroke Jorge Garza-Ulloa
Nov 10, 2010 Page 2
“Tailoring efficient therapeutic approaches depends on appropriate evaluation of specific needs, but the
best tools for balance evaluation in patients with stroke are still under debate …….”
Volume 45 Number 8, 2008 Journal of Rehabilitation Research & Development
General Approach:
We need to do the subject follow-up and find the relation between the 2 visits analyzing all the
data and getting the relation of improvement using intervals computations methods studied in class and
compare with what we expect with reference of the healthy Human.
What is stroke and Hemiparesis?
Stroke is a sudden impairment in brain function. Usually, this is caused by the blockage, or the
rupture, of a blood vessel .
Hemiparesis is muscle weakness on only one side of the body. When Hemiparesis happens as a
result of a stroke, it commonly involves muscles in the face, arm, and leg. Hemiparesis is the most
frequent neurological deficit after stroke.
Why is so important find a solution for follow-up of subject with Hemiparetic stroke
“Tailoring efficient therapeutic approaches depends on appropriate evaluation of specific needs, but the
best tools for balance evaluation in patients with stroke are still under debate …….”
Volume 45 Number 8, 2008 Journal of Rehabilitation Research & Development
Figure 1 How do we get balance control
Intervals Computation - Human Gait cycle Follow Up of a subject with Hemiparetic stroke Jorge Garza-Ulloa
Intervals Computation - Human Gait cycle Follow Up of a subject with Hemiparetic stroke Jorge Garza-Ulloa
Nov 10, 2010 Page 3
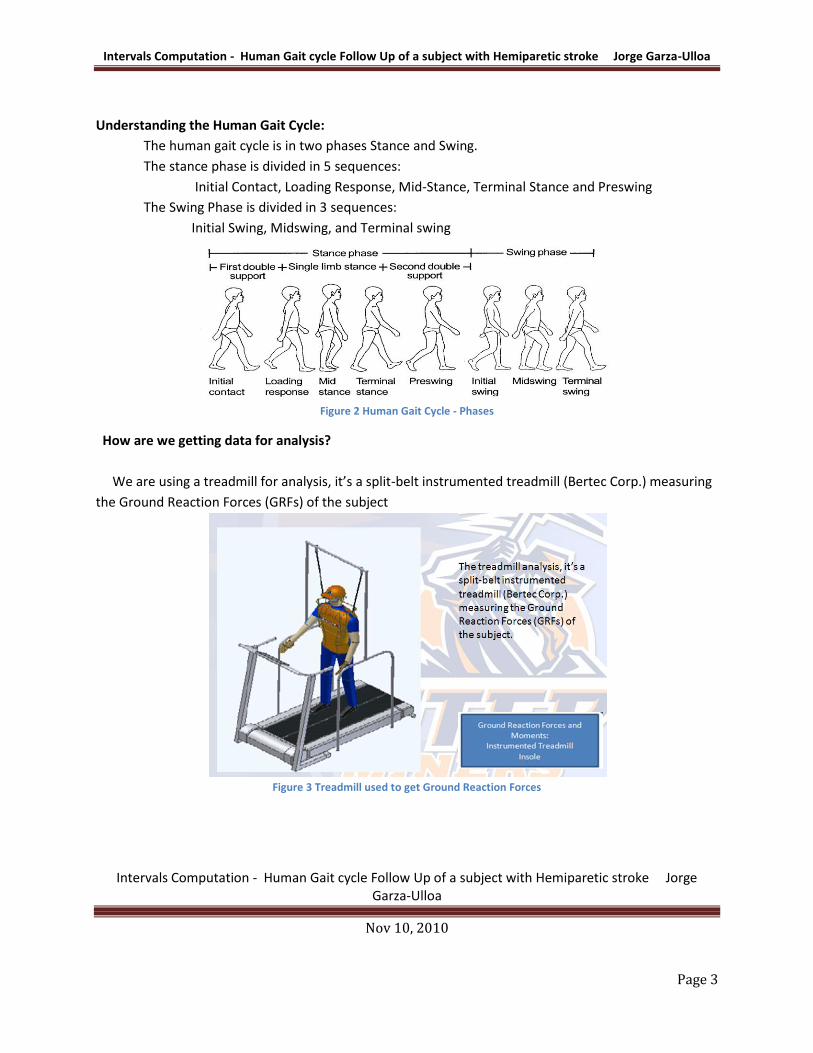
Understanding the Human Gait Cycle:
The human gait cycle is in two phases Stance and Swing.
The stance phase is divided in 5 sequences:
Initial Contact, Loading Response, Mid-Stance, Terminal Stance and Preswing
The Swing Phase is divided in 3 sequences:
Initial Swing, Midswing, and Terminal swing
Figure 2 Human Gait Cycle - Phases
How are we getting data for analysis?
We are using a treadmill for analysis, it’s a split-belt instrumented treadmill (Bertec Corp.) measuring
the Ground Reaction Forces (GRFs) of the subject
Figure 3 Treadmill used to get Ground Reaction Forces

Intervals Computation - Human Gait cycle Follow Up of a subject with Hemiparetic stroke Jorge Garza-Ulloa
Intervals Computation - Human Gait cycle Follow Up of a subject with Hemiparetic stroke Jorge Garza-Ulloa
Nov 10, 2010 Page 4
Figure 4 Ground Reaction Forces of a Healthy Human
Data available:
We have data from 2 visits of the subject with Hemiparetic stroke they are shown in fig 5.
Figure 5 Data available for follow-up
Specific Approach:
From the first visit of the subject on Feb 2, 2010 we have 1200 data captured
1) From the first visit of the subject on Feb 2, 2010 we have 1200 lectures. On that time the speed
was very slow, only 4 cycles on 1200 unit time of .1 sec note: The subject came before any
treatment.

Intervals Computation - Human Gait cycle Follow Up of a subject with Hemiparetic stroke Jorge Garza-Ulloa
Intervals Computation - Human Gait cycle Follow Up of a subject with Hemiparetic stroke Jorge Garza-Ulloa
Nov 10, 2010 Page 5
Figure 6 Raw Data of First visit
a) We proposed to detect each cycle (stride) but first we shift our data to begin at the
beginning of the cycle (Stride) an to diminish noise we defined a Threshold value of .05
Acceleration on Vertical axis
Figure 7 Data shift to the beginning of the cycle first of visit
b) We obtain the values for step at each cycle and chart the cycles together

Intervals Computation - Human Gait cycle Follow Up of a subject with Hemiparetic stroke Jorge Garza-Ulloa
Intervals Computation - Human Gait cycle Follow Up of a subject with Hemiparetic stroke Jorge Garza-Ulloa
Nov 10, 2010 Page 6
Figure 8 cycles prepared to get Ranges of 1
st visit
c) We get the Interval Computations Ranges minimum, maximum and x_med of each unit of
time
Figure 9 Ranges of the first visit

Intervals Computation - Human Gait cycle Follow Up of a subject with Hemiparetic stroke Jorge Garza-Ulloa
Intervals Computation - Human Gait cycle Follow Up of a subject with Hemiparetic stroke Jorge Garza-Ulloa
Nov 10, 2010 Page 7
We can summarize the data of the first visit on the next figure 10 :
Figure 10 ranges of first visit
2) From the second visit of the subject on Apr 28, 2010 we have another 1200 data captured. The
subject received Hydrotherapy therapy and improve the speed and we get 7 cycle on 1200 unit
time of .1 sec
Figure 11 Raw Data of Second visit
Intervals Computation - Human Gait cycle Follow Up of a subject with Hemiparetic stroke Jorge Garza-Ulloa
Intervals Computation - Human Gait cycle Follow Up of a subject with Hemiparetic stroke Jorge Garza-Ulloa
Nov 10, 2010 Page 8
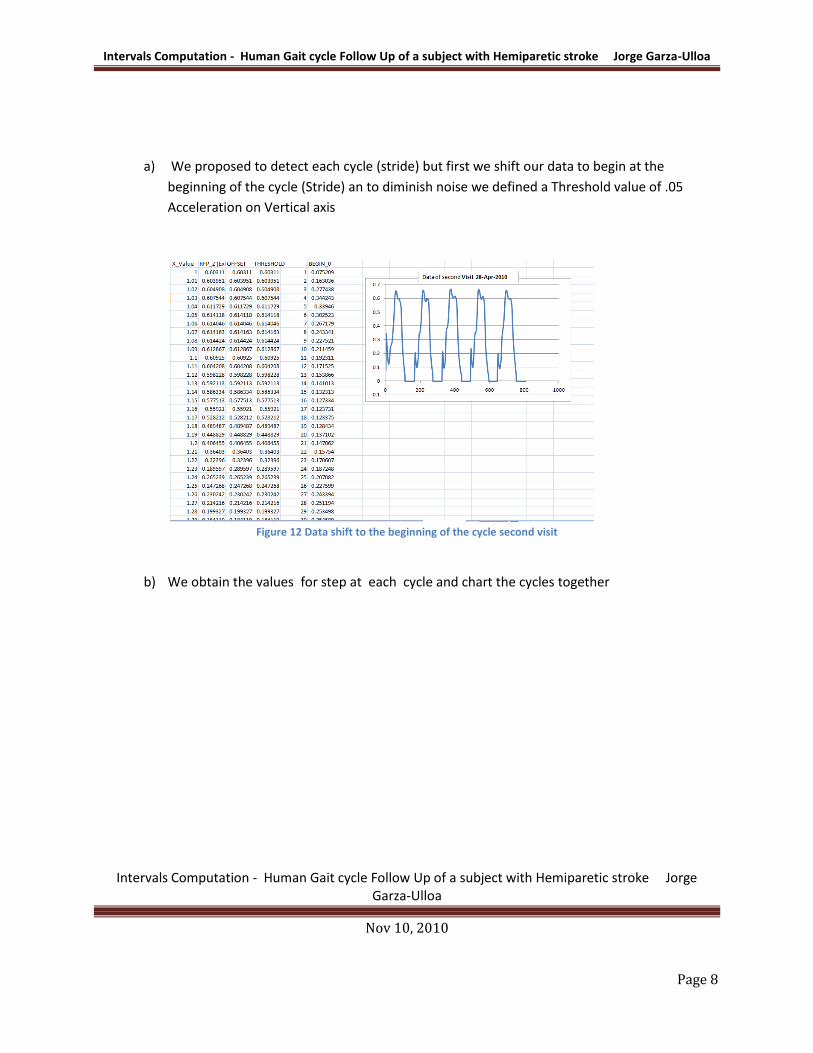
a) We proposed to detect each cycle (stride) but first we shift our data to begin at the
beginning of the cycle (Stride) an to diminish noise we defined a Threshold value of .05
Acceleration on Vertical axis
Figure 12 Data shift to the beginning of the cycle second visit
b) We obtain the values for step at each cycle and chart the cycles together

Intervals Computation - Human Gait cycle Follow Up of a subject with Hemiparetic stroke Jorge Garza-Ulloa
Intervals Computation - Human Gait cycle Follow Up of a subject with Hemiparetic stroke Jorge Garza-Ulloa
Nov 10, 2010 Page 9
Figure 13 cycles prepared to get Ranges of 2nd visit
c) We get the Interval Computations Ranges minimum, maximum and x_med of each unit of
time
Figure 14 Ranges of the second visit
3) Chart the 2 interval computations range with the expected behavior and found a way to
measure the improvement graphically.
How can we compare the next charts for Follow up if they have different speed?

Intervals Computation - Human Gait cycle Follow Up of a subject with Hemiparetic stroke Jorge Garza-Ulloa
Intervals Computation - Human Gait cycle Follow Up of a subject with Hemiparetic stroke Jorge Garza-Ulloa
Nov 10, 2010 Page 10
Figure 15 how compare 3 chart with different speed on the Human Gait cycle for a follow-up
It is important to mention the a Healthy Subject has a Delta very small and the subject
with stroke has a big delta
The normal Human Gait Cycle is form.9 to 1.2 sec.
A Human Being with mobility related impairment really cares about speed for walking?
Answer: the subject with mobility impairment doesn’t care about it because simply it cannot do it!
Then we need to define a new term On Human Gait Cycle:
GRC (Gait Relative Coefficient) = actual speed/Expected speed of the subject
Speed ( m/s ) GRC (Gait Relative Coefficient )
First Visit _Subject 0.25 0.2632
Second Visit_ Subject 0.5 0.5263
Normal Healthy Subject .95 1
Average of Delta=X_max -X_med Max_Delta
First Visit _Subject 0.032746 .212285
Second Visit_ Subject 0.0188 0.1027
Normal Health Subject 0.007027 0.039825 Figure 16 Table of Delta from Ranges

Intervals Computation - Human Gait cycle Follow Up of a subject with Hemiparetic stroke Jorge Garza-Ulloa
Intervals Computation - Human Gait cycle Follow Up of a subject with Hemiparetic stroke Jorge Garza-Ulloa
Nov 10, 2010 Page 11
The GRC must be applied on the Unit Time Figure 17 Table of Gait Relative Coefficient
Using the GRC calculated we chart them:
Fig. 18 Show the 2 visits compare with the expected behavior
How can we differentiate when a subject is doing a good Gait cycle independent of speed?
Answer: Expected Rate Cycle ( ERC ) of the Healthy Subject =60/40 ( 60 stance 40 swing)
Based on this we need a Coefficient Factor (CF)
CF=ARC/ERC
Where ERC is the Expected Rate Cycle and ARC the Actual coefficient Cycle
-0.1
0
0.1
0.2
0.3
0.4
0.5
0.6
0.7
0.8
0.9
-20 0 20 40 60 80 100 120
Min_Normal
Max_Normal
Min_Visit_1
Max_Visit_1
Min_Visit_2
Max_Visit_2
Coefficient Factor (CF) using X_Med
Coefficient Factor (CF) Ranges
First Visit _Subject 3 [2.96,3.04]
Second Visit_ Subject 2 [1.97,2.03]

Intervals Computation - Human Gait cycle Follow Up of a subject with Hemiparetic stroke Jorge Garza-Ulloa
Intervals Computation - Human Gait cycle Follow Up of a subject with Hemiparetic stroke Jorge Garza-Ulloa
Nov 10, 2010 Page 12
With this analysis we find a methodology for easy follow-up deducting a relation that indicate
in a range how was sick the subject before and after treatment and/or medication related with the
expected cycle of a healthy subject. The result of this methodology is based on the result of three
parameters:
Coefficient Factor (CF), GRC (Gait Relative Coefficient) and Max_Delta
These factors are summarized in the next table:
Normal Healthy Subject 1 [0.99 ,1.01]
Figure 19 Table of Coefficient Factor

Intervals Computation - Human Gait cycle Follow Up of a subject with Hemiparetic stroke Jorge Garza-Ulloa
Intervals Computation - Human Gait cycle Follow Up of a subject with Hemiparetic stroke Jorge Garza-Ulloa
Nov 10, 2010 Page 13
Discussion:
The result indicates a big improvement in all the coefficients analyzed from the first visit to the
second visit proving the treatment is getting good results. This methodology covers the 3 main factors
than can affect the Gait Cycle:
Deviations on strides ( Cycle Human Gait) that is reflected on the Max_delta value obtained
from the variations on ranges
For a good equilibrium the standard of the main phases of walking 60% stance and 40% swing
are covered by Coefficient Factor (CF) that is obtained from dividing the Actual Rate Cycle by
Expected Rate Cycle ( CF=ARC/ERC )
The common speed of walking from .95 to 1.2 m/s is covered by the Gait Relative Coefficient
(GRC) that is obtained dividing the actual speed of the subject by the Expected speed
It is important to mention that the max amount of Ground Reaction force to walk is not so
important to the follow-up that is a special characteristic of each human being.
Figure 20 Table showing the three coefficients for follow-up
Intervals Computation - Human Gait cycle Follow Up of a subject with Hemiparetic stroke Jorge Garza-Ulloa
Intervals Computation - Human Gait cycle Follow Up of a subject with Hemiparetic stroke Jorge Garza-Ulloa
Nov 10, 2010 Page 14
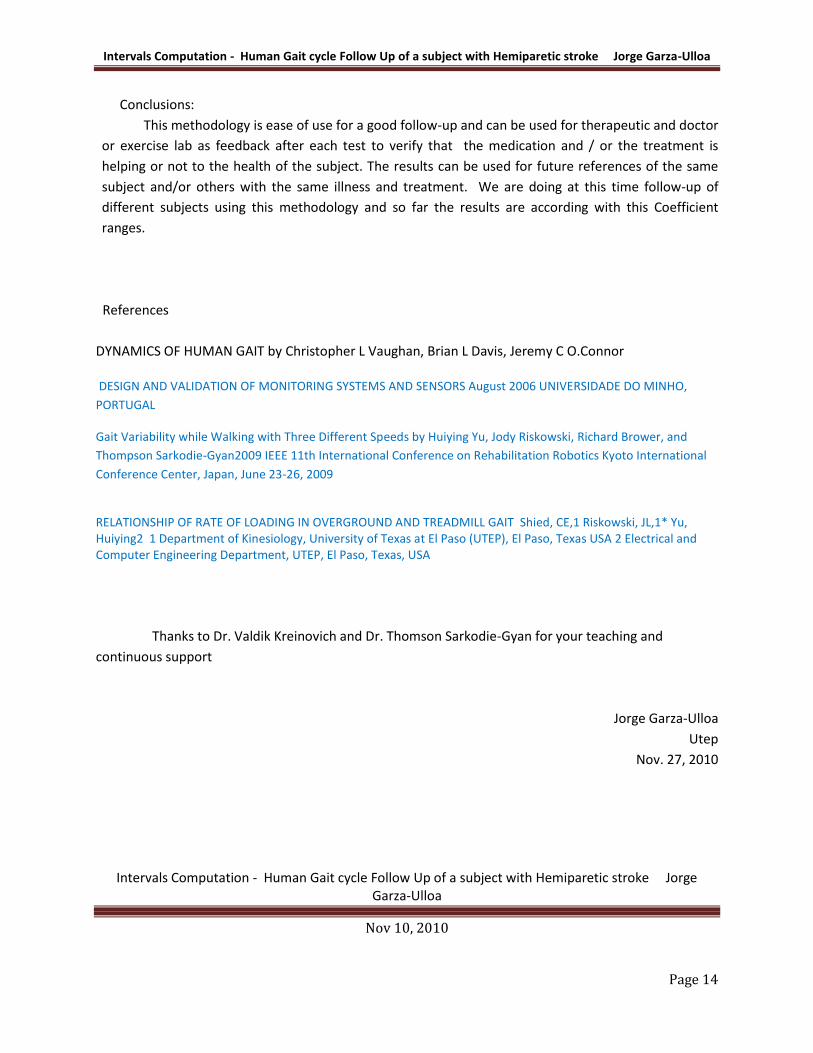
Conclusions:
This methodology is ease of use for a good follow-up and can be used for therapeutic and doctor
or exercise lab as feedback after each test to verify that the medication and / or the treatment is
helping or not to the health of the subject. The results can be used for future references of the same
subject and/or others with the same illness and treatment. We are doing at this time follow-up of
different subjects using this methodology and so far the results are according with this Coefficient
ranges.
References
DYNAMICS OF HUMAN GAIT by Christopher L Vaughan, Brian L Davis, Jeremy C O.Connor DESIGN AND VALIDATION OF MONITORING SYSTEMS AND SENSORS August 2006 UNIVERSIDADE DO MINHO,
PORTUGAL
Gait Variability while Walking with Three Different Speeds by Huiying Yu, Jody Riskowski, Richard Brower, and
Thompson Sarkodie-Gyan2009 IEEE 11th International Conference on Rehabilitation Robotics Kyoto International
Conference Center, Japan, June 23-26, 2009
RELATIONSHIP OF RATE OF LOADING IN OVERGROUND AND TREADMILL GAIT Shied, CE,1 Riskowski, JL,1* Yu, Huiying2 1 Department of Kinesiology, University of Texas at El Paso (UTEP), El Paso, Texas USA 2 Electrical and Computer Engineering Department, UTEP, El Paso, Texas, USA
Thanks to Dr. Valdik Kreinovich and Dr. Thomson Sarkodie-Gyan for your teaching and
continuous support
Jorge Garza-Ulloa
Utep
Nov. 27, 2010