Focused Concept Miner (FCM): Interpretable Deep Learning ......Keywords: Interpretable Machine...
44
Focused Concept Miner (FCM): Interpretable Deep Learning for Text Exploration Dokyun “DK” Lee, Emaad Ahmed Manzoor, Zhaoqi Cheng {Dokyun, Emaad, Zhaoqi}@cmu.edu Carnegie Mellon University ⇤ (Working Draft - Please Do Not Distribute) Previous Versions June 2018, October 2018, October 2019. This Version Dec 2019. Abstract We introduce the Focused Concept Miner (FCM), an interpretable deep learning text mining algorithm to (1) automatically extract interpretable high-level concepts from text data, (2) focus the mined concepts to explain user-specified business outcomes, such as conversion (linked to read-reviews) or crowdfunding success (linked to project descriptions), and (3) quantify the correlational relative importance of each concept for business outcomes against one another and to other explanatory variables. Compared to 4 interpretable and 4 prediction-focused baselines that partially achieve FCM’s goals, FCM attains higher interpretability, as measured by a variety of metrics (e.g., automated, human-judged), while achieving competitive predictive performance even when compared to prediction-focused blackbox algorithms. The relative importance of discovered concepts provides managers and researchers with easy ways to gauge potential impact and to augment hypotheses development. We present FCM as a complimentary technique to explore and understand unstructured textual data before applying standard causal inference techniques. Applications can be found in any setting with text and structured data tied to a business outcome. We evaluate FCM’s performance on 3 datasets in e-commerce, crowdfunding, and 20-NewsGroup. Plus, 2 experiments investigate the accuracy-interpretability relationship to provide empirical observations for interpretable machine learning literature along with the im- pact of focusing variables on extracted concepts. The paper concludes with ideas for future development, potential applications, and managerial implications. Keywords : Interpretable Machine Learning, Deep Learning, Text Mining, Automatic Con- cept Extraction, Coherence, Transparent Algorithm, Managerial Exploratory Tool, XAI. ⇤ Equal contributions by all authors. We thank Olivier Toubia, Jey Han Lau, David Blei, Arun Rai, Sudhir K., Carl Mela, Alex Burnap, Panos Ipeirotis, Alan Montgomery, Lan Luo, Gedas Adomavicius, Dinesh Puranam, Joy Lu Tong, George Chen, Mingfeng Lin, Daehwan Ahn, Lizhen Xu, DJ Wu, Saby Mitra, Sri Narasimhan, Doug Chung, Elie Ofek, John A. Deighton, Navid Mojir, and participants of Marketing Science Conference 2018 and 2019, Conference on Information Systems and Technologies 2018, Conference on Digital Marketing and Machine Learning 2018, Advanced Computing in Social Sciences and Businesses Symposium 2019, Choice Symposium 2019, INFORMS 2019, Conference on AI, ML, and Digital Analytics 2019, KRAIS ICIS 2019, seminar audiences at McGill University, KoreaAdvanced Institute of Science andTechnology, Seoul National University, University of Pittsburgh, University of Southern California, University of Minnesota, HEC Paris, and University of Maryland, Georgia Institute of Technology, Harvard University for very helpful comments or conversations that shaped the paper. We gladly acknowledge generous grants by Nvidia for research, Marketing Science Institute Grant # 4000562. All errors are our own. www.fcminer.com will contain project details in the future. 1 Electronic copy available at: https://ssrn.com/abstract=3484617
Transcript of Focused Concept Miner (FCM): Interpretable Deep Learning ......Keywords: Interpretable Machine...

Focused Concept Miner (FCM): Interpretable Deep Learning for
Text Exploration
Dokyun “DK” Lee, Emaad Ahmed Manzoor, Zhaoqi Cheng
{Dokyun, Emaad, Zhaoqi}@cmu.edu
Carnegie Mellon University
⇤
(Working Draft - Please Do Not Distribute)Previous Versions June 2018, October 2018, October 2019.
This Version Dec 2019.
Abstract
We introduce the Focused Concept Miner (FCM), an interpretable deep learning text miningalgorithm to (1) automatically extract interpretable high-level concepts from text data, (2) focusthe mined concepts to explain user-specified business outcomes, such as conversion (linked toread-reviews) or crowdfunding success (linked to project descriptions), and (3) quantify thecorrelational relative importance of each concept for business outcomes against one another andto other explanatory variables. Compared to 4 interpretable and 4 prediction-focused baselinesthat partially achieve FCM’s goals, FCM attains higher interpretability, as measured by a varietyof metrics (e.g., automated, human-judged), while achieving competitive predictive performanceeven when compared to prediction-focused blackbox algorithms.
The relative importance of discovered concepts provides managers and researchers with easyways to gauge potential impact and to augment hypotheses development. We present FCM as acomplimentary technique to explore and understand unstructured textual data before applyingstandard causal inference techniques.
Applications can be found in any setting with text and structured data tied to a businessoutcome. We evaluate FCM’s performance on 3 datasets in e-commerce, crowdfunding, and20-NewsGroup. Plus, 2 experiments investigate the accuracy-interpretability relationship toprovide empirical observations for interpretable machine learning literature along with the im-pact of focusing variables on extracted concepts. The paper concludes with ideas for futuredevelopment, potential applications, and managerial implications.
Keywords: Interpretable Machine Learning, Deep Learning, Text Mining, Automatic Con-cept Extraction, Coherence, Transparent Algorithm, Managerial Exploratory Tool, XAI.
⇤Equal contributions by all authors. We thank Olivier Toubia, Jey Han Lau, David Blei, Arun Rai, SudhirK., Carl Mela, Alex Burnap, Panos Ipeirotis, Alan Montgomery, Lan Luo, Gedas Adomavicius, Dinesh Puranam,Joy Lu Tong, George Chen, Mingfeng Lin, Daehwan Ahn, Lizhen Xu, DJ Wu, Saby Mitra, Sri Narasimhan, DougChung, Elie Ofek, John A. Deighton, Navid Mojir, and participants of Marketing Science Conference 2018 and2019, Conference on Information Systems and Technologies 2018, Conference on Digital Marketing and MachineLearning 2018, Advanced Computing in Social Sciences and Businesses Symposium 2019, Choice Symposium 2019,INFORMS 2019, Conference on AI, ML, and Digital Analytics 2019, KRAIS ICIS 2019, seminar audiences at McGillUniversity, Korea Advanced Institute of Science and Technology, Seoul National University, University of Pittsburgh,University of Southern California, University of Minnesota, HEC Paris, and University of Maryland, Georgia Instituteof Technology, Harvard University for very helpful comments or conversations that shaped the paper. We gladlyacknowledge generous grants by Nvidia for research, Marketing Science Institute Grant # 4000562. All errors areour own. www.fcminer.com will contain project details in the future.
1
Electronic copy available at: https://ssrn.com/abstract=3484617

1 Introduction
It is becoming imperative for businesses to efficiently process and understand text data, given thatmore than 90% of data is estimated to be unstructured (Gantz and Reinsel, 2011), 68% of which isconsumer generated (Mindtree, 2017). Content creators like Netflix and Amazon are collecting usercontent consumption data and feedback reviews to create new shows tailored for success (Wernicke,2015). Companies like C&A Marketing have entire teams of people who read through reviews onAmazon and eBay to identify consumer needs and use them to create new products (Feifer, 2013).After the decades-long surge of unstructured data, retailers and researchers are getting better atutilizing text data to obtain actionable insights, whether it is consumer preferences extracted fromreviews or default probability gleaned from crowdfunding descriptions (Netzer et al., 2019).
Yet, despite the deluge of potentially insightful data, studies show that nearly 80% of enterprisesdon’t know how to manage unstructured data (Rizkallah, 2017), and $3 trillion in value goes uncap-tured globally in text data alone (McKinsey, 2016). We believe this is due in part to the lack of textmining methodologies that (1) emphasize the high-level interpretability of automatically extractedconcepts (by concept, we mean a singular coherent construct), (2) extract concepts that are directlylinked to an existing Y of business importance to explain it, and (3) provide an importance weightto mined concepts in relation to one another and in the context of other structured exploratoryvariables to gauge their potential economic significance. For a text mining method to be useful formanagers, all three requirements must be met. In this paper, we introduce the Focused ConceptMiner (FCM), a novel deep learning-based text mining algorithm that (1) inherently increases in-terpretability of mined concepts as quantified by both human judgements and a coherence metric(Mimno et al., 2011) (a measure from topic modeling literature that measures how singular andcoherent a set of keywords is also called topic interpretability) compared to existing techniques,(2) is focused on mining concepts guided by Y specified by the user, and (3) can provide the corre-
lational relative importance of mined concepts compared to user-specified referential X (predictorvariables). We outline the algorithm in Algorithm 1 and visualize it in Figure 1. By applyingFCM, managers should be able to quickly make sense of and extract insights from a large amountof textual data tied to a business outcome before launching a more involved causal inference studyfor prescriptive policy.
We discuss existing approaches to achieve the partial output described in Algorithm 1 in Sec-tion 2, as well as the novel aspects of FCM. Figure 2 presents a flow chart for concept mining andwhen to use FCM over other methods. We evaluate FCM’s performance on a unique dataset thattracks individual-level review reading, searching, and purchasing behaviors on an e-commerce site.Applying FCM to this dataset can extract the product review content read by consumers that iscorrelated to higher conversion rates and illustrate how this content compares to other consumerbrowsing and click behaviors, as is commonly used in the industry and research. The results and ex-
Algorithm 1 Focused Concept Miner: Algorithm Overview
Input (1) Optional Structured X (e.g., numerical, categorial) (2) Textual X (corpus) (3) Y of businessimportance (numerical, categorical) linked to corpus and X
Output (1) Focus-mined concepts predictive of Y (2) Correlational relative importance of concepts againstone another and against structured X (3) predictive model
Features (1) Improved interpretability of mined concepts (2) Potential new concept finding (3) Focusedconcepts based on Y (4) Joint estimation of structured X and text that is end-to-end (in onepipeline) (5) No need for pre-defined human-tagged training data (6) Inductive inference for newunseen data (7) Online learning via mini-batch gradient descent
2
Electronic copy available at: https://ssrn.com/abstract=3484617

periments show that FCM does indeed provide more human-interpretable concepts, as measured byhuman-judged metrics and coherence metric in comparison to similar, yet feature-lacking methods.In addition, FCM automatically uncovered concepts from consumer-read product reviews that theconsumer behavior literature found to be important for conversion this provides an instance of ex-ternal validity. Furthermore, FCM performs better than existing techniques in predicting conversionusing both structured X and text data. More importantly, FCM provides the relative importance ofmined concepts compared to other X, so that managers may understand the economic importanceof the extracted concepts. Lastly, we enhance the model to show at what position in the review-reading process these mined concepts matter more in predicting consumers’ conversion decisions.Taken together, we demonstrate how FCM can be applied to extract valuable insights from text toinform managerial practices. We also run FCM on a crowdfunding dataset to demonstrate robust-ness in Section 5.6 and 20-newsgroup (Appendix E). Additionally, we run series of experiments toinvestigate the accuracy-interpretability relationship to provide empirical observations. Our contri-bution is thus a new method for text exploration with a focus on demonstrating method potentials,business use-cases, and experimental results on accuracy-interpretability relationship to add to theinterpretable machine learning literature.
In comparison to related methods, FCM excels in extracting coherent focused concepts andpredictions due to the following conceptual reasons:
1. Focused: Concept mining is guided by a user-specified Y of business importance to extract Yrelevant concepts. This seems counterintuitive since it seems to add an additional constraint.On the flipside, text is high dimensional data and providing Y effectively reduces hypothesesspace. Focusing by Y refines the task more accurately for the algorithm.
2. Semantic Similarity Knowledge: Word representation that learns semantic relationshipsis used. It also uses both local and global contextual information to focus-mine concepts.
3. Concept Diversity & Sparsity: The model forces discovered concepts to be distinct fromeach other (diversity) and to be pithy (sparsity).
4. End-to-End: Focus-mined concepts and other explanatory X are jointly estimated to predictoutcome variable in an end-to-end (one pipeline optimization) fashion. This ensures that themodel shares information from the beginning to the end and is more efficient.
The end result is a deep learning-based exploratory method specifically constructed for derivingvalue from textual data in business settings with managers in mind. It performs in one optimizationstep what may have taken managers many steps worth of text mining and processing tasks, oftenfilled with ad-hoc feature engineering and unclear methods for defining and constructing coherentand interpretable concepts. FCM demonstrates that deep learning approaches, normally associatedwith a lack of interpretability and considered blackbox, could be utilized to help businesses betterunderstand textual data.
3
Electronic copy available at: https://ssrn.com/abstract=3484617

Figure 1: FCM Features Visualized with Use-case Example.
We end this introduction with caveats on what FCM can and cannot do, its envisioned usage, anda description of the use-case presented in this paper. Firstly, FCM is an exploratory and non-causaltechnique that is predictive in nature1. Rather, we see FCM as a complimentary technique to exploreand understand a large amount of textual data before zeroing-in on a hypothesis-driven causal study.New concepts extracted from FCM can inform further in-depth causal investigations. FCM couldserve as an essential tool to empirically explore and refine exploding volumes of unstructured textdata in an empirical-theoretical-empirical-theoretical (ETET)2 approach to management science, asdiscussed by Ehrenberg (1994), or as a tool to recover Empirical Generalization3 in managementscience, as discussed by Bass (1995). As we will demonstrate, two use cases of FCM include:
• Consumer-read Content Insights: Figuring out what content consumers care about in productreviews before making purchases. Reviews read are the text data, product-level and consumer-leveldata are the referential X , and conversion is the Y . FCM discerns what content consumers care aboutand the quantifies concept correlation to conversion.
• Successful Crowdfunding Content: Exploring the type of well-funded crowdfunding project, suchas on Kickstarter or Donorchoose. Project descriptions are the text data, project details are X , andthe funding’s success is the Y . FCM can discern which projects are funded more successfully.
Section 2 introduces the interpretable machine learning literature then discusses existing relevanttext mining techniques in relation to FCM. Section 3 unfolds the model. Then, we describe theproprietary review dataset used to demonstrate FCM in Section 4. Section 5 touches on differentaspects of the algorithm’s performance in relation to existing baseline models and other extensions.Accuracy-interpretability experiments are presented in Section 5.5 and Section 5.6 runs FCM oncrowdfunding data while-exploring the impact of Y on mined concepts. We discuss limitationsand future ideas for FCM in Section 6 and conclude with managerial implications and severalhypothetical use-cases of FCM in management science.
1Extracted concepts and estimations were robust for +500 different runs. However, causality is beyond the scopeof this method. Instead, we discuss the challenges and potential ways to use FCM for causal inference in Section 6.
2Ehrenberg (1994) posits that management science needs an empirical-theoretical-empirical-theoretical (ETET)approach in which a researcher would “1) Establish some empirically well-grounded theory and 2) Test the theorymore widely, deduce new conjectural theory, test that widely, and continue”.
3Bass (1995) describe Empirical Generalization as “a pattern or regularity that repeats over different circumstancesand that can be described simply by mathematical, graphic, or symbolic methods”.
4
Electronic copy available at: https://ssrn.com/abstract=3484617

Concept s t o mi ne ar e NOT known
apr i or iUse 1) Human Taggi ng2) Seeded LDA3) Human Taggi ng + Super vi sed Lear ni ng t o Scal e ( Lee et al 2018, Li u et al 2019, Ti moschenko & Hauser 2019)PLUSAny pr edi ct i ve model - - - - - - - - - - - - - - - - - - - - - - - - - - - - - - - -Di scover s New Concept s ?Hi ghl y Coher ent Concept s ? Concept Cor r el at i onal Wei ght s ?Hi gh Pr edi ct i on Power ?NO Human Taggi ng Cost ?
Pr edi ct i on FocusVS
I nt er pr et abi l i t y
YESPr edi ct i on i s al l I need
Use 1) Deep Lear ni ng Model s ( LSTM, CNN, et c)2) XGBoost- - - - - - - - - - - - - - - - - - - - - - - - - - - - - - - - - -Di scover s New Concept s ?Hi ghl y Coher ent Concept s ? Concept Cor r el at i onal Wei ght s ?Hi gh Pr edi ct i on Power ?No Human Taggi ng Cost ?
Need t o gui de concept mi ni ng wi t h
a busi ness var i abl e?
Gl obal ( cor pus- l evel ) concept s common
acr oss document s needed
I need I nt er pr et abi l i t y
Use LDA PLUS Any pr edi ct i ve model - - - - - - - - - - - - - - - - - - - - - - - - - - - - - - - -Di scover s New Concept s ?Hi ghl y Coher ent Concept s ? Concept Cor r el at i onal Wei ght s ?Hi gh Pr edi ct i on Power ?No Human Taggi ng Cost ?
YES
FLOWCHART FOR
CONCEPT MINING
Use 1) Deep Lear ni ng Model s ( LSTM, CNN, et c)2) XGBoostPLUSPost hoc expl anat i on met hods such as LI ME and SHAP- - - - - - - - - - - - - - - - - - - - - - - - - - - - - - - -Doc- Level Wor d- I mpor t ance ?Di scover s New Concept s ?Hi ghl y Coher ent Concept s ? Concept Cor r el at i onal Wei ght s ?Hi gh Pr edi ct i on Power ?No Human Taggi ng Cost ?
NONO
NO
YES
Use Super vi sed LDA OR STMPLUSAny pr edi ct i ve model - - - - - - - - - - - - - - - - - - - - - - - - - - - - - -Di scover s New Concept s ?Hi ghl y Coher ent Concept s ? Concept Cor r el at i onal Wei ght s ?Hi gh Pr edi ct i on Power ?No Human Taggi ng Cost ?
Hi ghl y coher ent ( f ocused) concept s
needed
NO
Use FOCUSED CONCEPT MINER- - - - - - - - - - - - - - - - - - - - - - - - - - - - - - -Di scover s New Concept s ?Hi ghl y Coher ent Concept s ? Concept Cor r el at i onal Wei ght s ?Hi gh Pr edi ct i on Power ?No Human Taggi ng Cost ?
YES
ACRONYMS EXPLAI NEDLDA: Lat ent Di r i chl et Al l ocat i on STM: St r uct ur al Topi c Model sLSTM: Long Shor t - Ter m Memor yCNN: Convol ut i onal Neur al NetLI ME: Local I nt er pr et abl e Model - Agnost i cSHAP: SHapl ey Addi t i ve exPl anat i onsXGBOOST: Ext r eme Gr adi ent Boost i ng
Figure 2: Flowchart for Concept Mining and When to Use FCM. See Section 2 for Literature.
2 Literature
Broadly, the task described in Algorithm 1 is applicable in many settings where text data is linked toa business outcome. For clarity, take for example a consumer purchase (Y-var) related to consumerbehavior on the web (X-var) and the reviews the consumers read as a text input. The manager maywant to 1) predict conversion from user behavior and reviews read, 2) investigate what behavior (X-vars) may predict conversion, and 3) delve deeper into the review text, to understand what contentmay be highly correlated to conversion. FCM can be used for all of these tasks, but its focus isprimarily on the 3rd problem. Normally, deriving insights from text is tackled with a multi-stepapproach involving several different techniques, as discussed in the next section. We conceptuallyoutline a popular supervised learning framework to extract the economic importance of text inbusiness data as shown in Lee et al. (2018) and Liu et al. (2019). Figures 3 show two approaches.The first is a multi-step approach, Figure 3a, which emphasizes text insight extraction—the 3rdproblem. One would first apply concept mining algorithms such as Latent Dirichlet Allocation oraspect mining (to be discussed in the next subsection), which aim to reduce and extract topicsfrom text either supervised or unsupervised. Mined concepts can then enter any classificationor regression framework as X for prediction and correlational relative importance. As discussednext and in the results section, this framework suffers from poor interpretability, lack of focus bythe Y , and subpar prediction accuracy when compared to FCM. Next, a manager that prioritizeshigh predictive performance may apply recent advances in deep learning (Figure 3b), such as longshort-term memory (LSTM) which excel at processing sequential data or convolutional neural nets(CNN) which recover local-level feature patterns to aid prediction (for details, see Goldberg (2016)).
5
Electronic copy available at: https://ssrn.com/abstract=3484617

However, this approach offers no insight from the text on why conversion might have happened.For further interpretable insights, post hoc processing to open up the blackbox must be appliedsuch as LIME (Ribeiro et al., 2016) or SHAP (Lundberg and Lee, 2017). We defer the discussion ofthis methods to Section 2.1, but Guidotti et al. (2018) offers a great survey. However, this multi-step approach often results in fragmented local-level concepts specific to individual data point (i.e.,specific to a document and not corpus), unlike FCM—that is, users cannot get high-level global
concepts from any post hoc explanation method on deep learning.In Section 2.1, we discuss what it means for an algorithm to be more “interpretable” by intro-
ducing the XAI (eXplainable Artificial Intelligence) and interpretable machine learning literature.We discuss several definitions of interpretability and choose operationalizable ones to come up withmetrics to compare FCM against existing techniques. Next, we discuss two relevant literatures thatprovide competing techniques from computer science (pertaining to extracting content and conceptsfrom text data) and similar applications (content extraction from text) from business. We point outthe conceptual differences of FCM compared to other techniques. We defer the technical details toSection 3 and interpretability measurement details to Section 3.7.
Reviews & Other data
Concept Mining (E.g., Topic models, Supervised Content)
Classification Using Concepts as X-vars (e.g., Neural Net, Linear Regression)
Output Prediction
(a) Multi-step Framework to Predict and Extract Insight from Text: A manager wishing to automaticallyextract concepts from text may approach with this multi-step machine learning framework.
Reviews & Other data
Feature Engineering + Classification (Deep Learning: LSTM, CNN, Recursive RNN)
Output Prediction
(b) Deep Learning Framework to Predict Conversion: A manager who wants high predictive performancemay apply recent advances in deep learning. However, this offers no insight from the text on why conversion mighthave happened. For further interpretable insights, post hoc processing to open up the blackbox must be applied.Guidotti et al. (2018) surveys different methods to do so. However, this approach results in fragmented concepts,unlike FCM. Middle LSTM graphic taken from https://colah.github.io/
Figure 3: Conceptual Frameworks to Predict Outcome and Derive Insights from Text.
2.1 Interpretable Machine Learning (ML)
The success of high-performing blackbox algorithms such as deep neural networks (LeCun et al.,2015) and boosted trees (Chen and Guestrin, 2016) is well documented. For example, top-performingalgorithms in data science competitions, such as those on Kaggle.com, are almost always one of the
6
Electronic copy available at: https://ssrn.com/abstract=3484617

mentioned two.4 The current challenge, however, is to help humans to fully understand thesealgorithms. These blackbox algorithms are too complicated for humans to fully discern why certainpredictions were made. These algorithms do not give any rationale for predictions and attemptingto figure them out is prohibitively expensive, if not impossible, due to their sheer intricacy. Thisis an especially significant issue when deployed on business intelligence systems that deal withconsumer data, such as in automated credit approval and investments where auditability, liability,privacy, and other high-stake issues are entangled. In fact, the EU implemented GDPR (GeneralData Protection Regulation) as of May 2018 to protect consumers and to encourage algorithmictransparency among firms while in that same year DARPA announced $2 billion in initiatives forbuilding the next generation of XAI (eXplainable Artificial Intelligence).
In most business settings or in non-trivial situations, understanding why algorithms made cer-tain predictions is critical to prevent egregious failures, justify usage, improve efficiency, and toultimately use for decision making. Blackbox failures have been well documented. Angwin et al.(2016) and Wexler (2017) report cases of algorithmic racial bias in bailout decisions (stemming frombiased training data obfuscated by the opaqueness of the algorithm), and even instances where thealgorithms incorrectly denied parole. Egele et al. (2012) report training a deep net to distinguishregular code from malware. The system ended up picking up a signal of badly written comments inthe code rather than actual code content. Zech et al. (2018) report training a deep vision net in thecontext of medical disease prediction based on x-rays. The system keyed on the meta-tagged word“portable”—reflective of where the samples came from—instead of a valid signal for disease. Addi-tional consequences continue to pile up as blackbox algorithms are utilized without interpretability.
In response to the need for interpretability in machine learning algorithms, several sub-streamsof research have boomed since mid-2010s (Please see Guidotti et al. (2018); Gilpin et al. (2018) forsurveys). The stream most related to our work is the XAI literature, which broadly defines (Rudin,2019) two different algorithm families for interpretability.
Definition 1 (Explainable Machine Learning): Given a blackbox predictor B and a trainingdataset D = {X,Y }, the explainable machine learning algorithm takes as an input a blackbox Band a dataset D, and returns a transparent predictor T with requirements that 1) T replicatesthe prediction of blackbox predictor B with high fidelity, and 2) T offers human-understandablerationale for each prediction either at the instance-level or model-average level. T may be a shallowtree, small set of rules, or linear regression with not too many explanatory variables.
Definition 2 (Interpretable Machine Learning): Interpretable machine learning algorithmsrefer to inherently transparent algorithms that provide human-understandable rationale for predic-tions yet still offer competitive performances compared to prediction-focused blackbox algorithms.
In this framework, our paper falls under the category of interpretable machine learning algo-rithms.
While the XAI literature has grown significantly for the last five years and will continue to do so,the definition of “interpretability” still remains an illusive, fragmented, and domain-specific notion(Rudin, 2019; Lu et al., 2020) left to the researcher and user to define. Lipton (2016) states “Boththe motives for interpretability and the technical descriptions of interpretable models are diverse andoccasionally discordant, suggesting that interpretability refers to more than one concept.” A recentcomprehensive survey of XAI literature, Guidotti et al. (2018), concludes by stating that “One ofthe most important open problems is that, until now, there is no agreement on what an explanationis.” There have been several attempts to define this. To briefly paraphrase a few sampled works,Doshi-Velez and Kim (2017) state “Interpretability is the degree to which a human can consistently
4According to Kaggle.com co-founder Anthony Goldbloom. https://www.linkedin.com/pulse/lessons-from-2mm-machine-learning-models-kagglecom-data-harasymiv/
7
Electronic copy available at: https://ssrn.com/abstract=3484617

predict the model’s result”, Miller (2018) state “Interpretability is the degree to which a humancan understand the cause of a decision”, and Dhurandhar et al. (2017) state “AI is interpretableto the extent that the produced interpretation I is able to maximize a user’s target performance”.Few papers also tackle desiderata for interpretability conceptually, such as unambiguity (input andoutputs are clear), selectiveness (a parsimonious explanation that does not overwhelm the user),contrastiveness (a “had input been x, output would have been y” type of explanation), factative(has to be highly truthful), etc. (Lipton, 2016; Doshi-Velez and Kim, 2017; Miller, 2018; Ras et al.,2018; Murdoch et al., 2019; Lu et al., 2020).
In this paper, we incorporate insights from XAI literature, as well as interpretability in topicmodeling literature, to propose to measure the “interpretability” by 1) tapping into existing inter-pretability measurements in topic modeling called coherence, 2) confirming the coherence measurewith human-judgement directly from mechanical turk, and 3) operationalizing the definition byDhurandhar et al. (2017) into our problem-specific metric and measuring it directly with humansubjects from mechanical turk. We discuss the measures in Section 3.7.
2.2 Finding Concepts in Text: Topic Modeling & Others
The algorithms of interest related to our method include any method which partially achieves thegoal outlined in Algorithm 1.
Within machine learning (ML) literature, natural language processing (NLP) is primarily con-cerned with extracting meaningful concepts from a given text. NLP literature offers several waysto achieve the outcome described in Algorithm 1. An initial approach might be to apply any super-vised machine learning algorithm on Input (as defined in Algorithm 1) to treat individual words orn-grams (collections of n contiguous words) as X to predict the Y of business interest. Using anycombination of feature selection methods (Chandrashekar and Sahin, 2014), a data scientist maybe able to extract several keywords or n-grams that could potentially explain the business outcome.However, these methods usually provide a fragmented list of words without enough coherence tobe effective in extracting prescriptive, policy-worthy concepts. Once they have a list of salient andinformative words from these analyses, managers must drill down further to manually draw outseveral coherent concepts, which is a subjective rather than objective procedure. After this, it isstill unclear how a manager may be able to gauge the economic impact of singular concepts thatcan consist of several different key words.
The sub-area of sentiment analysis called aspect-based sentiment analysis may offer tools topartially achieve the goal of Algorithm 1. This analysis is concerned with mining opinions fromtext about 1) specific aspects of focal products or subjects and 2) sentiment valence of these as-pects (Liu, 2012). Specifically, an aspect extraction sub-task can be used to reveal key concepts ofthe text (please see Pontiki et al. (2016) for task descriptions and relevant papers). Briefly sum-marized, aspect extraction in product opinion mining utilizes a series of smaller techniques andheuristics to figure out concepts that describe product aspects. For example, most algorithms firstidentify adjectives in text using part-of-speech tagging and then conduct additional filtering basedon informativeness and importance. This set of techniques lacks the features to achieve the goalof Algorithm 1 because 1) the discovered aspects are usually very simple and specific to a productor subject in the text, further requiring managers to manually identify more complex concepts bycombining collections of words; 2) aspect extraction cannot be supervised by Y of business im-portance; 3) these techniques often require domain knowledge to feature engineer and extract outaspects, which defeats the exploratory purpose of identifying new concepts in unexplored text dataas outlined in Algorithm 1; and 4) while aspect-based sentiment analysis is usually concerned withproduct reviews and is thus unclear in how it extends to other texts, FCM goes beyond product
8
Electronic copy available at: https://ssrn.com/abstract=3484617

reviews and can be applied to any text data.One of the most relevant and influential bodies of work that focuses on automatically summariz-
ing and extracting concepts from text data is topic modeling literature. Latent Dirichlet Allocation(LDA) (Blei et al., 2003) is a probabilistic generative model that seeks to identify latent topics thatcomprise a collection of textual data (corpus). Very briefly described, LDA assumes that a topic isa probabilistic distribution over a finite set of vocabularies and that a document consists of severaldifferent topics (specified by the user). Then, the method estimates a hierarchical Bayesian architec-ture with an expectation-maximization algorithm to converge on document-topic distribution andtopic-word distribution. The end result is that a user gets a probability vector of topics for eachdocument (document-topic vector) and a bag-of-words with loadings to describe topics (topic-worddistribution).
While LDA is a seminal work, it cannot achieve the goal outlined in Algorithm 1 because it isan unsupervised algorithm. Given prior domain knowledge, a user cannot guide the algorithm todiscover certain topics or provide a variable for algorithms to adjust the topics. Seeded LDA byJagarlamudi et al. (2012) extends the original LDA to enable users to guide the topics based onuser-inputted topic words while supervised versions of LDA (Blei and Mcauliffe, 2008; Zhu et al.,2012) modified the original model to guide topics discovered with user-specified variables. Lastly,Structural Topic Model (STM (Roberts et al., 2014)) can both incorporate X and be supervised.Yet these algorithms (1) cannot provide relative importance compared to other explanatory X, (2)do not jointly optimize with the given explanatory X and discovered topics, and, most importantly,(3) lack learning interpretable topics or concepts, as discussed by Chang et al. (2009). In otherliterature streams, several papers tackle how to increase the semantic-coherence of topic models(see Mimno et al. (2011) for a good introduction). However, these models lack the ability to focus-mine topics from a variable of interest, as mentioned previously. Finally, a handful of recent papersexplore deep learning-based models that combine word embedding (Mikolov et al., 2013a) and LDAto collaboratively improve the quality of latent topics and word embedding (Xun et al., 2017),to improve discovered topics and word embeddings via topic-specific word embeddings (Shi et al.,2017), and to jointly learn topic and word embeddings (Moody, 2016). However, these papers areagain missing several features, such as 1) the supervision of topic discovery guided by the Y , 2) thejoint estimation of structured and unstructured data to predict the Y , 3) inductive inference thatenables prediction given a new unseen data, and 4) fall behind FCM in predictive performance aswell as interpretability. In summary, we are not aware of any methodologies that achieve the sameoutput as our model.
2.3 Content Extraction Via NLP in Business
Natural language processing has been applied to a variety of different textual data for businessinsights and applications. Some studies are dedicated to extracting and measuring brand perception,market trends, and marketing efforts from social media data (Netzer et al., 2012; Culotta and Cutler,2016; Lee et al., 2018), while many are dedicated to extracting content and signals out of customer-generated product review data (Decker and Trusov, 2010; Archak et al., 2011; Lee and Bradlow,2011). In the context of crowdfunding platforms, Netzer et al. (2019) apply text mining to identifysignals for loan default.
Here, we mention papers concerned with methodology or the applications of automatically ex-tracting concepts or topics from textual business data. To the best of our knowledge, most papersin business research that seek to automatically extract concepts and topics from text data involvesome variation of LDAs. Tirunillai and Tellis (2014) apply LDA to consumer-generated review datato extract latent dimensions of consumer satisfaction. Buschken and Allenby (2016) extend the
9
Electronic copy available at: https://ssrn.com/abstract=3484617

traditional LDA model to restrict one topic per sentence and achieve better extraction of conceptfrom user-generated product reviews. Puranam et al. (2017) apply LDA in a restaurant reviewsetting to see the impact of health regulation on what consumers talk about and on word-of-mouth.Liu and Toubia (2018) extends LDA and develop Hierarchically Dual Latent Dirichlet Allocation,then apply it in a search setting to infer consumers’ content preferences based on their queries onthe fly. Toubia et al. (2018) apply positive psychology and a seeded LDA model by Jagarlamudiet al. (2012) in a consumer entertainment consumption setting to predict movie watching behavior.
The extant approaches in the literature echoing the discussion in Section 2.2 are missingmany of the features that we propose with FCM. While LDA methodology is a very useful andseminal work with many benefits, these models are not built to extract concepts from text dataguided by user-inputted variables nor to discern the relative importance of X in relation to minedconcepts, all of which are important in making sense and extracting actionable insights. Moreimportantly, as we show in Section 5.2, results from these models often yield incoherent and intruded(diffusion of concepts) topics with unclear ways to understand and utilize discovered topics as X.
On the other hand, some papers report success with multi-stage supervised machine learningapproaches in which pre-defined key content is first defined and tagged by humans and then usedto train NLP algorithms to scale to larger unseen data. In this stream, Lee et al. (2018) utilizea traditional NLP approach to study what content (pre-defined and human-tagged content in in-formative and brand-personality advertising) companies should post on social media to increaseuser-engagement (like, comment, share, and click). Timoshenko and Hauser (2018) utilize a deeplearning NLP approach to extractively reduce user review data and identify content (pre-definedand human-tagged on informativeness) related to consumer needs. Liu et al. (2019) utilize a deeplearning NLP approach to investigate what content (pre-defined and human-tagged content in di-mensions of product price and quality) in user reviews influence consumer conversion.5 These papersrequire 1) ex-ante knowledge of what content to examine and 2) human-tagged labels on text datato answer particular business questions. In contrast, FCM needs neither and identifies conceptsautomatically. This is essential when managers do not have strong ex-ante knowledge and want todiscover concepts in text highly correlated to a specified Y for exploratory purposes.
3 Model
This section formalizes the notion of a focused concept in a neural network model and estimationdetails.
3.1 Definition of Focused Concept
We begin by defining focused concept. Broadly, a concept is an idea or a construct. Our model isdesigned to optimize the coherence of the uncovered concepts by associating with each concept acollection of semantically similar keywords that describe the central idea of the concept; for exam-ple, a concept associated with the words “beautiful, large, lovely” is essentially one that embodies“aesthetics”. Intuitively, individual words form the most basic concept – an atomic concept. Severalwords together form a more complex concept. The key idea is that concept and word, abstractlyspeaking, can live in the same space. This particular idea has been successfully utilized to quantify
5They also propose a second convolutional neural net-based approach called the “full deep learning model”. Thegoal of this model is purely prediction, and while a post-hoc salient n-gram study was used to visualize what n-gramsmay have influenced the CNN model prediction, this does not 1) extract coherent concepts guided by a Y-var and 2)cannot provide the relative importance of concept correlation to a Y-var.
10
Electronic copy available at: https://ssrn.com/abstract=3484617

DimensionsD Number of documentsT Number of conceptsV Vocabulary sizeE Embedding sizek Window sizem Number of negative samples
Learned ParametersEw Word embedding matrix (V⇥E)Et Concept embedding matrix (T⇥E)W Document-concept weights (D⇥T )✓ Concept-classification weights (1⇥T )
CAN Concept Allocator Network
Intermediate Elementsd Document indexbd
Bag-of-words document vectorw, c Pivot, context word indicesvw
, vc
Pivot, context word embeddingsCk
(w) Set of context word indicesN
m
(w) Set of negative samplesLoss Weights
� Dirichlet sparsity strengths⌘ Diversity regularizer strength⇢ Classification loss strength
Table 1: Notation
complex concepts such as gender and ethnic stereotypes (Garg et al., 2018) and cultural conno-tations (Kozlowski et al., 2018) directly from text data using a technique called Word2Vec, whichcomprise the first layer of FCM and will be elaborated next. FCM builds on this proof-of-conceptvia a carefully constructed novel architecture, loss function, and regularization terms, to ensure thatextracted concepts are both focused by the outcomes in the data, and diverse in the sense that notwo concepts have a significant overlap (i.e., the concepts are segregated). The proposed model canbe trained on any large corpus of documents and their associated outcomes, and the concepts canbe recovered from the model parameters.
Relating to the underlying mathematics of the model, concept is defined as:
Concept a vector in a semantic-similarity-aware vector space. Similar vectors in this space havesimilar role and meaning in natural language. A concept can be represented by a word orcollection of words local to each other.
Focused-Concept a representative vector for a collection of words, where the words in the collec-tion have similar semantics and high correlation to Y. Simply, a concept highly correlated toY.
Connection to topics in topic modeling literature is simple. Topics are defined as distribution overwords and a topic consists of words that co-occur frequently in documents. In connection to topics:
Concept Topic + additional constraint that all words describing this topic are semantically similar.
In the rest of this section, we describe the model by introducing each of its components and theirmotivation, and finally tie them all together and discuss various forms of data that the model maybe trained on. Our notation is summarized in Table 1.
3.2 Embedding Words, Documents, and Concepts
Embedding words. We begin by modeling the distribution of words in each document. We relyon the distributional hypothesis in linguistics (Rubenstein and Goodenough, 1965; Sahlgren, 2008),which states that words used together in similar contexts tend to have similar meanings.6 Recent
6In the words of linguist John Rupert Firth: “You shall know a word by the company it keeps.”
11
Electronic copy available at: https://ssrn.com/abstract=3484617

models based on this hypothesis have demonstrated state-of-the-art performance on various naturallanguage processing tasks (Mikolov et al., 2013a,b; Pennington et al., 2014). We follow the exampleof word2vec (Mikolov et al., 2013a), which encodes the distributional hypothesis as a neural networkto find vector representations of words such that semantic-spatial relationships are preserved—thatis, “similar” words lie nearby in the embedding space. For clarity, we adopt the model derivationand notation from Goldberg and Levy (2014).
To this end, we represent each word w by a real-valued vector vw
of length E, called its embedding.If we denote the vocabulary of all words in our corpus of documents by V , the embeddings are storedas rows in a matrix Ew of dimension |V|⇥E. We denote by C
k
(w) the set of context words aroundthe pivot word w within a symmetric k window size. The pivot word w is the center word used topredict the surrounding context words c 2 C
k
(w). We define the likelihood of a corpus of documentsin terms of their words and contexts. Given a corpus (a document d, or collection of documents),its likelihood is defined as:
Y
d2corpus
Y
w2document d
Y
c2Ck
(w)
p(c|w;Ew) (1)
This is essentially a mathematical formulation of the distributional hypothesis in linguistics: theprobability of a document is defined in terms of the conditional probability of each context word cgiven its corresponding pivot word w. Given a context word c and its pivot word w, we would liketo capture the fact that words occurring in the same context often should have similar embeddings.Hence, we parameterize the conditional probability p(c|w;Ew) as follows:
P (c|w;Ew) =
evc·vwPc
02V evc0 ·vw(2)
where vc
and vw
are the embeddings of c and w. Our goal is to learn the embeddings Ew thatmaximize the likelihood of the observed data in eq.(1).
However, computing the conditional probability term in eq. (2) involves a computationally ex-pensive summation in the denominator over all possible words in the vocabulary, of which there maybe hundreds of thousands. Hence, we approximate this objective via skip-gram negative sampling
(Mikolov et al., 2013b).Let D be the set of all observed pivot-context word pairs in the corpus, and D0 be the set of all
pivot-context pairs that do not occur in the corpus. For a given a pivot-context word pair (w, c), letP ((w, c) 2 D|Ew) be the probability that this pair occurs in the corpus, and let P ((w, c) /2 D|Ew) =
1 � P ((w, c) 2 D|Ew) be the probability that the pair does not occur in the training corpus. Wewould like to find Ew such that the likelihood of the observed pivot-context pairs is maximized,while the likelihood of the unobserved pivot-context pairs is minimized. This is captured by thefollowing objective:
max
Ew
Y
(w,c)2D
P ((w, c) 2 D|Ew)Y
(w,c)2D0
P ((w, c) /2 D|Ew
) (3)
We can parameterize the probability P ((w, c) 2 D|Ew) using the logistic-sigmoid function�(x) = (1 + exp(�x))�1 that scales its argument to lie in (0, 1):
P ((w, c) 2 D|Ew
) = �(vw
· vc
) =
1
1 + e�v
c
·vw
(4)
Plugging eq. (4) into eq. (3) and taking logarithms leads to the following objective:
12
Electronic copy available at: https://ssrn.com/abstract=3484617

max
Ew
log(Y
(w,c)2D
P ((w, c) 2 D|Ew
)
Y
(w,c)2D0
P ((w, c) /2 D|Ew))
= max
Ew
X
(w,c)2D
log(P ((w, c) 2 D|Ew)) +X
(w,c)2D0
log(P ((w, c) /2 D|Ew))
= max
Ew
X
(w,c)2D
log1
1 + e�v
c
·vw
+
X
(w,c)2D0
log(1� 1
1 + e�v
c
·vw
)
= max
Ew
X
(w,c)2D
log1
1 + e�v
c
·vw
+
X
(w,c)2D0
log1
1 + evc·vw
= max
Ew
X
(w,c)2D
log(�(vc
· vw
)) +
X
(w,c)2D0
log(�(�vc
· vw
)) (5)
The computationally expensive summation over all possible (w, c) 2 D0 in the second term canbe approximated by summing over m negatively-sampled pivot-context pairs D
m
. The sampling isperformed as follows for every (w, c) 2 D: sample (w, c01), (w, c
02), . . . , (w, c
0m
) such that (w, c0i
) /2 Dand each c0
i
is drawn with probability proportional to its frequency7 in the corpus, P (c0i
) = n(c0i
)/Nwhere n(w) is the frequency of word w in the corpus and N is the number of words in the corpus.
Converting the maximization to a minimization problem yields the first component of the loss
function
8 that our method seeks to minimize:
Lneg = �X
(w,c)2D
log(�(vc
· vw
)) �X
(w,c)2D0
log(�(�vc
· vw
)) (6)
where � is the logistic sigmoid function �(x) = (1 + exp(�x))�1 as defined earlier, m is thenumber of negative samples and k is the window-size. Taking a closer look at this loss function, weobserve that the first summation operates over all pivot-context pairs in the corpus to ensure thatwords occurring often in the same context have similar embeddings. The second term operates overeach pivot-context pair that does not occur in the corpus, to encourage them to have dissimilar
embeddings.Embedding documents and concepts. We now describe an extension of the model to capture
“concepts” (collections of coherent words relating to easily interpretable ideas) by combining ideasfrom Mikolov et al. (2013a) and Moody (2016). We assume the existence of a fixed number ofconcepts T , and assume that the words of each document are drawn from a distribution over theseT concepts. We store the unnormalized form of this distribution (the “concept weights” for eachdocument) in matrix W of dimension D ⇥ T , where D is the number of documents in the corpus.Each concept is represented by its own embedding of length E, stored in a matrix Et of dimensionT ⇥ E; note that the concept embeddings lie in the same space as the word embeddings, which iscrucial for each concept to be interpreted by a collection of keywords. Given the concept embeddingsEt and concept weights W, the embedding of a document v
d
can be derived as a weighted linearcombination of its concept embeddings, in line with our earlier assumption. We first transform the
7Note that Mikolov et al. (2013b) use the frequency exponentiated to 3/4 which provided superior empiricalperformance.
8An alternative method to obtain word embeddings is via factorization of the shifted pairwise mutual information(PMI) matrix Levy and Goldberg (2014). However, formulating the objective this way eliminates the flexibility toextend the model to incorporate several objectives such as concepts, supervision, and diversity, to be discussed laterin this section.
13
Electronic copy available at: https://ssrn.com/abstract=3484617
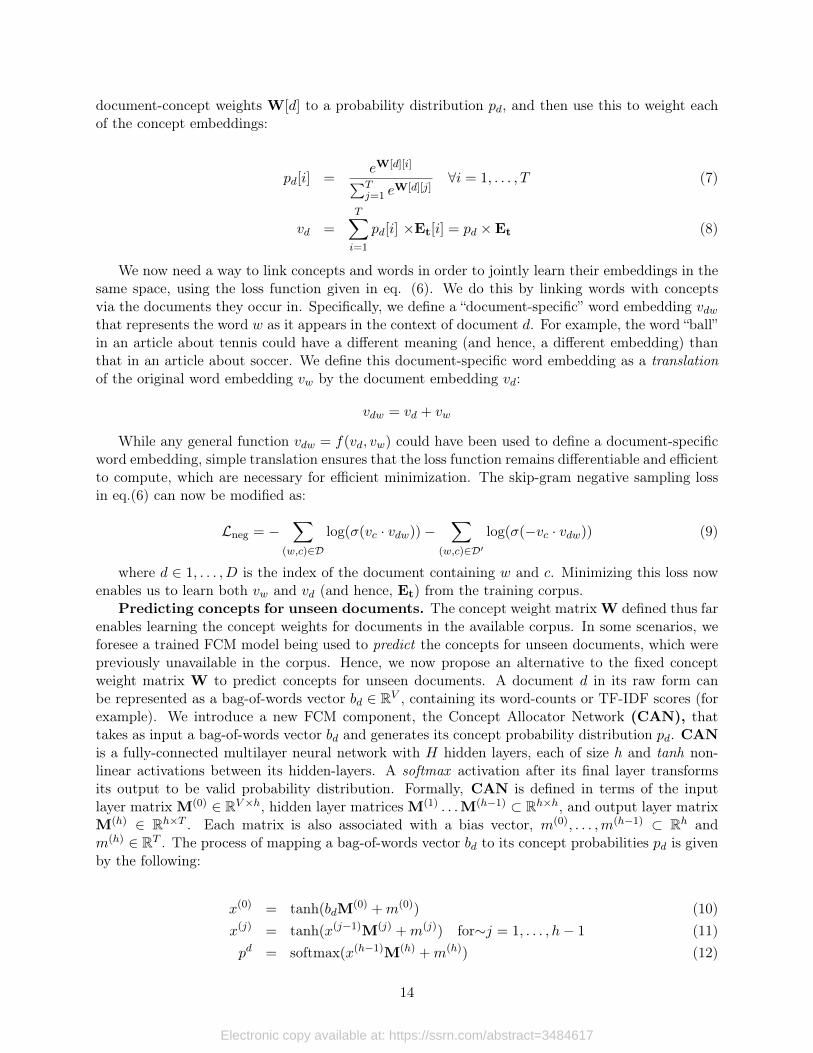
document-concept weights W[d] to a probability distribution pd
, and then use this to weight eachof the concept embeddings:
pd
[i] =
eW[d][i]
PT
j=1 eW[d][j]
8i = 1, . . . , T (7)
vd
=
TX
i=1
pd
[i] ⇥Et[i] = pd
⇥Et (8)
We now need a way to link concepts and words in order to jointly learn their embeddings in thesame space, using the loss function given in eq. (6). We do this by linking words with conceptsvia the documents they occur in. Specifically, we define a “document-specific” word embedding v
dw
that represents the word w as it appears in the context of document d. For example, the word “ball”in an article about tennis could have a different meaning (and hence, a different embedding) thanthat in an article about soccer. We define this document-specific word embedding as a translation
of the original word embedding vw
by the document embedding vd
:
vdw
= vd
+ vw
While any general function vdw
= f(vd
, vw
) could have been used to define a document-specificword embedding, simple translation ensures that the loss function remains differentiable and efficientto compute, which are necessary for efficient minimization. The skip-gram negative sampling lossin eq.(6) can now be modified as:
Lneg = �X
(w,c)2D
log(�(vc
· vdw
)) �X
(w,c)2D0
log(�(�vc
· vdw
)) (9)
where d 2 1, . . . , D is the index of the document containing w and c. Minimizing this loss nowenables us to learn both v
w
and vd
(and hence, Et) from the training corpus.Predicting concepts for unseen documents. The concept weight matrix W defined thus far
enables learning the concept weights for documents in the available corpus. In some scenarios, weforesee a trained FCM model being used to predict the concepts for unseen documents, which werepreviously unavailable in the corpus. Hence, we now propose an alternative to the fixed conceptweight matrix W to predict concepts for unseen documents. A document d in its raw form canbe represented as a bag-of-words vector b
d
2 RV , containing its word-counts or TF-IDF scores (forexample). We introduce a new FCM component, the Concept Allocator Network (CAN), thattakes as input a bag-of-words vector b
d
and generates its concept probability distribution pd
. CANis a fully-connected multilayer neural network with H hidden layers, each of size h and tanh non-linear activations between its hidden-layers. A softmax activation after its final layer transformsits output to be valid probability distribution. Formally, CAN is defined in terms of the inputlayer matrix M(0) 2 RV⇥h, hidden layer matrices M(1) . . .M(h�1) ⇢ Rh⇥h, and output layer matrixM(h) 2 Rh⇥T . Each matrix is also associated with a bias vector, m(0), . . . ,m(h�1) ⇢ Rh andm(h) 2 RT . The process of mapping a bag-of-words vector b
d
to its concept probabilities pd
is givenby the following:
x(0) = tanh(bd
M(0)+m(0)
) (10)x(j) = tanh(x(j�1)M(j)
+m(j)) for⇠j = 1, . . . , h� 1 (11)
pd = softmax(x(h�1)M(h)+m(h)
) (12)
14
Electronic copy available at: https://ssrn.com/abstract=3484617

where the softmax function transforms its vector-valued input into a probability distribution:
softmax(x)[i] =ex[i]
PT
j=1 ex[j]
8i = 1, . . . , T
Thus, CAN replaces the concept weight matrix W to generate the concept probabilities pd
from the document’s bag-of-words vector bd
. Like W, CAN is jointly trained with the other FCMparameters. The hidden-layer size and number of hidden layers in CAN are hyperparameters thatwe tune via cross-validation.
Encouraging concept sparsity. In reality, we expect each document to embody only a fewconcepts, with the others being barely present or completely absent. This sparsity of the document-concept distribution is also easier to interpret and inspired by LDA. To enforce sparsity on thedocument-concept distribution, we append the product of the document-concept probabilities p
d
tothe loss function, transformed logarithmically to prevent numerical underflow (since the product ofmany probabilities will be a very small floating point number). This leads to the following “Dirichletloss” term weighted by hyper-parameter �, which approximately penalizes the document-conceptdistributions for having too many non-zero probability values:
Ldir
= �log(DY
d=1
TY
k=1
pd
[k]) = �DX
d=1
TX
k=1
log(pd
[k]) (13)
Note that, while penalizing the L0 norm kpd
k0 8d = 1, . . . , D would enforce sparsity exactly,it is non-differentiable, leading to issues when minimizing the loss function using gradient descent.Penalizing the product of the probabilities (or the summation of the log-probabilities) as aboveserves to approximate the sparsity objective while remaining differentiable and efficient to compute.
Encouraging concept diversity. The model described so far tends to learn concepts that arehighly overlapping, especially when a few concepts are significantly more prevalent in the corpusthan others. To better capture less prominent but potentially important concepts, we introduce anovel extension that we term the “diversity regularizer” on the model. This regularizer encouragesevery pair of concept embeddings Et[i],Et[j] to be dissimilar in terms of their dot-product. This isformulated as the following extension to the loss function:
Ldiv =⌘
TX
i=1
TX
j=i+1
log �(Et[i] ·Et[j]) (14)
where ⌘ is a hyper-parameter that controls the strength of the prior, and the log� log-sigmoidtransformation ensures that this term and its gradient lie on the same scale as the other terms inthe loss function.
3.3 Focusing Concepts on Target Outcomes
In practice, the concepts embodied by documents may fall into several different descriptive modes.For example, the set of concepts “furniture”, “technology”, and “kitchen” describe the category ofproduct being sold, whereas the set of concepts “aesthetics”, “functionality”, and “reliability” describecharacteristics of the product being sold; both these descriptive modes may exist simultaneously inthe corpus, and our goal is to uncover the one that best explains the given outcome associated witheach document.
Hence, we introduce a loss component that “focuses” the concepts toward explaining these out-comes. We assume that the target outcomes are binary, y
d
2 {0, 1}8d = 1, . . . , D, though extensions
15
Electronic copy available at: https://ssrn.com/abstract=3484617

to real-valued outcomes are straightforward. We introduce a parameter vector ✓ 2 RT that assignsan explanation-weight to each concept, that is shared across all documents. Given the explanationweights ✓ and the document-concept distribution p
d
, define yd
for a document d as a weightedcombination of its concept probabilities:
yd
= ✓ · pd
(15)
Given the observed outcome yd
, we would like yd
to be large if y = 1 and small if y = 0. Thisrequirement is captured by the following cross-entropy loss term that we append to the overall lossfunction weighted by hyper-parameter ⇢:
Lclf = ⇢(yd
log �( ˆyd
) + (1� yd
) log(1� �( ˆyd
)))
Note that we could also add any user-specified X in Equation 15. This 1) increases predictionpower and 2) allows managers to compare the correlational relative importance of mined conceptsto key-referential X. We discuss this extension in Section 5.4 and in particular Equation 17.
3.4 Model Summary
In each training iteration, the input for the model is the pivot word w, the set of context words fromthe size-k window C
k
(w), the index d of the document and the outcome y. The complete modelincorporates all the losses defined in the previous sections, leading to the following loss function foreach input iteration:
L(w,Ck
(w), d, y) = Lneg(w,Ck
(w)) + Ldir(d) + Ldiv + Lclf(d, y)
To prevent longer documents (those with more words) from contributing disproportionatelymore to the loss, we also scale it by the length l
d
2 (0, 1) of each document which is inverselyproportional:
Lcorpus =X
d,y2Corpus
X
w2doc d
L(w,Ck
(w), d, y)⇥ 1
ld
The model architecture is visualized in Figure 4. This diagram describes the raw input to themodel, how the input constitutes the matrices to be estimated by the FCM, further processing bythe model using the matrices, and final output that enters the loss function to be minimized. Thisdiagram describes how the data flows through the neural network model.
We construct train, validation, and test sets using 70%, 15%, and 15% of the full data, respec-tively. To improve generalizability, we regularize W and ✓ with their L2 norm, perform dropout onE and gradient clipping to prevent exploding gradients. We initialize our algorithm with pre-trainedword2vec word-vectors, trained in an unsupervised fashion on a corpus of 100 billion words fromGoogle News. We train the model using mini-batch stochastic gradient descent with a batch-size of10,240 on an Nvidia Titan X Pascal with 12GB of GPU memory. The estimation roughly took 2hours on this hardware specification to get to 200 epochs.
16
Electronic copy available at: https://ssrn.com/abstract=3484617

context index v
pivot index u
document index d
Ew
W
Et
Ew[v]
pd
zd+x
Ldirichlet
Lneg
cud
Ew[u] Ldiv
document label y
xθ Lclf
CAN
CAN pdbd
BOW Vector
Concept Allocator Network Fully-connected Networktanh non-linear activations
Concept probabilities
|V| T
Figure 4: FCM Model Architecture
3.5 Describing Concepts
Given the trained model, one way to describe concepts mined is to 1) get concept embedding vectorsand 2) find the closest word vectors for each concept vectors. We take this approach and use thedot product distance. Other generative models such as recurrent neural networks could be utilizedto generate sentence-level description of concepts, but this is beyond the scope of this paper.
3.6 Measure of Predictive Performance
To measure the performance of different models, we use a receiver operating characteristics (ROC)curve, which compares the true positive rate (TPR) against the false positive rate (FPR) at differ-ent discrimination thresholds. The Area Under the ROC curve is called AUC, which captures theprobability that a model ranks a randomly chosen positive sample higher than a randomly chosennegative sample. In general, a classifier with higher AUC tends to have better predictive perfor-mance. For example, a random guess classifier yields an AUC of 0.5, while a perfect model yieldsan AUC of 1. Additionally, we show simple accuracy, precision, recall, and F1 score.9
3.7 Measure of Interpretability
To measure the interpretability of model output, we define and use three different metrics as dis-cussed in Section 2.1
1. Coherence: This is a measure as defined by Mimno et al. (2011) from the topic modelingliterature. This measure computes the sum of a pairwise score function on the top n wordsw1, w2.., wn
used to describe each topic:
Coherence =X
i<j
log
D(wi
, wj
) + 1
D(wi
)
(16)
where D(wi
) is the count of documents containing the word wi
, and D(wi
, wj
) is the countof documents containing both words w
i
and wj
. Simply put, the coherence metric measures9Measures are defined as accuracy (the total % correctly classified), precision (out of predicted positives, how many
are actually positive), recall (out of actual positives, how many are predicted as positives), and F1 = 2⇤Precision⇤Recall
Precision+Recall
(the harmonic average of precision and recall)(Jurafsky, 2000).
17
Electronic copy available at: https://ssrn.com/abstract=3484617

how well-focused the group of top topic key words are in describing a singular concept. Ahigher topic coherence means that the key words within one topic dimension are more coherentwith each other in concept. Note that while the measure of coherence originates from topicmodeling literature, it is directly applicable to any set of keywords—it simply measures howcoherent a set of keywords is in describing a singular concept. The topic modeling literaturefirst came up with ways to detect “interpretability” by human judgement through mechanicalturk (Chang et al., 2009), then the “coherence” construct was validated with domain experttaggers who “annotated [topics] as ’good’ if they contained words that could be groupedtogether as a single coherent concept” (Mimno et al., 2011). Next, automated measures wereconstructed that seem to perform as well as or better than humans (Mimno et al., 2011;Newman et al., 2010; Lau et al., 2014). For example, metrics based on word co-occurrencesand mutual information based on an external corpus such as Wikipedia are more representativeof how humans would evaluate a topic as interpretable (Newman et al., 2010). From the XAIliterature perspective, this measure of interpretability fits the desiderata of unambiguity (Raset al., 2018) and selectivity of explanation (Lipton, 2016; Miller, 2018).
2. 1st Human-judged - Number of Distinct Concepts Found: Using Amazon MechanicalTurk, we directly obtain the number of distinct concepts found in algorithm outputs. Eachtopic or concept would be more useful and interpretable if it describes fewer distinct concepts.This parallels the coherence measure but is more direct.
3. 2nd Human-judged - Usefulness of Algorithm Output for the Particular TargetTask: We use the definition of interpretability from Dhurandhar et al. (2017)—which states“AI is interpretable to the extent that the produced interpretation I is able to maximize a user’starget performance”—and operationalize it in our case. As the next section elaborates, thedata context is the consumer purchase journey and reviews read. Thus, the target goal here ismaking a purchase decision. Therefore, if we apply the definition of Dhurandhar et al. (2017),the algorithm output that extracts concepts from reviews that are more helpful for makinga purchase decision should be considered more interpretable. We ask Amazon MechanicalTurkers to provide the usefulness of algorithm outputs for making a purchase decision.
4 Demonstration of FCM on a Novel Data
To demonstrate the efficacy of FCM, we apply it to a proprietary novel dataset from a top consumerreview platform. We explain the data here.
4.1 Raw Data
Our data comes from an online retailer in the United Kingdom through a top review platformcompany. They track 243,000 consumers10 over the course of two months in February and Marchof 2015 in the electronics and home & garden categories. There are 41 different subcategories, asshown in Appendix A. The data tracks consumer page views, review-reading behavior, clicks, andtransactions. That is, the data includes the typical clickstream and conversion data plus consumers’review-reading behaviors, which is essential for FCM application. The data also records (1) when a
10The users are assigned an anonymous unique identifier, which enables us to effectively analyze customer browsinghabits and transaction activity at the individual level. The user identifier persists in the third-party network cookieand lasts for up to 18 months. Even if a user has cleared their cookies or is browsing on another device, we can stillidentify them through an encrypted IP address.
18
Electronic copy available at: https://ssrn.com/abstract=3484617

user clicks on review pages, (2) whether each review has appeared on a user’s browser, and (3) forhow long the content was viewed on the user’s browser, measured accurately down to milliseconds.With these data, we assume that if a review appeared on a user’s browser, the user has read thereview.
4.2 Processed Data for FCM
From the perspective of a user shopping procedure, we can imagine a “decision-making journey”that characterizes how a user purchases or abandons a particular product. In such a journey, auser will first visit the product page to read the description, then read reviews of the product,and finally decide whether to buy the product or not. Accordingly, our dataset is at the “decision-making journey” or at the UserID-ProductID level. A data sample contains (1) the product reviewtexts read by the user, (2) the explanatory variables shown to matter in predicting the purchaseconversion in business literature (e.g., product price and review star ratings), and (3) a binary labelindicating conversion. Next, we discuss selection criteria and data construction.
Selection Criteria & Data Frame Construction
We first define the scope of UserID-ProductID pairs (“journey”). These pairs are used to identifythe journeys and serve as the primary key for our constructed data frame. We keep all existingUserID-ProductID pairs in the raw dataset, except we remove users who do not read any reviewsand products that have no viewed reviews, since FCM requires meaningful text linked to businessoutcome variables.
The next step is to process the review texts. On the website, reviews are presented in groups offive. Consumers can read more reviews by clicking on the review page numbers. For each journey,we collect all the reviews that the consumer has read, sort them by browsing time, and concatenatethem into a single document. This constitutes the text data of interest. As 88% of the journeyshave less than 10 reviews read, we take the final 10 reviews read by consumers before they purchaseor abandon.
Lastly, as the total conversion rate is 1.37%, there are many more journeys that ended in abandon(negative label) than conversion (positive label). Considering that the imbalance might negativelyaffect the performance of the trained FCM, we under-sample the negative pairs to reduce the classimbalance, achieving an abandon-to-purchase ratio of roughly 77:23. Finally, our constructed dataframe is left with 58, 229 journeys of 30, 218 unique consumers and 6, 612 unique products. Of thesejourneys, 13, 094 yield user purchases.
Table 2 presents the summary statistics of the explanatory variables at product, user, or journeylevels.
19
Electronic copy available at: https://ssrn.com/abstract=3484617

Variable Variable-Level
Definition Count
Product ID Product Total number of products 6612
User ID User Total number of unique users who have read
reviews
30218
Content ID Product Total number of reviews 87593
Variable Variable-Level
Definition Mean Std Dev Min Max
Price Product Price of the product 63.28 84.41 0.24 1049
Rating Average Product Average rating of reviews available for the
product
4.28 0.49 1 5
Prod Total # Page
views
Product Total number of page views for a particular
product
141.79 178.02 2 3280
Prod Total # Reviews Product Total number of reviews available for the product 66.37 117.27 1 1463
User Total Wallet size User Total dollar value of transaction made by a user 104.68 171.76 0 3968.79
User Total # of
Reviews Read
User Total Number of Reviews read by a user 48.73 75.22 1 2675
User-Prod Page views Journey Total number of page views for a particular
user-product pair
3.25 2.64 1 100
User-Prod # of
Reviews Read
Journey Total number of reviews read in a journey 10.90 13.85 1 376
Table 2: Variable Summary Statistics
5 Results
The predictive performance of FCM in comparison to existing methods is presented first. Then, wediscuss the main goal of FCM to extract coherent and human interpretable concepts, first througha coherence metric and then through human-judged metrics. To gauge the economic impact ofmined concepts, we then present FCM’s ability to compare the correlational relative importance ofmined concepts to other structured explanatory variables. A series of experiments to investigatethe accuracy-interpretability relationship based on different hyperparameters are presented. Lastly,results on an additional dataset, Donorschoose, are presented along with the impact of Y focusingon extracted concepts.
5.1 Predictive Performance
For predictive performance measurement, data is split into 70% training, 15% validation, and 15%
test sets. The FCM takes the explanatory variables and the read-reviews as inputs to predict aprobability between 0 and 1 indicating how likely it is that the user will purchase or abandon theproduct. We set the number of concepts to recover at 5, which we chose via a perplexity measureon running a separate vanilla LDA model. The adaptive moment estimation (Adam) optimizer wasused for training the model with a learning rate of 0.001 and weight decay of 0.01. To preventoverfitting and gradient explosion, we set the dropout rate at 0.25 and clipped the gradients intothe range [�5.0, 5.0]. The model is trained on up to 500 different parameter configurations and ourmodel gives stable results across these sets. For brevity, all results hereafter are produced by themodel trained under the configuration � = 10, ⇢ = 1000, ⌘ = 1000.
20
Electronic copy available at: https://ssrn.com/abstract=3484617

The predictive performance is measured on 15% of the test sample using the accuracy, precision,recall, F1-score, and ROC AUC, as discussed in Section 3.6 in Table 3. Figure 5 shows the ROCcurve. We compare FCM’s predictive performance against two set of baseline models interpretablemodels vs. uninterpretable prediction-focused models. For all models, unless stated otherwise, weinclude all X and text information. For brevity, we provide a brief description of the model withthe citation for readers interested in more details.
Interpretable Models
• LDA + LR: Plain LDA + logistic regression classifier.• SLDA: Supervised LDA proposed by Blei and Mcauliffe (2008); Zhu et al. (2012) (model does
not allow other X).• SeedLDA + LR: Seeded LDA proposed by Jagarlamudi et al. (2012) + logistic regression
classifier. We seed the topics based on dimensions of price and quality as defined in theliterature and discussed in Table 4 to maximize its performance.
• Structural Topic Model: Structural Topic Model proposed by Roberts et al. (2014). In-corporates both X and natively handles Y .
Uninterpretable or Prediction-Focused Models
• BOW+LR: Bag-of-words approach + logistic regression classifier.• Sentiment: Review-level sentiment-labelled classification.• CNN with GLoVe: Deep Learning models excel at prediction tasks. Convolutional Neural
Net (CNN) was chosen since it was empirically shown to be superior to LSTM and RecursiveNeural Net for this particular dataset (Liu et al., 2019). We also utilize GLoVe word embedding(Pennington et al., 2014) as the first layer.
• XGB: eXtreme Gradient Boosting (Chen and Guestrin, 2016) is a boosted tree model oftenknown to achieve the best predictive performance in a wide variety of ML competitions off-the-shelf. Please see Footnote 4.
Figure 5 presents the ROC curves and the AUC values for the FCM (blue), 4 interpretable baselines(red), and 4 prediction-focused baselines (black). Table 3 provides accuracy, precision, recall, F1,and AUC. First note that all interpretable models (red) significantly fall behind FCM (blue). Whilethere are two uninterpretable algorithms (black) that surpass FCM, the difference is rather smallat less than 0.03 in AUC. Two uninterpretable algorithms perform worse than FCM.
Going into specific algorithms, as noted in Footnote 4, the top two performing algorithms are,unsurprisingly, deep learning and XGB. CNN with GLoVe embedding achieves the highest AUC at0.9186 with XGB performing nearly the same at 0.9184. FCM follows closely at 0.8885. Given thatwe could also boost (reduce bias) and bootstrap aggregate (reduce variance) FCM predictions, albeitat a higher computational cost, FCM performance is very much competitive with the cutting-edgeprediction-focused methods. Contrastingly, FCM performs significantly better than the traditionalbag-of-words approach (0.7773) and the basic sentiment analysis (0.6093).
Among the interpretable competitors, the best performing algorithm is the seeded LDA (0.8087).Our seed words were driven from existing theory in consumer purchase behavior as will be elaboratedin Section 5.2 and Table 4. As these are topics that are known and proven in the literature toinfluence consumer purchase decisions, it is unsurprising that this carefully domain-knowledge drivenattributes will have high predictive performance over naive bag-of-words approach. However, seededLDA still falls short of FCM, suggesting that FCM extracts residual signals above and beyond
21
Electronic copy available at: https://ssrn.com/abstract=3484617

Coherence Accuracy Precision Recall F1 score AUCFCM -1.86 0.8228 0.8346 0.8475 0.8410 0.8885
Interpretable Model CompetitorsLDA + LR -2.25 0.5653 0.5624 0.9630 0.7101 0.6086
SLDA -2.17 0.5857 0.6163 0.6641 0.6393 0.6041Seeded LDA+LR -1.95 0.7490 0.7945 0.7365 0.7644 0.8087
STM -5.13 0.5872 0.5977 0.7745 0.6747 0.6015Uninterpretable Model Competitors
BOW+LR N/A 0.7212 0.7231 0.8033 0.7611 0.7773Sentiment N/A 0.5804 0.5896 0.7925 0.6762 0.6093
CNN with GloVe N/A 0.8421 0.8307 0.8973 0.8627 0.9186XGB N/A 0.8475 0.8525 0.8757 0.8639 0.9184
Table 3: Prediction Performance Against Competing Methods
theory-driven concepts. Seeded LDA approach can be useful when managers are equipped withdomain-knowledge but not feasible for exploratory concept extraction. Other interpretable modelssuch as vanilla LDA (0.6086), supervised LDA (0.6041), and Structural Topic Models (0.6015), allperform worse than FCM even with good effort of parameter tuning. Appendix E presents FCM’spredictive performance against baselines for a well-known benchmark dataset called 20-Newsgroup,which show FCM excels even over XGB in some cases.
FCM excels in predictive performance over most baselines while staying competitive with thetop uninterpretable prediction-focused algorithms. Next we discuss the main goal performance ofFCM: interpretable and coherent concept extraction for managerial insight.
Figure 5: Receiver Operating Characteristics Curve of FCM vs. Baselines
5.2 Concept Extraction: Interpretability Comparison Based on Coherence
This section discusses the main ability of FCM to extract concepts that may be insightful anduseful for prescriptive business policy. As described in the Model section, FCM is not limited to
22
Electronic copy available at: https://ssrn.com/abstract=3484617

just generating topic-describing words as LDA or LDA variants are. However, we can generate wordsto describe the concepts, much like LDA, as described in Section 3.5. We do this here to compare theinterpretability of FCM-extracted concepts to those from LDA. Then we use the measure coherencedescribed in Equation 16.
Figure 6 shows five topics (topic N decided by perplexity measure) recovered by plain LDA asthe baseline. Out of 50 runs, we present the LDA result with the highest coherence of �2.25. Twoexperts then manually inspect the topics recovered and color-code similar conceptual words for easeof interpretation. Upon inspecting the LDA-recovered topic, we note the following observations.First, within a given topic, many different concepts appear. For example, Topic 1 has conceptsrelated to product names (orange), features (dark red), and aesthetics (green). All other topicssuffer the same diffused conceptual intrusion. Second, the recovered topics are not well separated.Many words related to singular concepts such as aesthetic (green), product name (orange), orfeatures (dark red), appear in most if not all of the five topics. Presented with such outputs, it isunclear how managers may then utilize recovered topics as X for further study and insight.
Table 7 displays the concept-describing words for each concept extracted by FCM. We presentfive concepts (keeping the same number of concepts as LDA) with a word cloud. Compared tothe topics found by the standard LDA, which are shown in Table 6, the FCM’s concepts are moresemantically coherent within each dimension. Concepts are both well focused within as well asseparated from one another. Borrowing from the topic modeling literature, we apply the samemeasure of coherence in equation 16 and obtain an average coherence of �1.86, which is greater(higher coherence) than the �2.25 obtained by LDA. Among the five concepts, the aesthetics conceptrepresented by words such as “nice little big clean look design” achieved the highest coherence of�1.384. Even for the concept of serviceability with the lowest coherence score of �2.197, thewords are semantically coherent. We compare the ranges of average 5-topic coherence of 50 distinctestimations (varying starting points and initialization) of LDA vs. FCM. The LDA range lies in(-3.5, -2.25) while the FCM range lies in (-1.92, -1.68). The coherence ranges do not overlap andare statistically significantly different, suggesting that FCM excels in extracting many coherent andsingular (and thus more human-interpretable) concepts from review texts.
In fact, the concepts recovered by FCM closely coincide with the dimensions of product priceand quality that are shown in the literature to influence consumer purchase. Garvin (Garvin, 1984,1987) compiled and introduced a set of quality and price dimensions aimed at helping organizationsthink about product, as shown in Table 4. On multiple FCM runs, we were able to automaticallyextract all concepts compiled by Garvin. This serves as an evidence of the external validity of FCM.
Table 3 provides the coherence of 4 other interpretable baselines. FCM is superior to all of them.Only seeded LDA was not statistically significantly different from FCM’s concept coherence. Foractual examples of reviews along with computed concept and case study, please see Appendix C.
Figure 6: Topics Extracted by LDA: Best coherence out of 50 runs. Average topic coherence is -2.25. Wemanually color-coded similar concepts for easy visualization.
23
Electronic copy available at: https://ssrn.com/abstract=3484617
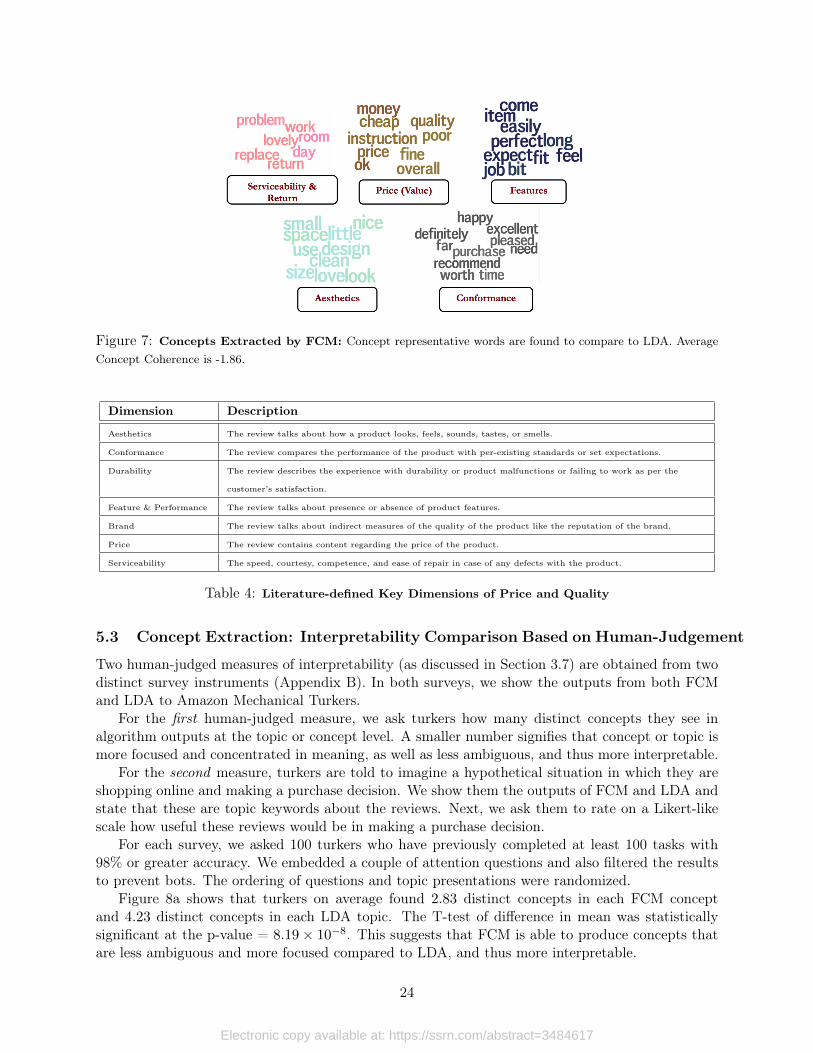
Figure 7: Concepts Extracted by FCM: Concept representative words are found to compare to LDA. AverageConcept Coherence is -1.86.
Dimension Description
Aesthetics The review talks about how a product looks, feels, sounds, tastes, or smells.
Conformance The review compares the performance of the product with per-existing standards or set expectations.
Durability The review describes the experience with durability or product malfunctions or failing to work as per the
customer’s satisfaction.
Feature & Performance The review talks about presence or absence of product features.
Brand The review talks about indirect measures of the quality of the product like the reputation of the brand.
Price The review contains content regarding the price of the product.
Serviceability The speed, courtesy, competence, and ease of repair in case of any defects with the product.
Table 4: Literature-defined Key Dimensions of Price and Quality
5.3 Concept Extraction: Interpretability Comparison Based on Human-Judgement
Two human-judged measures of interpretability (as discussed in Section 3.7) are obtained from twodistinct survey instruments (Appendix B). In both surveys, we show the outputs from both FCMand LDA to Amazon Mechanical Turkers.
For the first human-judged measure, we ask turkers how many distinct concepts they see inalgorithm outputs at the topic or concept level. A smaller number signifies that concept or topic ismore focused and concentrated in meaning, as well as less ambiguous, and thus more interpretable.
For the second measure, turkers are told to imagine a hypothetical situation in which they areshopping online and making a purchase decision. We show them the outputs of FCM and LDA andstate that these are topic keywords about the reviews. Next, we ask them to rate on a Likert-likescale how useful these reviews would be in making a purchase decision.
For each survey, we asked 100 turkers who have previously completed at least 100 tasks with98% or greater accuracy. We embedded a couple of attention questions and also filtered the resultsto prevent bots. The ordering of questions and topic presentations were randomized.
Figure 8a shows that turkers on average found 2.83 distinct concepts in each FCM conceptand 4.23 distinct concepts in each LDA topic. The T-test of difference in mean was statisticallysignificant at the p-value = 8.19⇥ 10
�8. This suggests that FCM is able to produce concepts thatare less ambiguous and more focused compared to LDA, and thus more interpretable.
24
Electronic copy available at: https://ssrn.com/abstract=3484617

Figure 8b shows the result of the second survey. The X-axis shows the value of the Likert scalewhere 1 means algorithm’s output was “extremely not useful” for making a purchase decision while7 means “extremely useful”. We first note that both distributions are bimodal, suggesting someconcepts and topics were useful while others were not. Second, FCM on average scored 4.439, whileLDA scored 3.855, suggesting that FCM outputs were more helpful. T-test of difference in mean wasstatistically significant at the p-value = 1.472 ⇥ 10
�5. Taken together, human judgement metricsfind FCM more interpretable compared to LDA outputs.
0
1
2
3
4
FCM LDA
Different Algorithms
Ave
rag
e N
um
be
r o
f D
istin
ct C
on
cep
t A
cro
ss 5
Co
nce
pts
Average Number of Distinct Concepts Tagged by AMT Workers Across 5 Concepts
(a) Human-Judged Number of Concepts in FCMvs. LDA: Standard errors are shown.
0.00
0.05
0.10
0.15
0.20
2 4 6Likert Scale
Den
sity method
FCM
LDA
How Useful Each Algorithms' Outputs Are for Making a Purchase Decision
(b) Human-Judged Usefulness of Concepts Foundby FCM vs LDA for Making a Purchase Decision
Figure 8: Human-Judged Measures of Interpretability for FCM vs. LDA
25
Electronic copy available at: https://ssrn.com/abstract=3484617

5.4 Correlational Relative Importance of Mined Concepts vs. Referential X toGauge Economic Significance
Concepts Coef Explanatory
variables
Coef
Aesthetics 0.107 Price -0.003
Conformance -0.076 Avg Rating
(Standardized)
0.288
Features 0.058 User-Page Views -0.005
Value 0.054
Serviceability -0.083
Table 5: Estimated Coefficients
For better utilization of the extracted concepts for business decisions and insight, FCM provides away to compare the correlational relative importance of mined concepts against the user-inputtedX. As demonstrated in this section, the idea is to supply FCM with relatively well-understoodX of interest along with texts to compare the correlational impact on the Y outcome. For modelparsimony, we choose the top three reference-worthy explanatory variables of high theoretical im-portance by information gain to compare to mined concepts: price, average star rating, and userpage views. Results run with more explanatory variables perform similarly. We note that (1) FCMcan still be applied on text-only data without any other X, (2) the relative importance provideddoes not have any causal claims, as they are predictive in nature, and lastly, (3) out of 500 differentruns of FCM, the recovered concepts and estimated coefficients are rather stable.
In the last layer, recall that FCM predicts the conversion (Equation 15) of a journey with themined document-concept distribution, p
d
. We modify this prediction layer to include user-specifiedX. We rename p
d
as DocConceptD for clarity and add the explanatory variables ExpV ar with asigmoid (generalized logistic) function:
ˆConversion = �(✓0 +X
i
✓i
DocConceptDi
+
X
j
✓j
ExpV arj
) (17)
where DocConceptD is a probability vector of different concepts that sums up to 1. For thisexposition, we have named our concepts as discussed in the last section and in Figure 7. Forexample, if a document gets a distribution of (0.2, 0.2, 0.2, 0.2, 0.2) over 5 concepts, this meansthat all 5 concepts are equally represented in this document (product review). This indicates thatthe coefficients speak to the impact of concept volume present in the review documents. As ingeneralized linear models, the trained weights, ✓, characterize how much the predicted conversionwill respond to the change of explanatory variables. For clarification, although the sigmoid layerof FCM follows the formula of a generalized linear regression, we are not aware of any work thatcould provide the confidence interval of a deep learning-based model. Thus, we do not provide theconfidence interval.
Table 5 shows the trained coefficients of explanatory variables and concept weights including
26
Electronic copy available at: https://ssrn.com/abstract=3484617

aesthetics, conformance, features, value, and serviceability. We standardized the average ratingfor easier interpretation. The results pass the sanity check: a negative coefficient for price and ahigh positive coefficient on average ratings. Aesthetic concepts had the highest positive correlationwith conversion while the serviceability and return-related concepts had the lowest. For a betterinterpretation of mined concepts, we will now calculate and present the marginal effects.
Interpretable Correlational Association
Concepts Marg
effects
(%)
Explanatory
variables
Marg
effects
(%)
Aesthetics 0.201 Price -0.022
Conformance -0.266 Avg Rating
(Standard-
ized)
0.336
Features 0.226 User-Page
Views
-0.041
Value 0.040
Serviceability -0.279
Table 6: Correlational Association of Review Concepts and Explanatory Variables
While the last sigmoid layer can provide an odds-ratio interpretation, just as in logistic regression,we calculated the correlational association of the variables on the percentage change of predictedconversion rate for brevity and clarity. To do this, for each journey and for each variable, wecalculate the probability of conversion both as is and after adjusting the variable, then average theeffects. First, we use the full FCM model to calculate the predicted conversion rate ˆConversion.Then, we increase the variable by an interpretable amount we define and compute the new predictedconversion rate ˆConversion
0, holding everything else fixed. The difference of the two conversionrates � =
ˆConversion0 � ˆConversion will be interpreted as the correlational association of the
variable. We apply a similar method to mined concepts. However, keeping in mind that theconcept distribution sums up to one within a document, we compute the correlation of a conceptdimension by increasing its distribution by 10% (percentage point) and decreasing others by 2.5%.That is, we ask what happens to a predicted conversion rate if a consumer reads 10% more of agiven concept within a journey.
The correlation are presented in Table 6 along with visualization. The increase in the reviewrating by one SD (0.49 star) is associated with the predicted conversion rate increase of 0.336%.Given that the average conversion rate is 1.37%, this is equivalent to an increase of approximately25% in the predicted average conversion rate. In comparison, different concepts mined change thepredicted conversion rate by �0.279%~0.226% , which equates to the range of a 20% decrease toa 16% increase on the predicted average conversion rate. Comparing the referential X (averageproduct rating) to concepts mined by FCM, we see that the impact of a 10% increase in conceptvolume in consumer-read reviews amounts to approximately 12%~83% of the effects (in absolutevalues) equivalent to increase in the average rating by one SD. The relative importance weightin conjunction with correlation calculations serves to provide mangers with a sense of economic
27
Electronic copy available at: https://ssrn.com/abstract=3484617

importance of automatically mined concepts in comparison to familiar key referential X such asreview ratings.
Our model suggest correlationally that reviews containing a higher volume of aesthetics, features,and price (value) might boost the conversion rate. On average, if the proportion of a document’saesthetical information increases by 10%, the predicted conversion rate increase by 0.201%. On theother hand, the concepts of conformance and serviceability are negatively correlated to consumerpurchases. Upon investigating several examples, this is likely because users usually mention nega-tive aspects when conformance (e.g., mismatch in product size) and serviceability (e.g., mentionsreturning or experience of returns) concepts are mentioned. We further investigate if certain con-cepts matter more if presented on different review pages. That is, does the order in which certainreview concepts are shown to customers correlate with more or less conversion? We present this inAppendix D.
Given the FCM results, an e-commerce manager may next launch a more focused causal study toinvestigate how to prioritize certain concepts and information in customer reviews such as includ-ing text that better highlights features and aesthetics, to increase conversion rate. Alternatively,a longer term objective may be to focus on particular set of products to discern aspects of thecategory that consumers care about most for new product development. This is outside the scopeof this paper.
5.5 Experimentation on Interpretability-Accuracy Relationship
This section is dedicated to exploring how interpretability and accuracy are correlated in FCM. Inthe topic modeling literature, Chang et al. (2009) show that the model fit (perplexity) is negativelycorrelated to interpretability (coherence). In the context of object classification in computer visionvia convolutional neural networks, Bau et al. (2017) report experimental findings using many neuralnetwork models and datasets that indicate the interpretability of a model can be decreased withoutchanging its discrimination ability. The authors concluded that the interpretability of a model isnot required for high accuracy. Extending this work, Zhang et al. (2017) develop an interpretableconvolution neural network and in the process show that there is a trade-off between interpretabilityand classification accuracy.
Specifically, as FCM’s objective function consists of different components, we can directly seehow increasing certain weight on the objective function changes the accuracy vs. coherence. Forexample, we explore how increasing ⇢ influences accuracy and coherence. Increasing ⇢ should alsoincrease the accuracy but it is not clear if it will have the same impact on coherence. In particular,we examine ⇢ (classification weight), ⌘ (concept diversity weight), and � (Dirichlet sparsity weight).We run experiments and plot the results in Figure 9. The first plot shows the impact on AUC aswe vary ⇢, ⌘, � and the second plot shows the impact on coherence. For each parameter, we varythe parameter from 10
�2 to 10
3 in 20 equally spaced points while repeating each point three times,giving us a total of 60 points per parameter. While one parameter is varied, the other two are fixed.The results are then smoothed with a LOESS (locally estimated scatterplot smoothing) plot.
For AUC (predictive power), ⇢ has an expected trend. As ⇢ increases, AUC increases. On theother hand, � shows the opposite pattern. As we force sparsity of concept, the predictive accuracydecreases—a clear loss in signal. Interestingly, ⌘, concept diversity, does not seem to influence theAUC. From the geometric point of view, in the concept vector space, there may be clusters of severaldifferent concepts. Increasing ⌘ does not seem to decrease predictive information, since it forceseach concept to cover different regions in the concept space, as opposed to increasing sparsity, whichdoes decrease predictive signals.
For coherence (interpretability), neither � or ⇢ seem to have a clear trend. Both have a slight
28
Electronic copy available at: https://ssrn.com/abstract=3484617

upward trend, but the range is not so large nor the pattens so clear. However, in comparison, ⌘ seemsto have a clear upward pattern. As we increase the concept diversity, coherence and interpretabilityincreases.
Taken together, we document several interesting findings: 1) The interpretability-accuracy trade-off correlation depends on different parameters of the model. 2) Increasing ⇢ increases AUC asintended, but only slightly increases interpretability. 3) Increasing concept sparsity, �, decreasesAUC but doesn’t influence interpretability. and 4) Increasing concept diversity, ⌘, does not influenceAUC while increasing interpretability. Taken together, the experiments suggest that the accuracyand interpretability is a separate dimension, and that one does not necessarily increase or decreasebased on the other. This section echoes findings from (Bau et al., 2017) in computer vision settingwith convolutional neural networks.
We speculate on the slight increase of coherence as ⇢ increases. It is unclear why guiding theconcept discovery with classification loss increases coherency (albeit only slightly). One idea is thatthis is because the text does have useful signals that are correlated to (or even cause) outcomeprediction. In this case of conversion, the coherent concepts such as aesthetics and conformance arewhat may be driving the purchase decisions (the Y ). Thus, the concepts embedded in the reviewsand the reasons why consumers make decisions are aligned and interpretable.
−2 −1 0 1 2 3
0.4
0.5
0.6
0.7
0.8
AUC VS Parameters
Parameter Value (Log Base 10)
AUC
RO
C
ληρ
(a) Variation in ROC-AUC
−2 −1 0 1 2 3
−1.8
5−1
.80
−1.7
5−1
.70
Coherence vs Parameters
Parameter Value (Log Base 10)
Coh
eren
ce
ληρ
(b) Variation in Coherence
Figure 9: Variation in ROC-AUC and Coherence for different hyperparameter settings. Hyperpa-rameters were varied for each while the other two were fixed.
5.6 Results on Different Dataset For Robustness - DonorsChoose.org
We apply FCM on another dataset. We only focus on the main task of concept extraction andcomparison. The open data is from DonorsChoose.org, a nonprofit crowdsourcing site that allowsindividuals to donate directly to public school classroom projects. This dataset spans over 6.2million donations and 1.2 million fundraising projects from 2002 to 2016 at the project level. Sincethe project page usually provides little structured information to the individual donors other than
29
Electronic copy available at: https://ssrn.com/abstract=3484617

Concept-Describing Words Concept Title Coef
1 camera history photography animal world trip experience picture video life Photography &
Outdoor Learning
0.0311
2 art material child supply color easel chair time pencil center Art Supplies 0.0868
3 music play drum instrument equipment song sensory fitness physical
keyboard
Music & Physical
Education
0.0188
4 book read reading novel text library reader level love language Reading & Literature 0.0597
5 technology math computer ipad lab project able science allow laptop Tech Equipment -0.0689
Table 7: Concepts Extracted by FCM for the DonorsChoose Dataset
the full text of teacher-written essays, we believe that the textual data should yield a significantsignal in predicting the fulfillment of the donation goal—predicting and giving insight into whatsort of crowdfunding project for education is successfully funded.
Based on the fundraising status of each donation project (whether the total donation hits the goalbefore the expiration date), we label the projects as either a success (positive) or failure (negative);we then construct training data consisting of 10,000 positives and 10,000 negatives by randomlyselecting projects. Each row contains 1) the project essay text and 2) the binary project status asthe label. We also control for the project funding amount. As with our main results, we set fiveconcepts to be discovered. Extracted concept-describing words and estimated relative importancecoefficients are found in Table 7.
Again, the concepts are semantically highly coherent and well separated from one another. Wemanually name each concept with descriptive titles for convenience, and find that the extractedconcepts consist of essentially five different curriculum types. The estimated coefficients imply thatart supply-related (0.0868) or literature-related (0.0597) concepts are more likely to be success-fully funded. FCM also suggests that technology-equipment funding requests are less likely to besuccessful.
5.7 The Role of Y-Focusing - Examples from DonorsChoose.org
This section investigates the impact of Y -focusing on FCM output i.e., what concepts are extractedif a different Y is selected to guide the concept discovery? For this, DonorsChoose data is used againdue to the availability of a different Y .
Y-Variable: NotFunded
Concept-Describing Words Concept Title Coef
1 teach time new allow day tool board lesson special Special Teaching Tool -0.0402
2 child create project material provide come like activity education Project Materials 0.0441
3 music play math science kit experience stem language opportunity Music & STEM -0.0224
4 book read reading text novel level library reader love english Reading & Literature -0.0275
5 technology skill ipad computer program able grade tablet app access Tech Equipment 0.0461
Table 8: DonorsChoose Result Guided by Y-variable NotFunded.
One way to obtain a different Y is to simply flip the Y from Section 5.6 to predict NotFunded.An FCM run on this data will extract out concepts that are highly correlated to the project being
30
Electronic copy available at: https://ssrn.com/abstract=3484617

unsuccessfully funded. Intuition suggests that FCM will extract concepts that are repeated andperhaps will also yield new concepts. Table 8 presents the results. Comparing the results for theoriginal (Table 7), we find that concepts “Tech Equipment” and “Reading & Literature” are extractedyet again, with coefficients’ directions flipped from the original dataset results. This shows FCM’sconsistency in both concept extraction and correlational coefficient estimation.
However, FCM also recovers slightly modified concepts or even new concepts not originally foundin Table 7. Compare Concept 3 in both tables. It was originally “Music & Physical Education” andpositive for successful funding. Now it is changed slightly into “Music & STEM” with a negativevalue for NotFunded. While the directions tell consistent result, extracted concepts are slightlymodified. Concept 1 is a new concept seeking to fund some sort of special teaching tool that willenable the teachers. The coefficient is negative, suggesting that it is likely to get funded. Concept2 refers to student project material requests and is positive, suggesting a lower chance of gettingsuccessfully funded.
Y-Variable: Exciting
Concept-Describing Words Concept Title Coef
1 life opportunity experience world garden society culture grow hope Experiential Learning -0.0842
2 camera ipad technology video class projector able use tablet allow Tech Equipment 0.0588
3 drum math calculator science music hand instrument game play teach Music & STEM -0.0972
4 art ball provide new material child writing like supply Art Supplies 0.0049
5 book read reading center love time remember level listen player Reading & Literature 0.1177
Table 9: DonorsChoose Result Guided by Y-variable Exciting.
The 2014 KDD (Knowledge Discovery and Data mining) Conference hosted a joint open data sciencecompetition with Kaggle.com (https://www.kaggle.com/c/kdd-cup-2014-predicting-excitement-at-donors-choose/data) using DonorsChoose data. The competition created a customized binary Ylinked to each funding request called Exciting as defined and deemed important by DonorsChoose.Exciting goes beyond our DonorsChoose Y used in Section 5.6 in that the project must 1) be fullyfunded (original Y used), 2) have at least one teacher-acquired donor, and 3) have a higher thanaverage percentage of donors leaving an original message, in addition to other stipulations. For moredetails, please refer to the Kaggle link. In summary, Exciting is a domain-expert defined Y thatis sufficiently different (correlation between successfully funded and Exciting is 0.1484 – note thatthere are many successfully funded projects that are not Exciting) from a simple Y that indicateswhether the project was successfully funded or not.
Table 9 shows the results. Two concepts, 4 (“Art Supplies”) and 5 (Reading & Literature), arerecovered once again and the directions match the original result. Concept 2 (“Tech Equipment”) isrecovered once again but this time with reversed direction. While the tech equipment was negativelycorrelated with an unsuccessfully funded project in the original set up, it is positive for the Excitingproject. Concept 3 (“Music & STEM”) is slightly modified from “Music & Physical Education” withreversed direction. Lastly, a new concept related to “Experiential Learning” is discovered to benegatively correlated to Exciting.
Summary
Even on the same data, FCM recovers both repeated and new concepts depending on the Y usedto focus the concept. This enables creative use of FCM. For example, if a manager had return data
31
Electronic copy available at: https://ssrn.com/abstract=3484617

connected to review-reading and conversion data, FCM can recover what review content may beinstrumental in reducing product returns.
6 Limitations and Future Extensions
We share several short idea overviews for extending the basic FCM models and post-processingFCM outputs for future papers. The scope of difficulties range from feasible to very uncertain.Specifically, four extension ideas are shared in order of increasing difficulty: Automatic Naming ofConcepts, Adding Valence to Concepts, Zooming into Concepts, and finally FCM and Causality.
Automatic Naming of Concepts In demonstrating FCM with review data, we have manuallyinterpreted and titled each concept that FCM extracted. Titling concepts can be further automatedpost-FCM for a faster and more “objective” presentation of the results. One method involvesadopting existing techniques from topic modeling literature (e.g., Lau et al. (2011)), which reducesdown to generating label candidate sets by tapping into external text—such as Wikipedia—orthe corpus itself and ranking the label set by its similarity to topics. However, given that FCMarchitecture includes semantic-spatial relationship-aware word embedding at its basis, geometricmethods within the concept (and word) Hilbert space may be more appropriate and powerful.
Adding Valence to Concepts The current FCM only deals with the volume of concepts presentin text. Valence (positive or negative sentiment) could be added to enhance the model and inter-pretation. Within the model pipeline, before the last softmax layer, the document-concept vectorcould be further processed. However, it is unclear how to modify the end-to-end architecture toinject valence of the document-concept vector without the need for training datasets or breakingthe end-to-end framework.
Zooming into Concepts Model architecture could be extended to be hierarchical in concept rep-resentation relations. Given the hierarchical nature of discovered concepts, the model could also in-clude a lever to zoom in or out on concept hierarchy for different levels of abstraction. One potentialway might be to tap into existing semantic networks and knowledge graph databases that are awareof concept hierarchy, such as ConceptNet (http://conceptnet.io/) or WordNet (https://wordnet.princeton.edu/).
FCM and Causality While FCM is envisioned and presented as an exploratory tool (and not
causal) with many caveats, some users may still want to extend it for causal uses. Using deeplearning for causal inference is still a nascent field with only a handful of papers (e.g., Hartfordet al. (2016), Louizos et al. 2017, Kallus 2018, etc.) and is theoretically undeveloped due to thefact that there are no theoretical asymptotic results on generic deep learning models, which makesit difficult to draw robust inferences.
To speculatively suggest, as the last layer of the FCM architecture resembles classical logisticregression, perhaps it can be extended to inject characteristics of extant causal models. We areunsure where to begin, however. For now, a quick and robust way to utilize FCM is to simply useit as a representation learning algorithm (Bengio et al., 2013) to extract non-trivial representationof input text data by lobotomizing the FCM and using the inner-layer data representations. Thiscould be anything from simple document-concept vectors to a complicated nonlinear combinationof document-elements. Given that document-concept vectors are the most interpretable, we suggeststarting with these vectors as X inputs to other traditional causal techniques.
32
Electronic copy available at: https://ssrn.com/abstract=3484617

7 Conclusions and Managerial Implications
We introduced a new deep learning-based text mining method, the Focused Concept Miner (FCM),to explore, organize, and extract information from large-scale textual data guided by any Y ofbusiness importance. Upon applying the algorithm to a unique, comprehensive dataset that tracksindividual-level review reading, searching, and purchasing behaviors, we were able to extract con-tent from product reviews that consumers consider before making purchases. The mined conceptsoverlapped heavily with dimensions of price and quality that existing management theories claimmatter for consumer purchase behavior. FCM achieves competitive prediction performance andhigher interpretability in comparison to existing techniques and additionally provides relative im-portance measures for structured X and focus-mined concepts, which in turn provides managerswith an easy way to understand and derive value from textual data. We introduced the interpretablemachine learning literature and use-case of one such algorithm, FCM, for management applications.FCM also excels in real-time nimble processing of fast incoming text data to provide interpretablefeedback since 1) inductive prediction does not require additional training, 2) retraining with incom-ing data is easy with mini-batch stochastic gradient descent, and 3) Focusing by Y offers differentangles to extract insights effortlessly.
We envision FCM as an exploratory tool to make sense of the severely untapped textual data inthe business world, and as a jumping off point for further policy implementation or causal studies.The review-reading data we focused on illustrated the potentials of FCM, and we now discussseveral other possible applications. An immediate application for review content presentation onan e-commerce site can be brainstormed based on the FCM output. For example, if the specifiedY was return rate instead of conversion, the FCM output could extract the concepts that maybe instrumental in preventing returns,11 and may inform review presentation design to decreasereturns. Another immediate application arises naturally due to 1) nimble ability of FCM to focus-mine concept in “one click”, 2) one-the-fly prediction of incoming data via inductive prediction,and 3) dynamic model update capability of the model based on incoming data owing to mini-batch stochastic gradient descent algorithm. Specifically, FCM can be used to dynamically monitorconsumer feedback and complaints (i.e., dynamic resonance marketing tool (Clemons et al., 2006))on social media and websites as shown in Netzer et al. (2012) and Culotta and Cutler (2016).Managers can benefit from a dashboard of daily or weekly summarization of consumer chattersusing FCM in place and even quickly see different aspects by focusing with appropriate Y s. On theproduct design side, producers of a relatively new category of products could quickly collect reviewdata and grasp the consumers’ wants and needs by using zoomed-in review data. FCM will recoverthe concepts that consumers talk about and provide the relative importance of recovered conceptslinked to any business variable of importance, such as willingness to recommend and whether aconsumer actually makes the purchase. This could provide a more exploratory insight before a costlyfocus-study group. For example, in the wearable fashion and smart product categories (e.g., healthtrackers, smart clothing, connected luggage), which are relatively new, running FCM on reviewscould provide rank order (relative importance) of product quality dimensions that consumers careabout. Perhaps aesthetics is more important than features in product category X, which may well bereversed for product category Y. As a last example, if a manager restricts a review dataset to be of aspecific product category (e.g., digital cameras), FCM could be modified to extract product-specificfeature concepts and relative importance, which could inform product design. This applicationwould be a quicker but much less accurate alternative to the method described by Timoshenko andHauser (2018).
11To speculate, perhaps it could be about clothing fit information, information regarding experience attributes,etc.
33
Electronic copy available at: https://ssrn.com/abstract=3484617

We chose the review-reading data due to the familiarity of the concepts in reviews. However,FCM can also be applied to more esoteric text data (e.g., medical text data, technical text datawith jargon.), as the algorithm is oblivious to levels of textual technicality. In this case, managersmay potentially find new concepts that they were not aware of. Recovered concepts must then bediscussed with domain experts to inform further actions.
In the context of Ehrenberg’s approach to management science (ETET), there are two broaduse-cases for machine learning algorithms for managers and business researchers: 1) scale hypothe-ses testing, 2) discovering hypotheses from empirical data. Extant papers already utilize ML toscale theory testing (see end of Section 2.3). Additionally, ML can serve as a navigator to point outinteresting patterns that could potentially generate worthwhile hypotheses to be causally exploredin more depth. Using ML to augment hypotheses generation is ripe for serious consideration. In-terpretable Machine Learning algorithms such as FCM can be utilized to explore structured andunstructured data alike in order to augment hypotheses building. Ultimately, however, FCM is asgood as the user. For example, in our data, the reviewers online are self-selected and heterogeneous.FCM captures insight from the text as is, albeit while controlling for any variables that are sup-plied to the model. Only researchers who practice sound logic through domain knowledge can begood judges of what is spurious and what is worth further investigation. We hope managers andresearchers can use FCM creatively with any combination of text, structured, and business outcomevariables to glean insights, build out new hypotheses, and prepare theory-driven causal analyses.
References
Angwin, J., L. Kirchner, S. Mattu, and J. Larson: 2016, ‘Machine Bias: There’s Software Used Across theCountry to Predict Future Criminals. And it’s Biased Against Blacks., May 2016’.
Archak, N., A. Ghose, and P. G. Ipeirotis: 2011, ‘Deriving the pricing power of product features by miningconsumer reviews’. Management Science 57(8), 1485–1509.
Bass, F. M.: 1995, ‘Empirical generalizations and marketing science: A personal view’. Marketing Science14(3_supplement), G6–G19.
Bau, D., B. Zhou, A. Khosla, A. Oliva, and A. Torralba: 2017, ‘Network dissection: Quantifying inter-pretability of deep visual representations’. arXiv preprint arXiv:1704.05796.
Bengio, Y., A. Courville, and P. Vincent: 2013, ‘Representation learning: A review and new perspectives’.IEEE transactions on pattern analysis and machine intelligence 35(8), 1798–1828.
Blei, D. M. and J. D. Mcauliffe: 2008, ‘Supervised topic models’. In: Advances in neural informationprocessing systems. pp. 121–128.
Blei, D. M., A. Y. Ng, and M. I. Jordan: 2003, ‘Latent dirichlet allocation’. Journal of machine Learningresearch 3(Jan), 993–1022.
Buschken, J. and G. M. Allenby: 2016, ‘Sentence-based text analysis for customer reviews’. MarketingScience 35(6), 953–975.
Chandrashekar, G. and F. Sahin: 2014, ‘A survey on feature selection methods’. Computers & ElectricalEngineering 40(1), 16–28.
Chang, J., S. Gerrish, C. Wang, J. L. Boyd-Graber, and D. M. Blei: 2009, ‘Reading tea leaves: How humansinterpret topic models’. In: Advances in neural information processing systems. pp. 288–296.
Chen, T. and C. Guestrin: 2016, ‘Xgboost: A scalable tree boosting system’. In: Proceedings of the 22ndacm sigkdd international conference on knowledge discovery and data mining. pp. 785–794.
Clemons, E. K., G. G. Gao, and L. M. Hitt: 2006, ‘When online reviews meet hyperdifferentiation: A studyof the craft beer industry’. Journal of management information systems 23(2), 149–171.
Culotta, A. and J. Cutler: 2016, ‘Mining brand perceptions from Twitter social networks’. Marketing science35(3), 343–362.
Decker, R. and M. Trusov: 2010, ‘Estimating aggregate consumer preferences from online product reviews’.International Journal of Research in Marketing 27(4), 293–307.
34
Electronic copy available at: https://ssrn.com/abstract=3484617

Dhurandhar, A., V. Iyengar, R. Luss, and K. Shanmugam: 2017, ‘TIP: Typifying the interpretability ofprocedures’. arXiv preprint arXiv:1706.02952.
Doshi-Velez, F. and B. Kim: 2017, ‘Towards a rigorous science of interpretable machine learning’. arXivpreprint arXiv:1702.08608.
Egele, M., T. Scholte, E. Kirda, and C. Kruegel: 2012, ‘A survey on automated dynamic malware-analysistechniques and tools’. ACM computing surveys (CSUR) 44(2), 6.
Ehrenberg, A. S.: 1994, ‘Theory or well-based results: which comes first?’. In: Research traditions inmarketing. Springer, pp. 79–131.
Feifer, J.: 2013, ‘The Amazon Whisperer’.Gantz, J. and D. Reinsel: 2011, ‘Extracting value from chaos’. IDC iview 1142(2011), 1–12.Garg, N., L. Schiebinger, D. Jurafsky, and J. Zou: 2018, ‘Word embeddings quantify 100 years of gender
and ethnic stereotypes’. Proceedings of the National Academy of Sciences 115(16), E3635–E3644.Garvin, D. A.: 1984, ‘What Does Product Quality Really Mean?’. Sloan management review p. 25.Garvin, D. A.: 1987, ‘Competing on the 8 dimensions of quality’. Harvard business review 65(6), 101–109.Gilpin, L. H., D. Bau, B. Z. Yuan, A. Bajwa, M. Specter, and L. Kagal: 2018, ‘Explaining Explanations:
An Overview of Interpretability of Machine Learning’. In: 2018 IEEE 5th International Conference onData Science and Advanced Analytics (DSAA). pp. 80–89.
Goldberg, Y.: 2016, ‘A primer on neural network models for natural language processing’. Journal ofArtificial Intelligence Research 57, 345–420.
Goldberg, Y. and O. Levy: 2014, ‘word2vec Explained: deriving Mikolov et al.’s negative-sampling word-embedding method’. arXiv preprint arXiv:1402.3722.
Guidotti, R., A. Monreale, S. Ruggieri, F. Turini, F. Giannotti, and D. Pedreschi: 2018, ‘A survey of methodsfor explaining black box models’. ACM Computing Surveys (CSUR) 51(5), 93.
Hartford, J., G. Lewis, K. Leyton-Brown, and M. Taddy: 2016, ‘Counterfactual Prediction with DeepInstrumental Variables Networks’. arXiv preprint arXiv:1612.09596.
Jagarlamudi, J., H. Daumé III, and R. Udupa: 2012, ‘Incorporating lexical priors into topic models’. In: Pro-ceedings of the 13th Conference of the European Chapter of the Association for Computational Linguistics.pp. 204–213.
Jurafsky, D.: 2000, ‘Speech and language processing: An introduction to natural language processing’.Computational linguistics, and speech recognition.
Kallus, N.: 2018, ‘DeepMatch: Balancing Deep Covariate Representations for Causal Inference Using Ad-versarial Training’. arXiv preprint arXiv:1802.05664.
Kozlowski, A. C., M. Taddy, and J. A. Evans: 2018, ‘The geometry of culture: Analyzing meaning throughword embeddings’. arXiv preprint arXiv:1803.09288.
Lau, J. H., K. Grieser, D. Newman, and T. Baldwin: 2011, ‘Automatic labelling of topic models’. In: Pro-ceedings of the 49th Annual Meeting of the Association for Computational Linguistics: Human LanguageTechnologies-Volume 1. pp. 1536–1545.
Lau, J. H., D. Newman, and T. Baldwin: 2014, ‘Machine reading tea leaves: Automatically evaluating topiccoherence and topic model quality’. In: Proceedings of the 14th Conference of the European Chapter ofthe Association for Computational Linguistics. pp. 530–539.
LeCun, Y., Y. Bengio, and G. Hinton: 2015, ‘Deep learning’. nature 521(7553), 436.Lee, D., K. Hosanagar, and H. Nair: 2018, ‘Advertising Content and Consumer Engagement on Social Media:
Evidence from Facebook’. Management Science.Lee, T. Y. and E. T. Bradlow: 2011, ‘Automated marketing research using online customer reviews’. Journal
of Marketing Research 48(5), 881–894.Levy, O. and Y. Goldberg: 2014, ‘Neural word embedding as implicit matrix factorization’. In: Advances in
neural information processing systems. pp. 2177–2185.Lipton, Z. C.: 2016, ‘The mythos of model interpretability’. arXiv preprint arXiv:1606.03490.Liu, B.: 2012, ‘Sentiment analysis and opinion mining’. Synthesis lectures on human language technologies
5(1), 1–167.Liu, J. and O. Toubia: 2018, ‘A Semantic Approach for Estimating Consumer Content Preferences from
Online Search Queries’. Marketing Science.Liu, X., D. Lee, and K. Srinivasan: 2019, ‘Large Scale Cross Category Analysis of Consumer Review Content
on Sales Conversion Leveraging Deep Learning’. Journal of Marketing Research - Forthcoming.
35
Electronic copy available at: https://ssrn.com/abstract=3484617

Louizos, C., U. Shalit, J. M. Mooij, D. Sontag, R. Zemel, and M. Welling: 2017, ‘Causal effect inference withdeep latent-variable models’. In: Advances in Neural Information Processing Systems. pp. 6446–6456.
Lu, J., D. Lee, T. Kim, and D. Danks: 2020, ‘Good Explanation for Algorithmic Transparency’. In: Pro-ceedings of the 2020 AAAI/ACM Conference on AI, Ethics, and Society.
Lundberg, S. M. and S.-I. Lee: 2017, ‘A unified approach to interpreting model predictions’. In: Advancesin neural information processing systems. pp. 4765–4774.
McKinsey: 2016, ‘The Age of Analytics: Competing in a Data-Driven World’. Technical report, McKinseyGlobal Institute.
Mikolov, T., I. Sutskever, K. Chen, G. S. Corrado, and J. Dean: 2013a, ‘Distributed representations ofwords and phrases and their compositionality’. In: Advances in neural information processing systems.pp. 3111–3119.
Mikolov, T., W.-t. Yih, and G. Zweig: 2013b, ‘Linguistic regularities in continuous space word represen-tations’. In: Proceedings of the 2013 Conference of the North American Chapter of the Association forComputational Linguistics: Human Language Technologies. pp. 746–751.
Miller, T.: 2018, ‘Explanation in artificial intelligence: Insights from the social sciences’. Artificial Intelli-gence.
Mimno, D., H. M. Wallach, E. Talley, M. Leenders, and A. McCallum: 2011, ‘Optimizing semantic coherencein topic models’. In: Proceedings of the conference on empirical methods in natural language processing.pp. 262–272.
Mindtree: 2017, ‘Integrated Customer Insights’. Technical report, Mindtree.Moody, C. E.: 2016, ‘Mixing dirichlet topic models and word embeddings to make lda2vec’. arXiv preprint
arXiv:1605.02019.Murdoch, W. J., C. Singh, K. Kumbier, R. Abbasi-Asl, and B. Yu: 2019, ‘Interpretable machine learning:
definitions, methods, and applications’. arXiv preprint arXiv:1901.04592.Netzer, O., R. Feldman, J. Goldenberg, and M. Fresko: 2012, ‘Mine your own business: Market-structure
surveillance through text mining’. Marketing Science 31(3), 521–543.Netzer, O., A. Lemaire, and M. Herzenstein: 2019, ‘When Words Sweat: Identifying Signals for Loan Default
in the Text of Loan Applications’. Journal of Marketing Research Forthcoming.Newman, D., J. H. Lau, K. Grieser, and T. Baldwin: 2010, ‘Automatic evaluation of topic coherence’.
In: Human Language Technologies: The 2010 Annual Conference of the North American Chapter of theAssociation for Computational Linguistics. pp. 100–108.
Pennington, J., R. Socher, and C. Manning: 2014, ‘Glove: Global vectors for word representation’. In:Proceedings of the 2014 conference on empirical methods in natural language processing (EMNLP). pp.1532–1543.
Pontiki, M., D. Galanis, H. Papageorgiou, I. Androutsopoulos, S. Manandhar, A.-S. Mohammad, M. Al-Ayyoub, Y. Zhao, B. Qin, O. De Clercq, et al.: 2016, ‘SemEval-2016 task 5: Aspect based sentimentanalysis’. In: Proceedings of the 10th international workshop on semantic evaluation (SemEval-2016). pp.19–30.
Puranam, D., V. Narayan, and V. Kadiyali: 2017, ‘The Effect of Calorie Posting Regulation on ConsumerOpinion: A Flexible Latent Dirichlet Allocation Model with Informative Priors’. Marketing Science.
Ras, G., M. van Gerven, and P. Haselager: 2018, ‘Explanation methods in deep learning: Users, values,concerns and challenges’. In: Explainable and Interpretable Models in Computer Vision and MachineLearning. Springer, pp. 19–36.
Ribeiro, M. T., S. Singh, and C. Guestrin: 2016, ‘" Why should i trust you?" Explaining the predictions ofany classifier’. In: Proceedings of the 22nd ACM SIGKDD international conference on knowledge discoveryand data mining. pp. 1135–1144.
Rizkallah, J.: 2017, ‘The Big (Unstructured) Data Problem’.Roberts, M. E., B. M. Stewart, D. Tingley, C. Lucas, J. Leder-Luis, S. K. Gadarian, B. Albertson, and D. G.
Rand: 2014, ‘Structural topic models for open-ended survey responses’. American Journal of PoliticalScience 58(4), 1064–1082.
Rubenstein, H. and J. B. Goodenough: 1965, ‘Contextual correlates of synonymy’. Communications of theACM 8(10), 627–633.
Rudin, C.: 2019, ‘Stop explaining black box machine learning models for high stakes decisions and useinterpretable models instead’. Nature Machine Intelligence 1(5), 206.
36
Electronic copy available at: https://ssrn.com/abstract=3484617

Sahlgren, M.: 2008, ‘The distributional hypothesis’. Italian Journal of Disability Studies 20, 33–53.Shi, B., W. Lam, S. Jameel, S. Schockaert, and K. P. Lai: 2017, ‘Jointly Learning Word Embeddings
and Latent Topics’. In: Proceedings of the 40th International ACM SIGIR Conference on Research andDevelopment in Information Retrieval. pp. 375–384.
Timoshenko, A. and J. R. Hauser: 2018, ‘Identifying customer needs from user-generated content’. Forth-coming at Marketing Science.
Tirunillai, S. and G. J. Tellis: 2014, ‘Mining marketing meaning from online chatter: Strategic brand analysisof big data using latent dirichlet allocation’. Journal of Marketing Research 51(4), 463–479.
Toubia, O., G. Iyengar, R. Bunnell, and A. Lemaire: 2018, ‘Extracting Features of Entertainment Products:A Guided LDA Approach Informed by the Psychology of Media Consumption’. Journal of MarketingResearch.
Wernicke, S.: 2015, ‘How to use data to make a hit tv show’.Wexler, R.: 2017, ‘When a computer program keeps you in jail: How computers are harming criminal justice’.
New York Times.Xun, G., Y. Li, J. Gao, and A. Zhang: 2017, ‘Collaboratively improving topic discovery and word embeddings
by coordinating global and local contexts’. In: Proceedings of the 23rd ACM SIGKDD InternationalConference on Knowledge Discovery and Data Mining. pp. 535–543.
Zech, J. R., M. A. Badgeley, M. Liu, A. B. Costa, J. J. Titano, and E. K. Oermann: 2018, ‘Confoundingvariables can degrade generalization performance of radiological deep learning models’. arXiv preprintarXiv:1807.00431.
Zhang, Q., Y. N. Wu, and S.-C. Zhu: 2017, ‘Interpretable convolutional neural networks’. arXiv preprintarXiv:1710.00935 2(3), 5.
Zhu, J., A. Ahmed, and E. P. Xing: 2012, ‘MedLDA: maximum margin supervised topic models’. Journalof Machine Learning Research 13(Aug), 2237–2278.
37
Electronic copy available at: https://ssrn.com/abstract=3484617

Appendix A - Product Categories in Data
Figure 10: Word Cloud of Product Categories
38
Electronic copy available at: https://ssrn.com/abstract=3484617
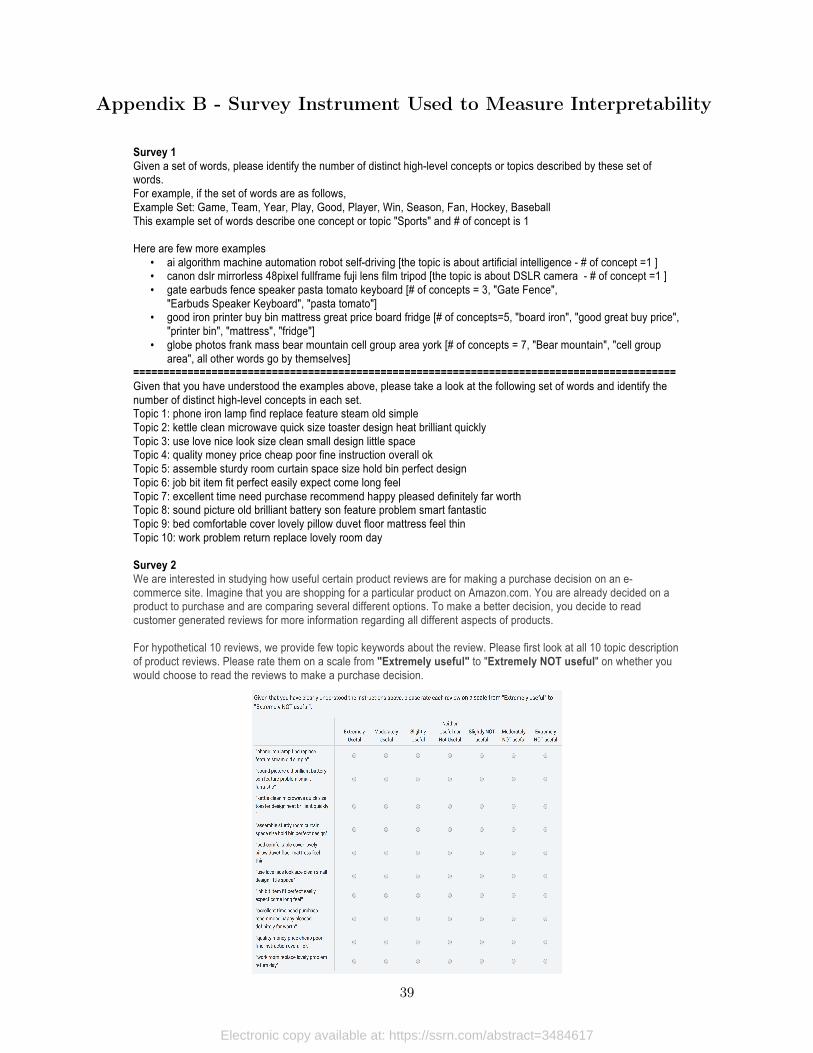
Appendix B - Survey Instrument Used to Measure Interpretability
Survey 1 Given a set of words, please identify the number of distinct high-level concepts or topics described by these set of words. For example, if the set of words are as follows, Example Set: Game, Team, Year, Play, Good, Player, Win, Season, Fan, Hockey, Baseball This example set of words describe one concept or topic "Sports" and # of concept is 1 Here are few more examples
• ai algorithm machine automation robot self-driving [the topic is about artificial intelligence - # of concept =1 ] • canon dslr mirrorless 48pixel fullframe fuji lens film tripod [the topic is about DSLR camera - # of concept =1 ] • gate earbuds fence speaker pasta tomato keyboard [# of concepts = 3, "Gate Fence",
"Earbuds Speaker Keyboard", "pasta tomato"] • good iron printer buy bin mattress great price board fridge [# of concepts=5, "board iron", "good great buy price",
"printer bin", "mattress", "fridge"] • globe photos frank mass bear mountain cell group area york [# of concepts = 7, "Bear mountain", "cell group
area", all other words go by themselves] ========================================================================================== Given that you have understood the examples above, please take a look at the following set of words and identify the number of distinct high-level concepts in each set. Topic 1: phone iron lamp find replace feature steam old simple Topic 2: kettle clean microwave quick size toaster design heat brilliant quickly Topic 3: use love nice look size clean small design little space Topic 4: quality money price cheap poor fine instruction overall ok Topic 5: assemble sturdy room curtain space size hold bin perfect design Topic 6: job bit item fit perfect easily expect come long feel Topic 7: excellent time need purchase recommend happy pleased definitely far worth Topic 8: sound picture old brilliant battery son feature problem smart fantastic Topic 9: bed comfortable cover lovely pillow duvet floor mattress feel thin Topic 10: work problem return replace lovely room day Survey 2 We are interested in studying how useful certain product reviews are for making a purchase decision on an e-commerce site. Imagine that you are shopping for a particular product on Amazon.com. You are already decided on a product to purchase and are comparing several different options. To make a better decision, you decide to read customer generated reviews for more information regarding all different aspects of products. For hypothetical 10 reviews, we provide few topic keywords about the review. Please first look at all 10 topic description of product reviews. Please rate them on a scale from "Extremely useful" to "Extremely NOT useful" on whether you would choose to read the reviews to make a purchase decision.
39
Electronic copy available at: https://ssrn.com/abstract=3484617

Appendix C-Review Examples for Case Study and Visualization
We present review examples for case study and visualization. The last sigmoid layer (�(.)) of FCMenables us to measure the impact of documents on the business outcome; in other words, how thepredicted conversion rate changes after the consumer reads a particular document (series of reviews).To do this, we first calculate the predicted conversion rate ˆ
Conversion using the true document-concept distribution DocConceptD. Then, holding explanatory variables the same, we compare thepredicted conversion rate using the average document-concept distribution DocConceptD, which iscalculated by averaging the document-concept across all the available documents in the trainingset. The difference in these two predicted conversions can be interpreted as the impact of reviewson the consumer’s decision to purchase, as represented in Equation 18.
�Conversion = �(✓0+X
i
✓
i
DocConceptD
i
+X
j
✓
j
ExpV ar
j
)��(✓0+X
i
✓
i
DocConceptD
i
+X
j
✓
j
ExpV ar
j
) (18)
The differences in the two predicted conversion rates are calculated across all documents in thedataset.
Table 10 shows six reviews along with the product information, predicted conversion difference,and concept distribution assessed by FCM. For diversity of examples, we randomly choose tworeviews with the most positive predicted conversion difference (i.e., the most likely to have increasedconversion), the two most negative, and the two most neutral. For each phrase that matches adimension of concept, we manually apply a tag that indicates the corresponding concept right afterit. Comparing the tagged reviews and the estimated concept distribution shows that the conceptdistributions assessed by FCM are generally well aligned with the actual semantics of the reviews.
The predicted conversion difference captures the correlation between the textual data and theconversion beyond other explanatory variables. For example, without utilizing the textual data, theFCM would have predicted that the “Single Door Display Cabinet” would have a low conversionprobability. However, with text, FCM predicts a high conversion rate. In fact, it predicts a 99.34%higher probability compared to the review-blind model. The increase in conversion probabilityseems to stem from reviews that discuss features at length.
However, the textual value becomes less obvious when a review embodies a compound of severalhigh-volume concepts. From a review of a Hoover vacuum cleaner, FCM reports that readingreviews might have no impact on conversion. Although the review discusses the product’s featuresin detail, (which, by our model, is likely to stimulate the conversion), it also mentions the conceptsfor serviceability, such as “return” or “refund”, which offsets the stimulus of feature-related concepts.
40
Electronic copy available at: https://ssrn.com/abstract=3484617
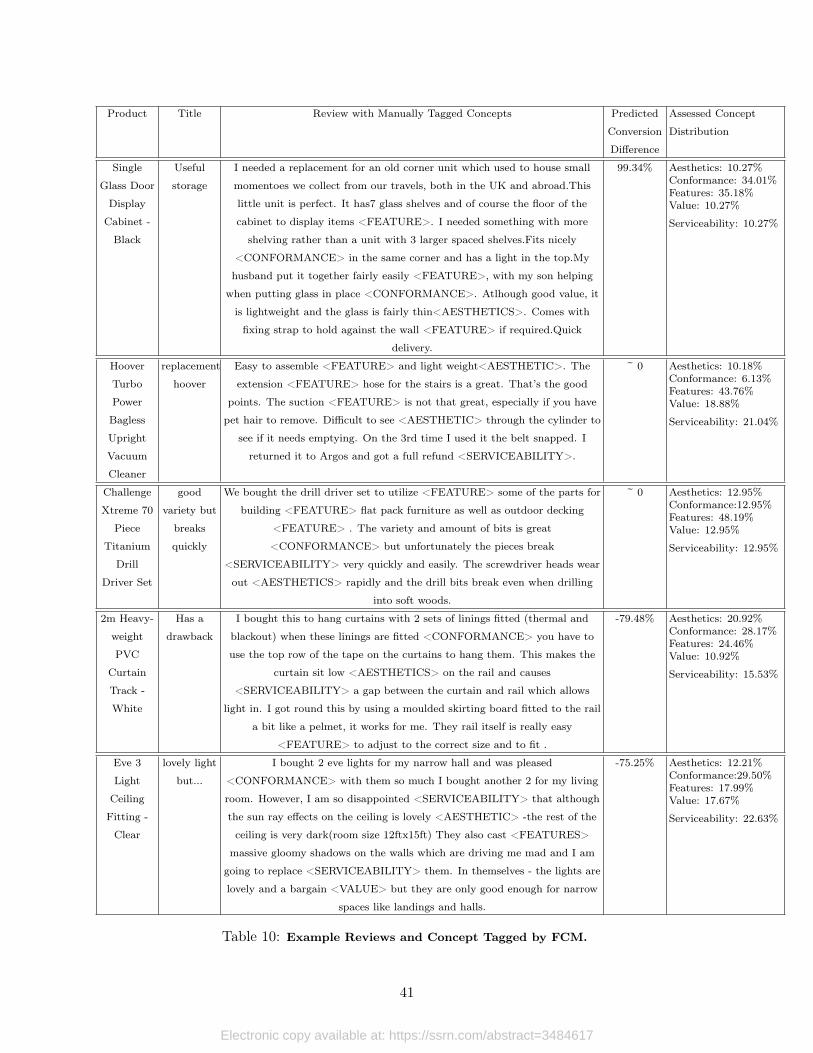
Product Title Review with Manually Tagged Concepts Predicted
Conversion
Difference
Assessed Concept
Distribution
Single
Glass Door
Display
Cabinet -
Black
Useful
storage
I needed a replacement for an old corner unit which used to house small
momentoes we collect from our travels, both in the UK and abroad.This
little unit is perfect. It has7 glass shelves and of course the floor of the
cabinet to display items <FEATURE>. I needed something with more
shelving rather than a unit with 3 larger spaced shelves.Fits nicely
<CONFORMANCE> in the same corner and has a light in the top.My
husband put it together fairly easily <FEATURE>, with my son helping
when putting glass in place <CONFORMANCE>. Atlhough good value, it
is lightweight and the glass is fairly thin<AESTHETICS>. Comes with
fixing strap to hold against the wall <FEATURE> if required.Quick
delivery.
99.34% Aesthetics: 10.27%Conformance: 34.01%Features: 35.18%Value: 10.27%
Serviceability: 10.27%
Hoover
Turbo
Power
Bagless
Upright
Vacuum
Cleaner
replacement
hoover
Easy to assemble <FEATURE> and light weight<AESTHETIC>. The
extension <FEATURE> hose for the stairs is a great. That’s the good
points. The suction <FEATURE> is not that great, especially if you have
pet hair to remove. Difficult to see <AESTHETIC> through the cylinder to
see if it needs emptying. On the 3rd time I used it the belt snapped. I
returned it to Argos and got a full refund <SERVICEABILITY>.
~ 0 Aesthetics: 10.18%Conformance: 6.13%Features: 43.76%Value: 18.88%
Serviceability: 21.04%
Challenge
Xtreme 70
Piece
Titanium
Drill
Driver Set
good
variety but
breaks
quickly
We bought the drill driver set to utilize <FEATURE> some of the parts for
building <FEATURE> flat pack furniture as well as outdoor decking
<FEATURE> . The variety and amount of bits is great
<CONFORMANCE> but unfortunately the pieces break
<SERVICEABILITY> very quickly and easily. The screwdriver heads wear
out <AESTHETICS> rapidly and the drill bits break even when drilling
into soft woods.
~ 0 Aesthetics: 12.95%Conformance:12.95%Features: 48.19%Value: 12.95%
Serviceability: 12.95%
2m Heavy-
weight
PVC
Curtain
Track -
White
Has a
drawback
I bought this to hang curtains with 2 sets of linings fitted (thermal and
blackout) when these linings are fitted <CONFORMANCE> you have to
use the top row of the tape on the curtains to hang them. This makes the
curtain sit low <AESTHETICS> on the rail and causes
<SERVICEABILITY> a gap between the curtain and rail which allows
light in. I got round this by using a moulded skirting board fitted to the rail
a bit like a pelmet, it works for me. They rail itself is really easy
<FEATURE> to adjust to the correct size and to fit .
-79.48% Aesthetics: 20.92%Conformance: 28.17%Features: 24.46%Value: 10.92%
Serviceability: 15.53%
Eve 3
Light
Ceiling
Fitting -
Clear
lovely light
but...
I bought 2 eve lights for my narrow hall and was pleased
<CONFORMANCE> with them so much I bought another 2 for my living
room. However, I am so disappointed <SERVICEABILITY> that although
the sun ray effects on the ceiling is lovely <AESTHETIC> -the rest of the
ceiling is very dark(room size 12ftx15ft) They also cast <FEATURES>
massive gloomy shadows on the walls which are driving me mad and I am
going to replace <SERVICEABILITY> them. In themselves - the lights are
lovely and a bargain <VALUE> but they are only good enough for narrow
spaces like landings and halls.
-75.25% Aesthetics: 12.21%Conformance:29.50%Features: 17.99%Value: 17.67%
Serviceability: 22.63%
Table 10: Example Reviews and Concept Tagged by FCM.
41
Electronic copy available at: https://ssrn.com/abstract=3484617

Appendix D - Concept-Positional Importance
We further investigate if certain concepts matter more if presented on different review pages. Thatis, does the order in which certain review concepts are shown to customers correlate with more orless conversion? We enhanced our prediction model by breaking a journey-level concept distributioninto two position-level concept distributions. Here, the position of a review is defined as the pagein which the review is presented. Recall that the reviews are presented in groups of five and onlythe final (latest) 10 reviews are considered. Thus, there are two positions for the reviews: the firstgroup of five reviews on the first page and the second group of five reviews on the second page.
We further estimate the coefficients of five concept dimensions at two different positions. Asshown in Figure 11, the coefficients give the relative importance of concepts at each position. Theresults show that the importance of all concepts decreases in absolute value. This means that thereviews the consumer read earlier (or on the first page) are more influential than those read later(or on the second page). Among the five concepts, the coefficient drops in features and value areespecially significant. From the perspective of business owners, it might be a good strategy todisplay more reviews concentrated on features and value earlier to extract as much conversion aspossible, rather than displaying reviews concentrated in conformance and serviceability, which maybe so critical that it does not matter where they are presented.
Figure 11: Positional Importance of Concepts.
42
Electronic copy available at: https://ssrn.com/abstract=3484617

Appendix E - 20-Newsgroup Data Performance
To demonstrate the predictive performance of FCM on a publicly available dataset, we train andevaluate FCM on the 20newsgroups dataset. The 20newsgroups dataset consists of 20 collectionsof documents, each of which contains 1,000 emails from a single newsgroup. Each newsgroup isassociated with some topic (such as science, politics, computer graphics, etc.), which is also used asthe label for all the documents within the newsgroup. The newsgroups may be broadly categorized asin Table 11. We evaluate FCM on the binary classification task of distinguishing between emails froma pair of different newsgroups. Instead of evaluating on every pair of newsgroups (which is a totalof 190 pairs), we select a single newsgroup from each of the 5 broad categories in Table 11 (selectednewsgroups emphasized in italics), and evaluate on all 10 pairs derived from the selected newsgroups.For comparision, we use the XGBoost classifier. We tuned the XGBoost hyperparameters to performthe best on the test data, setting the maximum depth to 1 and eta to 0.1 for 1000 training iterations.For both FCM and the XGBoost, we report area-under-the-curve classification metrics (ROC-AUCand average-precision) as well as thresholded classification metrics (precision, recall, F1-score andaccuracy) in Tables 12 and 13. We find that FCM performs on-par with or better than XGBoostfor a majority of the newsgroup pairs on all metrics.
43
Electronic copy available at: https://ssrn.com/abstract=3484617

Subject Newsgroups
Computers (Comp) comp.graphics, comp.os.ms-windows.misc, comp.sys.ibm.pc.hardwarecomp.sys.mac.hardware, comp.windows.x
Recreation (Rec) rec.autos, rec.motorcycles, rec.sport.baseball, rec.sport.hockeyScience (Sci) sci.med, sci.crypt, sci.electronics, sci.spacePolitics (Pol) talk.politics.mideast, talk.politics.guns, talk.politics.miscReligion (Rel) talk.religion.misc, alt.atheism, soc.religion.christian
Table 11: Newsgroups in the 20newsgroups dataset grouped by category. Selected representativedataset is in italics.
ROC-AUC F1-Score Average Precision
Dataset FCM XGB FCM XGB FCM XGB
Comp + Rec 0.966 0.915 0.903 0.810 0.952 0.922Comp + Sci 0.965 0.937 0.891 0.852 0.961 0.937Comp + Pol 0.991 0.948 0.956 0.838 0.989 0.946Comp + Rel 0.972 0.891 0.904 0.780 0.959 0.899Rec + Sci 0.944 0.866 0.878 0.796 0.945 0.853Rec + Pol 0.983 0.944 0.932 0.868 0.982 0.933Rec + Rel 0.952 0.908 0.841 0.809 0.941 0.913Sci + Pol 0.978 0.932 0.925 0.819 0.975 0.934Sci + Rel 0.841 0.958 0.684 0.878 0.809 0.961Pol + Rel 0.942 0.970 0.833 0.892 0.920 0.973
Table 12: (Classification Metrics) Area under the ROC curve (AUC), average precision (AP) andF1-score (F1) for each dataset and method. 1.000 is the best score for all metrics. Best method foreach dataset is in bold.
Accuracy Precision Recall
Dataset FCM XGB FCM XGB FCM XGB
Comp + Rec 0.903 0.826 0.885 0.886 0.922 0.746Comp + Sci 0.892 0.856 0.892 0.885 0.890 0.822Comp + Pol 0.957 0.849 0.956 0.892 0.956 0.790Comp + Rel 0.927 0.800 0.926 0.865 0.883 0.711Rec + Sci 0.876 0.787 0.879 0.770 0.877 0.825Rec + Pol 0.932 0.865 0.936 0.839 0.928 0.899Rec + Rel 0.878 0.820 0.881 0.869 0.804 0.756Sci + Pol 0.927 0.832 0.933 0.864 0.997 0.779Sci + Rel 0.800 0.884 0.893 0.916 0.918 0.844Pol + Rel 0.869 0.895 0.845 0.936 0.821 0.851
Table 13: (Classification Metrics) Accuracy, precision and recall for each dataset and method withthe prediction threshold fixed at 0.5. The threshold is not tuned for any metric. 1.000 is the bestscore for all metrics. Best method for each dataset and metric is in bold.
44
Electronic copy available at: https://ssrn.com/abstract=3484617