Focus on the Coast: Mitigating Climate Change at the Local Level: Delaware Electric Cooperative
21
Delaware Electric Cooperative Efficiency, Conservation, Demand Side Management and Renewable Energy Focus on the Delaware Coast Mitigating Climate Change at the Local Level December 4, 2014
-
Upload
delaware-sea-grant -
Category
Environment
-
view
54 -
download
0
Transcript of Focus on the Coast: Mitigating Climate Change at the Local Level: Delaware Electric Cooperative

Delaware Electric CooperativeEfficiency, Conservation, Demand Side Management
and Renewable Energy
Focus on the Delaware CoastMitigating Climate Change at the Local LevelDecember 4, 2014
Efficiency & Conservation
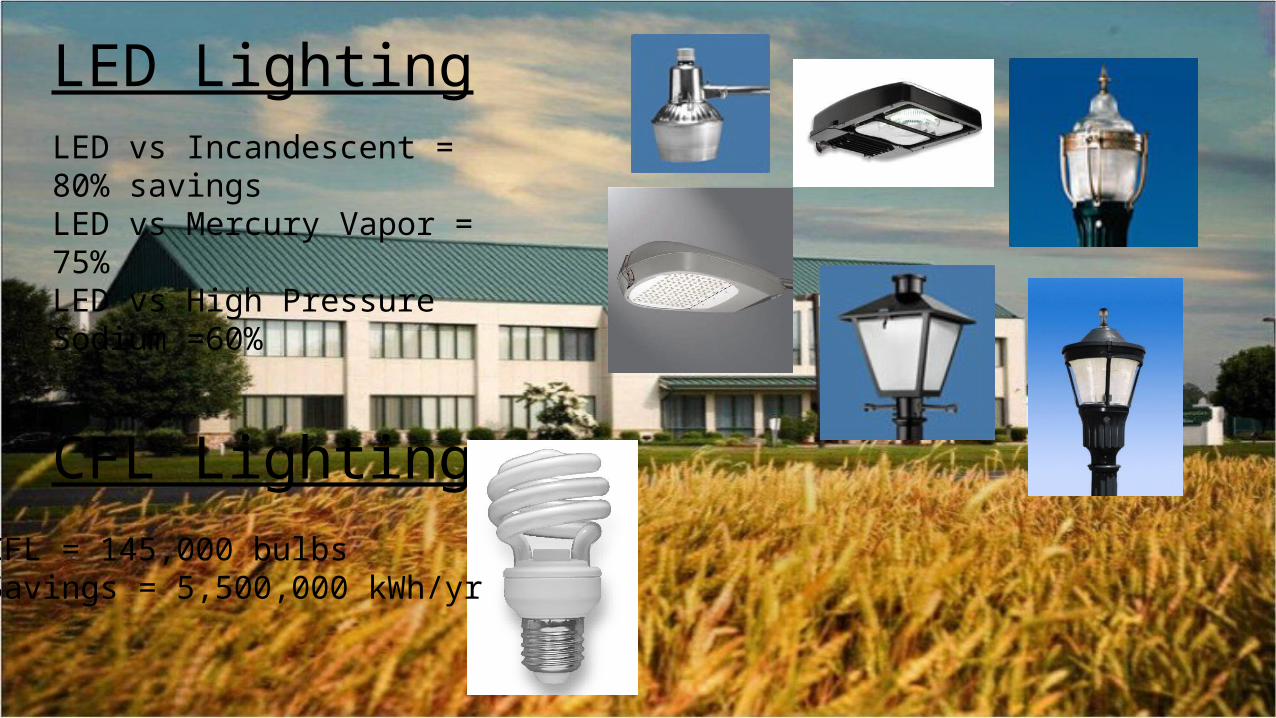
LED LightingLED vs Incandescent = 80% savingsLED vs Mercury Vapor = 75%LED vs High Pressure Sodium =60%
CFL LightingCFL = 145,000 bulbsSavings = 5,500,000 kWh/yr
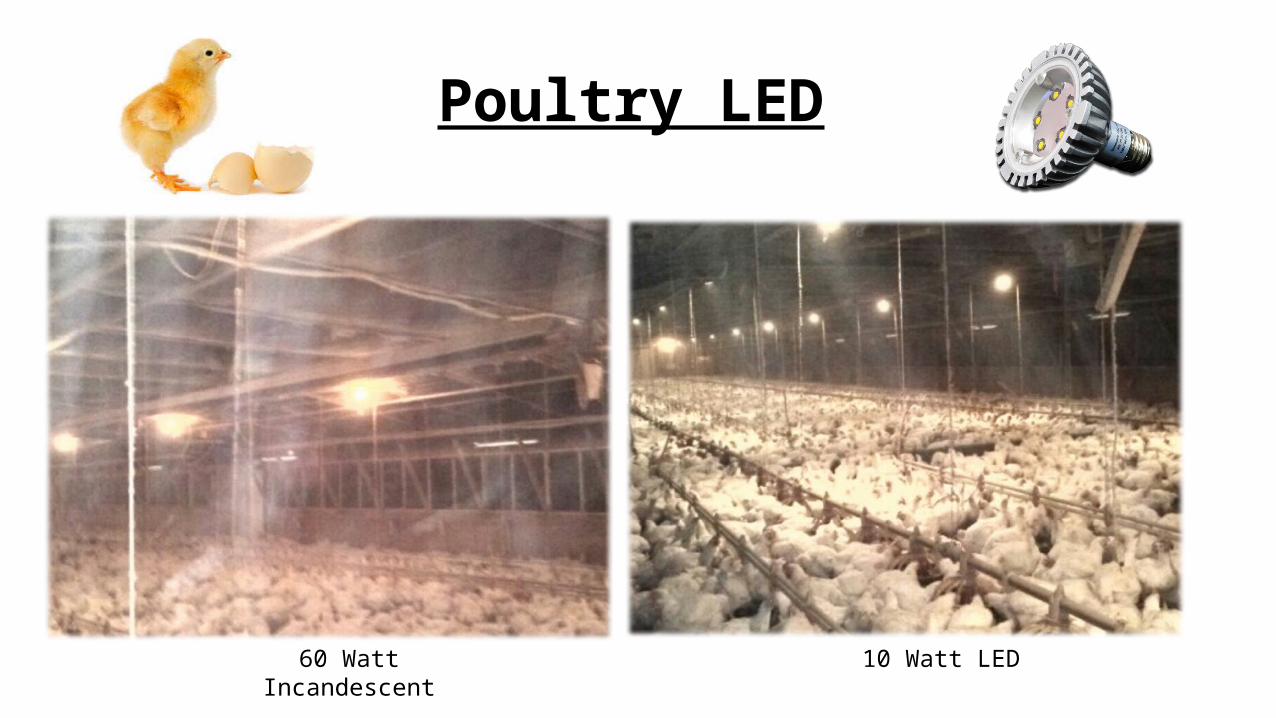
Poultry LED
10 Watt LED60 Watt Incandescent

Poultry LED
-
2,000
4,000
6,000
8,000
10,000
12,000
14,000
12,836
2,557
Energy Usage7 Flocks
Incandescent LED
kWh
10,279 kWh = 80% Savings
$0.00
$100.00
$200.00
$300.00
$400.00
$500.00
$600.00
$700.00
$800.00
$900.00
$843.30
$167.99
Energy Cost7 Flocks
Incandescent LED
Cost
$675.31 = 80% Savings
60 Watt Incandescent vs 10 Watt LED
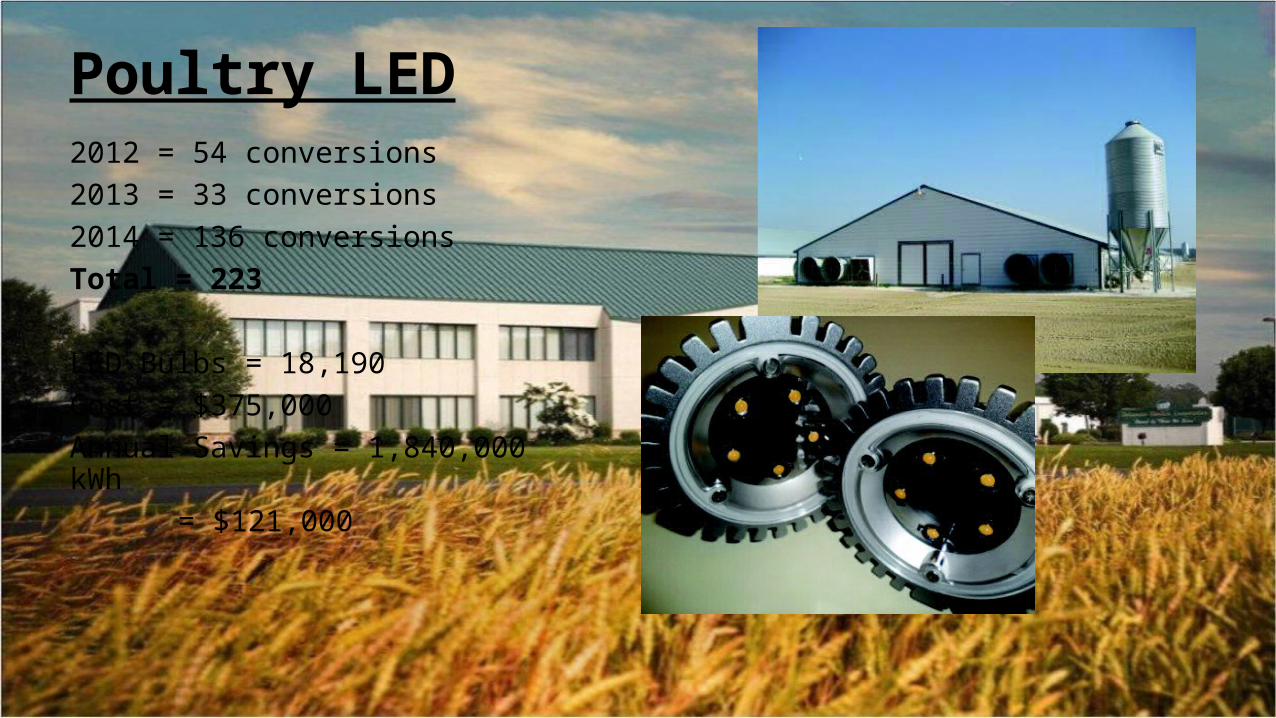
Poultry LED2012 = 54 conversions2013 = 33 conversions2014 = 136 conversionsTotal = 223
LED Bulbs = 18,190Cost = $375,000Annual Savings = 1,840,000 kWh
= $121,000
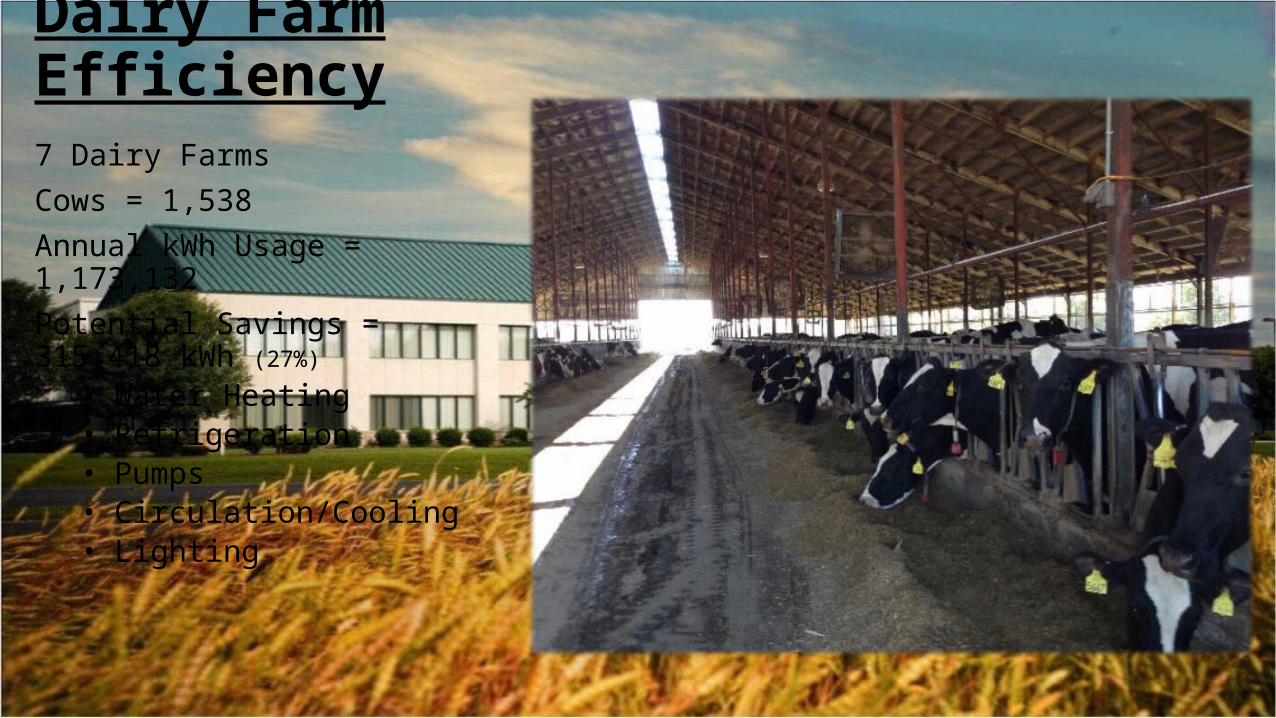
Dairy Farm Efficiency7 Dairy FarmsCows = 1,538Annual kWh Usage = 1,173,132Potential Savings = 315,418 kWh (27%)
• Water Heating• Refrigeration• Pumps• Circulation/Cooling• Lighting

Heat Pump Water Heaters = 56Solar Hot Water Heaters = 11Grants = $46,800
Water Heating Geothermal Heating/CoolingSystems = 438Grants = $1,100,000

System Improvements
1980 1981 1982 1983 1984 1985 1986 1987 1988 1989 1990 1991 1992 1993 1994 1995 1996 1997 1998 1999 2000 2001 2002 2003 2004 2005 2006 2007 2008 2009 2010 2011 2012 20130.00%
2.00%
4.00%
6.00%
8.00%
10.00%
12.00%
11.23%
4.22%
System Losses15,000,000 kWh Savings/yr

Demand Side Management

0:00 1:00 2:00 3:00 4:00 5:00 6:00 7:00 8:00 9:00 10:00 11:00 12:00 13:00 14:00 15:00 16:00 17:00 18:00 19:00 20:00 21:00 22:00 23:000
500,000
1,000,000
1,500,000
2,000,000
2,500,000
0
20,000
40,000
60,000
80,000
100,000
120,000
140,000
160,000
October 15, 2014CP = HE 20:00
DPL Zonal Load DEC Load
kW Load Con-trol 7 pm -
9 pm
144,014
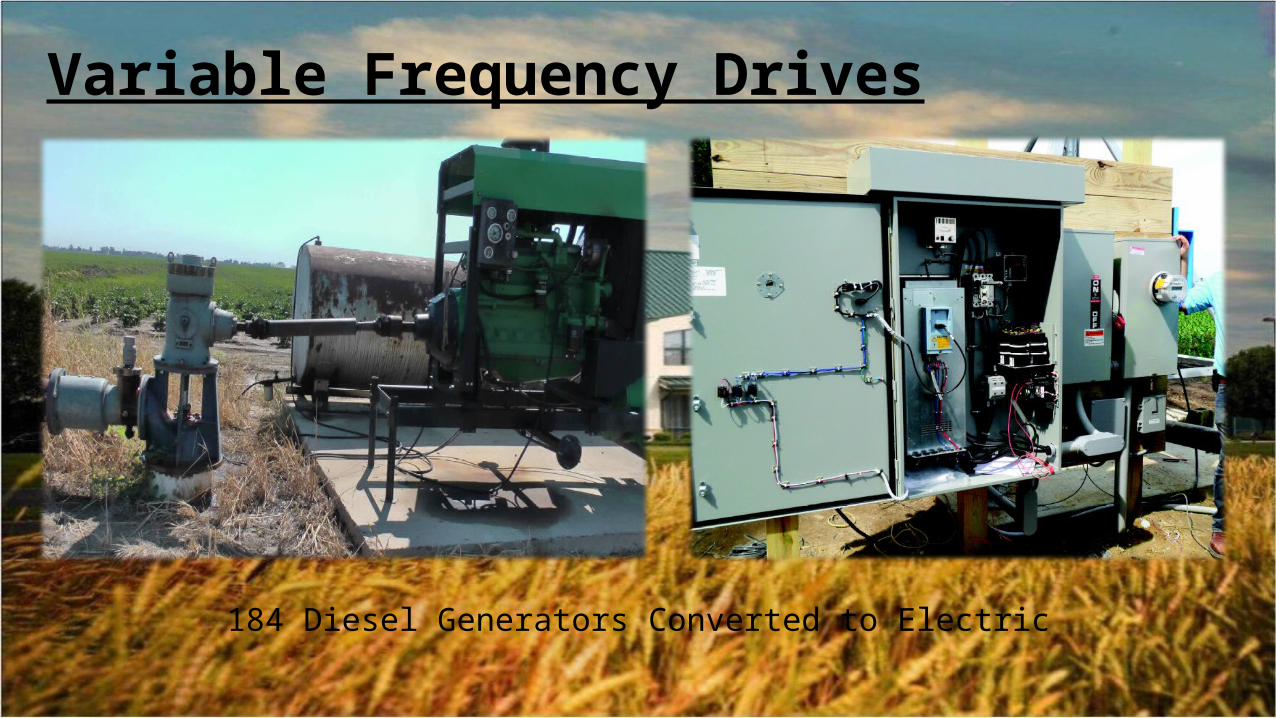
Variable Frequency Drives
184 Diesel Generators Converted to Electric

Conservation Voltage Reduction
Voltage Reduction of 2.5% - 5.0%= 4.5 MW

Beat The PeakVoluntary Reduction in Usage49,876 Indicator Lights51,193 Email Addresses
Switch & SaveSwitches = 21,138Water Heaters = 17,342AC/HP = 9,856Total Appliances = 27,198

Renewable Energy

Solar506 Installations = 3.6 MW/acAvg. = 5.8 kW Max. = 1.2 MWGrants = $2,000,000DEC Generation = 4.0 MW/acTotal = 7.6 MW/ac12,500,000 kWh/yr
Bruce A. Henry Solar Energy Farm4 MW = 6,500,000 kWh/yr

Rank Cooperative Name Watts/Customer
1 Kauai Island Utility Co-op (HI) 166.5
2 Trico Electric Co-op, Inc. (AZ) 106.1
3 Santee Cooper (SC) 57.6
4 Washington Electric Co-op (VT) 56.3
5 Delaware Electric Co-op (DE) 52.9
6 Sulphur Springs Valley Electric Co-op (AZ) 35.8
7 West Kentucky Rural Electric Co-op Corp (KY) 32.8
8 Holston Electric Co-op (TN) 23.3
9 Holy Cross Energy (CO) 21.9
10 Caney Fork Electric Co-op (TN) 17.8
Rank Cooperative Name MW
1 Kauai Island Utility Co-op (HI) 5.5
2 Delaware Electric Co-op (DE) 4.5
3 Trico Electric Co-op, Inc. (AZ) 4.3
4 Santee Cooper (SC) 2.5
5 Southern Maryland Electric Co-op (MD) 2.1
6 Sulphur Springs Valley Electric Co-op (AZ) 1.8
7 West Kentucky Rural Electric Co-op Corp (KY) 1.3
8 Holy Cross Energy (CO) 1.2
9 Volunteer Energy Co-op (TN) 1.1
10 Holston Electric Co-op (TN) 0.7
2013 SEPA Utility Solar Rankings
Top 10 Watts/Customer Top 10 megawatt

Wind Generation
Installations = 12 systems34 kW = 55,000 kWh/yrGrants = $65,000

Landfill Gas to Energy2 MW = 14,600,000 kWh/yr

Energy Efficiency Resource Standard (EERS)
Annual Sales = 1,162,642,412 kWh X 15%
174,396,362 kWh
Peak Demand = 345 MW x 15%
51.75 MW
2009Energy Conservation
& Efficiency Act
15% Reduction in Energy & Demand by 2015