Focus on Growth & Opportunities for Indian · PDF fileIndian Railways An Assessment of Major...
40
Focus on Growth & Opportunities for Indian Railways An Assessment of Major Transportation Modes Submitted by : Ankit Rastogi Research Associate, IRITM, Lucknow Facilitated by : Sri Ravij Seth FA & Sr. Prof. (Fin. & PPP), IRITM, Lucknow
-
Upload
trinhquynh -
Category
Documents
-
view
217 -
download
2
Transcript of Focus on Growth & Opportunities for Indian · PDF fileIndian Railways An Assessment of Major...

Focus on Growth & Opportunities for Indian Railways
An Assessment of Major Transportation Modes
Submitted by :
Ankit Rastogi Research Associate, IRITM, Lucknow
Facilitated by :
Sri Ravij Seth FA & Sr. Prof. (Fin. & PPP), IRITM, Lucknow

Sometimes feels, it’s too much now..... Struggling with same challenge daily while travelling from
home to office and from office to home. It similar to the winning a war, really trust me!! First you
have to check the local conveyance to reach bus stop, railway station or metro station, airport. Then
you have to clear the hurdle of getting ticket at right price. Then finally you get chance to sit on your
seat, don’t remember to share/adjust your seat with other passengers. So do I really got that , for
what I struggle an paid appropriate fare charges. Somehow if you manage to adjust with
environment, then most of the time that particular mode of transportation is going to be delayed by
new reasons. So if you have to travel 10-15 km, then you have to keep 02 hours apart from your
scheduled work. But we irritate at that moment and after some time forget about it. I think we are
very adjustable by nature so we manage each and every time and it becomes a habit of us.
We are 2nd
largest country by population and next big economic power in the world. These all big
achievements just give few minutes’ satisfaction but not the permanent solution of this particular
issue. Every time when people think to travel from one destination to another, they become
horrified by just thinking of that. Either they wish to travel in the vicinity or to travel far away they
have to consider lots of factors. The primaryfactors considered by every travellersuch as getting a
confirm ticket according to their plan, getting a conveyance to reach the appropriate starting point
and on time. They also have additional concerns about their journey like Safety, Timely, Economical,
Efficient, Safe, Reliable, environment friendly and regionally balanced transport system and so
on.This paper features analysis on the key developments and opportunities across various modes of
transportation — including road, rail, air, ports and water— which could rightly be termed as Focus
on Growth & Opportunities for Indian Railways. In this context, I have researched the potential
projects and trends imperative to realize an efficient, effective, lean and reliable Indian
transportation network.
In present days it becomes very veryhard to take care all of these factors under consideration and
we all are compromising with the present situation. All these issues are present with all major
transportation modes whether it’s a Railway...the heart line of the country, Roads....connecting the
dots or Aviation.... lets fly efficiently. We all have encountered these problems at least once in our
life time... I know lots of you will agree with me.
It's surprising me that, when we have great policies, better technology and huge man power, so why
we are lacking in the transportation area. The Transportationcomes under the Infrastructure sub -
sectorof Service sector. And agree with you that it requires enormous investments. Since
governments is lacking on this front so they embraced the PPP model for fast development of
infrastructure. Under PPP mode there is a lot of projects are done many are under progress. The PPP
mode gives win - win situation to both of the parties ie. for government and private players.

But except PPP still there is a lot
far behind in this sector in comparison
we are the fastest growing country in terms of population and economy
worry in India, as international funding is limited. The inefficient infrastructure hinders
growth. Infrastructure is also being affected by global forces. The
are having an impact on the infrastructure sector in India. They directly affect the general economy
and also specific sectors such as railway freig
slowdowns in larger and more developed economies affect its exports and imports and growth rate.
There is great need of better transportation mode because of several reasons such as very fast
growing population, urbanization, Job opportunities,
Any up/down movement in the infrastructure sector directly impact the growth of the economy of
the nation. Infrastructure development acts
prosperity. The development of cities mainly depends upon their physical, social and institutional
culture. Hence, the importance of transportation is paramount.
diverse; it serves the need of billions of people. We can see this sector’s contribution to the nation’s
GDP in the figure (1).
The vision of the twelfth five year plan (2012
Sustainable, Economical, Efficient, Safe, Reliable, enviro
transport system.Major transport investments may have significant impacts that are not well
captured through conventional cost
transport infrastructure investments tend to focus on the
travel, including time savings for travellers, cost savings for operators, and reductions in aspects like
a lot of scope for the improvement in the transportation sector. We are
far behind in this sector in comparison to the rest of world or other developing countries. In present,
we are the fastest growing country in terms of population and economy. Finance is a major source of
worry in India, as international funding is limited. The inefficient infrastructure hinders
growth. Infrastructure is also being affected by global forces. The Euro zone and the U.S. economy
are having an impact on the infrastructure sector in India. They directly affect the general economy
and also specific sectors such as railway freight. India is an integrated and globalized country
slowdowns in larger and more developed economies affect its exports and imports and growth rate.
There is great need of better transportation mode because of several reasons such as very fast
tion, urbanization, Job opportunities, increasing income level, access to basic utilities.
Any up/down movement in the infrastructure sector directly impact the growth of the economy of
development acts as catalyst for nation’s economic development
The development of cities mainly depends upon their physical, social and institutional
culture. Hence, the importance of transportation is paramount. India’s transport sector is large and
illions of people. We can see this sector’s contribution to the nation’s
The vision of the twelfth five year plan (2012-17) is motivated by a modal mix which will lead to a
Sustainable, Economical, Efficient, Safe, Reliable, environment friendly and regionally balanced
Major transport investments may have significant impacts that are not well
captured through conventional cost-benefit analysis. Conventional economic evaluations of major
stments tend to focus on the direct costs and benefits arising from
travel, including time savings for travellers, cost savings for operators, and reductions in aspects like
improvement in the transportation sector. We are
to the rest of world or other developing countries. In present,
Finance is a major source of
worry in India, as international funding is limited. The inefficient infrastructure hinders economic
and the U.S. economy
are having an impact on the infrastructure sector in India. They directly affect the general economy
ht. India is an integrated and globalized country—
slowdowns in larger and more developed economies affect its exports and imports and growth rate.
There is great need of better transportation mode because of several reasons such as very fast
level, access to basic utilities.
Any up/down movement in the infrastructure sector directly impact the growth of the economy of
conomic development and
The development of cities mainly depends upon their physical, social and institutional
India’s transport sector is large and
illions of people. We can see this sector’s contribution to the nation’s
17) is motivated by a modal mix which will lead to a
nment friendly and regionally balanced
Major transport investments may have significant impacts that are not well
benefit analysis. Conventional economic evaluations of major
direct costs and benefits arising from
travel, including time savings for travellers, cost savings for operators, and reductions in aspects like

air pollution, noise, and accidents.The impact in terms of economic exchanges, accessibility, and
productivity gains are expected to be significant, and extend beyond traditional transport savings.
Now you are excited to know the reasons behind these kind inefficient transportation modes. We
will analyze the all major transportation modes with special focus on their passenger and freight
operations, and the current sub sector trends. So before going in details, just have a overview of all
four major transportation modes performance.
FDI Flows to infrastructure (US $ million)
Sector 2009-10 2010-11 2010-11 Apr-Nov
2011 2012
Air Transport 22.6 136.00 31.22 27.50 13.72
Sea Transport
284.9 300.51 129.36 99.42 36.23
Ports 65.4 10.92 0.00 0.00 0.00
Railway Related Components
34.2 70.66 42.77 35.16 17.79
Share and Growth of India’s Services Sector (at factor cost) (%)
Transport 2000-
01
2005-
06
2006-
07
2007-
08
2008-
09
2009-
10
2010-
11
2011-
12
Railways 1.1 0.9 0.9 1.0 0.9 0.9 0.8 0.7
4.1 7.5 11.1 9.8 7.7 8.8 5.9 7.5
Transport
by other
means
5.0 5.7 5.7 5.6 5.5 5.3 5.3 5.4
7.7 9.3 9.0 8.7 5.3 7.3 8.2 8.6
Indicators: Performance of India’s service sector
Sector Indicators Unit Period
2008-09 2009-10 2010-11 2011-12 2012-13
Aviation
Airline
passengers
(domestic and
international)
Million 49.5 54.5 64.5 70.2 67.5
Ports Port traffic Million
Tonnes 744.02 850.03 885.45 911.68 455.77
Railways
Freight traffic by
railways
Million
Tonnes 833.31 887.99 832.75 969.78 735.32
Net tonne km of
railways million 538226 584760 444515 639768 470956

Comparison between Major transportation modes
Mode Growing Demand Opportunities Policy Support
Railways
• Greater connectivity
between different cities,
towns and villages has led
to increased road traffic
over the years
• There has been increasing
movement of goods within
the country as well
• Freight traffic is set to
increase manifold, thanks
to investments and
private sector
participation
• Metro rail projects are
being envisaged across
many cities over the next
ten years
• Government has increased
the scope of PPP, to beyond
providing maintenance and
other such supporting roles
• Government is providing new
lines, increasing the rolling
stock to build up capacity
Roads
• Greater connectivity
between different cities,
towns and villages has led
to increased road traffic
over the years
• There has been increasing
movement of goods within
the country as well
• Roads and bridge
infrastructure industry to
be worth USD21 billion by
FY17
• Approximately 9,500
kilometres of projects are
expected to be awarded
by NHAI during 2012-13
• Road infrastructure is a key
government priority; the
sector has received strong
budgetary support over the
years
• Encouragement to private
sector participation;
relaxation of foreign
investment norms
Aviation
• Growth in passenger traffic
likely to go up as incomes
rise and more tourists flow
in
• Freight traffic also likely to
go up as trade with the rest
of the world increases
• Growth in aviation
accentuating demand for
MRO facilities
• Bright prospects due to
location advantage; there
is no MRO facility within
a five - hour fly zone of
the country
• By 2020, MRO industry is
likely to touch USD1.5
billion
• The government has been
encouraging private sector
participation
• Tax incentives for developers;
liberalisation of the aviation
sector - Open Sky Policy
• Government has allowed 49
per cent FDI in aviation for
foreign carriers
Evolution of major Transportation Sectors:
1. Railways
• India has the world’s fourth largest rail network and also second largest under single
management,
• It has a total route network of about 64,500 km spread across 8,241 stations,
• Operates more than 19,000 trains every day,
• It has 229,381 wagons, 59,713 coaches and 8,417 locomotives,
• IR’s total assets at the end of FY11 amounted to USD55.5 billion,
Parameters Unit FY1951 FY 2011
Net Revenues INR billion 0.5 63.5
Passenger Traffic Billion 1.3 7.8
Freight Traffic Million metric
tonnes
73.2 926.4
No of Stations -- 5,976 8,241
Running Track Km 59,315 87,114

2. Roads
• India has the second largest road network in the world (4.1 million kilometres)
• Roads bear about 90 per cent of the country’s passenger traffic and 65 per cent of freight
traffic
Parameters Unit FY03 FY 2011
Length of National
highways Km
58,112 71,772
Passenger vehicle
sales
707,000 2,63,787
NHDP toll collection USD
million
64.5 435
Highway projects
awarded by NHAI Km
677 6491
Share of infrastructure
in total bank funding %
2.3 14
3. Aviation
• 9th largest civil aviation market in the world
• India is ranked 4th in domestic passenger volumes (45.3 million*)
• India’s civil aviation market is set to become the world’s 3rd largest by 2020
• India has 136 airports, 128 of which are owned by AAI
Parameters Unit FY 2000 FY 2011
Scheduled airlines:
distance flown mn km
199 762
Non-scheduled airlines
in operation --
39 136
Number of aircraft -- 225 1188 (2012)
Passenger handling
capacity at airports million
66 233 million (2012)
Number of operational
airports --
50 125 (2012)
Aircraft movement Freight Traffic Passenger Traffic
International airports 79 % 96% 84%
Others 21% 4% 16%

Significant Government Spending On Infrastructure
The Indian government has earmarked about INR 50,000 billion according to the XII Five
Year plan (2012-17) against INR 25,000 billion in the XI Five year Plan (2007-12) for
infrastructure investment. Around one-fourth of this investment is expected to be in roads,
rail, and aviation and port projects representing a sharper focus on transportation
infrastructure. For example, INR 281 billion has been allocated for the 2700km-long
Dedicated Rail Freight Corridor project.
Source: Planning Commission of India, KPMG Analysis

Comparison on Key parameter
Source: Cygnus Business Consulting & Research, KPMG Analysis

Disaster Risk Shadow on PPP Projects
Few weeks back there was climatic disaster in Uttarakhand and there is debate going on
Development V/s Disaster management. So I am including this topic of “Disaster Risk
Shadow on PPP Projects” which gives essences over the debate topic. As all
infrastructure projects are now executing through PPP mode, so it is very important to
minimize the disaster results. As we all know that in PPP projects the government has
very low control over the executing private partners and latter has little interest in long
term safety issues of the projects. According to the Global Assessment Report (GAR) on
disaster risk reduction for Asia pacific, an UN study notified India that its vast
infrastructure assets exposed to disaster risk. These partnership projects transfer their
shared costs to the public sector as they do not necessarily lead to improved disaster risk
assessment and management. As per report projection during 12th Five Year Plan, an
investment in infrastructure development is worth about $1 trillion property facing
disaster risk from unsafe public assets. The report puts the estimated exposure of
economic assets in Mumbai alone was increased from $46 billion in 2005 to $1598 billion
in 2070.
In the middle and low income countries the exposure such as urban growth, natural and
artificial subsidence, sea level rise and climate change are likely to rise significantly. Its
advised by the Un to the government to integrate disaster risk information into
investment decisions; building public private risk governance and disclosing disaster risks
and costs on balance sheets of companies. The GAR concerns specifically in areas of
SEZs, Globalised Supply Chains which enhance the vulnerability of disaster.

Railways

Spanning 64,456 km with more than 7,133 railway stations, India’s rail network is the largest
in Asia and the second largest in the world (behind the US).26 The Indian Railways operates
19,000 trains daily, transporting 2.65 MMT of freight and 23 million passengers across the
country. However India’s rail infrastructure suffers from chronic under-investment, due to
which its potential for freight movement remains largely untapped. Rail freight has grown at
around 7 % over the past five years. It is expected touch the 1 billion ton mark in 2013, with a
31% share of total freight movement across all modes of transport. This is in stark contrast to
its share of 89% in 1951.Considering the requirements of the economy and size of the
country, the expansion of the railway network has been inadequate. Indian Railways have
added 11,864 km of new lines since independence.It has not been able to cover major areas
in many states and has very little presence in the North-East States and the Himalayan
region.The network needs extensive modernisation, increase of speeds, improvement in
safety and modernisation of rolling stock to meet the needs of a rapidly growing economy.
Indian Railway’s Financial Position Overview
Source: 12th
Five year Plan Report
The Indian railways (IR) have consistently lost out to road, as the preferred mode for goods
movement across the country. While traffic on rail has grown more than tenfold between
1951 and 2007, rail track length has only grown 1.4 times during the same period. Moreover,
trunk routes constitute merely 16% of the network and transport morethan 50% of total
traffic, resulting in major congestion and a low average speed of 25 km/hr for freight trains.27

As compared to global standards, India’s track length per sq. km. is unfavourable at 44 km of
track per 1,000 sq. km. of arable land, as against 137 km in the US and 417 km in Germany.
Traffic
Passenger Traffic went up because of rising income, urbanisation driving passenger traffic
growth. Urban population in India increased from 17.3 per cent of the total population in
1951 to 31.2 per cent in 2011; this has led to increase in traffic between urban and rural areas
in the country. Improvement of urban-rural connectivity by rail has been another major
contributor to passenger growth. Further, passenger traffic continues to enjoy significant
priority over rail freight. In addition to first right of movement, passenger rates are highly
subsidized by freight
operations utilizing up to
72.3% of network capacity
but contributing only 30% to
revenue, while passenger
segment accounts only for
27.7%.
Source: KPMG in India
Analysis
Despite these apparent limitations, rail continues to be among the fastest and most
economical modes of transport for freight in India. Two-thirds of freight in India is transported
over medium and long distances, for which rail transportation offers significant time and cost
savings.
Percentage Share of Rail - Road in Freight Traffic Movement
Source:World
Bank.www.databank.worl
dbank.org

The capital cost of setting up rail capa
modes such as expressways, w
transportation, specifically on high
other modes. Additionally, rail of
The originating passenger traffic achieved in
millionwhich is,3.2% lower than the original Eleventh
cent higher than the revised target of the Eleventh Plan.
Railways are making large revenue
suburban segments. Non-revisionof
IR.
Infrastructure Capacity Creation
The Eleventh Plan attempted a paradigm shift from the earlier incremental approaches to one of
significant infrastructure capacity addition to handle the quantum increase in traffic levels and to
sustain mobility on the network by setting ambitious targets as compared to the performance during
the Tenth Plan. The targets in respect of new lines and electrification have be
The expanding requirements of the economy will need much faster expansion of the freight network
along with its ability to carry larger freight per wagon, improve efficiency of the Rail system to deliver
it faster and expand the network. There will also be need to improve the share of the Railways in the
overall national freight market. With increasing incomes, passenger traffic will increase but plan for
expansion must factor in the fact that demand will
will be willing to pay.
The rail network has to develop a strategy to be part of an effective multi
ensure environmental-friendly and economically efficient transport movement.
be prioritised in the important areas, vi
stock, last mile rail linkages and port connectivity
The capital cost of setting up rail capacity is around 40% lower than that of comparable
modes such as expressways, when measured on a ton-kilometer basis. Further, costs of rail
transportation, specifically on high-traffic density corridors, are considerably lower than for
other modes. Additionally, rail offers speed and capacity-related benefits.
g passenger traffic achieved in the terminal year of the Eleventh Plan is 8,139
than the original Eleventh Plan target of 8,400 m
than the revised target of the Eleventh Plan.
ilways are making large revenue losses in passenger traffic both in suburban as well as
revisionof tariff for several years has led to poor financial
Source: 12th
Five year plan Report
Infrastructure Capacity Creation
The Eleventh Plan attempted a paradigm shift from the earlier incremental approaches to one of
ure capacity addition to handle the quantum increase in traffic levels and to
sustain mobility on the network by setting ambitious targets as compared to the performance during
the Tenth Plan. The targets in respect of new lines and electrification have been exceeded.
Source: 12th
Five year plan Report
The expanding requirements of the economy will need much faster expansion of the freight network
along with its ability to carry larger freight per wagon, improve efficiency of the Rail system to deliver
it faster and expand the network. There will also be need to improve the share of the Railways in the
overall national freight market. With increasing incomes, passenger traffic will increase but plan for
expansion must factor in the fact that demand will be for better quality services for which passengers
The rail network has to develop a strategy to be part of an effective multi-modal transport system to
friendly and economically efficient transport movement.Investment
important areas, viz. Dedicated Freight Corridors, high capacity rolling
and port connectivity.
than that of comparable
basis. Further, costs of rail
considerably lower than for
the terminal year of the Eleventh Plan is 8,139
Plan target of 8,400 million but 0.75 per
fic both in suburban as well as non-
years has led to poor financial health of
Five year plan Report
The Eleventh Plan attempted a paradigm shift from the earlier incremental approaches to one of
ure capacity addition to handle the quantum increase in traffic levels and to
sustain mobility on the network by setting ambitious targets as compared to the performance during
en exceeded.
Five year plan Report
The expanding requirements of the economy will need much faster expansion of the freight network
along with its ability to carry larger freight per wagon, improve efficiency of the Rail system to deliver
it faster and expand the network. There will also be need to improve the share of the Railways in the
overall national freight market. With increasing incomes, passenger traffic will increase but plan for
be for better quality services for which passengers
modal transport system to
nvestment needs to
high capacity rolling

India has a well-developed Rail network in dire need of modernization and is struggling to
increase its highway and expressways.
Rationalization of Railway freight and passenger fare:
Between 2004-05 and 2010-11 the IR’s input costs increased by 10.6% per annum. But
passenger fares remained unchanged / reduced in lower classes. This causes constraining
internal resource generation, essential for replacement / renewal of assets, operation and
maintenance activities and critical safety and passenger amenity works. Also the cross-
subsidy through the freight business was no longer feasible because of fast evolving
competition from other modes of transport. Keeping these factors in mind, an increase in
passenger fares was announced on 9 January 2013, effective from the January 2013.
Up gradation of Passenger Amenities
To provide the basic facilities like drinking water, functioning toilets, catering services, waiting rooms,
dormitories especially for lady passengers and better signage, In 2009 the Adarsh station scheme was
introduced. Out of identified 976
stations 616 stations have been
developed as Adarsh stations.
The other initiatives are, the UTS
was made available at 10,172
counters (nov ‘12), the total
installed AVTMs was around 808
(12-13), the FOIS (Freight Operation
information System) and its module
RMS (Rake Management System)
was installed at more stations.
High-Speed Passenger Trains
Indian Railways is adopting a multi-
pronged strategy to provide safer,
faster, cleaner, and more
comfortable passenger trains. Seven
corridors have been identified for
conducting pre-feasibility studies for
Source: http://www.uic.org/IMG/jpg/carte_inde.jpg

running high-speed trains (popularly referred to as bullet trains) at speeds above 350 kmph.These
corridors will be set up through PPP route. Initially, the Mumbai-Ahmedabad corridor has been taken
up for which the pre-feasibility study has been completed. Work is in progress in respect of the
remaining corridors. A study is also being done on the Delhi-Mumbai route for raising the speed of
passenger trains from 160 kmph to 200 kmph, i.e. for running semi-high speed trains.
Major trends in Indian Railways
1. There is a rapid increase in demand for urban mass transportation systems in the country.
Several metro rail projects are in progress to improve connectivity within cities; the Delhi
Metro has emerged as an internationally acclaimed venture.
2. Indian Railways (IR) launched mobile ticketing services in August 2011 to make the ticket
issuing process more efficient. Users can directly buy a ticket from their mobiles that would be
delivered to them through a non-transferable SMS.
3. IR has attracted increasing investments from overseas through strategic alliances with various
countries over the last few years. Subsidiaries of foreign companies are being set up to cater
to the huge demand offered by IR.
4. IR is planning to build seven high-speed rail corridors to provide faster rail connectivity across
the country. The trains will be capable of running at speeds up to 300 kilometres per hour.
Modernisation of Indian Railways
To modernize Indian Railways, the focus is on two fundamental drivers - Safety and Growth and along
a five-pronged strategy
1. Modernise core assets - They are key
revenue generating assets
2. Explore new revenue models - To meet the
funding needs for modernisation and growth
3. Review projects - To ensure financial
viability, social benefits, and timely
implementation
4. Focus on enablers - For a holistic and long
term approach to modernisation and
execution
5. Mobilize resources - To capitalise on an
opportunity

Benefits of High Speed Rail...more Sustainable Transportation
• Improve the economic development of the regions served, increase their competitiveness and
reduce their peripherally;
• Contribute to the country’s longer-term environmental goals by attracting passengers from air
and car, whilst also taking the pressure off runway capacity and
• Through the release of rail capacity, unlock the development of improved commuter and
regional services whilst permitting improvement in both the capacity and transit times of
freight services. The latter would make a significant contribution to the development of the
strategic freight network that the rail industry has been developing.
• There is need for capacity as well as speed. New infrastructure should be capable of delivering
Greater Capacity, Improved Journey Times & Support High Speed Services.
• Other benefits would be in terms of a reducing the carbon footprint of passengers attracted
from air and car, contributing to potentially reduced demand for runway capacity and
encouraging a significant shift from car, with a reduction in congestion. More work is required
to understand and quantify such benefits.
• High speed lines based on advanced rail technology have the advantage of being compatible
with the conventional rail network, so that trains can use existing city centre stations, or run
through to destinations where a new high speed line could not be justified.
• Whilst energy consumption increases as speed rises, this can be offset through effective system
and rolling stock design, and the higher capacity of trains mean that emissions per passenger
kilometre remain low compared with other modes. Eurostar, for example, offers passengers a
carbon neutral journey.
• The lead time for development and construction of HSR is very high such as 20 years, and this is
why it is right to plan now for lines that will be required in near future. It is also why it is
essential that Government continues to invest in upgrading capacity and capability of existing
routes to meet the growth in demand of future.
• Impact the course of future development within the region.
• At the regional scale, the increased accessibility afforded by high speed rail can serve to
concentrate development in and around communities
• Sustainability speaks to decision making that considers the impacts of our actions now on
future generations. When developing major infrastructure, such as high-speed rail in India,
program designers should develop a program that safeguards the capacity of future
generations to enjoy a quality life. This is achieved by balancing a variety of factors, including
environmental, economic, political and cultural factors to develop a high-speed rail system that
will benefit the India for decades to come.
Strategy
High speed rail is a very complex system, comprised by state of the art of a lot of elements (Track
Layout, Civil Works, Bridges, Tunnels, Track, Switches, Stations Situation and Type, Rolling Stock from
Technical Point Of View, Rolling Stock from Customer Point Of View, Traffic Forecasting, Marketing,
Financing, Juridical Aspects, Environment, Communication Programme, Etc.). High speed rail is a highly
beneficial transport system for customers and Society, not applicable in the same conditions in every
case. The conception of one of such system is not unique and it must be adapted to each case and
each country. High Speed is a key element for interurban passengers transport in the future due to
capacity, respect to environment and safety.
Background
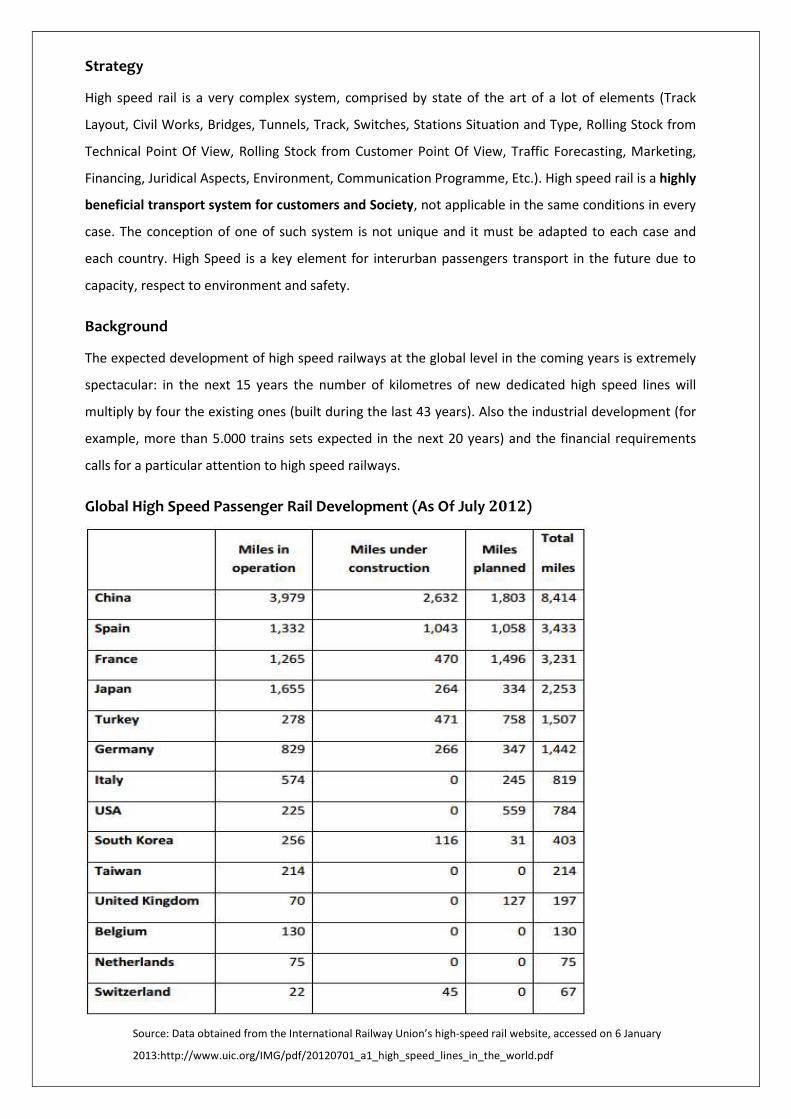
The expected development of high speed railways at the global level in the coming years is extremely
spectacular: in the next 15 years the number of kilometres of new dedicated high speed lines will
multiply by four the existing ones (built during the last 43 years). Also the industrial development (for
example, more than 5.000 trains sets expected in the next 20 years) and the financial requirements
calls for a particular attention to high speed railways.
Global High Speed Passenger Rail Development (As Of July 2012)
Source: Data obtained from the International Railway Union’s high-speed rail website, accessed on 6 January
2013:http://www.uic.org/IMG/pdf/20120701_a1_high_speed_lines_in_the_world.pdf

Dedicated Freight Corridor (DFC)
Dedicated Freight Corridor can be justifiably called an innovation in rail transport in India because of a
number of reasons. The average speed of freight trains will go up from 25 kmph to 70 kmph which will
reduce the transit time by less than half from the present leves.To drive a fundamental shift in the
modal mix from less efficient, usually uneconomic and environmentally unfriendly road-based
transportation to rail, projects similar to the envisioned DFC would play an important role in the
future.
However, it is expected to mark a paradigm shift in the transportation scenario, resulting from the
segregation of freight on trunk routes, improving service delivery and generating additional freight-
carrying capacity. The project envisages the construction of two corridors, one each on the west and
east routes, spanning a total length of about 3,300 km. The Eastern Corridor, starting from Ludhiana in
Punjab, will pass through the states of Haryana, Uttar Pradesh and Bihar and terminate at Dankuni in
West Bengal. The Western Corridor will run from Dadri to Mumbai, passing through the states of
Delhi, Haryana, Rajasthan, Gujarat and Maharashtra.
Objectives ofDedicated Freight Corridor (DFC)
1. Reduction in unit cost of tranportation by spreading up freight train operations and increasing
productivity.
2. Increase of rail freight share in modal mix through customized logistic services.
3. Segregation of frieght and passenger lines for focused approach
4. Creation of additional rail frieght capacity to cater to high levels of transport demand
5. Introduction of time tabled freight services for guaranted transit time and improved service
quality
6. Adoption of high end technlogy to track freight and real time data analysis
Proposed timelines for DFC construction
AviationAviation

Aviation is the fastest means of transportand has expanded rapidly with the opening up of domestic
skies to the private carriers in the second half of the 10th
plan via public private partnership
investment in the airport infrastructure. The air transport on long distance routes handles
substantial traffic. This sector also enhances the productivity and efficiency in the movement of
goods and services. It also has an important role to play on routes which involve difficult territory.
Aviation sector contributes significantly in development by generating employment opportunities.
As per estimation, the total manpower requirement (including numbers of pilots, cabin crew, aircraft
engineers and technicians, ground handling staff, cargo handling staff, administrative and sales staff)
of airlines will rise from 62000 in 2011 to 117000 by 2017. Aviation to India becomes strategically
important in the absence of widespread water ways network and the delayed development of
infrastructure projects related to other modes of transportation.
India’s Major Airports with Passenger Traffic
Source: AAI
Air cargo works as a vital link between domestic and international markets.The total volume of air
cargo traffic presently constitutes about 1 per cent of total trade, it accounts for close to 29 per cent
of total trade value. This present status is only been possible when in 2009 GoI adopted Open Sky
policy for the air cargo sector. This sector has seen the significant growth from 0.7 MMT in 1995-96
to 2.7 MMT in 2011-12. As Indian in-house demand increases in equivalent with
enhancedintegration with the global economy, it is foreseen that air freight traffic would grow five
times over the next two decades.

Growth projection for the 12
Passenger/Freight Passenger (millions)
Domestic
International
Cargo (MMTPA)
Domestic
International
Performance of Major Operators
Source: All statistics are for the month of September 2012 as published
India has become the ninth largest
civil aviation market in the world.
According to an estimate, airlines in
India are expected to add around
370 aircrafts worth Rs. 150000 Cr to
their fleet by 2017. There are
several major drivers behind the
growth of aviation sector in India
such as increased FDI inflows
higher house hold incomes, the
Entry of low cost carriers increased
23.8
27.2
129.6
69
0%
10%
20%
30%
40%
50%
60%
70%
80%
90%
100%
Jet (Airways +lite)
Indigo
Pe
rce
nta
ge
Market Share (%)
12th Five Year Plan
2011 2016-17 Average annual Rate of Growth
106 209
38 60
0.9 1.7
1.5 2.7
Source: 12
Performance of Major Operators
Source: All statistics are for the month of September 2012 as published by Directorate General of Civil
India has become the ninth largest
civil aviation market in the world.
According to an estimate, airlines in
India are expected to add around
370 aircrafts worth Rs. 150000 Cr to
There are
several major drivers behind the
growth of aviation sector in India
ows,
, the
Entry of low cost carriers increased
Source: India Brand Equity Foundation
27.219.3 18.5
7.6
6965.2 64.4
67.7
Indigo Air India Spicejet Go Air
Operators
Market Share (%) Flight Occupancy Rate (%)
Average annual Rate of Growth
12%
8%
12%
10%
Source: 12th
Five Year Plan
by Directorate General of Civil
Aviation
: India Brand Equity Foundation
3.5
58.4
Kingfisher
cargo movement,strong economic growth, surging tourist inflow sustained business growth and
supporting government policies are the major drivers for the growth of aviationsector in India.
According to the Forecasts made by AAI, for the next 5 years, it has projected a sustainable growth
rate of 16% for international and 20% for domestic aviation sector.
There are total 136 airports are in India, in which 128 are managed by AAI and rest of them are by
non-AAI. There are also some achievements of the Indian aviation sector which they achieved during
2000-2012. The no of operational airports are increased from 50 in the year 2000 to 125 in the year
2012. There is also increase in the aircraft from 225 in the year 2000 to 1188 in the year 2012. And
result of these two causes the expansion of passenger handling capacity at airports from 66 million
to 233 million in between 2000-2012.
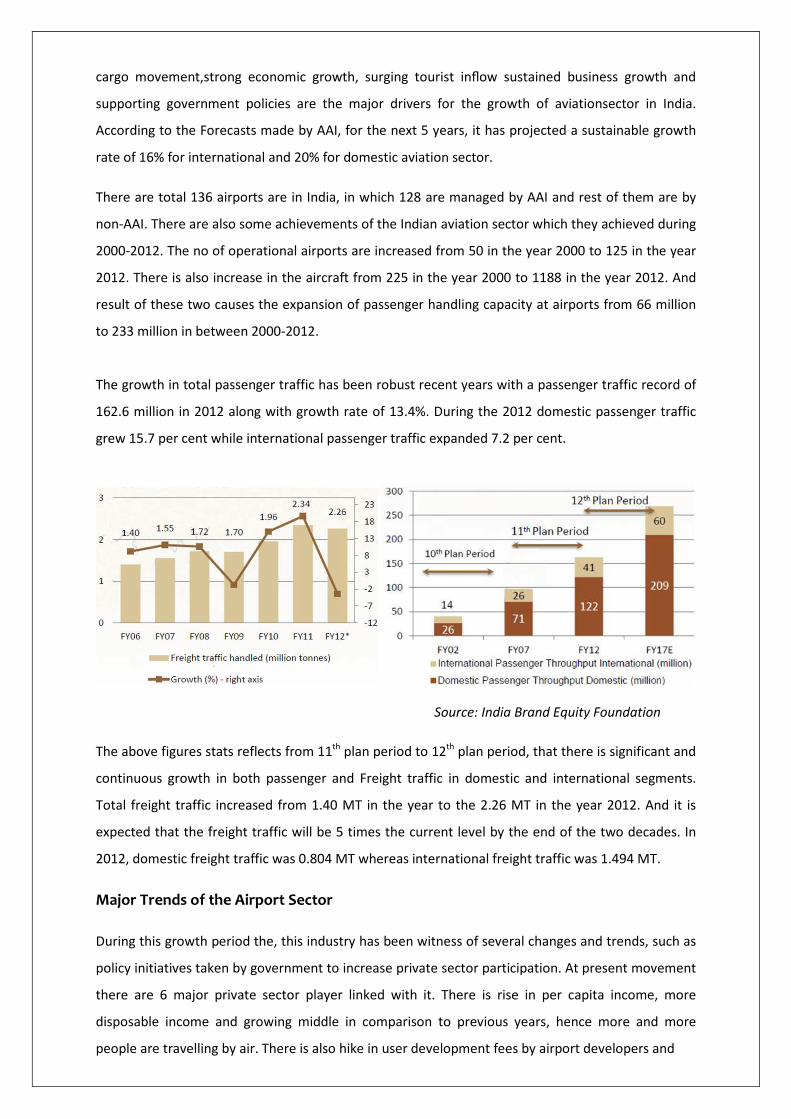
The growth in total passenger traffic has been robust recent years with a passenger traffic record of
162.6 million in 2012 along with growth rate of 13.4%. During the 2012 domestic passenger traffic
grew 15.7 per cent while international passenger traffic expanded 7.2 per cent.
Source: India Brand Equity Foundation
The above figures stats reflects from 11th
plan period to 12th
plan period, that there is significant and
continuous growth in both passenger and Freight traffic in domestic and international segments.
Total freight traffic increased from 1.40 MT in the year to the 2.26 MT in the year 2012. And it is
expected that the freight traffic will be 5 times the current level by the end of the two decades. In
2012, domestic freight traffic was 0.804 MT whereas international freight traffic was 1.494 MT.
Major Trends of the Airport Sector
During this growth period the, this industry has been witness of several changes and trends, such as
policy initiatives taken by government to increase private sector participation. At present movement
there are 6 major private sector player linked with it. There is rise in per capita income, more
disposable income and growing middle in comparison to previous years, hence more and more
people are travelling by air. There is also hike in user development fees by airport developers and

operators. The another important trend is the focus on non-aeronautical revenue like increase the
beverages and food retail segment at airports due to absence of complementary meals in low – cost
airlines. And all the above mentioned reasons aid higher aircraft movement.
Investment in Airport sector
Through the PPP mode the private sector investments in airport has raised up. There are five most
remarkable examples of international airports via PPP mode. The investment in airport
infrastructure has grown substantially over the last three Five-Year plans with Rs. 361.4 billion of
investment set aside in the 11th
plan. According to 12th
Five Year plan, there is a provision for
investments of Rs. 675 billion. Apart from those private investments has multiplied 2.2 times, from
34.4 % during the 10th
plan to 74.1% during the 12th
plan.
Air Passenger & Cargo Traffic:
Traffic 2011 2012
Domestic passenger 108 million 106 million
International passenger 36.20 million 37.8 million
Domestic cargo Almost same as in the
corresponding period of the next
year
0.73 MMT
International cargo 1.37 MMT 1.30 MMT

During year 2012, AI’s passenger load factor was 70.9 % and yield at Rs. 4.31 per revenue passenger
kilometre and it’s expected that company will achieve positive EBIDTA (earnings before income,
taxes, depreciation and Amortization) in the results for the Financial Year 2012-13.
The aim of 11th plan was to provide world class infrastructure for safe, reliable and affordable air
services, hence increase the passenger growth and cargo traffic and air connectivity to remote and
inaccessible areas. Now as per 12th
plan, GoI aims to propel India among the top five civil aviation
markets in the world with the base of the 11th
plan.
Airport Infrastructure
The Twelfth Five Year Plan (2012-17) envisages an investment of Rs. 65,000 crore at Indian airports,
of which a contribution of about Rs. 50,000 crore is expected from the private sector.
As per the investment plans of the operators, the passenger terminal capacity is expected to be 230-
240 million by 2012 and by 2017 it would be about 370 million. According to an independent
estimate there will be an additional requirement of 30 functional airports by the end of 2017 and
about 180 functional airports in the next 10 years. Because of this substantial traffic growth in
passenger and cargo requires ample amount of investment for construction of new airports,
expansion and modernisation of existing airports, improvement in connecting infrastructure (road,
metro, sea link, and so on) and better airspace management. Special attention is required for
developing airports in remote areas.
Price Structure
The cost of Aviation Turbine Fuel (ATF) constitutes almost 40-50 % of the total operating cost. The
high cost of ATF is aggravated by taxes, which badly affects the financial health of airlines.it is around
60 % costlier than competing hubs like Dubai, Singapore and hurts India’s competitiveness.
According to latest five year plan report, it should be either included in in the unified Goods and
Service tax or accorded the status of Declared Good that carries lower and uniform tax rate.
Multi Modal Connectivity
Whoever travelled by air, can easily understand the pain of the reaching airport, whether you are
talking about New Delhi or Bangalore traveller facing the same issue. As the, major airports in India
are mostly located in the outskirts of the city. This issue adversely affects the comparative advantage
in terms of saving times and also causing inconvenience to the passengers. The airports should be
connected by metros, expressways to the cities to get the full advantage of air transportation by
reducing the total travel time, take example of New Delhi metro airport express.

Safety
In the aviation domain safety is of utmost importance. With the advancement and increasing no
of operations it is become difficult to keep the rate of accident and incident in check. The
increasing number of movements affects runway safety, ramp safety, incursions and excursions,
ramp congestion and other serious situations affecting safety.

Roads

Road Transport is vital to the economic development and social integration of the country. Easy
accessibility, flexibility of operations, door-to-door service and reliability have earned road transport an
increasingly higher share of both passenger and freight traffic vis-à-vis other transport modes.India has
second largest road networks in the world (4.1 million kilometres), which can be sub-divided into
following four categories:
Categories India’s Total Road Network Details
National Highways (NHs) 17% Total Length: 71,772km and carry
40% of the country’s road traffic
State Highways (SHs) 3.6% Total Length: 154,522km
Major District Roads (MDRs) 6.5% Total Length: 266,058 km
Other District and Rural Roads 88% Total Length: 36,17,240km
Source: 12th
Five Year Plan Report
In India the transportation sector is still ruled by the road network. The most important mode of
transportation in India is road, and this dominance arises from decades of poor supporting infrastructure
development on the rail, coastal, pipeline and air transportationside. The road transportation has share
of 4.7% in India’s GDP in
comparison to railways
that has a mere 1% share.
The most expensive
mode of transportation is
road transportation
however majority of
freight operations are
done through it .In the
overall road network, the
National Highways
constitute only 2% and
they carry around 40% of
the total road freight. Source: NHAI website
Roads in India bear about 90% of the country’s passenger traffic and 65% of freight traffic.in 2009-
10.According to a report by KPMG,“India’s logistics sector is currently not only constrained by lack of
infrastructure; it is perhaps even more restricted by the misuse of transportation modes for certain types
of commodity , as well as limits on the free use of transportation modes for others.” Despite this growth,
the road transportation sector faces many challenges. The industry is highly fragmented, and with low
entry barriers, it has seen significant commoditization leading to intense competition among truckers
who find their realizations and margins continuing to be squeezed progressively. Despite the recent
privatization of the container rail industry, road transportation continues to grow and gain share from rail
— albeit at a slower pace.
Consequently, road networks continue to lag behind world averages, with road density at 2.83 km per
1,000 people and 770 km of road length per 1,000 sq. km as compared to 6.7 km a
respectively, globally. India’s low average trucking speed of 30
global average of 60–80 kmph can, thus, be attributed to the constrained and poor quality of the
country’s road network.
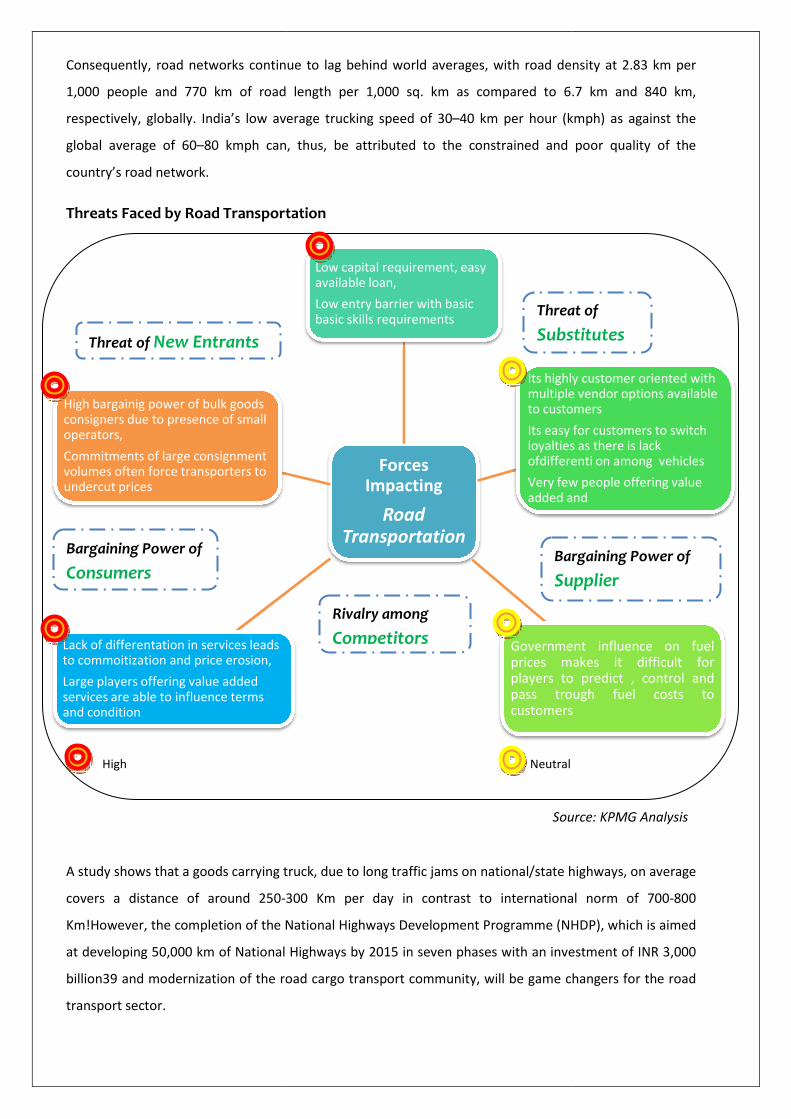
Threats Faced by Road Transportation
High
A study shows that a goods carrying truck, due to long traffic jams on national/state highways, on average
covers a distance of around 250-300 Km per day in contrast to international norm of 700
Km!However, the completion of the National Highways Development Programme (NHDP), which is ai
at developing 50,000 km of National Highways by 2015 in seven phases with an investment of INR 3,000
billion39 and modernization of the road cargo transport community, will be game changers for the road
transport sector.
Lack of differentation in services leads to commoitization and price erosion,
Large players offering value added services are able to influence terms and condition
High bargainig power of bulk goods consigners due to presence of small operators,
Commitments of large consignment volumes often force transporters to undercut prices
Threat of New Entrants
Bargaining Power of
Consumers
Consequently, road networks continue to lag behind world averages, with road density at 2.83 km per
1,000 people and 770 km of road length per 1,000 sq. km as compared to 6.7 km a
India’s low average trucking speed of 30–40 km per hour (kmph) as against the
80 kmph can, thus, be attributed to the constrained and poor quality of the
Transportation
Neutral
Source: KPMG Analysis
truck, due to long traffic jams on national/state highways, on average
300 Km per day in contrast to international norm of 700
However, the completion of the National Highways Development Programme (NHDP), which is ai
at developing 50,000 km of National Highways by 2015 in seven phases with an investment of INR 3,000
billion39 and modernization of the road cargo transport community, will be game changers for the road
Forces
Impacting
Road
Transportation
Low capital requirement, easy available loan,
Low entry barrier with basic basic skills requirements
Its highly customer oriented with multiple vendor options available to customers
Its easy for customers to switch loyalties as there is lack ofdifferenti on among vehicles
Very few people offering value added and
Governmentprices makesplayers topass troughcustomers
Rivalry among
Competitors
Bargaining Power of
Supplier
Threat of
Substitutes
Consequently, road networks continue to lag behind world averages, with road density at 2.83 km per
1,000 people and 770 km of road length per 1,000 sq. km as compared to 6.7 km and 840 km,
40 km per hour (kmph) as against the
80 kmph can, thus, be attributed to the constrained and poor quality of the
Source: KPMG Analysis
truck, due to long traffic jams on national/state highways, on average
300 Km per day in contrast to international norm of 700-800
However, the completion of the National Highways Development Programme (NHDP), which is aimed
at developing 50,000 km of National Highways by 2015 in seven phases with an investment of INR 3,000
billion39 and modernization of the road cargo transport community, will be game changers for the road
Its highly customer oriented with multiple vendor options available to customers
Its easy for customers to switch loyalties as there is lack ofdifferenti on among vehicles
Very few people offering value added and
Government influence on fuelmakes it difficult forto predict , control and
trough fuel costs tocustomers
Bargaining Power of
Supplier
Threat of
Substitutes

Despite the progress in NHs, only 23% of their total length is wider than two lanes, leading to heavy
congestion. Shortfall in construction of bypasses, inadequate capacity, insufficient pavement thickness
and weak, narrow and distressed bridges/culverts are some of the other deficien
built a huge cost needs to be maintained properly to prevent disintegration and deterioration, ensuring
its continuous utilization in an optimum manner and road safety of its users.
In India the maintenance of roads is
treated as a non-plan activity and
has, therefore, tended to be
neglected because of financial
resources constraints. Apart from
inadequacy of resources,
management of roads are
unsystematic and inspections are
irregular.
The villages which are connected by PradhanMantri Gram SadakYojana (PMGSY) have several socio
economic impacts on villages which indicate multiple benefits generated through it.
listed below:
• Improved connection to the markets
• Reducing the time spent in travelling
• Improving villagers access to timely treatment, especially in emergency
• Improvement in the accessibility to education
• Aster access to health facilities
• Decline in infant and child mortality
• Improvement in agricultural production, income, employment generation
This kind of initiative can also be exercised at country level to maximize the benefit for all, similarly like
villages.
Trends in the Road Sector
1. Government policy to increase private sector participation has proved to be a advantage to the
infrastructure industry with a large number of private players entering the business through the
PPP model. The type of PPP models used in road projects are BOT
only 23% of their total length is wider than two lanes, leading to heavy
congestion. Shortfall in construction of bypasses, inadequate capacity, insufficient pavement thickness
and weak, narrow and distressed bridges/culverts are some of the other deficiencies. The road network
built a huge cost needs to be maintained properly to prevent disintegration and deterioration, ensuring
its continuous utilization in an optimum manner and road safety of its users.
Lane composition of National Highways (
India the maintenance of roads is
plan activity and
has, therefore, tended to be
neglected because of financial
Apart from
inadequacy of resources,
management of roads are
unsystematic and inspections are
Source: 12th
Five Year Plan Report
The villages which are connected by PradhanMantri Gram SadakYojana (PMGSY) have several socio
economic impacts on villages which indicate multiple benefits generated through it.
ection to the markets
Reducing the time spent in travelling
Improving villagers access to timely treatment, especially in emergency
Improvement in the accessibility to education
Aster access to health facilities
Decline in infant and child mortality which
Improvement in agricultural production, income, employment generation
This kind of initiative can also be exercised at country level to maximize the benefit for all, similarly like
Government policy to increase private sector participation has proved to be a advantage to the
infrastructure industry with a large number of private players entering the business through the
The type of PPP models used in road projects are BOT toll and BOT annuity
23%
54%
23% Single/Intermediate
Lane
Double Lane
Four/Six/Eight Lane
only 23% of their total length is wider than two lanes, leading to heavy
congestion. Shortfall in construction of bypasses, inadequate capacity, insufficient pavement thickness
cies. The road network
built a huge cost needs to be maintained properly to prevent disintegration and deterioration, ensuring
Lane composition of National Highways (2012)
Five Year Plan Report
The villages which are connected by PradhanMantri Gram SadakYojana (PMGSY) have several socio-
economic impacts on villages which indicate multiple benefits generated through it. Few of them are
This kind of initiative can also be exercised at country level to maximize the benefit for all, similarly like
Government policy to increase private sector participation has proved to be a advantage to the
infrastructure industry with a large number of private players entering the business through the
toll and BOT annuity.
Single/Intermediate
Lane
Double Lane
Four/Six/Eight Lane

2. Through 100 per cent FDI in the roads sector, most foreign companies have formed partnerships
with Indian players to participate in the sector.
3. Infrastructure is the key to supporting double-digit GDP growth in India during the medium- to
long-term; hence the government has made infrastructure development a key policy issue and
plans to spend USD1.04 trillion during FY13-17 on the sector.
4. Through Five-Year Plans, India has increased the length of national highways from 21,378
kilometres during the late 1940s to 71,772 kilometres by the end of the 11th Five Year Plan (FY08-
12). The 9th Five Year Plan (FY1997-FY02) recorded the largest addition to the highway network
(23,814 kilometres).
National Highways to be constructed under various Five-Year plans
Source: Logistics game changers – Transforming India’s logistics industry-KPMG
Until 2005, the road construction market was dominated by public sector companies. The government
has been eager to involve private sector funding for infrastructure projects and thereby reduce strains on
the budget. The PPP model has emerged as the favoured one for private sector participation in roads
projects. From the investment perspective, a comparison of estimated investments in the road sector in
the Eleventh Plan (2007–12) vis-à-vis projected investments for the Twelfth Plan (2012–17) indicates a
significant jump, approximately 2.2-fold.
To encourage private players, the
Government has announced several
incentives such as declaring the road
sector as an industry, providing 100 % tax
exemptions in any consecutive 10 years
out of 20 years, duty free imports of
certain identified construction plants and
Source: Crisil report ‘Private participation in National
Highways to drive investment in roads, 22 May 2012

equipment, FDI of up to 100 %, and increased concession periods (up to 30 years). Given these incentives,
the private sector is expected to fund 33 % of the total investment in the Twelfth Five-Year Plan.
Roads are a major user of construction material especially bitumen and asphalt which are known to
release emission gases into atmosphere. There is need for maximizing the investment in R&D, green
technology and design for better and safer roads.
The major reasons behind the higher road traffic are, growth in small and medium enterprises in India,
rising incomes leading to increasing number of vehicle owners, Growing movement of goods within the
country due to economic integration, Better quality roads makes road travel cheaper and safer and
Increasing roadways leading to greater accessibility between different cities/towns/villages. The number
of vehicles has been growing at an average of 10.16% per annum over the last five years. This strains the
road infrastructure.Road’s traffic share of the total traffic in India has grown from 13.8 % to 65% in freight
traffic and from 15.4% to 90% in passenger traffic from 1951 to 2011.
The main hurdle in the development of highways at a faster pace is the delay in land acquisition and
statutory clearances. In the absence of stronger land laws, land acquisition becomes a contentious issue
in a country like India with a large population. Effective legal framework and proper execution with
respect to land acquisition is needed for a faster development of roads. Government must ensure faster
procurement of all statutory clearances.
Future prospects remain bright for the roads sector.In future national and state highway projects are
estimated to create an opportunity of USD41.2 billion and USD 9.9 billion respectively, over next five
years. The Road projects contribute around 60% of PPP projects in the country. To promote this sector,
the government has allowed 100 % FDI under the automatic route for all road development projects and
100% income tax exemption is granted for a period of 10 years.

WaterwaysWaterways

India’s 95% by volume and 70%
the sea route. India has a coast line of
has 13 major ports (Fig. 1);
the eastern coast and 7 on the
western coast. It also has about
200 non –major ports, in which
1/3 are operational.The Inland
Water Transport (IWT) form
interface between maritime and
rail and road transport. During
2011-12, 60% and 40% of the
maritime cargo were handled by
major and non- major ports
respectively.
The aviation sector is struggling
for survival, while roadways and
railways are bleeding the treasury
dry. Inland navigation is
economical and environment-
The Three waterways that have been declared as National Waterways are:
(a) Allahabad-Haldia stretch
declared National Waterway-
(b) Sadiya-Dhubri stretch (891 kms) of the Brahmaputra river was declared Na
Waterways- II in September, 1988.
(c) Kottapuram-Kollam stretch
canal (14 kms) and Udyogmandal canal (23 kms) was declared National W
February, 1993.
As we seen the aviation sec
transportation are bleeding the capital dry. But due to lack of long term vision and
support from government, hinders the growth of inland waterways. It is ironical that in
70% by value global merchandise trade is carried out through
the sea route. India has a coast line of 7,517 km with two basic categories of ports
; 6 on
on the
western coast. It also has about
major ports, in which
The Inland
Water Transport (IWT) form
interface between maritime and
During
% of the
cargo were handled by
major ports
The aviation sector is struggling
for survival, while roadways and
railways are bleeding the treasury
dry. Inland navigation is
-friendly.
ave been declared as National Waterways are:
Haldia stretch (1620 kms) of Ganga-Bhagirathi-Hooghly river system was
I in October, 1986.
(891 kms) of the Brahmaputra river was declared Na
II in September, 1988.
Kollam stretch (168 kms) of the West Coast Canal along with Champakara
canal (14 kms) and Udyogmandal canal (23 kms) was declared National W
As we seen the aviation sector is struggling for endurance, whereas railways and road
transportation are bleeding the capital dry. But due to lack of long term vision and
support from government, hinders the growth of inland waterways. It is ironical that in
by value global merchandise trade is carried out through
two basic categories of ports. India
ave been declared as National Waterways are:
Hooghly river system was
(891 kms) of the Brahmaputra river was declared National
(168 kms) of the West Coast Canal along with Champakara
canal (14 kms) and Udyogmandal canal (23 kms) was declared National Waterways-III in
tor is struggling for endurance, whereas railways and road
transportation are bleeding the capital dry. But due to lack of long term vision and
support from government, hinders the growth of inland waterways. It is ironical that in

spite of being economical, efficient and environment friendly, the inland water transport
sector remains underutilised.
Traffic and Capacity at Ports
The capacity creation for major ports during year
only 689.83 MT was achieved.
36.67%.The capacity of minor ports and private ports was envisaged to increase from
228.31MT to 557MT.
The traffic handled by major ports in financial year
lower than the projection by
07 with the growth of 29.48
186.11MT in the year 2006
growth of 98.81% and also higher than the projection of
Cargo Traffic
According to the 12th Five year plan, the capacity and Traffic is needed to
meet the projected traffic of
815.20 MT) by the end of 12
sector is predicted to be 2289.04
MT).
0
100
200
300
400
500
600
Major Ports
Car
go
Tra
ffic
(M
MT
)
FY 07
al, efficient and environment friendly, the inland water transport
sector remains underutilised.
at Ports
creation for major ports during year 2011-12 was projected
MT was achieved. This shows the increase in the capacity of major ports by
%.The capacity of minor ports and private ports was envisaged to increase from
The traffic handled by major ports in financial year 2011-12 was 560.12
by26.55% but increased from 463.78MT of financial year
29.48%. At the minor ports traffic handled was increased from
2006-07 to 37.00 MT in the year 2011-12, thus registering a
% and also higher than the projection of 23.26%.
Source: Ministry of Shipping, India Brand Equity Foundation
ive year plan, the capacity and Traffic is needed to
he projected traffic of 1758.26 MT (major ports- 943.06 MT and minor ports
12th five year plan (2016-17), the total capacity of the port
2289.04 MT (major ports- 1229.24 MT and minor ports
FY 07
FY 08
FY 09
Major Ports
Non Major Ports
FY 08 FY 09 FY 10 FY 11 FY 12
al, efficient and environment friendly, the inland water transport
was projected 1001.80 MT but
This shows the increase in the capacity of major ports by
%.The capacity of minor ports and private ports was envisaged to increase from
560.12MT which was
MT of financial year 2006-
the minor ports traffic handled was increased from
, thus registering a
Source: Ministry of Shipping, India Brand Equity Foundation
ive year plan, the capacity and Traffic is needed to expand. To
MT and minor ports-
), the total capacity of the port
MT and minor ports- 1059.80
FY 09
FY 10
FY 11
FY 12

Capacity Addition
At Major
Ports Existing(2011-
Total 560.15
Capacity by the end of 12th
Major Ports
Existing (2011-12)
Total
Commodity 689.83
Major Trend in the Waterways Transportation
0
10
20
30
40
50
60
FY06
58.7C
apac
ity
Ad
dit
ion
(M
T)
Source: Ministry of Shipping,
Traffic (MT) Capacity
Existing 12)
Forecast (2016-17)
Existing (2011-12)
560.15 943.06 689.93
th plan
Ports Minor Ports
Forecast (2016-17)
Existing (2011-12)
Forecast (2016-17)
Existing(2011
1229.24 544.65 1059.80 1234.48
in the Waterways Transportation
FY07FY08
FY09FY10
48.6
27.3
42.7 42
Source: Ministry of Shipping,
Capacity (MT)
Forecast (2016-17)
1229.24
Total
Existing (2011-12)
Forecast (2016-17)
1234.48 2289.04

As shown in above graph, that there is
average turnaround time is influenced by
entrance path.There is an improvement of average output per ship berth day from
MT in year 2006-07 to 10,967
Indian ports around 57% of turna
Detention trendis only one that continuous shows the
The other important trends seen in this sector is Setting up of port based SEZs,
Increasing Private Participation
Model. Because of favourable
encourages both the investor, i.e. Private and Foreign. The private player aggressively
investing in port logistics services.
government has shifting from the “
services) to a “Landlord Port
while port operations are done by the private companies).
Chennai, Visakhapatnam and Tuticorn
Benefits of Waterways Transport
Efficient and Economic:
The cost of infrastructure development for
roadways. As per Mr. S Sriraman of Walchand Hirachand Professor of Transport
Economics, University of Mumbai. S Dandapat, chief engineer, IWAI
than that of roadways. Land
building a road or a railway line
The fuel used in waterways transportation
would carry about 105tonnes over a kilometre through waterways,
2006-07 2007-08
9745 10071
3.623.93
10.05 11.4
Average Pre-berthing Detention Time
Average Output per ship berth days
Source: 12
that there is improvement in turnaround time in
average turnaround time is influenced by feature such as size of parcel, cargo type, and
There is an improvement of average output per ship berth day from
10,967 MT in year 2011-12. Due to port associated inefficiency at
% of turnaround time of ships is delayed.
one that continuous shows the increasing style.
The other important trends seen in this sector is Setting up of port based SEZs,
Participation, Specialist Terminal Based Ports and Landlord
. Because of favourable investment condition and strong growth potential,
encourages both the investor, i.e. Private and Foreign. The private player aggressively
investing in port logistics services. Further, to attract private investments
shifting from the “Service Port” model (port authority provide all
Landlord Port” model (port authority acts as a regulator and landlord
while port operations are done by the private companies).The major ports such as JNPT,
Chennai, Visakhapatnam and Tuticorn are example of this reformed.
Benefits of Waterways Transport
The cost of infrastructure development for IWT sector is also very low as compared to
S Sriraman of Walchand Hirachand Professor of Transport
Economics, University of Mumbai. S Dandapat, chief engineer, IWAI. It is
Land acquition cost accounts for 60 per cent of the total cost of
building a road or a railway line.
The fuel used in waterways transportation is diesel. As per the study, one litre of diesel
tonnes over a kilometre through waterways, 85
2008-09 2009-10 2010-11
1007110473
10482 10735
3.87
4.42 4.67
9.5511.75 11.76
berthing Detention Time Average Turnaround Time
Average Output per ship berth days Source: 12
th Five Year Plan,
in turnaround time in 2011-12. The
feature such as size of parcel, cargo type, and
There is an improvement of average output per ship berth day from 9,745
associated inefficiency at
round time of ships is delayed. The Pre-berthing
The other important trends seen in this sector is Setting up of port based SEZs,
and Landlord Port
investment condition and strong growth potential,
encourages both the investor, i.e. Private and Foreign. The private player aggressively
Further, to attract private investments, the
” model (port authority provide all
model (port authority acts as a regulator and landlord
The major ports such as JNPT,
is also very low as compared to
S Sriraman of Walchand Hirachand Professor of Transport
It is 5 to 10per cent
cost accounts for 60 per cent of the total cost of
is diesel. As per the study, one litre of diesel
85 tonnes through
2011-12
10967
4.44
11.14
Average Turnaround Time
railways and24tonnes through roadways. Hence there is an opportunity to convert these
comparisons into monetary savings.
Affordable:
There was a2012report, by a
under the National Transport Policy Development Committee (NT
Commission. It highlighted the
through waterways would cost Rs.
0.50 and Rs. 0.96 respectively.
As per NTPDC, one horsepower can move 4 tonnes by waterways,
and 0.15 tonnes by roadways.
waterways is Rs 0.53 as against Rs
Safe and Environment Friendly
According to the National Council of Applied Economic Research
avoidance of accidents as a result of cargo movement on national waterways saved Rs
36crore in 2004-05. While i
congestions amount to Rs
with the growth of inland water transport (IWT),” says S S Mishra, member of Inland
Waterways Authority of India (IWAI).
In the waterways sector, fuel consumption is also less, which means low levels of carbon
emissions.The 2012report by a sub group of the Working
under NTDPCstates that, the
truck emits.
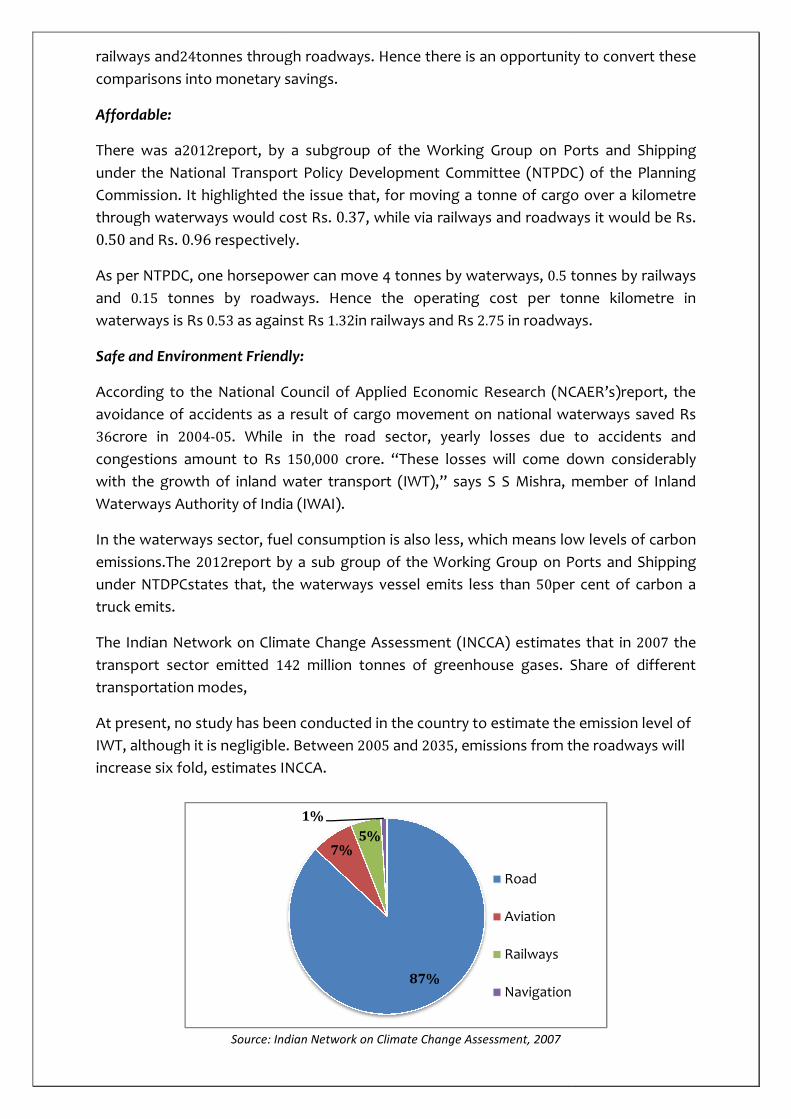
The Indian Network on Climate Change Assessment (INCCA) estimates that in
transport sector emitted 142
transportation modes,
At present, no study has been conducted in the country to estimate the emission level of
IWT, although it is negligible. Between
increase six fold, estimates INCCA
Source: Indian Network on Climate Change Assessment, 2007
tonnes through roadways. Hence there is an opportunity to convert these
comparisons into monetary savings.
by a subgroup of the Working Group on Ports and Shipping
under the National Transport Policy Development Committee (NTPDC) of the Planning
Commission. It highlighted the issue that, for moving a tonne of cargo over a kilometr
through waterways would cost Rs. 0.37, while via railways and roadways it would be Rs.
respectively.
horsepower can move 4 tonnes by waterways, 0.5 tonnes by
tonnes by roadways. Hence the operating cost per tonne kilometre in
as against Rs 1.32in railways and Rs 2.75 in roadways.
and Environment Friendly:
National Council of Applied Economic Research (NCAER’s
avoidance of accidents as a result of cargo movement on national waterways saved Rs
While in the road sector, yearly losses due to accidents and
amount to Rs 150,000 crore. “These losses will come down considerably
growth of inland water transport (IWT),” says S S Mishra, member of Inland
Waterways Authority of India (IWAI).
sector, fuel consumption is also less, which means low levels of carbon
by a sub group of the Working Group on Ports and Shipping
states that, the waterways vessel emits less than 50per cent of carbon a
The Indian Network on Climate Change Assessment (INCCA) estimates that in
142 million tonnes of greenhouse gases. Share of different
At present, no study has been conducted in the country to estimate the emission level of
IWT, although it is negligible. Between 2005 and 2035, emissions from the roadways will
increase six fold, estimates INCCA.
Source: Indian Network on Climate Change Assessment, 2007
87%
7%5%
1%
Road
Aviation
Railways
Navigation
tonnes through roadways. Hence there is an opportunity to convert these
of the Working Group on Ports and Shipping
PDC) of the Planning
issue that, for moving a tonne of cargo over a kilometre
, while via railways and roadways it would be Rs.
tonnes by railways
operating cost per tonne kilometre in
in roadways.
NCAER’s)report, the
avoidance of accidents as a result of cargo movement on national waterways saved Rs
due to accidents and
crore. “These losses will come down considerably
growth of inland water transport (IWT),” says S S Mishra, member of Inland
sector, fuel consumption is also less, which means low levels of carbon
Group on Ports and Shipping
per cent of carbon a
The Indian Network on Climate Change Assessment (INCCA) estimates that in 2007 the
Share of different
At present, no study has been conducted in the country to estimate the emission level of
emissions from the roadways will

Conclusion
Efficient mobility of people is one of the key factors for the progress and prosperity of a society and
a nation. Public Transport services play a major role in reducing the poverty and keeping deprivation
at check in rural areas. Apart from offering the rural population a viable and convenient way to
market their agricultural produce, it also enables them to access other sources of income such as
engagement in informal services in nearby urban nodes and formal employment in manufacturing,
food processing, transport and other industries, etc. Certain inherent characteristics of the Bus
transport system make it the ideal mode for meeting the huge and increasing demand for passenger
transport services. Bus transport makes the most optimum use of the available road space and fossil
fuel by transporting the maximum number of people per unit of road space. On an average, a car
consumes nearly 6 times more energy than an average bus, while two wheelers consume about 2.5
times and three-wheelers consume 4.7 times more energy in terms of per passenger km.
The transport sector of India is facing several challenges which can be taken as opportunities to
overcome from them and make India leader of this sector in the group of developing countries. The
challenges are,
• Congested and inefficient ports,
• Severe capacity constraints facing by Railways,
• Airport infrastructure is strained,
• Hinterland connectivity by different modes of transport
• Roads are congested and poor in quality
From the below given table we can see that government of India heavily in all major transportation
modes.
Ministry /Department wise 12th
Five Year Plan Outlays for Transport Sectors
Source: 12th
Five Year Plan
Way forward
• Expanding construction capacity- construction industry capacity already overstretched-
quality, price affected
• Improving Contract Management- on average publicly financed road construction contracts
suffering 35% cost over runs
Ministry GBS Outlay IEBR
Ministry of Road Transport &
Highways
144769 64834
Ministry of Civil Aviation 16983 16215
Ministry of Railways 194221 225000
Ministry of Shipping 6960 21990

• Poor quality of designs and site investigations
• Land acquisition
• Tariff /pricing policy
• Multi modal connectivity
transportation modes. It reduces total journey time, reduce congestions.
• Focus on high-growth potential of India’s waterways segment remains largely untapped and
underutilized
• In my opinion at present time, we have to shift the passeng
airways, because they have the vacant capacity and railways have the extra passengers. So it
balance the traffic and win
we can see the losses every year railways ma
Poor quality of designs and site investigations
Multi modal connectivity- it’s very important, as it work as back bone
transportation modes. It reduces total journey time, reduce congestions.
growth potential of India’s waterways segment remains largely untapped and
In my opinion at present time, we have to shift the passenger traffic from railways to
airways, because they have the vacant capacity and railways have the extra passengers. So it
balance the traffic and win –win for both transportation modes. From the below given table
we can see the losses every year railways made.
Source: 12th
Five Year Plan Report
it’s very important, as it work as back bone for the all major
transportation modes. It reduces total journey time, reduce congestions.
growth potential of India’s waterways segment remains largely untapped and
er traffic from railways to
airways, because they have the vacant capacity and railways have the extra passengers. So it
win for both transportation modes. From the below given table
Five Year Plan Report

Bibliography
1. Twelfth Five Year Plan(2012–2017)-Economic Sectors, Vol II, by GoI
2. India Brand Equity Foundation (March 2013),
3. A Report on Logistics gamechangers - Transforming India’slogistics industry by KPMG,
4. Adding Wheels- Investing in the Indian transportation & Logistics Industry by KPMG,
5. DGCA website
6. Natural highways published in Down to Earth
7. Indian Railways website
8. The Road Ahead highways PPP in India
9. Ministry of Road Transport & Highways, GoI