
Foam films.pdf
14
Interactions in lipid stabilised foam films ☆ José Luis Toca-Herrera a , Nadejda Krasteva b , Hans-Joachim Müller c , Rumen Krastev d,e, ⁎ a Institute for Biophysics, Department of Nanobiotechnology, University of Natural Resources and Life Sciences Vienna (BOKU), Muthgasse 11, Vienna, Austria b Baldungstr, 70736 Fellbach, Germany c Max-Planck Institute of Colloids and Interfaces, 14424 Golm/Potsdam, Germany d NMI Natural and Medical Sciences Institute at the University of Tübingen, 72770 Reutlingen, Germany e School of Applied Chemistry, Reutlingen University, 72762 Reutlingen, Germany abstract article info Available online 22 February 2014 Keywords: Foam films Lipids Electrostatc interaction van der Waals interaction Hydrophilic interaction DLVO theory The interaction between lipid bilayers in water has been intensively studied over the last decades. Osmotic stress was applied to evaluate the forces between two approaching lipid bilayers in aqueous solution. The force– distance relation between lipid mono- or bilayers deposited on mica sheets using a surface force apparatus (SFA) was also measured. Lipid stabilised foam films offer another possibility to study the interactions between lipid monolayers. These films can be prepared comparatively easy with very good reproducibility. Foam films consist usually of two adsorbed surfactant monolayers separated by a layer of the aqueous solution from which the film is created. Their thickness can be conveniently measured using microinterferometric techniques. Studies with foam films deliver valuable information on the interactions between lipid membranes and especial- ly their stability and permeability. Presenting inverse black lipid membrane (BLM) foam films supply information about the properties of the lipid self-organisation in bilayers. The present paper summarises results on micro- scopic lipid stabilised foam films by measuring their thickness and contact angle. Most of the presented results concern foam films prepared from dispersions of the zwitterionic lipid 1,2-dimyristoyl-sn-glycero-3- phosphorylcholine (DMPC) and some of its mixtures with the anionic lipid — 1,2-dimyristoyl-sn-glycero-3- [phospho-rac-(1-glycerol)] (DMPG). The strength of the long range and short range forces between the lipid layers is discussed. The van der Waals attractive force is calculated. The electrostatic repulsive force is estimated from experiments at different electro- lyte concentrations (NaCl, CaCl 2 ) or by modification of the electrostatic double layer surface potential by incorpo- rating charged lipids in the lipid monolayers. The short range interactions are studied and modified by using small carbohydrates (fructose and sucrose), ethanol (EtOH) or dimethylsulfoxide (DMSO). Some results are com- pared with the structure of lipid monolayers deposited at the liquid/air interface (monolayers spread in Langmuir trough), which are one of most studied biomembrane model system. The comparison between the film thickness and the free energy of film formation is used to estimate the contribution of the different components of the disjoining pressure to the total interaction in the film and their dependence on the composition of the film forming solution. © 2014 Elsevier B.V. All rights reserved. Contents 1. Introduction . . . . . . . . . . . . . . . . . . . . . . . . . . . . . . . . . . . . . . . . . . . . . . . . . . . . . . . . . . . . . . . 94 2. Forces acting between the foam film surfaces . . . . . . . . . . . . . . . . . . . . . . . . . . . . . . . . . . . . . . . . . . . . . . . . 95 3. Formation of lipid stabilised foam films . . . . . . . . . . . . . . . . . . . . . . . . . . . . . . . . . . . . . . . . . . . . . . . . . . 96 4. Long range interactions in lipid stabilised foam films . . . . . . . . . . . . . . . . . . . . . . . . . . . . . . . . . . . . . . . . . . . . 97 4.1. van der Waals attraction . . . . . . . . . . . . . . . . . . . . . . . . . . . . . . . . . . . . . . . . . . . . . . . . . . . . . . 97 4.2. Electrostatic double layer repulsion . . . . . . . . . . . . . . . . . . . . . . . . . . . . . . . . . . . . . . . . . . . . . . . . . 97 5. Short range interactions in lipid stabilised foam films . . . . . . . . . . . . . . . . . . . . . . . . . . . . . . . . . . . . . . . . . . . 100 5.1. Effect of ethanol . . . . . . . . . . . . . . . . . . . . . . . . . . . . . . . . . . . . . . . . . . . . . . . . . . . . . . . . . 100 Advances in Colloid and Interface Science 207 (2014) 93–106 ☆ This paper is dedicated to Prof. Helmuth Möhwald. All presented results were obtained at his Department of Interfaces at the Max-Planck Institute of Colloids and Interfaces in Golm/ Potsdam, Germany. ⁎ Corresponding author at: NMI, Reutlingen, Germany. E-mail address: [email protected] (R. Krastev). http://dx.doi.org/10.1016/j.cis.2014.02.016 0001-8686/© 2014 Elsevier B.V. All rights reserved. Contents lists available at ScienceDirect Advances in Colloid and Interface Science journal homepage: www.elsevier.com/locate/cis
-
Upload
maria-luisa -
Category
Documents
-
view
19 -
download
0
Transcript of Foam films.pdf

Advances in Colloid and Interface Science 207 (2014) 93–106
Contents lists available at ScienceDirect
Advances in Colloid and Interface Science
j ourna l homepage: www.e lsev ie r .com/ locate /c i s
Interactions in lipid stabilised foam films☆
José Luis Toca-Herrera a, Nadejda Krasteva b, Hans-Joachim Müller c, Rumen Krastev d,e,⁎a Institute for Biophysics, Department of Nanobiotechnology, University of Natural Resources and Life Sciences Vienna (BOKU), Muthgasse 11, Vienna, Austriab Baldungstr, 70736 Fellbach, Germanyc Max-Planck Institute of Colloids and Interfaces, 14424 Golm/Potsdam, Germanyd NMI Natural and Medical Sciences Institute at the University of Tübingen, 72770 Reutlingen, Germanye School of Applied Chemistry, Reutlingen University, 72762 Reutlingen, Germany
☆ This paper is dedicated to Prof. Helmuth Möhwald. AlPotsdam, Germany.⁎ Corresponding author at: NMI, Reutlingen, Germany.
E-mail address: [email protected] (R. Krastev).
http://dx.doi.org/10.1016/j.cis.2014.02.0160001-8686/© 2014 Elsevier B.V. All rights reserved.
a b s t r a c t
a r t i c l e i n f oAvailable online 22 February 2014
Keywords:Foam filmsLipidsElectrostatc interactionvan der Waals interactionHydrophilic interactionDLVO theory
The interaction between lipid bilayers inwater has been intensively studied over the last decades. Osmotic stresswas applied to evaluate the forces between two approaching lipid bilayers in aqueous solution. The force–distance relation between lipid mono- or bilayers deposited on mica sheets using a surface force apparatus(SFA) was also measured. Lipid stabilised foam films offer another possibility to study the interactions betweenlipid monolayers. These films can be prepared comparatively easy with very good reproducibility. Foam filmsconsist usually of two adsorbed surfactant monolayers separated by a layer of the aqueous solution fromwhich the film is created. Their thickness can be conveniently measured using microinterferometric techniques.Studieswith foam films deliver valuable information on the interactions between lipidmembranes and especial-ly their stability and permeability. Presenting inverse black lipidmembrane (BLM) foamfilms supply informationabout the properties of the lipid self-organisation in bilayers. The present paper summarises results on micro-scopic lipid stabilised foam films by measuring their thickness and contact angle. Most of the presented resultsconcern foam films prepared from dispersions of the zwitterionic lipid 1,2-dimyristoyl-sn-glycero-3-phosphorylcholine (DMPC) and some of its mixtures with the anionic lipid — 1,2-dimyristoyl-sn-glycero-3-[phospho-rac-(1-glycerol)] (DMPG).The strength of the long range and short range forces between the lipid layers is discussed. The van der Waalsattractive force is calculated. The electrostatic repulsive force is estimated from experiments at different electro-lyte concentrations (NaCl, CaCl2) or bymodification of the electrostatic double layer surface potential by incorpo-rating charged lipids in the lipid monolayers. The short range interactions are studied and modified by usingsmall carbohydrates (fructose and sucrose), ethanol (EtOH) or dimethylsulfoxide (DMSO). Some results are com-paredwith the structure of lipidmonolayers deposited at the liquid/air interface (monolayers spread in Langmuirtrough), which are one ofmost studied biomembranemodel system. The comparison between thefilm thicknessand the free energy of film formation is used to estimate the contribution of the different components of thedisjoining pressure to the total interaction in the film and their dependence on the composition of the filmforming solution.
© 2014 Elsevier B.V. All rights reserved.
Contents
1. Introduction . . . . . . . . . . . . . . . . . . . . . . . . . . . . . . . . . . . . . . . . . . . . . . . . . . . . . . . . . . . . . . . 942. Forces acting between the foam film surfaces . . . . . . . . . . . . . . . . . . . . . . . . . . . . . . . . . . . . . . . . . . . . . . . . 953. Formation of lipid stabilised foam films . . . . . . . . . . . . . . . . . . . . . . . . . . . . . . . . . . . . . . . . . . . . . . . . . . 964. Long range interactions in lipid stabilised foam films . . . . . . . . . . . . . . . . . . . . . . . . . . . . . . . . . . . . . . . . . . . . 97
4.1. van der Waals attraction . . . . . . . . . . . . . . . . . . . . . . . . . . . . . . . . . . . . . . . . . . . . . . . . . . . . . . 974.2. Electrostatic double layer repulsion . . . . . . . . . . . . . . . . . . . . . . . . . . . . . . . . . . . . . . . . . . . . . . . . . 97
5. Short range interactions in lipid stabilised foam films . . . . . . . . . . . . . . . . . . . . . . . . . . . . . . . . . . . . . . . . . . . 1005.1. Effect of ethanol . . . . . . . . . . . . . . . . . . . . . . . . . . . . . . . . . . . . . . . . . . . . . . . . . . . . . . . . . 100
l presented results were obtained at his Department of Interfaces at theMax-Planck Institute of Colloids and Interfaces in Golm/

94 J.L. Toca-Herrera et al. / Advances in Colloid and Interface Science 207 (2014) 93–106
5.2. Effect of low molecular weight solutes at low ionic strength . . . . . . . . . . . . . . . . . . . . . . . . . . . . . . . . . . . . . 1025.3. Effect of electrolyte concentration at high solute content . . . . . . . . . . . . . . . . . . . . . . . . . . . . . . . . . . . . . . 1035.4. Effect of solutes at high ionic strength . . . . . . . . . . . . . . . . . . . . . . . . . . . . . . . . . . . . . . . . . . . . . . . 103
6. Conclusions . . . . . . . . . . . . . . . . . . . . . . . . . . . . . . . . . . . . . . . . . . . . . . . . . . . . . . . . . . . . . . 1047. Experimental techniques . . . . . . . . . . . . . . . . . . . . . . . . . . . . . . . . . . . . . . . . . . . . . . . . . . . . . . . . 104
7.1. Contact angle . . . . . . . . . . . . . . . . . . . . . . . . . . . . . . . . . . . . . . . . . . . . . . . . . . . . . . . . . . 1057.2. Film thickness . . . . . . . . . . . . . . . . . . . . . . . . . . . . . . . . . . . . . . . . . . . . . . . . . . . . . . . . . . 1057.3. Velocity of film thinning . . . . . . . . . . . . . . . . . . . . . . . . . . . . . . . . . . . . . . . . . . . . . . . . . . . . . 105
Acknowledgements . . . . . . . . . . . . . . . . . . . . . . . . . . . . . . . . . . . . . . . . . . . . . . . . . . . . . . . . . . . . . 106References . . . . . . . . . . . . . . . . . . . . . . . . . . . . . . . . . . . . . . . . . . . . . . . . . . . . . . . . . . . . . . . . . 106
1. Introduction
Thin liquid free standingfilms or foamfilms as they have to be calledaccording to the IUPAC recommendations [1] have been a fascinatingobject of studies for the last 60 years. These films attract the attentionof children because of the charming play of colours during their thin-ning (Fig. 1), but they have also played an enormous role to provesuch milestone theories in the mesoscopic and nanometre world likethe theory of Derjaguin–Landau–Verwey–Overbeek (DLVO), whichhas been extensively used to predict the stability of lyophobic colloids[2–6] and the existence of a disjoining pressure (Π) between two sur-faces in close proximity. A specific property of these films is a verylarge difference in size along the lateral and normal directions. Eventhough their area is in the macro-world and can be extended even upto square metres, their thickness can be tuned down to a fewnanometres. This makes them a suitable tool to study the interactionsbetween surfaces because of the comparatively easy handling, repro-ducible preparation and their symmetrical geometry.
Foam films are formed usually from solutions of surfactants [5–7].Their thickness is convenientlymeasured using themicrointerferometricmethod [5–9] (Fig. 1). The films consist of two adsorbed surfactantmonolayers with a thickness h1 separated by a layer of the aqueoussolution from which the film is created (Fig. 1b) with a thicknessh2. The equivalent solution film thickness hw is the thickness of thefilm assumed to be a homogeneous leaf of surfactant solution. Indeedthe film structure is more complicated (sandwich-like structure oflayers with different refractive indices) where the thickness h isthe real film thickness. The calculation of h and h2 can be easily
a)
Fig. 1. a) Schematic viewof a typical experimental set-upwith small glass ringwhere thefilms awith their internal molecular structure CBF (common black film) or NBF (Newton black film).which consists of two adsorbed lipid monolayers (thickness h1) and a water core (h2), includi
obtained from the measured hw (for details see Part 6 Experimentaltechniques).
During the film formation, first a thick non-equilibrium film isformed which becomes thinner upon drainage of the solution due tothe capillary pressure in the meniscus, gravity or action of the surfaceforces [5–7]. Finally, an equilibrium film is obtained with a uniformthickness depending on the thermodynamic conditions (pressure, sur-factant and salt concentration, temperature, etc.). The very thin filmsappear black in reflected light and are called black films. Two types ofblack films exist (Fig. 1a). The thicker common black film (CBF) appearsat lower electrolyte concentrations. It shows typical Newton rings inreflected light in the area of the meniscus which surrounds the film.The thickness of the CBF and its stability are controlled by the electro-static double layer repulsion [5–7] in agreement with the classicalDLVO theory. The electrostatic double layer repulsion is suppressed athigher electrolyte concentrations, and the equilibrium state in thiscase is a very thin Newton black film (NBF). Once this state is reached,the film thickness is independent on the electrolyte concentration andis only determined by the direct interaction of the surfactant adsorptionlayers by short-range surface forces.
The properties of foam films that have been explored in detail in-clude equilibrium film thickness, contact angle film/meniscus, thinningrate, film stability, film elasticity, etc. [5,6,10].Measurements on the filmthickness allow establishing a direct relation of the strength of the inter-actions between the film surfaces and the distance between them. Oneof the most widespread techniques for foam film formation is theScheludko–Exerowa glass ring cell technique [6,7] (Fig. 1a, see alsoPart 6 Experimental techniques for details). A foam film is formed
h2
h
h1
b)
re formed. The photos show images of foam films at different stages of thinning correlatedM is a microscope used for observing the films; b) Sandwich-like structure of a foam filmng the region of the hydrated head groups.

Fig. 2. Definition of the contact angle θ in a symmetrical film under mechanical equilibri-um between the film tension γf and the surface tension σ.
95J.L. Toca-Herrera et al. / Advances in Colloid and Interface Science 207 (2014) 93–106
from a biconcave drop in a glass capillary. The cell allows the film thick-ness, contact angle with the surroundingmeniscus or film stability to bemeasured.
The interaction between lipid bilayers in water has been intensivelystudied over the last decades [11–17]. Osmotic stress was applied to la-mellar phases and the bilayer distance wasmeasured using small-angleX-ray diffraction to evaluate the forces between two approaching lipidbilayers in aqueous solution [11,15,17]. Alternatively, the force and thedistance were measured between lipid mono- or bilayers deposited onmica sheets using surface force apparatus [12]. Foam films stabilisedby lipids offer another possibility to study the interactions betweenlipid monolayers [18–26]. Such studies deliver valuable informationabout the interactions between biological lipid membranes and espe-cially their stability and permeability. Presenting inverse black lipidmembrane, the foam films supply information about the properties ofthe self-organised lipid molecules in bilayers.
The present paper summarises the results of our studies on micro-scopic lipid stabilised foam films by measuring their thickness andcontact angle. Differentmethods have beendeveloped for the preparationof foam films stabilised by insoluble biosurfactants such as phospholipids[27–29]. The main part of the presented results concerns foam films pre-pared from dispersions of the zwitterionic lipid 1,2-dimyristoyl-sn-glycero-3-phosphorylcholine (DMPC) and some of its mixtures with theanionic lipid — 1,2-dimyristoyl-sn-glycero-3-[phospho-rac-(1-glycerol)](DMPG). The strength of the long range and short range surface forcesbetween the lipid molecules as obtained from the thin foam films ex-periments is discussed. The van der Waals attractive force is calculated.The electrostatic repulsive force is estimated from experiments at dif-ferent electrolyte concentrations (NaCl, CaCl2) or by modification ofthe electrostatic double layer surface potential by incorporatingcharged lipids in the lipid monolayers. The short range interactionsare studied and modified by using small carbohydrates (fructose andsucrose), ethanol (EtOH) or dimethylsulfoxide (DMSO). Some resultsare compared with the structure of lipid monolayers deposited at theliquid/air interface (monolayers spread in Langmuir trough), whichare one of most common biomembrane model systems [30–34]. Thecomparison between the film thickness and the free energy of film for-mation is used to estimate the contribution of the different componentsof the disjoining pressure to the total interaction in the film and theirdependence on the composition of the film forming solution.
2. Forces acting between the foam film surfaces
A foam film is always surrounded by a bulk phase (meniscus). Atequilibrium, the disjoining pressure (Π (h)) in the film equals thecapillary pressure PC in the meniscus.
Π hð Þ ¼ PC ¼ 2σRC
ð1Þ
where RC is the radius of the curvature of themeniscuswhich is equal tothe radius of the glass capillarywhere thefilm is formed. σ is the surfacetension of the solution from which the film is prepared.
The disjoining pressure has different contributions and it can bewritten as
Π hð Þ ¼ ΠVW dVWð Þ þΠEL dELð Þ þΠHYDR dHYDRð Þ þΠothers dOTHERð Þ ð2Þ
here with dn (n= VW, EL, HYDR and OTHER) we indicate different dis-tances between the interacting interfaceswhich are situated at differentpositions in the film. This takes into consideration the distinct planes ofinteractions active for each type of interfacial forces.
In Eq. (2)
ΠVW dVWð Þ ¼ − AH
6πd3VW
ð3Þ
is the van der Waals attraction [4–6,35] with AH being the Hamakerconstant
ΠEL dELð Þ ¼ 64RTρ∞th2 Fφ
.4RT
� �exp −κdELð Þ; ð4Þ
according to the weak overlap approximation is the double layer elec-trostatic repulsion [4–6,36]. R is the universal gas constant, T is theabsolute temperature, ρ∞ is the concentration of ions in the bulkof the solution (h = ∞), φ is the electrostatic double-layer potential,
κ ¼ ρ∞z2i e
2=εε0kT
� �1=2 is the Debye length, F is the Faraday constant,
z is the ionic valence, ε is the medium permittivity and ε0 is the per-mittivity of the vacuum. The electrostatic interaction is determinedby the double-layer potential of the surfaces [4–6]. In many cases,this potential is caused by the adsorption of surface active ions. How-ever, small negative double-layer potentials have been observedwhen the films where formed from solutions of non-ionicamphiphiles [37–39].
ΠHYDR dHYDRð Þ ¼ H0 exp −dHYDR=λð Þ ð5Þ
is the hydration repulsion [4,40] which is a result of the direct interac-tion between the water molecules in the hydration shell near an inter-face. H0 takes into account the hydration energy of a surface and λ isthe decay length of the hydration repulsion. Πothers refers to the otherpossible interactions (entropic, ion correlation, etc.).
The values of the disjoining pressure can be directly accessed exper-imentally by using the porous-plate technique or thin film pressure bal-ance (TFPB) method first developed by Mysels and Jones [41] and laterimproved by Exerowa [6,7]. Indirectly information about the interac-tions in the foam films can be obtained frommeasurements of the con-tact angle θ between thefilm and itsmeniscus (Fig. 2). The contact angleis connected to the disjoining pressure by the free energy of film forma-tion per unit of area ΔFf by the relation [5,7,42–44]
ΔFf ¼ 2σ cosθ−1ð Þ ¼ −Zh
∞
Π hð ÞdhþΠh: ð6Þ
TheΔFf is ameasure for the difference in the thermodynamic energystate of the two states of film formation — two fully separated non-interacting solution/air interfaces and the final equilibrium film wheretwo interfaces interact with each other.

96 J.L. Toca-Herrera et al. / Advances in Colloid and Interface Science 207 (2014) 93–106
3. Formation of lipid stabilised foam films
Phospholipids spontaneously form suspensions of vesicles in watersolutions [34]. Depending on their treatment different vesicles can beformed. Small unilamelar vesicles (SUV) with a diameter of around100 nm constituted from a single lipid bilayer are one of the mostwell-characterised forms of lipid dispersions in water [34]. Stablefoam films can only be formed when the monolayers of surfactantwhich build the films are saturated and the adsorption density is thehighest possible [6,45]. Because of the very low solubility of the lipidsin water they cannot form densely packed adsorbed lipid monolayerat the water surface. It is commonly accepted that a condensed mono-layer of lipid molecules at the liquid/air interface can be formed byattachment of SUV to the interface where they rupture and spread toform a lipid layer [45 - 47]. Different procedures for preparation oflipid dispersions are described in the literature. We studied the proper-ties of foam films stabilised by lipid suspensions prepared according tothe following procedures:
Procedure A: Lipid dispersions (solutions) in a water/ethanol mixturewith a constant ratio of 52.5/47.5% vol. containing differ-ent amounts of electrolytes. The solutions were preparedby sonication for 15 min in a sonicator bath and kept be-fore the experiment overnight in refrigerator.
Procedure B: Lipid dispersions in the aqueous solution of the used elec-trolyte were kept at room temperature overnight. Thefoam films were prepared without further treatment ofthe suspension.
Procedure C: Lipid dispersions prepared according to Procedure B butsonicated for 15 min in a sonicator bath before use.Such a procedure leads to formation of a suspension ofSUV [48]. The usual lipid concentration used was0.4 mg/ml.
The time dependence of the surface tension σ for each type of lipiddispersions was measured and the dynamics of adsorption at the liquid/air interface was followed. Fig. 3 shows one such dependence obtainedfor suspensions of DMPC in a solution of 0.07 M NaCl and prepared ac-cording to each of the three procedures. The surface tension decreasedwith time reaching its saturation value after about 10 h for dispersionsprepared according to Procedure C. Similar behaviour was observed for
0 200 400 600 800
30
35
40
45
50
55
60
σ, m
N/m
Time, min
B
C
A
Fig. 3. Time dependence of the surface tension for lipid suspensions (0.4 mg/ml DMPC in0.07MNaCl solution) at 26 °C for the three preparation Procedures A, B and C as describedin the text.
the dispersions prepared according to the Procedure B (saturation wasachieved in around 10 h), but the surface tension in this casewas higherindicating that the formed lipid monolayers were less densely packedthan those prepared according to Procedure C. The time dependenceof the surface tension for DMPC dispersions in water/ethanol mixture(Procedure A) shows that equilibrium is reached almost immediately.These results allowed selecting suitable experimental conditions forpreparation of stable lipid stabilised foam films.
Films prepared from DMPC solutions in water/ethanol mixtures(Procedure A) were stable in the temperature range from 20 °C to30 °C. Films formed from lipid dispersions in water (Procedures B andC) were stable only above 22 °C. This temperature is very close to thetemperature of the main phase transition (23.5 °C) in bulk dispersionsof DMPC [45]. Consequently, all experiments presented in the paperwere carried out at 26 °C, a temperature that assured formation of sta-ble films. Differential scanning calorimetric data show that the temper-ature of themain transition does not depend on the EtOH concentrationfor DMPC dispersions in water/EtOHmixtures. The increase of the EtOHcontent shifts only the pre-transition peak to higher temperatures [27].The transition from gel to liquid crystalline state facilitates the spread-ing of the lipid vesicles at the air/water interface and is an important fac-tor which governs the film stability.
The velocity of film thinning depends on the presence of EtOH in thefilm forming vesicular suspension. A typical film thinning curve isshown in Fig. 4a. Initially formed thick films have a thickness of around80 nm. They get thinner under the action of the capillary pressure and/or interfacial forces. A black film (either CBF or NBF) is formed with ajump at a certain thickness of the film where the system film–meniscusreaches a local energy minimum. Fig. 4b compares the thinning behav-iour of films prepared according to Procedure A and Procedure C. Differ-ent thinning velocities are an indication that different types ofinteractions act between the film surfaces. The films prepared fromEtOHcontaining solutions thin faster and “smoother”. This drainingpro-cess results in a stable film of homogeneous and constant thickness.
Fig. 4b also shows a difference in the equilibrium film thicknessattained after the thinning. Similar to the differences observed in thesurface tension experiments (Fig. 3) the film thickness is very sensitiveto the preparation procedure of the lipid dispersion, being higher in thecase of EtOH free lipid suspensions (see Table 1). The sonication of thevesicular suspensions reflects in a change in the film thickness. Filmsobtained from Procedure C are slightly thicker than those obtainedfrom Procedure B. This small thickness difference can be explained bya larger area per lipid molecule in the monolayer of films obtainedfromProcedure B. The thinnest films are those prepared fromProcedureA (water/ethanol mixture). The effect of EtOH on the film thicknesswasstudied in details and the results are summarised in the Part 5 “Shortrange interactions in the film”.
An interesting question in the foam film studies is the density of thesurfactant (lipid) molecules organised in the monolayers which stabi-lise the films. Suitable technique to probe the density of themonolayersis the fluorescent microscopy. We studied the distribution of the fluo-rescent dye L-α-phosphatidylcholine-β-(NBD-aminohexanoyl)-γ-palmitoyl (NBD–DPPC) at the surface of the film and at the surface ofthemeniscus around thefilm. TheNBD–DPPC is located in the expandedphase of the lipid monolayer and it is not soluble in the condensedphase [49, 50]. In Fig. 5 the changes of the distribution of the fluorescentdye are shown in the process of film drainage from thick film to the thinequilibrium state. From a) to d) the process of film formation and thin-ning is in progress. The contrast is caused by the difference in the con-centration of the dye in the different parts of the images. A smallerintensity of the fluorescent light (darker spots) indicates areas withlower concentration of the dye.
The intensity of fluorescence is homogeneously distributed in themeniscus around the thick film just after formation (Fig. 5a). The inten-sity in the centre of the image is lower, due to the formation of the film.The film expands in images b) and c) where only some domains of the

0 20 40 60 80 100 120 1400
20
40
60
80
100
h, n
m
Time, s
a)
0 50 100 150 2000
20
40
60
80
h, n
m
Time, s
2
1
b)
Fig. 4. a) A typicalfilm thinning curve for afilmprepared according to ProcedureA. The photos show images of thefilmat certain thickness. b) Thinning curves forfilms prepared accordingto Procedure A (1) and Procedure C (2). Films prepared with EtOH thin faster and smoother. Experiments performed in the presence of 0.07 M NaCl at 26 °C.
97J.L. Toca-Herrera et al. / Advances in Colloid and Interface Science 207 (2014) 93–106
dye can be observed in the area of thefilm (Fig. 5c).When thefinal stateof the thinning is reached (Fig. 5d) the film is homogeneously dark andmuch contrasted in respect of the surrounding meniscus. This observa-tion indicates an expulsion of the dye from the film monolayers. Weconclude that this segregation is caused by a higher packing density ofthe lipid at the film surfaces compared to the surface of the bulk. This ef-fect is similar to the case of the formation of domains of different densi-ties of the amphiphile molecules in the two-phase coexistence range ofinsoluble monolayers [30]. Such a conclusion is in agreement with theresults [30,51] about lateral diffusion of fluorescent dye in the plane oflipidmonolayers which form the film. The results reveal that themono-layers are more condensed in the case of black films (CBF or NBF) thanin thick foam films [52].
4. Long range interactions in lipid stabilised foam films
4.1. van der Waals attraction
The long range surface forces operating in foam films are the van derWaals force and the electrostatic double layer force. The van der Waalsforce is always attractive in the case of symmetrical system of thin liquidlayer between two semi-infinite gas (air in our case) phases [4]. This forceis the origin of the negative component of the disjoining pressure ΠVW
(Eq. (3)). It tends to decrease the film thickness and finally leads to itsrupture. The Hamaker constant AH, respectivelyΠVW can be easily deter-mined using the “dynamic method” [5–7,53] (see Part 6 “Experimentaltechniques” for details) studying the process of film thinning at high elec-trolyte concentrations where the electrostatic double layer repulsionis suppressed. We acquired the Hamaker for films stabilised with0.4 mg/ml DMPC. This lipid concentration ensures formation of stablefoamfilms. ANaCl concentration of 0.07Mguarantees negligible doublelayer repulsion and strength of the Debye length in order of 1 nm. Theexperiments were also carried out with addition of sugar or DMSO tothe film forming solution. The obtained values of AH are presented inTable 2. They are in good agreement with the published data for similarsystems [4,35]. Actually, the values are effective, as other attractive
Table 1Influence of the preparation procedure on the equivalent film thickness. Procedure A —
lipid vesicles in water/EtOH mixture after sonication; Procedure B — lipid vesicles inwater without sonication; Procedure C — lipid vesicles in water after sonication.Solutions contained 0.4 mg/ml DMPC and 0.07 M NaCl. Temperature— 26 °C.
Preparation Procedure A Procedure B Procedure C
h, nm 6.0 7.8 7.9
interactions except the van der Waals, not included in our treatment,might also act in the film [4].
AH values slightly decrease with an addition of the considered sol-utes. According to the Lifshitz theory of van der Waals forces, theHamaker constant depends on the dielectric constants and polarizabil-ities of the interacting media [4]. The addition of sugars or DMSO onlyslightly changes these properties. That is why the Hamaker constantshould not vary appreciably with the addition of solutes.
4.2. Electrostatic double layer repulsion
The existence of an electrostatic surface double layer potential cre-ates a repulsive electrostatic componentΠEL of the disjoining pressurein the film. Its strength depends on the concentration and the type ofthe electrolytes in the film forming solutions and the surface doublelayer potential. The existence of charged interfaces is expected forfilms prepared from ionic surfactants because of the surfactant adsorp-tion. However, the electrostatic component of the disjoining pressurewhich is a result of the interaction between charged surfaces was alsofound in foam films prepared from solutions of non-ionic surfactants[37,53], indicating a weak surface charge. The DLVO theory gives onlythe possibility for determining the absolute φ-value, but it does not ex-plain the origin of this potential. The method does not even allow itssign to be estimated. The common explanation nowadays of this effectis the adsorption of hydroxyl ions at the water/air interfaces [38,39],which results in formation of a negative electrostatic double layerpotential φ0. The adsorption of the hydroxyl ions occurs through strongdipole or hydrogen bonding of the OH− ions with the hydrogen atomsof the interfacial water molecules. The specific adsorption could resultfrom restrictions in the movement of the water molecules in theinterfacial layer compared to the bulk phase, as shown in [38]. This al-lows more pronounced hydrogen bonding of the OH− ion with theneighbouring water molecules.
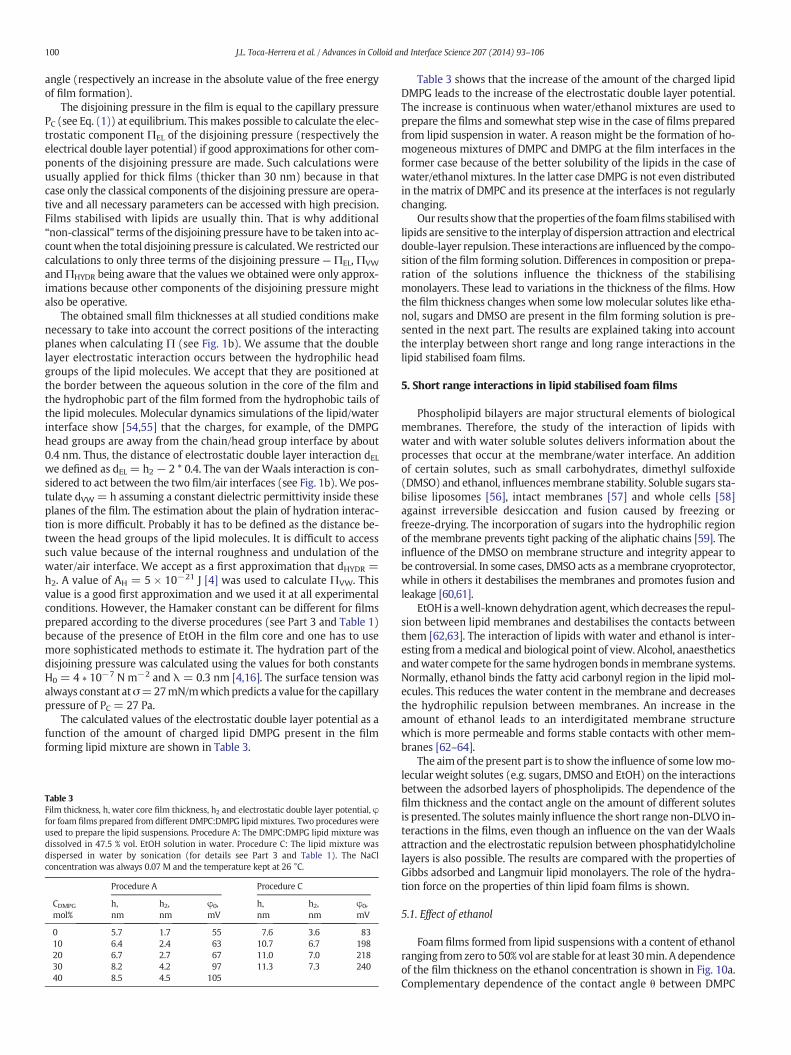
Even though DMPC is a zwitterionic lipid, the charging of the water/air interface is possible. The fact is rather unexpected, but was experi-mentally confirmed [24,39]. Experiments were performed to provethe influence of two salts (NaCl and CaCl2) on ΠEL and respectively itseffect on the film thickness and the film contact angle. The values ofthe film thickness h and contact angle θ are given in Fig. 6 as a functionof theNaCl concentration for equilibriumfilms prepared by Procedure Aand Procedure B. The dependence of the contact angle between the filmand its meniscus is also shown. Black films were always formed in theinitially thick foam film by formation of black spots. The thickness ofthe films was around 7 nm and it varied slightly of about 1 nm on theaddition of NaCl to the film forming solution. A pronounced differencein the properties for the films prepared from the Procedure A or B was
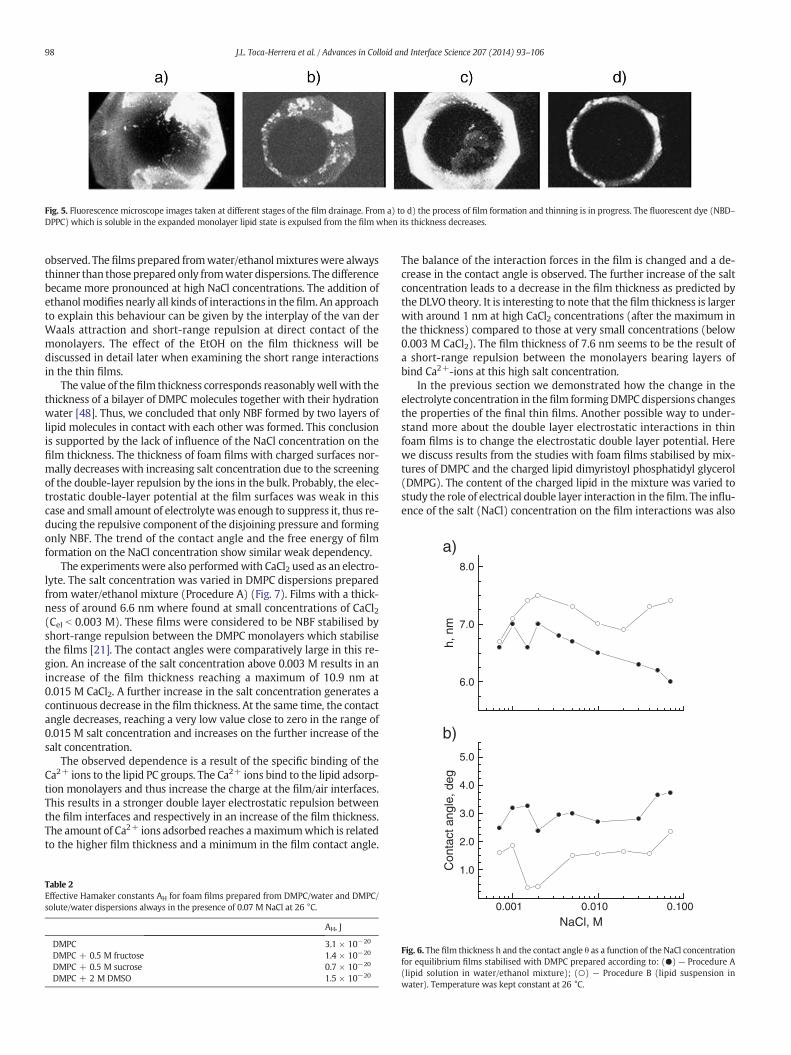
Fig. 5. Fluorescence microscope images taken at different stages of the film drainage. From a) to d) the process of film formation and thinning is in progress. The fluorescent dye (NBD–DPPC) which is soluble in the expanded monolayer lipid state is expulsed from the film when its thickness decreases.
2.0
3.0
4.0
5.0
b)
a)
tact
ang
le, d
eg
6.0
7.0
8.0
h, n
m
98 J.L. Toca-Herrera et al. / Advances in Colloid and Interface Science 207 (2014) 93–106
observed. The films prepared fromwater/ethanolmixtureswere alwaysthinner than those prepared only fromwater dispersions. The differencebecame more pronounced at high NaCl concentrations. The addition ofethanolmodifies nearly all kinds of interactions in thefilm. An approachto explain this behaviour can be given by the interplay of the van derWaals attraction and short-range repulsion at direct contact of themonolayers. The effect of the EtOH on the film thickness will bediscussed in detail later when examining the short range interactionsin the thin films.
The value of thefilm thickness corresponds reasonablywell with thethickness of a bilayer of DMPC molecules together with their hydrationwater [48]. Thus, we concluded that only NBF formed by two layers oflipid molecules in contact with each other was formed. This conclusionis supported by the lack of influence of the NaCl concentration on thefilm thickness. The thickness of foam films with charged surfaces nor-mally decreases with increasing salt concentration due to the screeningof the double-layer repulsion by the ions in the bulk. Probably, the elec-trostatic double-layer potential at the film surfaces was weak in thiscase and small amount of electrolytewas enough to suppress it, thus re-ducing the repulsive component of the disjoining pressure and formingonly NBF. The trend of the contact angle and the free energy of filmformation on the NaCl concentration show similar weak dependency.
The experimentswere also performedwith CaCl2 used as an electro-lyte. The salt concentration was varied in DMPC dispersions preparedfrom water/ethanol mixture (Procedure A) (Fig. 7). Films with a thick-ness of around 6.6 nm where found at small concentrations of CaCl2(Cel b 0.003 M). These films were considered to be NBF stabilised byshort-range repulsion between the DMPC monolayers which stabilisethe films [21]. The contact angles were comparatively large in this re-gion. An increase of the salt concentration above 0.003 M results in anincrease of the film thickness reaching a maximum of 10.9 nm at0.015 M CaCl2. A further increase in the salt concentration generates acontinuous decrease in the film thickness. At the same time, the contactangle decreases, reaching a very low value close to zero in the range of0.015 M salt concentration and increases on the further increase of thesalt concentration.
The observed dependence is a result of the specific binding of theCa2+ ions to the lipid PC groups. The Ca2+ ions bind to the lipid adsorp-tion monolayers and thus increase the charge at the film/air interfaces.This results in a stronger double layer electrostatic repulsion betweenthe film interfaces and respectively in an increase of the film thickness.The amount of Ca2+ ions adsorbed reaches amaximumwhich is relatedto the higher film thickness and a minimum in the film contact angle.
Table 2Effective Hamaker constants AH for foam films prepared from DMPC/water and DMPC/solute/water dispersions always in the presence of 0.07 M NaCl at 26 °C.
AH, J
DMPC 3.1 × 10⁻²⁰
DMPC + 0.5 M fructose 1.4 × 10⁻²⁰
DMPC + 0.5 M sucrose 0.7 × 10⁻²⁰
DMPC + 2 M DMSO 1.5 × 10⁻²⁰
The balance of the interaction forces in the film is changed and a de-crease in the contact angle is observed. The further increase of the saltconcentration leads to a decrease in the film thickness as predicted bythe DLVO theory. It is interesting to note that the film thickness is largerwith around 1 nm at high CaCl2 concentrations (after the maximum inthe thickness) compared to those at very small concentrations (below0.003 M CaCl2). The film thickness of 7.6 nm seems to be the result ofa short-range repulsion between the monolayers bearing layers ofbind Ca2+-ions at this high salt concentration.
In the previous section we demonstrated how the change in theelectrolyte concentration in the film formingDMPC dispersions changesthe properties of the final thin films. Another possible way to under-stand more about the double layer electrostatic interactions in thinfoam films is to change the electrostatic double layer potential. Herewe discuss results from the studies with foam films stabilised by mix-tures of DMPC and the charged lipid dimyristoyl phosphatidyl glycerol(DMPG). The content of the charged lipid in the mixture was varied tostudy the role of electrical double layer interaction in the film. The influ-ence of the salt (NaCl) concentration on the film interactions was also
0.001 0.010 0.100
1.0Con
NaCl, M
Fig. 6. The film thickness h and the contact angle θ as a function of the NaCl concentrationfor equilibrium films stabilised with DMPC prepared according to: (●) — Procedure A(lipid solution in water/ethanol mixture); (○) — Procedure B (lipid suspension inwater). Temperature was kept constant at 26 °C.

10-3 10-2 10-1
0.0
1.0
2.0
3.0
b)
Con
tact
ang
le, d
eg
CCaCl2, M
6
8
10
12
a)
h, n
m
Fig. 7. Film thickness (a) and contact angle (b) as a function of CaCl2 concentration forfilms prepared according to Procedure A (water/EtOH mixture) at T = 26 °C. DMPC con-centration was 0.4 mg/ml. The lines are only guide for the eye.
Fig. 8. Film thickness (a) and contact angle (b) vs. amount of DMPG in the DMPG:DMPClipid mixture used to stabilise the films at constant NaCl concentration of 0.07M and con-stant total lipid content of 0.4 mg/ml. (●)— dispersions prepared according to ProcedureC; (○) — lipid dispersions in water/EtOH mixtures (Procedure A).
0.00 0.05 0.10 0.15
5.5
6.0
6.5
7.0
7.5
CNaCl, M
h, n
m
Fig. 9. Film thickness as a function of NaCl concentration for films prepared from 1:9DMPG:DMPC lipid mixture. Films were prepared from lipid dispersions in EtOH/watermixtures (Procedure A) (○) or water (Procedure C) (●). The lipid content was constantat 0.4 mg/ml and temperature of 26 °C.
99J.L. Toca-Herrera et al. / Advances in Colloid and Interface Science 207 (2014) 93–106
demonstrated. DMPC foam films are basically stabilised by structuralforces [22,23,25], but a small effect due to electrical double layer inter-action seems also to be involved. The inclusion of DMPG molecules/ions in the film forming adsorption layers should result in an increaseof the double layer potential and stronger repulsion [23].
The film thickness and the contact angle of foamfilms prepared fromdispersions of different ratio DMPC/DMPG at constant NaCl concentra-tion (0.07 M) were measured. The total lipid concentration was always0.4 mg/ml. The filmswere prepared either from DMPC:DMPGmixturesdispersed in water following the Procedure C (sonicated lipid disper-sions in water) or from lipid solutions in water/ethanol mixtures. Theresults are presented in Fig. 8. The films prepared from water disper-sions of the lipids are thicker than that prepared from water/ethanolmixture. This difference is similar to that observed for films preparedfrom pure DMPC. The film thickness increases with increasing contentof DMPG.
Simultaneously, the contact angle shows a decrease in value whichmeans that the specific interaction film energy diminishes (see Eq. (6)).These provide evidence for an increase of the repulsive component ofthe disjoining pressure when more DMPG is present in the lipid suspen-sion. Increasing the share of DMPG leads to an increasing number ofDMPG-ions in the lipidmonolayers at the film surfaces. Thus, the electro-static double layer potential increases and the repulsion between thefilmsurfaces is stronger. However, the ratio of the lipids in the monolayersmay deviate from that in the vesicles of the suspension. Different solubil-ities and surface activities may cause such difference e.g. a stronger sur-face activity of the charged lipid.
The thickness of foam films formed from solutions containing 9:1DMPC/DMPG suspensions in water/EtOH mixture as a function of NaClconcentration is presented in Fig. 9. The film thickness decreaseswhen the electrolyte concentration is increased as expected from theDLVO theory. This trend is accompanied by an increase of the contact
100 J.L. Toca-Herrera et al. / Advances in Colloid and Interface Science 207 (2014) 93–106
angle (respectively an increase in the absolute value of the free energyof film formation).
The disjoining pressure in the film is equal to the capillary pressurePC (see Eq. (1)) at equilibrium. Thismakes possible to calculate the elec-trostatic component ΠEL of the disjoining pressure (respectively theelectrical double layer potential) if good approximations for other com-ponents of the disjoining pressure are made. Such calculations wereusually applied for thick films (thicker than 30 nm) because in thatcase only the classical components of the disjoining pressure are opera-tive and all necessary parameters can be accessed with high precision.Films stabilised with lipids are usually thin. That is why additional“non-classical” terms of the disjoining pressure have to be taken into ac-countwhen the total disjoining pressure is calculated.We restricted ourcalculations to only three terms of the disjoining pressure — ΠEL, ΠVW
andΠHYDR being aware that the values we obtained were only approx-imations because other components of the disjoining pressure mightalso be operative.
The obtained small film thicknesses at all studied conditions makenecessary to take into account the correct positions of the interactingplanes when calculating Π (see Fig. 1b). We assume that the doublelayer electrostatic interaction occurs between the hydrophilic headgroups of the lipid molecules. We accept that they are positioned atthe border between the aqueous solution in the core of the film andthe hydrophobic part of the film formed from the hydrophobic tails ofthe lipid molecules. Molecular dynamics simulations of the lipid/waterinterface show [54,55] that the charges, for example, of the DMPGhead groups are away from the chain/head group interface by about0.4 nm. Thus, the distance of electrostatic double layer interaction dELwe defined as dEL = h2 − 2 * 0.4. The van der Waals interaction is con-sidered to act between the two film/air interfaces (see Fig. 1b).We pos-tulate dVW = h assuming a constant dielectric permittivity inside theseplanes of the film. The estimation about the plain of hydration interac-tion is more difficult. Probably it has to be defined as the distance be-tween the head groups of the lipid molecules. It is difficult to accesssuch value because of the internal roughness and undulation of thewater/air interface. We accept as a first approximation that dHYDR =h2. A value of AH = 5 × 10⁻²¹ J [4] was used to calculate ΠVW. Thisvalue is a good first approximation and we used it at all experimentalconditions. However, the Hamaker constant can be different for filmsprepared according to the diverse procedures (see Part 3 and Table 1)because of the presence of EtOH in the film core and one has to usemore sophisticated methods to estimate it. The hydration part of thedisjoining pressure was calculated using the values for both constantsH0 = 4 ∗ 10−7 N m−2 and λ = 0.3 nm [4,16]. The surface tension wasalways constant atσ=27mN/mwhichpredicts a value for the capillarypressure of PC = 27 Pa.
The calculated values of the electrostatic double layer potential as afunction of the amount of charged lipid DMPG present in the filmforming lipid mixture are shown in Table 3.
Table 3Film thickness, h, water core film thickness, h2 and electrostatic double layer potential, φfor foam films prepared from different DMPC:DMPG lipid mixtures. Two procedures wereused to prepare the lipid suspensions. Procedure A: The DMPC:DMPG lipid mixture wasdissolved in 47.5 % vol. EtOH solution in water. Procedure C: The lipid mixture wasdispersed in water by sonication (for details see Part 3 and Table 1). The NaClconcentration was always 0.07 M and the temperature kept at 26 °C.
Procedure A Procedure C
CDMPG
mol%h,nm
h2,nm
φ0,mV
h,nm
h2,nm
φ0,mV
0 5.7 1.7 55 7.6 3.6 8310 6.4 2.4 63 10.7 6.7 19820 6.7 2.7 67 11.0 7.0 21830 8.2 4.2 97 11.3 7.3 24040 8.5 4.5 105
Table 3 shows that the increase of the amount of the charged lipidDMPG leads to the increase of the electrostatic double layer potential.The increase is continuous when water/ethanol mixtures are used toprepare the films and somewhat step wise in the case of films preparedfrom lipid suspension in water. A reason might be the formation of ho-mogeneous mixtures of DMPC and DMPG at the film interfaces in theformer case because of the better solubility of the lipids in the case ofwater/ethanol mixtures. In the latter case DMPG is not even distributedin the matrix of DMPC and its presence at the interfaces is not regularlychanging.
Our results show that the properties of the foamfilms stabilisedwithlipids are sensitive to the interplay of dispersion attraction and electricaldouble-layer repulsion. These interactions are influenced by the compo-sition of the film forming solution. Differences in composition or prepa-ration of the solutions influence the thickness of the stabilisingmonolayers. These lead to variations in the thickness of the films. Howthe film thickness changes when some lowmolecular solutes like etha-nol, sugars and DMSO are present in the film forming solution is pre-sented in the next part. The results are explained taking into accountthe interplay between short range and long range interactions in thelipid stabilised foam films.
5. Short range interactions in lipid stabilised foam films
Phospholipid bilayers are major structural elements of biologicalmembranes. Therefore, the study of the interaction of lipids withwater and with water soluble solutes delivers information about theprocesses that occur at the membrane/water interface. An additionof certain solutes, such as small carbohydrates, dimethyl sulfoxide(DMSO) and ethanol, influencesmembrane stability. Soluble sugars sta-bilise liposomes [56], intact membranes [57] and whole cells [58]against irreversible desiccation and fusion caused by freezing orfreeze-drying. The incorporation of sugars into the hydrophilic regionof the membrane prevents tight packing of the aliphatic chains [59]. Theinfluence of the DMSO on membrane structure and integrity appear tobe controversial. In some cases, DMSO acts as amembrane cryoprotector,while in others it destabilises the membranes and promotes fusion andleakage [60,61].
EtOH is awell-knowndehydration agent,whichdecreases the repul-sion between lipid membranes and destabilises the contacts betweenthem [62,63]. The interaction of lipids with water and ethanol is inter-esting from amedical and biological point of view. Alcohol, anaestheticsandwater compete for the samehydrogen bonds inmembrane systems.Normally, ethanol binds the fatty acid carbonyl region in the lipid mol-ecules. This reduces the water content in the membrane and decreasesthe hydrophilic repulsion between membranes. An increase in theamount of ethanol leads to an interdigitated membrane structurewhich is more permeable and forms stable contacts with other mem-branes [62–64].
The aimof the present part is to show the influence of some lowmo-lecular weight solutes (e.g. sugars, DMSO and EtOH) on the interactionsbetween the adsorbed layers of phospholipids. The dependence of thefilm thickness and the contact angle on the amount of different solutesis presented. The solutesmainly influence the short range non-DLVO in-teractions in the films, even though an influence on the van der Waalsattraction and the electrostatic repulsion between phosphatidylcholinelayers is also possible. The results are compared with the properties ofGibbs adsorbed and Langmuir lipid monolayers. The role of the hydra-tion force on the properties of thin lipid foam films is shown.
5.1. Effect of ethanol
Foam films formed from lipid suspensions with a content of ethanolranging from zero to 50% vol are stable for at least 30min. A dependenceof the film thickness on the ethanol concentration is shown in Fig. 10a.Complementary dependence of the contact angle θ between DMPC

0 10 20 30 40 50
1.0
2.0
3.0
4.0
5.0
Con
tact
ang
le, d
eg
EtOH, % vol
b)
7.0
8.0
9.0h,
nm
a)
Fig. 10. Film thickness (a) and contact angle (b) as a function of EtOH concentrationin water/EtOH mixtures. Lipid solutions were prepared according to Procedure A. Allexperiments carried out at a constant lipid concentration of 0.4 mg/ml, salt concentration0.07 M NaCl and temperature 26 °C. The lines are only guide for the eye.
101J.L. Toca-Herrera et al. / Advances in Colloid and Interface Science 207 (2014) 93–106
foam films and the surrounding meniscus is presented in Fig. 10b. Thefilm thickness decreases smoothly as the ethanol concentration in-creases until 40% vol. The thickness drops to a value which does not de-pend further on the EtOH concentration above this concentration. It isaccompanied by an increase in the contact angle on increasing theEtOH concentration. There is also an indication for a jump in θ at ca.40% vol EtOH. However, after this jump the curve seems to increase fur-ther. The contact angles at high EtOH concentrations reach values closeto that obtained for NBF stabilised with other surfactants [6]. This couldmean that the two DMPC adsorbed monolayers are very close to eachother and the films achieve a bilayer structure. We interpret such be-haviour as a transition from a common black film stabilised by hydra-tion forces to a Newton black film stabilised by steric forces.
The dependence of the equilibrium film thickness and the free ener-gy of film formation on the content of EtOH in the film forming solutiondemonstrate the influence of EtOH on the interaction between the filmbuilding DMPC monolayers. An explanation of this effect by modifica-tion of the electrical double-layer repulsion can be excluded. It is unlike-ly that any electrical double layer repulsion according to the classicalDLVO theory plays a significant role in DMPC stabilised films. This, forseveral reasons: i) the DMPC molecule has no net charge, ii) Na+-ionsdo not affect significantly the range of the repulsion (see Part 4) andiii) different amounts of EtOH in solution lead to a small change in theDebye length (from 1.15 nm to 1.03 nm) [65], which cannot explainthe observed results. Therefore, it seems that EtOH affects structuralinteractions.
This means that ethanol does not change only the interaction be-tween theDMPCmonolayerswhich form the film, but also the structureof these layers. Deeper knowledge of the influence of EtOH on the struc-ture of these layers could be obtained from studies carried out on lipidmonolayers spread on liquid subphase [25] under the approximation
that these monolayers are similar to those which form the film. Resultsshow that DMPC monolayers have classical behaviour up to 25% volEtOH in the subphase. Above this concentration themonolayers becomesoluble which does not allow precise experiments to be performed [22].Ellipsometric experiments show that the thickness of DMPCmonolayerincreases when the EtOH concentration increases (Fig. 11a). Compres-sion with surface pressure–molecular area (π/A) isotherms shows thatthe DMPC monolayer becomes more compressed as the EtOH concen-tration in the subphase increases. The mean area per molecule atwhich the surface pressure π begins to rise (lift-off area) shifts to small-er areas [22]. This correlates with results from grazing incidence X-raydiffraction (GIXD) experiments which confirm that the tilt angle of thehydrophobic chains of the lipid molecules decreases [25] (Fig. 11b).Small amounts of alcohol (up to 4% vol) in the subphase create distor-tion of the lipid layer lattice. A further increase of the ethanol does notchange the lattice distortion, but reduces continuously the area perhead group. GIXD experiments were performed with 1,2-distearoyl-phosphatidylcholine (DSPC) because it forms only condensedmonolay-er at 20 °C, whereas DMPC exhibits a liquid-expanded phase withoutcrystallographic structure up to high surface pressures at this tempera-ture. However, DSPC and DMPC have the same head groupwith slightlydifferent chain length. Since the interaction with ethanol is expected tooccur in the head group region, the X-ray experiments performed withDSPC can be directly compared with the investigations of the influenceof ethanol on the properties of foam films stabilised with DMPC. The in-creased van der Waals interactions between the longer DSPC chainsonly shift the liquid-expanded/condensed transition pressure to lowervalues but do not change the structure of the condensed phase.
The smaller effective area per lipid molecule at the lift off point canbe explained by a decrease of the diameter of the lipid head groupswith increasing ethanol concentration. The increase of the monolayerthickness, found in the ellipsometric measurements, should be a resultof a decrease in the tilt of the hydrocarbon chains. This also requires adecrease of the area per head group in the monolayer. These findingsare in agreement with results of Klemm [62], Komatsu and Williams[64] and Komatsu andOkada [64] about the dehydration of phospholip-id head groups by ethanol. DMPC head groups in water are highlyhydrated. A DMPC molecule can bind around 12–15 water molecules[62]. Ethanol molecules bind the lipid molecules near the junction ofthe alkyl chains and the polar head group at sites normally occupiedby water, displacing hydrogen bonded water molecules [64]. Upon in-creasing the ethanol content in the subphase, the hydration shellaround the head groups becomes smaller and the average area permol-ecule decreases.
The parallelism of the decrease of the water core in a lipid-stabilisedfoamfilmand of the distance of the PC headgroups in amonolayer uponincreasing ethanol concentration indicates that the same physicalmechanism is behind these two effects. We conclude that the repulsionbetween PC head groups decreases both in the plane of the monolayeras well as normal to the film plane with increasing ethanol concentra-tion. These results can be explained by a dehydration of the PC headgroups due to the presence of ethanol in a similar way as ethanol dehy-drates proteins, in agreement with the dehydration theory of proteinsby ethanol [62]. Thus, it seems that the effect of dehydration by ethanolis not restricted to organic hydrophilic groups. A decrease of the range ofthe ‘hydration repulsion’ between two silica surfaces after the additionof 10–20 vol.% ethanol has also been reported [4], with a stronger effectof methanol. Therefore, we assume that ethanol disturbs the formationof H-bonds of water molecules with the hydrophilic groups and causesthe effects observed in this work. The comparison of the influence ofethanol on the stability of singlemonolayers at the surface of an extend-ed aqueous phase and of the monolayers in a thin film shows that thelipid molecules in the film are strongly bound to the interface. This iscaused by the interaction in the film, which decreases the specificGibbs energy of the lipid molecules compared to the bulk and to amonolayer at the surface of an extended bulk phase.

0 10 20 30 40 501.2
1.4
1.6
1.8
2.0
2.2
Mon
olay
er th
ickn
ess,
nm
EtOH concentration, % vol
a)
0 5 10 15 20
32
34
36
38
40
Tilt
ang
le, d
eg
EtOH concentration, % vol
b)
Fig. 11. a) Thickness of monolayer obtained from ellipsometric experiments and b) tilt angle t from grazing incidence X-ray diffraction (GIXD) experiments of PC lipid monolayers spreadon aqueous subphase containing different amounts of EtOH. The ellipsometric experiments were performedwith DMPC while the GIXD experiments were donewith DSPC thus assuringformation of condensed phase at room temperature.
102 J.L. Toca-Herrera et al. / Advances in Colloid and Interface Science 207 (2014) 93–106
5.2. Effect of low molecular weight solutes at low ionic strength
The thickness of films prepared from suspensions of DMPC (con-stant lipid concentration of 0.4 mg/ml) in DMSO or sugar aqueoussolutions with different concentrations were measured in absenceof electrolyte. The concentration of sugars was varied up to 0.5 Mand that of DMSO up to 2 M. The dependence of the film thicknesson the sugar concentration in the film forming dispersion is present-ed in Fig. 12a. The effect of both fructose and sucrose on the filmthickness is similar. NBF about 7 nm thick is formed at low sugar con-centrations. The film thickness increases steadily with increasing
0,0 0,1 0,2 0,3 0,4 0,5
6,5
7,0
50,0
60,0
70,0
a)
Csugar, M
h, n
m
b
Fig. 12. Dependence of the film thickness on the concentration of a) sugar (■ — fructose; —
(0.4 mg/ml) and temperature (26 °C). The solutions contained no salt and were prepared acco
sugar concentration up to about 0.35 M. After this point the filmthickness increases with a jump and thick films (h ≥ 50 nm) are ob-served. In these conditions the film thickness cannot be measuredwith our equipment above concentration of sugar 0.5 M. The depen-dence of the film thickness on the DMSO content is shown in Fig. 12b.NBF about 6–7 nm thick is formed at concentrations of DMSO lowerthan 1 M. The film thickness varies non-monotonically with theDMSO concentration in this range. At about 1.5 M DMSO the filmthickness increases with a jump. On a further increase in DMSO con-centration above 2 M the stability of the film decreases and the filmruptures during the thinning.
0.0 0.5 1.0 1.5 2.0
6.5
7.0
40.0
50.0
)
h, n
m
CDMSO, M
sucrose) and b) DMSO. All experiments performed at constant concentration of DMPCrding to Procedure C.

103J.L. Toca-Herrera et al. / Advances in Colloid and Interface Science 207 (2014) 93–106
Two regions in thickness vs. solute concentration dependencies aredistinguished for both solutes: one at lower amount of the additivewhere NBF is formed and thefilm thickness changes slightly, and anoth-er at higher solute concentrations where thick films are formed. Thesmall changes in the film thickness observed at low solute concentra-tions are probably caused by modified steric-hydration repulsion. Thestrong increase in the film thickness at high solute contents could becreated by an increased electrostatic repulsive contribution to thedisjoining pressure.
5.3. Effect of electrolyte concentration at high solute content
If the formation of stable thick films is caused by the increased of thelong-range electrostatic double layer repulsion between the film sur-faces, one should expect a dependence of the film thickness on the elec-trolyte concentration in the suspension. Such dependency for DMPCfilms in the presence of 0.5M sucrose or 2MDMSOon the NaCl concen-tration is shown in Fig. 13. These are the concentrations of the solutes atwhich the thickest films without electrolyte were obtained (Fig. 12).
The film thickness gradually decreases with increasing electrolyteconcentration. Formation of CBF is observed in both cases at an electro-lyte concentration of around 0.02M. In the presence of sugar CBF existswithin a wide range of salt concentration up to 0.05 M (Fig. 13a). Theirthickness slightly decreases with increasing NaCl concentration. Abrupttransition to NBF with a constant thickness of about 7 nm occurs whenthe NaCl concentration reaches 0.05 M. In the case of DMSO, formationof CBF is observed only in a very narrow salt concentration region(Fig. 13b). Instead, NBFwith constant thickness of about 6 nm is alreadyformed at 0.02 M NaCl.
The dependence of the film thickness on the electrolyte concentrationdepicted above confirms the electrostatic origin of the forces that stabilisethese films. The forces operating in such films is successfully described bythe DLVO theory, when only the long-range attractive and repulsiveforces acting in the film are taken into consideration and the influenceof short-range interaction terms is omitted. This allows the determinationof the electrostatic double layer potential φ0, using Eq. (4), making a rea-sonable estimation about the van derWaals component of the disjoiningpressure. The thicknesses of the films measured at the lowest availableelectrolyte concentration, Cel = 5 × 10⁻³ M, were taken for the calcula-tions (for details see Part 4). The addition of solutes increases the surfacepotential (φ0) from 21 mV for pure DMPC/water suspensions to about60mV for films obtained in the presence of sugars or DMSO.We shouldmention that these φ0-values might be overestimated since not all
0.00 0.02 0.04 0.06 0.08 0.10
10.0
20.0
30.0
40.0
50.0
60.0
70.0
CNaCl, M
a)
h, n
m
b
Fig. 13. Foam film thickness vs. NaCl concentration: a) in the presence of 0.5M fructose, and b) ilipid suspensions containing 0.4 mg/ml DMPC at temperature of 26 °C according to Procedure
possible repulsive interactions that may exist in a film are consideredin the calculation [4–6]. The existence of high surface potential in anon-charged lipid film is rather unexpected. The appearance of strongerrepulsion between the film interfaces in the presence of sugars andDMSO, which we correlate with increased φ0 potentials, remainsunclear.
5.4. Effect of solutes at high ionic strength
Formation of NBF is observed at high electrolyte concentration (thelowest plateau regions in Fig. 13). The thickness of these NBF dependson the kind of the solute used. They are about 7 nm thick when formedin the presence of sugar, while the thickness of NBF in the presence ofDMSO is about 6 nm. The film thickness varies with the concentrationof the solute as well (Fig. 14). The addition of sugar leads to an increasein the thickness (Fig. 14a). In contrary, increasing DMSO concentrationdecreases the film thickness (Fig. 14b).
The equilibrium thickness in NBF dependsmainly on the short rangesteric and hydration repulsion between the lipid monolayers adsorbedon the both film surfaces. It can be seen that h increases from about6.5 nm for the DMPC/water system tomore than 12 nm in the presenceof 1 M fructose. The addition of DMSO reduces the h value to about5.5 nm in the presence of more than 2 M DMSO. Taking into accountthe diameter of the water molecule of about 0.2 nm, the observedchanges of h correspond to addition or removal of several water layerscaused by the presence of fructose and DMSO, respectively. Hence, theobserved changes in the DMPC film thickness in the presence of solutesin thefilm forming suspension can be attributed to altered hydration re-pulsion between the film surfaces.
It has been showed [66] that sugars and DMSO influence the phasebehaviour and the condensed phase structure of insoluble lipid DPPCmonolayers. As in the above discussed comparison between DSPC andDMPC they possess the same choline head groups and differ only inthe alkyl chain length. Since the polar lipid heads aremainly responsiblefor the interactions between the solutes and the phosphocholines, theresults of the DPPC monolayer study can be used to explain the ob-served variation of the thickness of the black films. The sugar moleculespenetrate into the polar head group region. The binding of the stronglyhydrated sugars increases the hydration of the lipid. This results instronger a repulsion between the PC head groups. The same phenome-non can be responsible for the observed increase in the film thicknesson the addition of sugar. In contrast, the addition of DMSO into the sub-phase causes condensation of the DPPC monolayer and reduces
0.00 0.02 0.04 0.06
10.0
20.0
30.0
40.0
50.0
CNaCl, M
h, n
m
)
n the presence of 2MDMSO in thefilm forming lipid dispersion. Filmswere prepared fromC.

104 J.L. Toca-Herrera et al. / Advances in Colloid and Interface Science 207 (2014) 93–106
apparently the amount of the water molecules in the vicinity of thepolar lipid head groups. Moreover, the hydrated lipid molecules andthe DMSO molecules compete for the same limited amount of waterat the interface. Thus, certain hydration water is extracted from the re-gion around the lipid head groups. The deficiency of hydration waterdecreases the lipid head group repulsion and diminishes the effectivevolume of the PC moiety. The DMSO induced dehydration can causethe observed decrease in the lipid film thickness. The effect of DMSOis similar to the dehydration effect of ethanol.
6. Conclusions
Phospholipid bilayers are the smallest components of barriers(i.e. membranes) separating living matter from its external environment.The lateral organisation of the lipid molecules in bilayers and the interac-tions between then normal to the lamella plane affect the stability andthe transport processes through membranes. Foam films stabilised bylipids offer the possibility to study the interactions between lipidmono-layers. Presenting an inverse black lipid membrane the foam films sup-ply information about the properties of the self-organised in bilayerlipid molecules at interfaces. The equilibrium thickness of these filmsis determined by the interplay of the dispersion attraction, electricaldouble-layer repulsion, and short-range molecular interactions. Theseinteractions are influenced by the composition of the film formingsolution.
The thickness of foamfilms stabilisedwithDMPC is controlled by thevan der Waals attraction and short range hydration or steric repulsiveinteractions. The electrostatic double layer cannot be detected, beingvery weak. If the film surfaces are charged either by co-adsorption ofcharged lipids (e.g. DMPG) or specific binding of Ca2+ ions the electro-static component of the disjoining pressure becomes stronger and playsan important role to determine the film thickness.
The presence of solutes in thewatermedium surrounding themem-brane influences both the lateral ordering of the lipid molecules and theshort-range interactions between them in direction normal to the mo-lecular arrays. Results on the influence of EtOH, low molecular weightsugars and dimethyl sulfoxide on the short range interactions betweenphospholipid molecules in thin free-standing foam films are reportedand discussed. The dependence of the equilibrium film thickness onthe content of the solute in the film forming dispersion demonstratesthe influence of the solutes on the interaction between the DMPC film
0.0 0.2 0.4 0.6 0.8 1.0
6.0
8.0
10.0
12.0
a)
CFructose, M
Thi
ckne
ss, n
m
Fig. 14. Film thickness of Newton black films of DMPC (0.4 mg/ml concentration) at 0.05 M NaCdispersion. Films were prepared according to Procedure C.
monolayers. High concentration of solutes leads to a large increase inthe film thickness. It is caused by modification of the electrostaticdouble-layer repulsion between film interfaces. At low electrolyte andhigh solute concentration, the electrostatic disjoining pressure governsthe film thickness. At high electrolyte concentration, formation of NBFwith thickness of only few nanometres is observed. In these verythin films, the equilibrium thickness depends on the short-range inter-actions between the lipid monolayers adsorbed on both film surfaces.Their thickness depends on the type of solute and its concentration inthe film forming dispersion. The addition of sugar leads to an increasein the thickness, while the presence of DMSO and EtOH decreases thefilm thickness. The observed changes correspond to the addition or re-moval of several layers of water molecules which hydrates the PC lipidgroups.
7. Experimental techniques
The Scheludko–Exerowa glass ring experimental cell (Fig. 15) is asuitable tool for studying single foam films. The film is formed in aglass ring (1) with a radius R which is connected via a capillary to thebody of the cell (2). A special piston made of Teflon (3) is used to suckthe liquid from the glass capillary and thus forming the foam film. Theglass ring is placed in a close glass vessel (4) which assures formationof saturated towater vapour atmosphere. This is an important conditionfor the formation of stable foam films. The whole device is placedtogether with a metal thermostatic jacket (5) on experimental table(6) of an (usually) inverted optical microscope. A horizontal film isformed in the glass ring, by suction of the film forming solution fromthe ring through the capillary at low capillary pressure. The film startsthinning after its formation due to drainage. It either ruptures duringthe thinning process or an equilibrium film is formed at the end of thedrainage process. Initially a thick coloured film with a radius r1 isformed. During the drainage process, due to local fluctuation of thefilm thickness black spots appear. These spots grow and finally coverthe whole film. At that moment the film expands shortly (in lessthan a second) because of the new force balance between the filmand bulk meniscus. Thereafter the film size remains constant with-out any further change. The radius of the thinner equilibrium blackfilm r2 is greater than the radius of the thicker film r1 just beforethe first black spot appears. A contact angle θ is formed betweenthe black film and the surrounding meniscus.
0.0 0.5 1.0 1.5 2.0 2.5
5.5
6.0
6.5
7.0b)
Thi
ckne
ss, n
m
CDMSO, M
l and 26 °C as a function of the a) fructose and b) DMSO concentration in the film forming

Fig. 15. Left. A scheme of the glass ring “Scheludko–Exerova” experimental cell used for formation and studies of single foam films. For full description of the different parts see the text.Right: Schemes of the cross-section of the glass ring where the foam film is formed. (a) A thick filmwithout a contact angle to the surroundingmeniscus; and (b) a thin filmwith contactangle θ. The diameter 2r2 of the thin film is larger than the diameter 2r1 of the thick one due to the difference between the film surface tension σf and the surface tension on the meniscusσ [σf b σ].
105J.L. Toca-Herrera et al. / Advances in Colloid and Interface Science 207 (2014) 93–106
7.1. Contact angle
The contact angle θ between the black film and the bulk meniscus(see Fig. 2) is determined conveniently by the “expansion method”[44]. θ is calculated from the measured values of radii r1 and r2 byusing the expression [43]:
sinθ ¼ δ22−δ21δ2
ð7Þ
r1 and r2 are the radii of the foam film immediately after its preparation(thick films) and after the film expansion, respectively, when an equi-librium thin film is formed. R is the radius of the glass capillary wherethe film is formed and δ1 = r1/R, δ2 = r2/R. The initial film radius ismaintained in the range of 0.1–0.15 mm during the measurement. Theaccuracy of the method is ±0.2°.
7.2. Film thickness
The film thickness is measured microinterferometrically [7–9]. Themethod is based on the registration of the intensity of the monochro-matic light reflected from the film. A small central part of the film is il-luminated by white light. Part of this light is reflected, passes througha light filter and reaches a photomultiplier. An interferometric patternis observed because of the small thickness of the films comparablewith the wavelength of the illuminating light. The equivalent solutionthickness hw is calculated by the equation [7]:
hw ¼ λ2πn
arcsin
ffiffiffiffiffiffiffiffiffiffiffiffiffiffiffiffiffiffiffiffiffiffiffiffiffiffiffiffiffiffiffiffiffiffiffiffiffiffiffiffiffiffiffiffiffiffiI=Im
1þ 4R1−Rð Þ2 1−I=Imð Þ
vuuut ð8Þ
where R ¼ n−1nþ1
� �2, n is the refractive index of the bulk solution, Im and I
are themaximum intensity and the intensity of the reflected light in thethinning process, respectively.
The equivalent film thickness is the thickness obtained by assumingan optically homogeneous filmwith the same refractive index as that ofthe bulk solution fromwhich the film is formed. Indeed thefilm consistsof two surfactant monolayers and an aqueous layer in between, and thefilm thickness h is different from that of the equivalent film thicknesshw. The film thickness h is calculated by assumingmodels with differentcomplexities. The three-layer model [5–7] assumes that the film con-sists of a solution core of thickness h2 and refractive index n2 flankedby two layers of hydrophobic alkyl chains of the adsorbed surfactantmolecules, with thickness h1 and refractive index n1. The water core in-cludes the hydrophilic head groups of the surfactant molecules. Thisthree-layer model is used to calculate the film thickness h from theexperimentally obtained hw values using the relation [6–9]:
h ¼ 2h1 þ h2; h2 ¼ hw−2h1n21−1
n22−1
: ð9Þ
The film thickness h is calculated from Eq. (9) using the experimen-tally obtained values for the equivalent solution thickness hw andthe refractive index of the hydrophobic part assuming values for theother constants. A value of n1 = 1.4255 is used usually when foamfilms stabilised with DMPC are studied. This value is the same as fortetradecane at T = 26 °C. The thickness of the film forming adsorptionsurfactant layerswas assumed to be h1=1.5 nmas obtained from inde-pendent ellipsometric measurements on liquid/air interfaces [22]. Thisvalue is close to the data reported from X-ray reflectometry experi-ments with foam films stabilised by different lipids [67].
7.3. Velocity of film thinning
The film begins to thin under the action of the meniscus capillarypressure PC and the film disjoining pressure Π(h) until it reaches its

0.01 0.02 0.03
5.0x10⁻⁷
1.0x10⁻⁶
1.5x10⁻⁶
2.0x10⁻⁶V
/h3 ,
nm
-2 s
ec-1
1/h, nm-1
Fig. 16. Illustration of the application of the dynamic method for film thinning studies. TheDMPC (0.4 mg/ml) stabilised film is formed from a suspension that contains 0.07 M NaCland 0.5 M sucrose. The points represent the experimental V/h3 vs. 1/h dependence; thesolid line is only a guide for the eye. The dashed line is the best fit to the experimentaldata for thick films, where the disjoining pressure is zero.
106 J.L. Toca-Herrera et al. / Advances in Colloid and Interface Science 207 (2014) 93–106
equilibrium thickness or ruptures. The dynamic method [5–7] connectsexperimentally themeasured velocity offilm thinningwith the disjoiningpressure operative in the film. For surfactant stabilised liquid films, therelation between the film thinning velocity V and the thickness h isgiven by [5,7,68]:
Vh3 ¼ β 1þ bþ hs
h
� �þ β 1þ bþ hs
h
� �−Π hð Þ
PC
� �ð10Þ
where b and hs account for bulk and surface diffusion, respectively, andβis a factor comprising all thickness independent quantities.
The procedure of calculating the disjoining pressure from the exper-imental thinning curve is to plot the dependence of V/h3 vs. 1/h. Suchdependence for a film prepared from DMPC suspension in the presenceof 0.5M sucrose is presented in Fig. 16 as an example. The points repre-sent the experimental values and the solid line is only a guide for theeye. Eq. (10) predicts a linear dependence of V/h3 on 1/h in thick filmswhere both film surfaces do not interact (Π = 0). The linear fit to theexperimental data for thick films is shown as a dashed line on Fig. 16.The quantities βb and βhs are determined from the slope and the inter-cept of this fit. At smaller film thickness, whenΠ≠ 0, a deviation fromlinearity arises. The value of the disjoining pressure Π at given filmthickness h is calculated from the difference between the experimentaldata and the linear dependence. Thus, aΠ (h) isotherm is constructed. Ifthe electrostatic double layer repulsion is suppressed the experimentalΠ (h) isotherms can be fitted with the Eq. (3). This procedure allowsestimating experimentally AH.
Acknowledgements
The Max-Planck Society is acknowledged for the financial supportduring the whole period of the project. Parts of the work were financedby the Deutsche Forschungsgemeinschaft through projects Sfb 312, Mu1040/9-1, Mu 1040/4-1 and guest grant 436BUL17/1/99. R.K. was par-tially supported by the Dr. A. Kalojanoff Stiftung, München, Germany.The authors are grateful to Mrs. E. Rütze for technical assistance.
References
[1] Ter Minassian-Saraga L. Pure Appl Chem 1994;66:1667.[2] Deryaguin BV, Landau LD. Acta Phys Chim USSR 1941;14:633.
[3] Verwey EJW, Overbeek JTG. Theory of the stability of lyophobic colloids. Amsterdam:Elsevier; 1948.
[4] Israelachvili J. Intermolecular and surface forces. London, New York: AcademicPress; 1992.
[5] Ivanov I, editor. Thin liquid films. Surfactant science seriesNew York: Marcel Dekker;1988.
[6] Exerowa D, Kruglyakov P. In: Miller R, Möbius D, editors. Foam and foam films. Stud-ies in interface science. Amsterdam: Elsevier; 1998.
[7] Scheludko A. Adv Colloid Interface Sci 1967;1:391.[8] Den Engelsen D, Frens G. J Chem Soc, Faraday Trans 1 1974;70:237.[9] Duyves ME. Thesis; 1961 [Utrecht].
Frankel P, Mysels K. J Appl Phys 1961;37:3725.[10] Prud'homme R, Kahn S. Foams. New York: Marcel Dekker; 1996.[11] LeNeveu DM, Rand RP, Parsegian VA. Nature 1976;259:601.[12] Marra J. J Colloid Interface Sci 1986;109:11.[13] Horn R. Biochim Biophys Acta 1984;778:224.[14] Horn R, Israelachvili J, Marra J, Parsegian V, Rand R. Biophys J 1988;54:1185.[15] Rand R, Parsegian V. Biochim Biophys Acta 1989;988:351.[16] Israelachvili J, Wennerstrom H. Langmuir 1990;6:873.[17] Mcintosch T, Magid A. Biophys J 1990;57:1187.[18] Yamanaka T, Hayashi M, Matuura R. J Colloid Interface Sci 1982;88:458.[19] Nikolova A, Exerowa D, Lalchev Z, Tsonev L. Eur Biophys J 1994;23:145.[20] Cohen R, Exerowa D, Kolarov T, Yamanaka T, Muller VM. Colloid Surf 1992;65:201.[21] Toca-Herrera JL, Müller H-J, Krustev R, Exerowa D, Möhwald H. Colloids Surf A
Physicochem Eng Asp 1998;144:319.[22] Toca-Herrera JL, Müller H-J, Krustev R, Pfohl T, Möhwald H. Colloids Surf A
Physicochem Eng Asp 1999;152:357.[23] Toca-Herrera JL, Müller H-J, Krustev R, Möhwald H. J Phys Chem B 2000;104:5486.[24] Toca-Herrera JL, Müller H-J, Krustev R, Möhwald H. Colloid Polym Sci 2000;278:771.[25] Brezesinski G, Müller H-J, Toca-HerreraJ L, Krustev R. Chem Phys Lipids 2001;110:
183.[26] Krasteva N, Krustev R, Müller H-J, Vollhardt D, Möhwald H. J Phys Chem B 2001;105:
1185.[27] Nikolova A, Kashchiev D, Exerowa D. Colloids Surf 1989;36:339.[28] Exerowa D, Kashchiev D, Platikanov D. Adv Colloid Interface Sci 1992;40:201.[29] Kashchiev D, Exerowa D. J Colloid Interface Sci 1998;203:146.[30] Möhwald H. Phospholipid monolayers in Handbook of Biological Physics. Structure
and dynamics of membranes, 1; 1995. p. 161.[31] Luzzati V, Tardieu A. Annu Rev Phys Chem 1974;25:79.[32] Seeling J, Seelig A. Q Rev Biophys 1980;13:19.[33] Möhwald H. Rep Prog Phys 1993;56:653.[34] Cevc G, Marsh D. Phospholipids bilayers. Chichester: Wiley; 1987.[35] Donners W, Rijnbout J, Vrij A. J Colloid Interface Sci 1977;60:540.[36] Chan R, Pashley M, White LR. J Colloid Interface Sci 1980;77:283.[37] Muruganathan RM, Krustev R, Müller H-J, Kolaric B, Klitzing Rv, Möhwald H.
Langmuir 2004;20:6352.[38] Marinova KG, Alargova R, Denkov N, Velev O, Petsev D, Ivanov I, et al. Langmuir
1996;12:2045.[39] Karraker KA, Radke CJ. Adv Colloid Interface Sci 2002;96:231.[40] Israelachvili J, Pashley R. Nature 1983;306:249.[41] Mysels KJ, Jones MN. Discuss Faraday Soc 1966;42:42.[42] De Feijter JA, Rijnbout JB, Vrij A. J Colloid Interface Sci 1978;64:258.[43] Kolarov T, Scheludko A, Exerowa D. Trans Faraday Soc 1968;64:2864.
Scheludko A, Radoev B, Kolarov T. Trans Faraday Soc 1968;64:2213.Grigorov L, Ivanov I, Kolarov T, Obreshkov K. Ann Univ Sofia Fac Chimie 1968;70:195.
[44] Krustev R, Müller H-J, Toca-Herrera JL. Colloid Polym Sci 1998;276:518.[45] Exerowa D, Nikolov A, Zacharieva M. J Colloid Interface Sci 1981;81:419.[46] Sackmann E. Science 1996;271:43.[47] Kasemo B. Surf Sci 2002;500:656.[48] Nikolova A, Koynova R, Tenchov B, Exerowa D. Chem Phys Lipids 1996;83:111.[49] Janiak M, Small D, Shipley G. Biochemistry 1976;15:4575.[50] The molecular probes handbook: a guide to fluorescent probes and labelling tech-
nologies; 1995.[51] Lalchev Z, Mackie A. Colloids Surf B Biointerfaces 1999;15:147.[52] Toca-Herrera JL, Klitzing Rv. Macromolecules 2002;35:2861.[53] Exerowa D, Kolarov T, Khristov Khr. Colloid Surf 1987;22:171.[54] Stouch T. Mol Simul 1993;10:335.[55] Berger O, Edholm O, Jähnig F. Biophys J 2002;72.[56] Crowe L, Crowe J, Rudolph A, Womersley C, Appel L. Arch Biochem Biophys
1985;242:240.[57] Crowem J, Crowe L, Jackson S. Arch Biochem Biophys 1983;220:477.[58] Hoekstra F, Crowe J, Crowe L, van Roekel T, Vermeer E. Plant Cell Environ 1992;15:
601.[59] Crow J, Hoekstra F, Crowe L. Annu Rev Physiol 1992;54:570.[60] Ashwood-Smith M. Ann N Y Acad Sci 1967;45.[61] Yu ZW, Quinn PC. Biosci Rep 1994;14:259.[62] Klemm WR. Alcohol 1990;7:44.[63] Klemm WR, Williams HJ. Alcohol 1996;13:133.[64] Komatsu H, Okada S. Biochim Biophys Acta 1995;1235:270.[65] Wohlfarth Ch. Static Dielectric Constants of Pure Liquids and Binary Liquid Mixtures.
Landolt-Borstein Group IV, vol. 6. Springer Verlag; 1991.[66] Krasteva N, Vollhardt D, Brezesinski G, Möhwald H. Langmuir 2001;17:1209.[67] Cuvillier N, Millet F, Petkova V, Nedyalkov M, Benattar JJ. Langmuir 2000;16:
5029.[68] Stöckle S, Blecua P, Möhwald H, Krastev R. Langmuir 2010;26:4865.