FNFG: A Story of goodwill - Columbia Universityme2417/FNFG - A Story of Goodwill.pdfThis premium was...
18
FNFG: A STORY OF GOODWILL BY: MICHAEL ELIAS (SEAS ’15) Stock: FNFG – Buy at $8.72, 3-Year Target Price: $12.17 Margin of Safety: 40% Thesis: First Niagara Financial Group is a regional bank that over- expanded in the landscape of the post-financial crisis to the effect of diluting shareholder value. Despite this over-expansion, there has been a greater overreaction on the part of shareholders, dumping the stock well below its intrinsic value. However, this value was not diluted, it was merely transferred to the “intangible” Goodwill account. When included in the tangible book value, the Bank trades at a 30% discount to its asset value. When conservative estimates of earnings are used over three years, the Bank trades at a 40% discount to its Intrinsic Value Michael Elias 2920 Broadway 2207 Lerner Hall Tel: 347-967-7550 Email: [email protected]
Transcript of FNFG: A Story of goodwill - Columbia Universityme2417/FNFG - A Story of Goodwill.pdfThis premium was...

FNFG: A STORY OF GOODWILL BY: MICHAEL ELIAS (SEAS ’15)
Stock: FNFG – Buy at $8.72, 3-Year Target Price: $12.17
Margin of Safety: 40%
Thesis: First Niagara Financial Group is a regional bank that over-
expanded in the landscape of the post-financial crisis to the effect of diluting
shareholder value. Despite this over-expansion, there has been a greater
overreaction on the part of shareholders, dumping the stock well below its
intrinsic value. However, this value was not diluted, it was merely
transferred to the “intangible” Goodwill account. When included in the
tangible book value, the Bank trades at a 30% discount to its asset value.
When conservative estimates of earnings are used over three years, the
Bank trades at a 40% discount to its Intrinsic Value
Michael Elias
2920 Broadway 2207 Lerner Hall
Tel: 347-967-7550
Email: [email protected]

TABLE OF CONTENTS
Table of Contents
Business Overview _______________________________________________________________________________________ 1
Commercial & Retail Banking ____________________________________________________________________________________1
Growth By Acquisition ____________________________________________________________________________________________1
Strong Core Deposits and Customer Relationships _____________________________________________________________1
High Quality Loan Portfolios _____________________________________________________________________________________1
Industry Overview _______________________________________________________________________________________ 2
The Pain of 2008 __________________________________________________________________________________________________2
Regulatory Reform ________________________________________________________________________________________________2
Nature Of Competition ____________________________________________________________________________________________2
Investment Thesis _______________________________________________________________________________________ 3
Aggressive Expansion Did Not Dilute Value; It Concealed Value _______________________________________________3
Goodwill: Is It Good At All? _______________________________________________________________________________________3
Value of Goodwill __________________________________________________________________________________________________3
Adjusted Tangible Book Value is Greater Than The Current Share Price by 30% ____________________________4
Three Year Price Target Price: $12.17 ___________________________________________________________________________4
Asset Reproduction Value _______________________________________________________________________________ 5
Analyzing The Reproduction Cost Of FNFG’s Assets ____________________________________________________________5
Cash _____________________________________________________________________________________________________________5
Commercial Loan Portfolio ____________________________________________________________________________________5
Consumer Loan Portfolio ______________________________________________________________________________________5
Inventory _______________________________________________________________________________________________________5
Plant, Property, and Equipment (PPE) ________________________________________________________________________5
Investment Securities __________________________________________________________________________________________6
Advances ________________________________________________________________________________________________________6
Goodwill ________________________________________________________________________________________________________6
Deposits & Other Assets _______________________________________________________________________________________7
Intangibles ______________________________________________________________________________________________________7
Liabilities _______________________________________________________________________________________________________7
TABLE OF CONTENTS
Summary ___________________________________________________________________________________________________________8
Earning Power Value ____________________________________________________________________________________ 9
Establishishing The Value of Expected Future Cash Flows _____________________________________________________9
Net Income ______________________________________________________________________________________________________9
Future Dividends _______________________________________________________________________________________________9
Present Value of Future Cash Flows ________________________________________________________________________ 10
Catalysts for Growth ____________________________________________________________________________________ 11
Improving Net Interest Margin _________________________________________________________________________________ 11
Improving Macro Outlook ______________________________________________________________________________________ 11
Insider Buying ___________________________________________________________________________________________________ 11
Higher Core Deposits Responsible for Greater Revenue _____________________________________________________ 11
Summary ________________________________________________________________________________________________ 12
Misunderstood __________________________________________________________________________________________________ 12
Undervalued _____________________________________________________________________________________________________ 12
Out of Favor ______________________________________________________________________________________________________ 12
Appendix ________________________________________________________________________________________________ 14
Goodwill Analysis: Acquisition _________________________________________________________________________________ 14
Goodwill Analysis: Sales and Divestitures _____________________________________________________________________ 15
FIRST NIAGARA FINANCIAL GROUP
Page 1
Business Overview
COMMERCIAL & RETAIL BANKING
First Niagara Financial Group, Inc. is a regional bank holding company operating in the Mid-Atlantic, with a
geographic footprint reaching across New York, Pennsylvania, Connecticut, and Western Massachusetts.
Through FNFG’s wholly-owned bank subsidiary, First Niagara Bank, N.A. (‘the Bank’ from henceforth), the
Bank provides a range of retail and commercial banking, as well as other financial services. The Bank provides
its retail consumer and business customers with banking services, including residential and commercial real
estate loans, commercial business loans, consumer loans, wealth management products, as well as retail and
commercial deposit products. As of December 31, 2013, the Bank had $26.7 billion of deposits, $37.6 billion
dollars in assets held throughout 421 full service branches.
GROWTH BY ACQUISITION
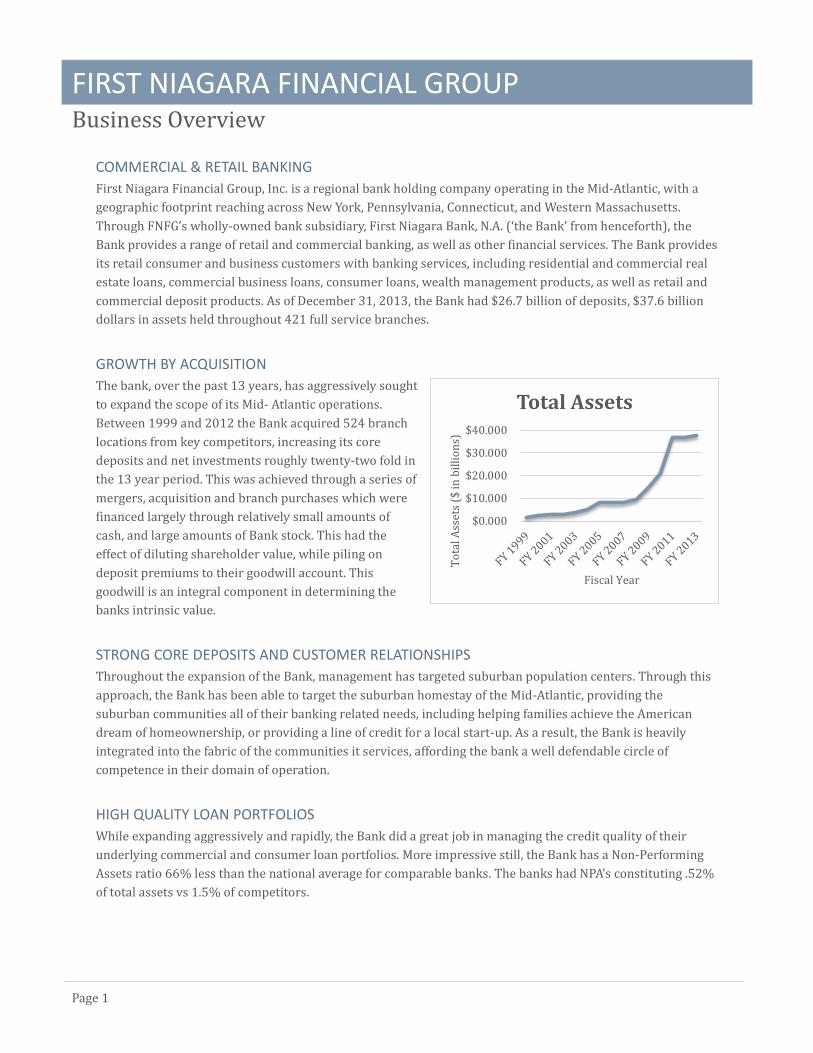
The bank, over the past 13 years, has aggressively sought
to expand the scope of its Mid- Atlantic operations.
Between 1999 and 2012 the Bank acquired 524 branch
locations from key competitors, increasing its core
deposits and net investments roughly twenty-two fold in
the 13 year period. This was achieved through a series of
mergers, acquisition and branch purchases which were
financed largely through relatively small amounts of
cash, and large amounts of Bank stock. This had the
effect of diluting shareholder value, while piling on
deposit premiums to their goodwill account. This
goodwill is an integral component in determining the
banks intrinsic value.
STRONG CORE DEPOSITS AND CUSTOMER RELATIONSHIPS
Throughout the expansion of the Bank, management has targeted suburban population centers. Through this
approach, the Bank has been able to target the suburban homestay of the Mid-Atlantic, providing the
suburban communities all of their banking related needs, including helping families achieve the American
dream of homeownership, or providing a line of credit for a local start-up. As a result, the Bank is heavily
integrated into the fabric of the communities it services, affording the bank a well defendable circle of
competence in their domain of operation.
HIGH QUALITY LOAN PORTFOLIOS
While expanding aggressively and rapidly, the Bank did a great job in managing the credit quality of their
underlying commercial and consumer loan portfolios. More impressive still, the Bank has a Non-Performing
Assets ratio 66% less than the national average for comparable banks. The banks had NPA’s constituting .52%
of total assets vs 1.5% of competitors.
$0.000
$10.000
$20.000
$30.000
$40.000
To
tal A
sset
s ($
in b
illi
on
s)
Fiscal Year
Total Assets
FIRST NIAGARA FINANCIAL GROUP
Page 2
Industry Overview
THE PAIN OF 2008
In the aftermath of the undoubted malfeasance on the part of bankers and underwriters that caused the
Financial Crisis of 2008, many investors have been turned off from banks, having taken excruciating losses on
their positions. Others, including with mainstream America, have persecuted the banks for their greed and
lack of remorse. When juxtaposed, these truths have the effect of leaving many financial institutions
undervalued in the absence of investors. If there is anything we learn in the aftermath of 2008, it is that a
healthy banking system, which properly facilitates the flow of credit, is the cornerstone of the market
economy. The absence of which leads to the breakdown of life as we know it. As a result, the undervaluation of
a sector that is essential to life as we know it represents an opportunity to finding value.
REGULATORY REFORM
One reason why the banking sector has remained undervalued since the financial crisis, has been uncertainty
regarding the future earning power of financial institutions as consequence of the regulatory reform imposed
since the financial crisis. The Dodd–Frank Wall Street Reform and Consumer Protection Act, has enacted
innumerous regulations on the way that banks conduct business, most directly relating to what depository
banks can and cannot do. For this reason, there is a great potential for income streams once treasured by
banks to disappear. The bulk of these rules relate to “Systemically Important Financial Institutions”,
constituting banks with over $50 billion in assets. First Niagara, with $37 billion dollars in assets, has been
spared from any material changes to their business as a result of the new regulations. For this reason, we can
assume with a relative degree of certainty that that the earnings of the bank will remain materially unchanged
until the $50 billion mark is reached.
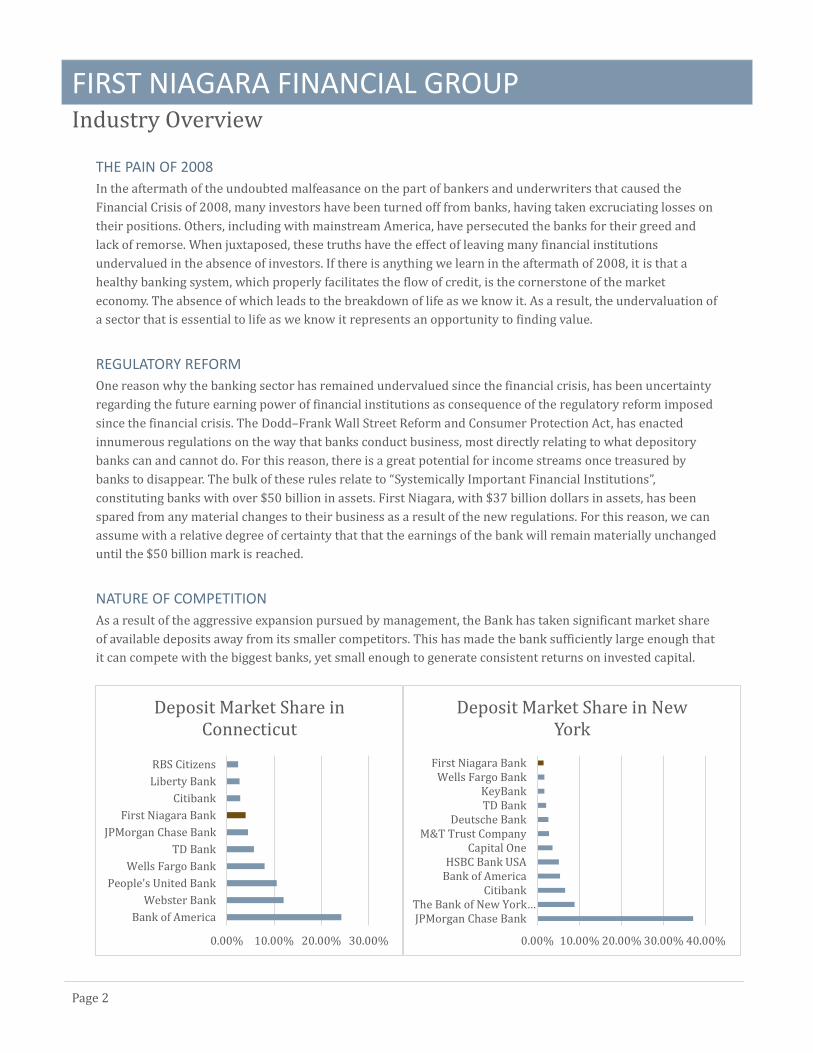
NATURE OF COMPETITION
As a result of the aggressive expansion pursued by management, the Bank has taken significant market share
of available deposits away from its smaller competitors. This has made the bank sufficiently large enough that
it can compete with the biggest banks, yet small enough to generate consistent returns on invested capital.
0.00% 10.00% 20.00% 30.00% 40.00%
JPMorgan Chase BankThe Bank of New York…
CitibankBank of AmericaHSBC Bank USA
Capital OneM&T Trust Company
Deutsche BankTD BankKeyBank
Wells Fargo BankFirst Niagara Bank
Deposit Market Share in New York
0.00% 10.00% 20.00% 30.00%
Bank of America
Webster Bank
People's United Bank
Wells Fargo Bank
TD Bank
JPMorgan Chase Bank
First Niagara Bank
Citibank
Liberty Bank
RBS Citizens
Deposit Market Share in Connecticut
FIRST NIAGARA FINANCIAL GROUP
Page 3
Investment Thesis
AGGRESSIVE EXPANSION DID NOT DILUTE VALUE; IT CONCEALED VALUE
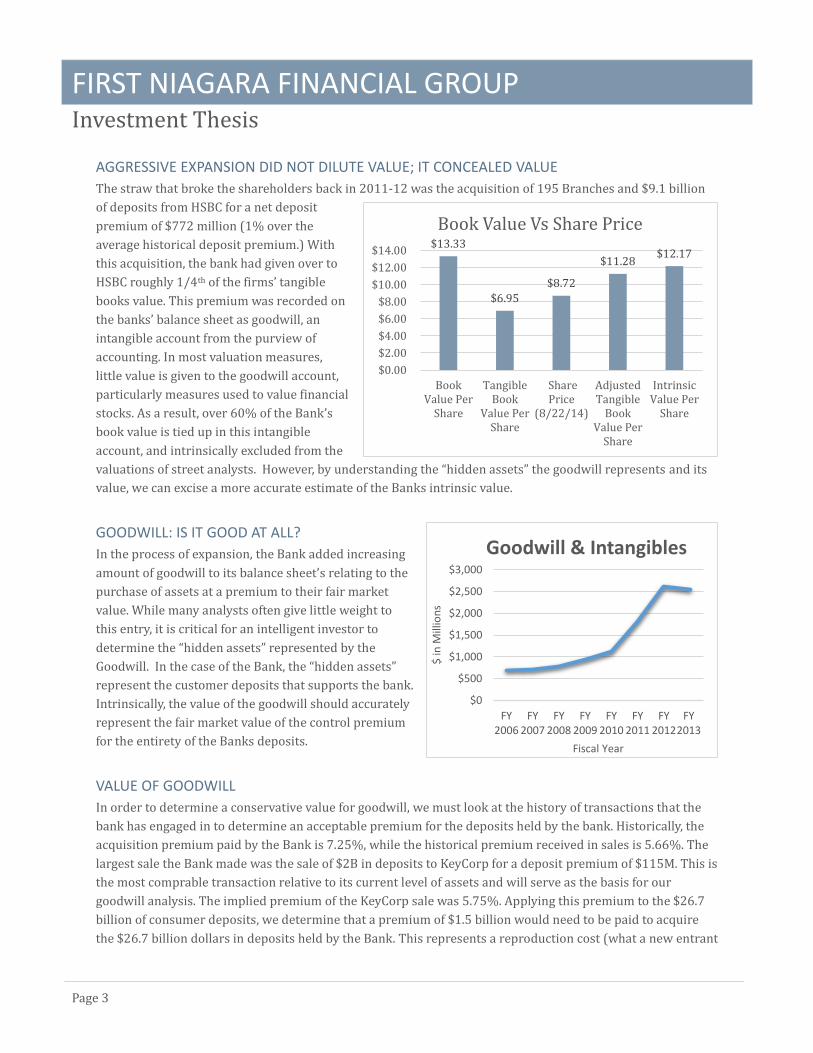
The straw that broke the shareholders back in 2011-12 was the acquisition of 195 Branches and $9.1 billion
of deposits from HSBC for a net deposit
premium of $772 million (1% over the
average historical deposit premium.) With
this acquisition, the bank had given over to
HSBC roughly 1/4th of the firms’ tangible
books value. This premium was recorded on
the banks’ balance sheet as goodwill, an
intangible account from the purview of
accounting. In most valuation measures,
little value is given to the goodwill account,
particularly measures used to value financial
stocks. As a result, over 60% of the Bank’s
book value is tied up in this intangible
account, and intrinsically excluded from the
valuations of street analysts. However, by understanding the “hidden assets” the goodwill represents and its
value, we can excise a more accurate estimate of the Banks intrinsic value.
GOODWILL: IS IT GOOD AT ALL?
In the process of expansion, the Bank added increasing
amount of goodwill to its balance sheet’s relating to the
purchase of assets at a premium to their fair market
value. While many analysts often give little weight to
this entry, it is critical for an intelligent investor to
determine the “hidden assets” represented by the
Goodwill. In the case of the Bank, the “hidden assets”
represent the customer deposits that supports the bank.
Intrinsically, the value of the goodwill should accurately
represent the fair market value of the control premium
for the entirety of the Banks deposits.
VALUE OF GOODWILL
In order to determine a conservative value for goodwill, we must look at the history of transactions that the
bank has engaged in to determine an acceptable premium for the deposits held by the bank. Historically, the
acquisition premium paid by the Bank is 7.25%, while the historical premium received in sales is 5.66%. The
largest sale the Bank made was the sale of $2B in deposits to KeyCorp for a deposit premium of $115M. This is
the most comprable transaction relative to its current level of assets and will serve as the basis for our
goodwill analysis. The implied premium of the KeyCorp sale was 5.75%. Applying this premium to the $26.7
billion of consumer deposits, we determine that a premium of $1.5 billion would need to be paid to acquire
the $26.7 billion dollars in deposits held by the Bank. This represents a reproduction cost (what a new entrant
$0
$500
$1,000
$1,500
$2,000
$2,500
$3,000
FY2006
FY2007
FY2008
FY2009
FY2010
FY2011
FY2012
FY2013
$ in
Mill
ion
s
Fiscal Year
Goodwill & Intangibles
$13.33
$6.95
$8.72
$11.28$12.17
$0.00
$2.00
$4.00
$6.00
$8.00
$10.00
$12.00
$14.00
BookValue Per
Share
TangibleBook
Value PerShare
SharePrice
(8/22/14)
AdjustedTangible
BookValue Per
Share
IntrinsicValue Per
Share
Book Value Vs Share Price

FIRST NIAGARA FINANCIAL GROUP
Page 4
would have to pay to replicate the Bank’s current business) of roughly 61.7% of the goodwill account. This
value must be added back to the tangible book value of assets in order to more accurately determine the value
of shareholder equity.
ADJUSTED TANGIBLE BOOK VALUE IS GREATER THAN THE CURRENT SHARE PRICE BY 30%
After determining the reproduction costs of both the assets and liabilities of the Bank, we see the Bank trades
at a 30% discount to its asset value. In the graph below, you can see that the Bank has been trading below its
adjusted tangible book value. This provides an investor the opportunity to get cheap access to a bank
operating 1% below its long-term profitability as a result of historical low interest rates.
THREE YEAR PRICE TARGET PRICE: $12.17
Once we have determined the asset value, the next step is determining the value of the earnings. In order to
remain conservative in our valuation, we assume the revenue stream remains constant and operating margins
remain about the same. This is to prevent wild ambition on the part of future, uncertain earnings.
Understanding that the money the Bank returns to its shareholders come primarily in the form of dividends,
we can conservatively project the present value of expected future dividends. Over a three year holding
period, we would hold the Banks shares until the full adjusted tangible book value is realized, while
accumulating dividends along the way for our patience. In addition to the catalyst for growth on the part of an
improving net interest margin, the Bank represents a value opportunity hidden in plain sight, ready to return
to its historic price of $12-15 per share.
FY2013 FY2014* FY2015* FY2016*
Net Income Growth 75.18% 1.02% 1.02% 1.02%
Net Income $295.00 $299.77 $304.41 $309.12
Dividend Payout Ratio (Common Shares) 38.37% 38.37% 38.37% 38.37%
Dividend Payments (Common Shares) $113.20 $115.03 $116.81 $118.62
Present Value of Future Dividends N/A $108.52 $103.96 $99.59
Discount Rate 6%
Present Value of Future Dividends $312.08
Adjusted Tangible Book Value $3,975.61
ATBV + Expected Future Dividends $4,287.69
Shares Outstanding 352.4
Intrinsic Value Per Share $12.17
FIRST NIAGARA FINANCIAL GROUP
Page 5
Asset Reproduction Value
ANALYZING THE REPRODUCTION COST OF FNFG’S ASSETS
To determine an appropriate value for the net assets of First Niagara Financial Group, we must analyze the
reproduction cost of their balance sheet. Working our way down the balance sheet, we find the cost pursuant
to a newcomer to the market, if they were to replicate FNFG’s positions identically.
Cash
A new entrant would be forced to pay 100% for the cash account of the business
Commercial Loan Portfolio
In the past, the Bank has sold a small subsections of their commercial loan portfolio, comparable to their
entire commercial loan portfolio. The portfolio was sold at 99.64% of book value. Historically, commercial
portfolios can fetch anywhere between 98-102% of book value when sold. This is determined by many factors
including percentage on non-performing assets (NPA) in the portfolio, as well as the underwriting standards
utilized in constructing the portfolio. Concordant with Graham’s approach, we will assume the newcomer will
can acquire the loan portfolio at the low end of the spectrum, at 98% of book value.
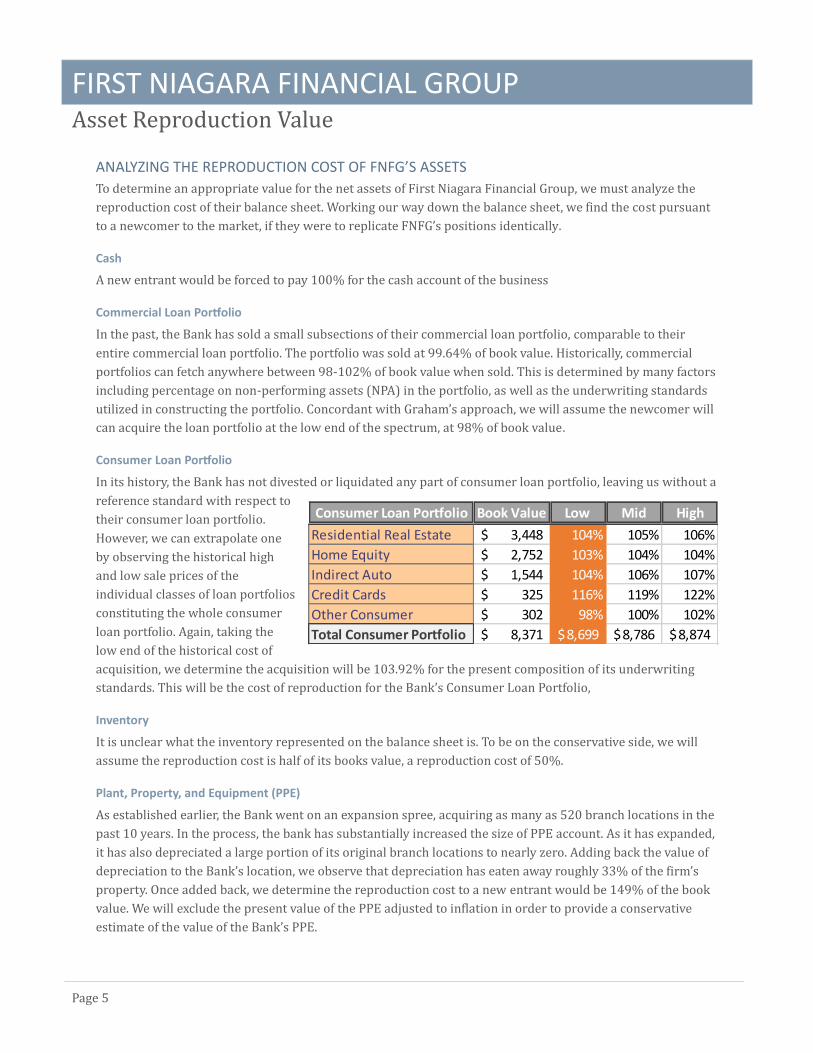
Consumer Loan Portfolio
In its history, the Bank has not divested or liquidated any part of consumer loan portfolio, leaving us without a
reference standard with respect to
their consumer loan portfolio.
However, we can extrapolate one
by observing the historical high
and low sale prices of the
individual classes of loan portfolios
constituting the whole consumer
loan portfolio. Again, taking the
low end of the historical cost of
acquisition, we determine the acquisition will be 103.92% for the present composition of its underwriting
standards. This will be the cost of reproduction for the Bank’s Consumer Loan Portfolio,
Inventory
It is unclear what the inventory represented on the balance sheet is. To be on the conservative side, we will
assume the reproduction cost is half of its books value, a reproduction cost of 50%.
Plant, Property, and Equipment (PPE)
As established earlier, the Bank went on an expansion spree, acquiring as many as 520 branch locations in the
past 10 years. In the process, the bank has substantially increased the size of PPE account. As it has expanded,
it has also depreciated a large portion of its original branch locations to nearly zero. Adding back the value of
depreciation to the Bank’s location, we observe that depreciation has eaten away roughly 33% of the firm’s
property. Once added back, we determine the reproduction cost to a new entrant would be 149% of the book
value. We will exclude the present value of the PPE adjusted to inflation in order to provide a conservative
estimate of the value of the Bank’s PPE.
Consumer Loan Portfolio Book Value Low Mid High
Residential Real Estate 3,448$ 104% 105% 106%
Home Equity 2,752$ 103% 104% 104%
Indirect Auto 1,544$ 104% 106% 107%
Credit Cards 325$ 116% 119% 122%
Other Consumer 302$ 98% 100% 102%
Total Consumer Portfolio 8,371$ 8,699$ 8,786$ 8,874$
FIRST NIAGARA FINANCIAL GROUP
Page 6
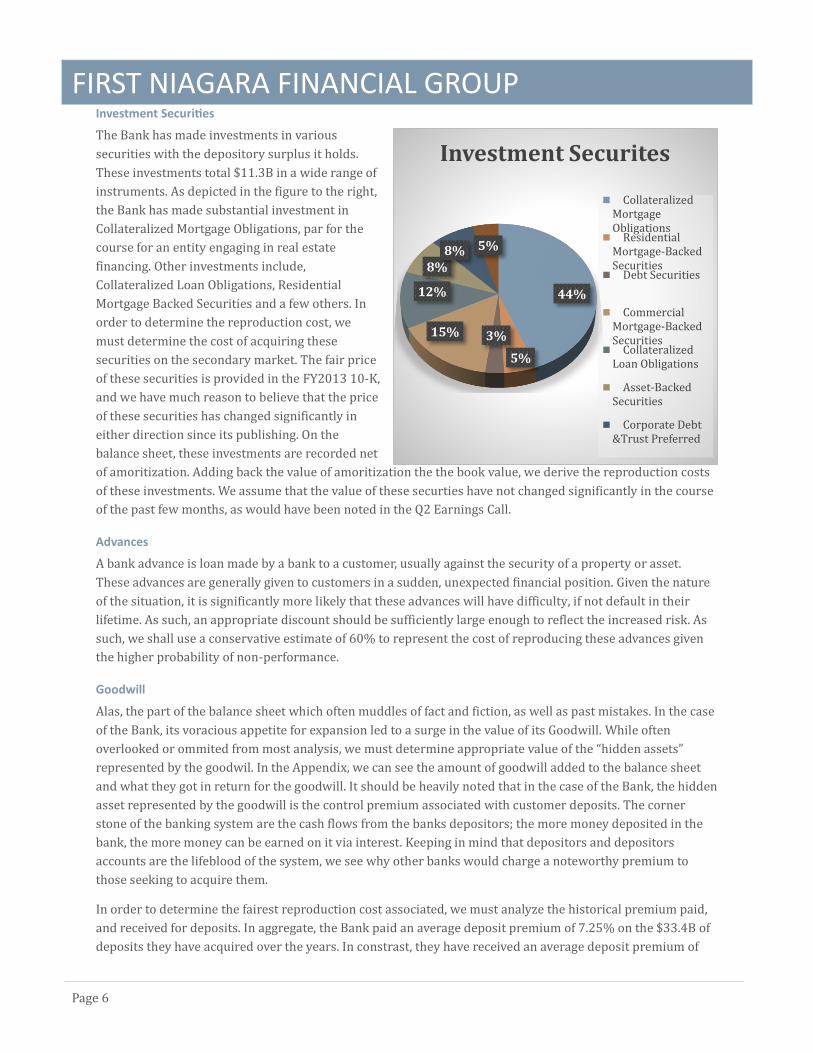
Investment Securities
The Bank has made investments in various
securities with the depository surplus it holds.
These investments total $11.3B in a wide range of
instruments. As depicted in the figure to the right,
the Bank has made substantial investment in
Collateralized Mortgage Obligations, par for the
course for an entity engaging in real estate
financing. Other investments include,
Collateralized Loan Obligations, Residential
Mortgage Backed Securities and a few others. In
order to determine the reproduction cost, we
must determine the cost of acquiring these
securities on the secondary market. The fair price
of these securities is provided in the FY2013 10-K,
and we have much reason to believe that the price
of these securities has changed significantly in
either direction since its publishing. On the
balance sheet, these investments are recorded net
of amoritization. Adding back the value of amoritization the the book value, we derive the reproduction costs
of these investments. We assume that the value of these securties have not changed significantly in the course
of the past few months, as would have been noted in the Q2 Earnings Call.
Advances
A bank advance is loan made by a bank to a customer, usually against the security of a property or asset.
These advances are generally given to customers in a sudden, unexpected financial position. Given the nature
of the situation, it is significantly more likely that these advances will have difficulty, if not default in their
lifetime. As such, an appropriate discount should be sufficiently large enough to reflect the increased risk. As
such, we shall use a conservative estimate of 60% to represent the cost of reproducing these advances given
the higher probability of non-performance.
Goodwill
Alas, the part of the balance sheet which often muddles of fact and fiction, as well as past mistakes. In the case
of the Bank, its voracious appetite for expansion led to a surge in the value of its Goodwill. While often
overlooked or ommited from most analysis, we must determine appropriate value of the “hidden assets”
represented by the goodwil. In the Appendix, we can see the amount of goodwill added to the balance sheet
and what they got in return for the goodwill. It should be heavily noted that in the case of the Bank, the hidden
asset represented by the goodwill is the control premium associated with customer deposits. The corner
stone of the banking system are the cash flows from the banks depositors; the more money deposited in the
bank, the more money can be earned on it via interest. Keeping in mind that depositors and depositors
accounts are the lifeblood of the system, we see why other banks would charge a noteworthy premium to
those seeking to acquire them.
In order to determine the fairest reproduction cost associated, we must analyze the historical premium paid,
and received for deposits. In aggregate, the Bank paid an average deposit premium of 7.25% on the $33.4B of
deposits they have acquired over the years. In constrast, they have received an average deposit premium of
44%
5%
3%15%
12%
8%8% 5%
Investment Securites
CollateralizedMortgageObligations ResidentialMortgage-BackedSecurities Debt Securities
CommercialMortgage-BackedSecurities CollateralizedLoan Obligations
Asset-BackedSecurities
Corporate Debt&Trust Preferred
FIRST NIAGARA FINANCIAL GROUP
Page 7
5.66% on the $3.3B of deposits they have sold to competitors. We will assume a 5.66% control premium for
the deposits on the current $26.7B in customer deposits. The cost pursuant to a newcomer into the market to
acquire the Banks depositis, as well as the value of the Bank’s goodwill is $1.51B, roughly 61% of the Bank’s
recorded goodwill. Adding this amount back to the tangible book value translates into the Bank trading at a
30% discount to its book value, making it an exceptional opportunity both in the case of liquidation, but even
more so as a going concern.
Deposits & Other Assets
We assume that a new entrant must replicate the entirety of the Bank’s core deposits, translating into a
reproduction cost of 100%.
Intangibles
We are giving zero value to the intangibles of the bank including consumer lists, brand value and other human
capital. As consequence, we assume a reproduction cost of 0%.
Liabilities
We are assuming the new entrant must pay the full reproduction cost of the banks liabilities which constitute
the deposits of its customers, a small percentage of debt, relative to the entire capital structure (D/E ≈ .2), as
well as it’s notes payable to suppliers. This represents a reproduction cost of 100% for the firms’ liabilities.

FIRST NIAGARA FINANCIAL GROUP
Page 8
SUMMARY
$ in MM
Reproduction Cost Reproduction Value FY 2013
Cash 100% $463 $463 Marketable Securities
Commercial Loan Portfolio 98% $12,601.82 $12,859.00 Consumer Loan Portfolio
Real Estate 104% $3,586 $3,448 Home Equity 103% $2,835 $2,752 Indirect Auto 104% $1,606 $1,544 Credit Cards 116% $377 $325 Other Consumer Loans 98% $296 $302 Inventory 50% $25 $50 Notes Receivable $0 Other Current Assets $0
Total Current Assets 100.21% $21,789 $21,743
Net PPE 149% $623 $418 Investment Securities
Collateralized Mortgage Obligations 98% $4,882 $4,985 Residential Mortgage-Backed Securities 101% $578 $574 Debt Securities 102% $338 $332 Commercial Mortgage-Backed Securities 104% $1,831 $1,759 Collateralized Loan Obligations 103% $1,431 $1,392 Asset-Backed Securities 101% $905 $896 Corporate Debt &Trust Preferred 101% $872 $863 States & Political Subdivisions 103% $529 $516 Other Non-Current Assets 100% $45 $45 Advances 50% $286.50 $573 Deferred Charges $0 Goodwill 61.7% $1,512 $2,449 Other Intangibles 0% $0 $94 Deposits & Other Assets 100% $989 $989
TOTAL ASSETS 97.30% $36,611 $37,628
Notes Payable 100% $4,822 $4,822 Accounts Payable 100% $26,665 $26,665 Current Portion of Long Term Debt $0 Current Portion of Long Term Debt $0 Accrued Expenses $0 Income Taxes Payable $0 Other Current Liabilities $0
Total Current Liabilities 100% $31,487 $31,487
Deferred Charges (Taxes/Income) $0 Convertible Debt $0 Long Term Debt 100% $734.00 $734 Non-Current Current Capital Leases $0 Other Long Term Liabilities 100% $414.00 $414 Minority Interest (liabilities) $0
Total Liabilities 100% $32,635 $32,635
Tangible Book Value $2,450
Tangible Book Value Per Share $6.95
Average Share Price $8.18
Adjusted Tangible Book Value Per Share $11.28
Adjusted Tangible Book Value $3,975.61

FIRST NIAGARA FINANCIAL GROUP
Page 9
Earning Power Value
ESTABLISHISHING THE VALUE OF EXPECTED FUTURE CASH FLOWS
Having established an adjusted tangible book value for the Bank, we must shift our focus to determining the
value of the cash flows expected from the Bank over the duration of our holding period of 3 years. The bank
distributes part of its net income back to shareholders in the form of dividends. In order to project
conservatively the value of these future cash flows, we must conservatively project the value of the Bank’s Net
Income
Net Income
As the bank expanded in the landscape of the post-financial crisis, it saw the size of its asset base increase
sizably. Intrinsically, the net income of the firm has increased nearly 300% throughout its expansion.
However, this increase in net income came at the
expense of a lower net income margin
throughout the expansion process. It was not
until 2013 that the net income reached a new
equillibrium given the new level of assets (the
Bank had a large non-recurring expense relating
to its HSBC branch acquisition in FY2012.) In
FY2013, the Bank had a net profit margin of
18.72%, slightly higher than their historical
average of 15%. Given the scale of their
expansion, we will assume that they will be able
to sustain this margin as a result of their larger
asset base. We will assume that Net Income
grows at roughly 1% a year, as depicted in
forward projections of net income supplied
above. This assumes that the net income stream grows at the same rate as the Bank’s return on assets,
roughly 1%. With this conservative assumption, we can calculate the value of future dividend we can expect to
receive.
Future Dividends
For a company that appears to be in financial
distress, as observed by the share price, the bank
has paid exceptionally high percentages of its net
income out to shareholders. In 2013, at the end of
its expansion phase, the Bank offered a dividend
payout ratio of 38%, returning $113M to its
common shareholders. This is well below the
historical payout ratio and can serve as a means of
conservatively estimating future dividends.
Assuming the low end of the historical dividend
payout ratio, we can conservatively calculate the
future value of expected dividends.
$0.00
$50.00
$100.00
$150.00
$200.00
$250.00
$300.00
$350.00$
in M
M
Fiscal Year
Net Income
0%20%40%60%80%
100%120%140%
% o
f N
et I
nco
me
Fiscal Year
Dividend Payout Ratio
FIRST NIAGARA FINANCIAL GROUP
Page 10
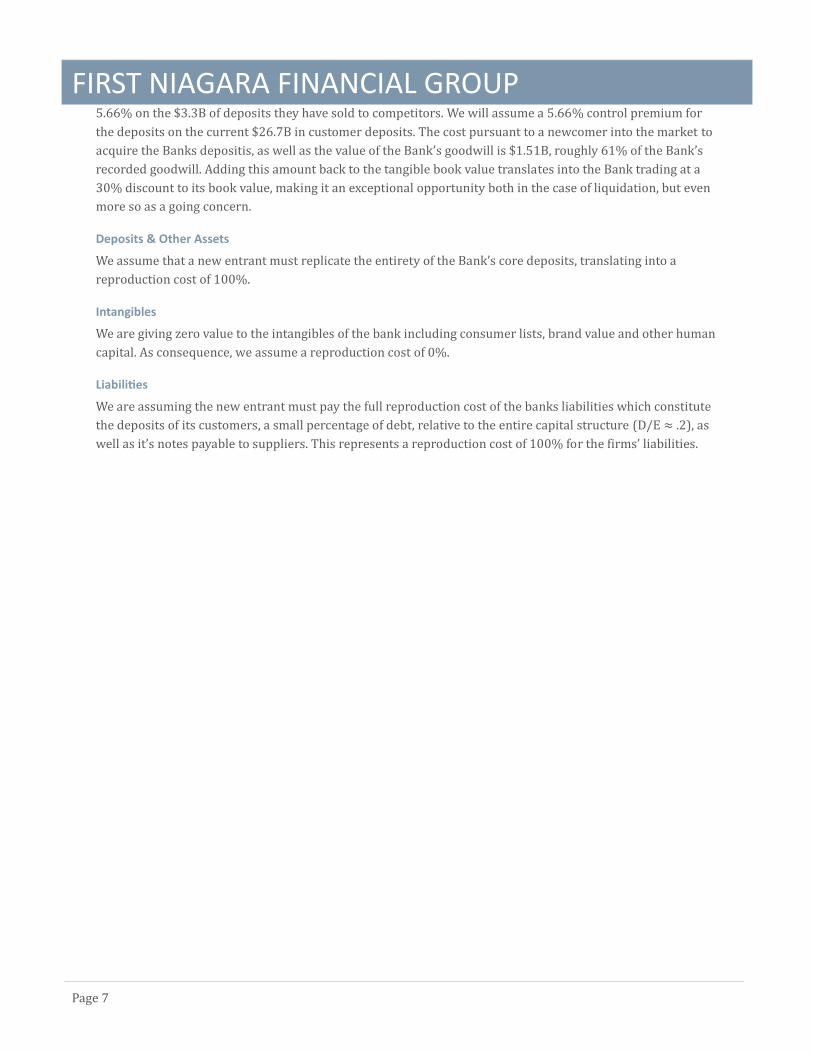
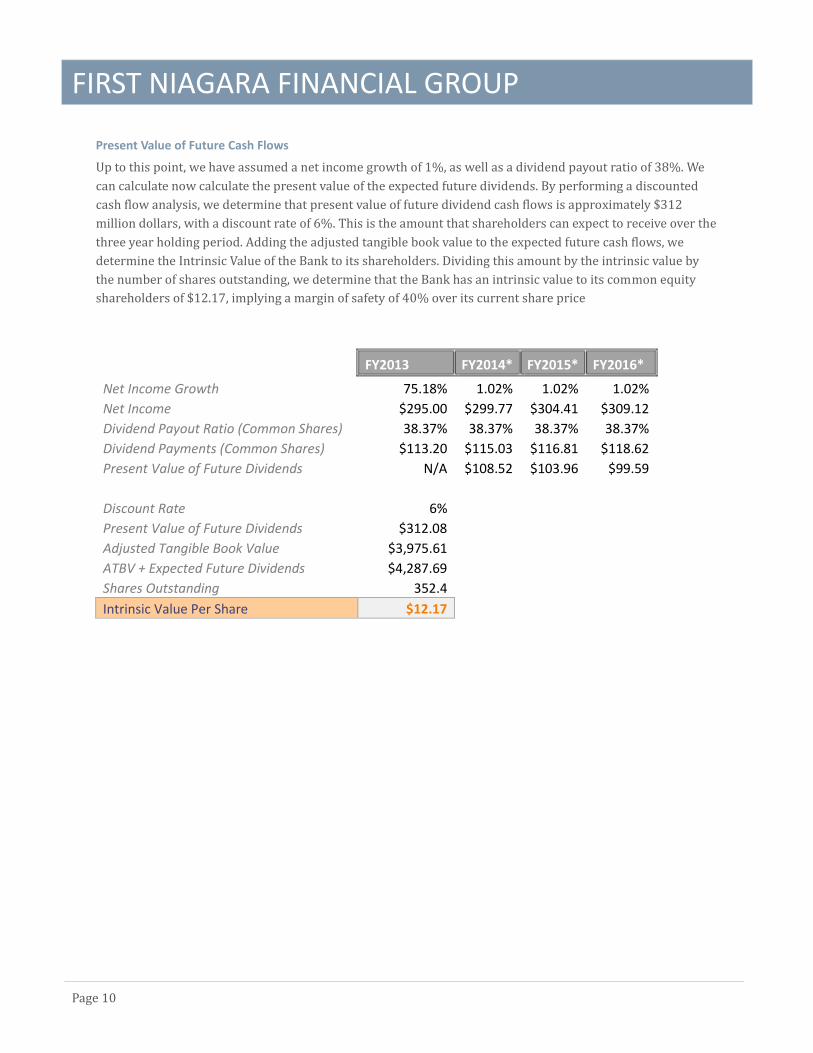
Present Value of Future Cash Flows
Up to this point, we have assumed a net income growth of 1%, as well as a dividend payout ratio of 38%. We
can calculate now calculate the present value of the expected future dividends. By performing a discounted
cash flow analysis, we determine that present value of future dividend cash flows is approximately $312
million dollars, with a discount rate of 6%. This is the amount that shareholders can expect to receive over the
three year holding period. Adding the adjusted tangible book value to the expected future cash flows, we
determine the Intrinsic Value of the Bank to its shareholders. Dividing this amount by the intrinsic value by
the number of shares outstanding, we determine that the Bank has an intrinsic value to its common equity
shareholders of $12.17, implying a margin of safety of 40% over its current share price
FY2013 FY2014* FY2015* FY2016*
Net Income Growth 75.18% 1.02% 1.02% 1.02%
Net Income $295.00 $299.77 $304.41 $309.12
Dividend Payout Ratio (Common Shares) 38.37% 38.37% 38.37% 38.37%
Dividend Payments (Common Shares) $113.20 $115.03 $116.81 $118.62
Present Value of Future Dividends N/A $108.52 $103.96 $99.59
Discount Rate 6%
Present Value of Future Dividends $312.08
Adjusted Tangible Book Value $3,975.61
ATBV + Expected Future Dividends $4,287.69
Shares Outstanding 352.4
Intrinsic Value Per Share $12.17
FIRST NIAGARA FINANCIAL GROUP
Page 11
Catalysts for Growth
In our analysis, we have given almost zero value to growth opportunities. This is because a bird in the hand is
certainly worth more than two in the bush. In our valuation, it is imperative that we restrict our assumptions
regarding the future, less certain cash flows. By giving zero value to growth, we are getting all of the catalysts
for growth for free. This provides an investor the opportunity to get cheap access to a bank operating 1%
below its long-term profitability as a result of historical low interest rates.
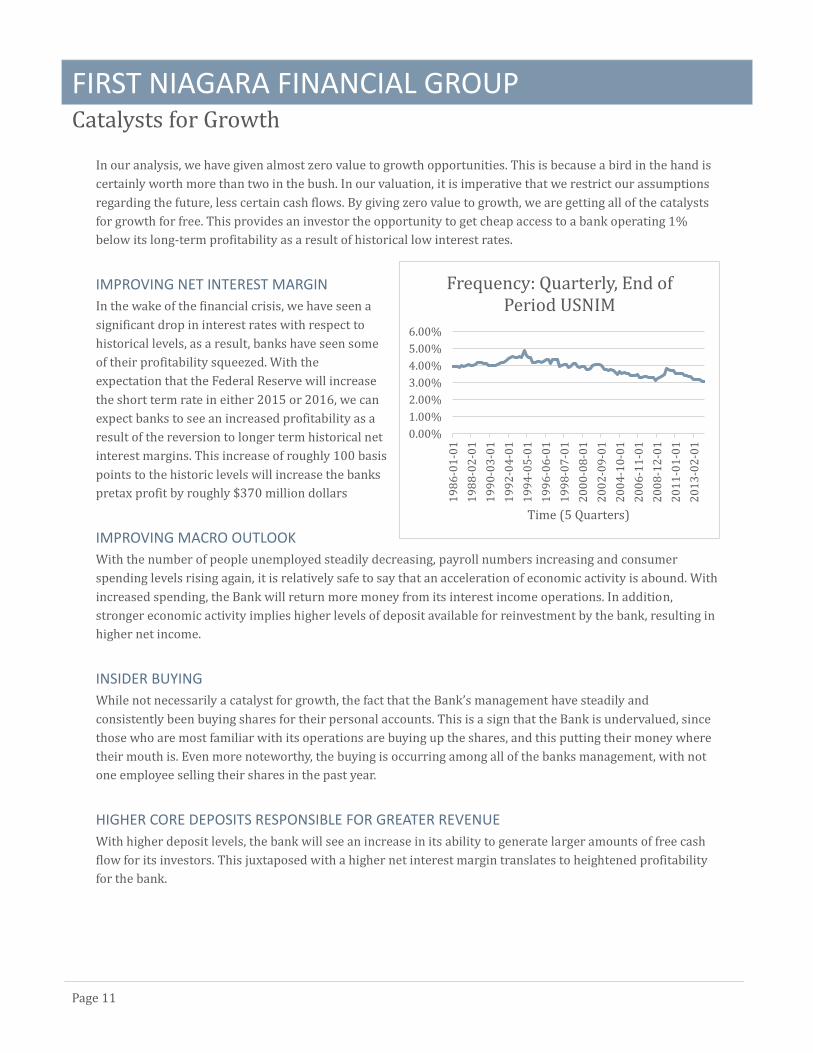
IMPROVING NET INTEREST MARGIN
In the wake of the financial crisis, we have seen a
significant drop in interest rates with respect to
historical levels, as a result, banks have seen some
of their profitability squeezed. With the
expectation that the Federal Reserve will increase
the short term rate in either 2015 or 2016, we can
expect banks to see an increased profitability as a
result of the reversion to longer term historical net
interest margins. This increase of roughly 100 basis
points to the historic levels will increase the banks
pretax profit by roughly $370 million dollars
IMPROVING MACRO OUTLOOK
With the number of people unemployed steadily decreasing, payroll numbers increasing and consumer
spending levels rising again, it is relatively safe to say that an acceleration of economic activity is abound. With
increased spending, the Bank will return more money from its interest income operations. In addition,
stronger economic activity implies higher levels of deposit available for reinvestment by the bank, resulting in
higher net income.
INSIDER BUYING
While not necessarily a catalyst for growth, the fact that the Bank’s management have steadily and
consistently been buying shares for their personal accounts. This is a sign that the Bank is undervalued, since
those who are most familiar with its operations are buying up the shares, and this putting their money where
their mouth is. Even more noteworthy, the buying is occurring among all of the banks management, with not
one employee selling their shares in the past year.
HIGHER CORE DEPOSITS RESPONSIBLE FOR GREATER REVENUE
With higher deposit levels, the bank will see an increase in its ability to generate larger amounts of free cash
flow for its investors. This juxtaposed with a higher net interest margin translates to heightened profitability
for the bank.
0.00%
1.00%
2.00%
3.00%
4.00%
5.00%
6.00%
19
86
-01
-01
19
88
-02
-01
19
90
-03
-01
19
92
-04
-01
19
94
-05
-01
19
96
-06
-01
19
98
-07
-01
20
00
-08
-01
20
02
-09
-01
20
04
-10
-01
20
06
-11
-01
20
08
-12
-01
20
11
-01
-01
20
13
-02
-01
Time (5 Quarters)
Frequency: Quarterly, End of Period USNIM

FIRST NIAGARA FINANCIAL GROUP
Page 12
Summary
The history of capital markets are littered with undervalued securities that became so by virtue of human
misjudgments. The story of First Niagara Financial Group is one that shares much in common with these
securities. The three
following phrases adequately
represent the manner in
which this opportunity would
be attractive to an investor
seeking value.
MISUNDERSTOOD
After sailing through the
turbulent vicissitudes of the
financial crisis, the Bank
capitalized on their healthy
position by expanding the
breadth of their operation into an adjacent geographical region (Pennsylvania) as well as strengthening their
hold on their primary market of operation, New York and Connecticut. After three profitable acquisitions, the
Bank paid above 1% of the average premium in an effort to acquire $9B in deposits from HSBC USA Inc. in late
2011. Investors at the time, thought this was a foolish transaction and a sell off ensued. Under pressure from
the remaining shareholders, CEO John Koelmel, who had led the expansion, resigned after holding out for over
a year. During that year, the stock reached record lows. After an interim CEO, Gary Crosby, was announced as
they underwent the search process for a new CEO. The stock surged on hopes of the Bank installing more
“competent” management. Later the Bank announced that Crosby would remain CEO, giving explicit forward
guidance, stating “We’re out of the (mergers and acquisitions) business and we’re going to focus on the
business that we have built over the last handful of years and building long-term shareholder value out of that
business.” With their expanded pool of assets, and new management, the Bank is poised to have a long career
of providing financing to its communities.
UNDERVALUED
While the HSBC transaction did come at the cost of reducing the Bank’s tangible book value, it did not destroy
value you as shareholders wrongly assumed, it merely concealed it in a place that most equity analysts,
bankers and traders would never bother to look, the Goodwill account. Once it is realized that the value of the
goodwill represents the control premium on deposits in their vaults, the stock price will more accurately
reflect its intrinsic value. The Banks asset value alone surpasses the current stock price by 30%, without
including the value of earnings and growth. This provides a sufficient margin of safety in the net assets great
enough to protect the investor from loses in the case of liquidation (low debt in capital structure)
OUT OF FAVOR
In the fallout associated with the financial crisis, many investors with exposure to banks experienced
unprecedented losses. As consequence, banks and other financial service providers have been undervalued on
the whole since 2008. The reason lies in the uncertain future earning power of banks in the face of regulatory

FIRST NIAGARA FINANCIAL GROUP
Page 13
reform pursuant to the Dodd–Frank Wall Street Reform and Consumer Protection Act. With some regulations
still being developed and others still not enforced, it is unclear what the affect will be to banks. Luckily, the
Bank is spared from many of the regulations enacted by Dodd-Frank, since the bank does not have the
requisite $50B in assets to be considered a “Systemically Important Financial Institution.” The largest impact
of the regulations comes in the ability of the bank to purchase certain types of asset-backed securities, which
constitute less than 3% of the Bank’s investment portfolio.

FIRST NIAGARA FINANCIAL GROUP
Page 14
Appendix
GOODWILL ANALYSIS: ACQUISITION
Company Transaction Type
Goodwill Generated ($ in 000’s)
Deposits Acquired ($ in 000’s)
Implied Deposit Premium
HSBC USA. Inc Branch Acquisition $772,000.00 $9,100,000 8.48%
PNC Financial Services Group, Inc.
Branch Acquisition $130,079.00 $3,893,699 3.34%
New Alliance Bancshares Company Acquisition $676,727.00 $8,712,097 7.77%
Harleysville National Corporation
Company Acquisition $130,889.00 $5,646,195 2.32%
Great Lakes Bancorp Company Acquisition $41,769.00 $891,973 4.68%
Hudson River Bancorp Company Acquisition $352,528.00 $2,579,259 13.67%
Troy Financial Corporation Company Acquisition $218,091.00 $1,247,755 17.48%
Finger Lakes Bancorp, Inc Company Acquisition $32,811.00 $387,818 8.46%
Iroquois Bancorp, Inc. Company Acquisition $43,800.00 $595,126 7.36%
CNY Financial Group Company Acquisition $17,000.00 $296,294 5.74%
Albion Banc Corp. Company Acquisition $7,600.00 $78,711 9.66%
Total Goodwill $2,423,294.00
Total Deposits Acquired $33,428,927.00
Average Deposit Premium Paid 7.25%

FIRST NIAGARA FINANCIAL GROUP
Page 15
GOODWILL ANALYSIS: SALES AND DIVESTITURES
Company (Number of Branches) Transaction Type
Premium Received
Deposits Sold Implied Deposit Premium
Financial Institutions, Inc. (8 Branches)
Branch Divestiture $15,032.00
$286,500.00 5.25%
Community Bank System, Inc. (19 Branches)
Branch Divestiture $31,000.00
$797,400.00 3.89%
KeyCorp (37 Branches) Branch Divestiture $115,000.00
$2,000,000.00 5.75%
C.C.Bancorp, Inc. (2 Branches) Branch Divestiture $585.00
$19,700.00 2.97%
Elmira Savings Bank, FSB (4 Branches)
Branch Divestiture $12,230.00
$78,000.00 15.68%
Legacy Bancorp, Inc. (5 Branches) Branch Divestiture $9,770.00
$76,629.00 12.75%
Pathfinder Bancorp Inc. (MHC) (1 Branch)
Branch Divestiture $2,400.00
$26,400.00 9.09%
Total Premium Collected $186,017.00
Total Deposits Sold $3,284,629.00
Average Deposit Premium Collected 5.66%