Fnb property barometer september 2010
9
FNB HOME BUYING ESTATE AGENT SURVEY - Its still very much a buyers market……at least for those buyers who have the finance. FNB PROPERTY MARKET ANALYTICS 21 September 2010 JOHN LOOS: FNB HOME LOANS STRATEGIST 011-6490125 [email protected] EWALD KELLERMAN: PROPERTY MARKET ANALYST 011-6320021 [email protected] The information in this publication is derived from sources which are regarded as accurate and reliable, is of a general nature only, does not constitute advice and may not be applicable to all circumstances. Detailed advice should be obtained in individual cases. No responsibility for any error, omission or loss sustained by any person acting or refraining from acting as a result of this publication is accepted by Firstrand Group Limited and / or the authors of the material. First National Bank – a division of FirstRand Bank Limited. An Authorised Financial Services provider. Reg No. 1929/001225/06 CONTENTS 1. SUMMARY – THE 3 RD QUARTER FNB ESTATE AGENT SURVEY 2. RESIDENTIAL DEMAND CONDITIONS – Buyer demand activity rating weakens for the 2 nd successive quarter 3. PRICING REALISM AND MARKET BALANCE – For those still buying, most are able to bargain with the seller, whose pricing still appears generally unrealistic. 4. DEMAND/BUYER COMPOSITION - What has changed and what has not? • - 1 st time buyers once again diminishing in significance. • - Single buyer percentage declines as couples increasingly dominate buying • - Non-essential buying (buy-to-let, holiday property and buying for relatives) remains on the backburner. • - Black Population Group buying increases its share mildly in 2010. • • 5. SELLER COMPOSITION • - Financial pressure-related selling is still the single largest reason for selling reported • -Sentiment appears good, with a slight decline in the percentage of sellers selling in order to emigrate • 6. THE NATURE OF SALES • - An increased percentage of sales of investment properties achieved some capital growth, which is probably an overhang of the “mini-recovery” up until earlier in 2010. • Selling appeared to get tougher for agents, with an increase in the percentage of “ subject to” sales. 7. AGENT CONFIDENCE GRADUALLY WEAKENS • - Affordability and tight lending criteria featuring more strongly in estate agents’ deteriorating near term future expectations 8. CONCLUSION
-
Upload
marcel-deacon -
Category
Documents
-
view
505 -
download
5
description
Transcript of Fnb property barometer september 2010

FNB HOME BUYING ESTATE AGENT SURVEY
- Its still very much a buyers market……at least for those buyers who have the finance.
FNB PROPERTY MARKET
ANALYTICS
21 September 2010
JOHN LOOS: FNB HOME LOANS STRATEGIST
011-6490125 [email protected]
EWALD KELLERMAN: PROPERTY MARKET ANALYST
011-6320021 [email protected]
The information in this publication is derived from sources which are regarded as accurate and reliable, is of a general nature only, does not constitute advice and may not be applicable to all circumstances. Detailed advice should be obtained in individual cases. No responsibility for any error, omission or loss sustained by any person acting or refraining from acting as a result of this publication is accepted by Firstrand Group Limited and / or the authors of the material. First National Bank – a division of FirstRand Bank Limited. An Authorised Financial Services provider. Reg No. 1929/001225/06
CONTENTS 1. SUMMARY – THE 3RD QUARTER FNB ESTATE AGENT SURVEY 2. RESIDENTIAL DEMAND CONDITIONS – Buyer demand activity rating weakens for the 2nd successive quarter
3. PRICING REALISM AND MARKET BALANCE – For those still buying, most are able to bargain with the seller, whose pricing still appears generally unrealistic.
4. DEMAND/BUYER COMPOSITION - What has changed and what has not?
• - 1st time buyers once again diminishing in significance.
• - Single buyer percentage declines as couples increasingly dominate buying
• - Non-essential buying (buy-to-let, holiday property and buying for relatives) remains on the backburner.
• - Black Population Group buying increases its share mildly in 2010.
•
• 5. SELLER COMPOSITION
• - Financial pressure-related selling is still the single largest reason for selling reported
• -Sentiment appears good, with a slight decline in the percentage of sellers selling in order to emigrate
• 6. THE NATURE OF SALES
• - An increased percentage of sales of investment properties achieved some capital growth, which is probably an overhang of the “mini-recovery” up until earlier in 2010.
• Selling appeared to get tougher for agents, with an increase in the percentage of “ subject to” sales.
7. AGENT CONFIDENCE GRADUALLY WEAKENS
• - Affordability and tight lending criteria featuring more strongly in estate agents’ deteriorating near term future expectations
8. CONCLUSION
SUMMARY – THE 3RD QUARTER FNB ESTATE AGENT SURVEY The 3rd quarter FNB Estate Agent survey continues to depict home buyers as having the upper hand over the seller, or at least that group of home buyers that can acquire the finance.
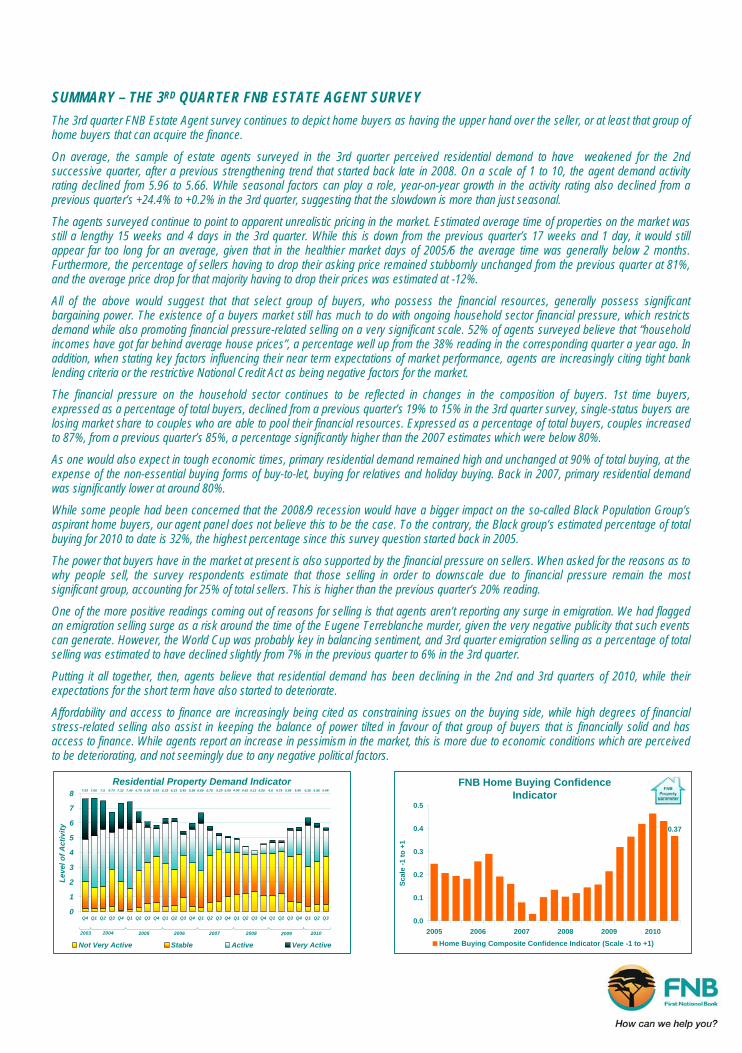
On average, the sample of estate agents surveyed in the 3rd quarter perceived residential demand to have weakened for the 2nd successive quarter, after a previous strengthening trend that started back late in 2008. On a scale of 1 to 10, the agent demand activity rating declined from 5.96 to 5.66. While seasonal factors can play a role, year-on-year growth in the activity rating also declined from a previous quarter’s +24.4% to +0.2% in the 3rd quarter, suggesting that the slowdown is more than just seasonal.
The agents surveyed continue to point to apparent unrealistic pricing in the market. Estimated average time of properties on the market was still a lengthy 15 weeks and 4 days in the 3rd quarter. While this is down from the previous quarter’s 17 weeks and 1 day, it would still appear far too long for an average, given that in the healthier market days of 2005/6 the average time was generally below 2 months. Furthermore, the percentage of sellers having to drop their asking price remained stubbornly unchanged from the previous quarter at 81%, and the average price drop for that majority having to drop their prices was estimated at -12%.
All of the above would suggest that that select group of buyers, who possess the financial resources, generally possess significant bargaining power. The existence of a buyers market still has much to do with ongoing household sector financial pressure, which restricts demand while also promoting financial pressure-related selling on a very significant scale. 52% of agents surveyed believe that “household incomes have got far behind average house prices”, a percentage well up from the 38% reading in the corresponding quarter a year ago. In addition, when stating key factors influencing their near term expectations of market performance, agents are increasingly citing tight bank lending criteria or the restrictive National Credit Act as being negative factors for the market.
The financial pressure on the household sector continues to be reflected in changes in the composition of buyers. 1st time buyers, expressed as a percentage of total buyers, declined from a previous quarter’s 19% to 15% in the 3rd quarter survey, single-status buyers are losing market share to couples who are able to pool their financial resources. Expressed as a percentage of total buyers, couples increased to 87%, from a previous quarter’s 85%, a percentage significantly higher than the 2007 estimates which were below 80%.
As one would also expect in tough economic times, primary residential demand remained high and unchanged at 90% of total buying, at the expense of the non-essential buying forms of buy-to-let, buying for relatives and holiday buying. Back in 2007, primary residential demand was significantly lower at around 80%.
While some people had been concerned that the 2008/9 recession would have a bigger impact on the so-called Black Population Group’s aspirant home buyers, our agent panel does not believe this to be the case. To the contrary, the Black group’s estimated percentage of total buying for 2010 to date is 32%, the highest percentage since this survey question started back in 2005.
The power that buyers have in the market at present is also supported by the financial pressure on sellers. When asked for the reasons as to why people sell, the survey respondents estimate that those selling in order to downscale due to financial pressure remain the most significant group, accounting for 25% of total sellers. This is higher than the previous quarter’s 20% reading.
One of the more positive readings coming out of reasons for selling is that agents aren’t reporting any surge in emigration. We had flagged an emigration selling surge as a risk around the time of the Eugene Terreblanche murder, given the very negative publicity that such events can generate. However, the World Cup was probably key in balancing sentiment, and 3rd quarter emigration selling as a percentage of total selling was estimated to have declined slightly from 7% in the previous quarter to 6% in the 3rd quarter.
Putting it all together, then, agents believe that residential demand has been declining in the 2nd and 3rd quarters of 2010, while their expectations for the short term have also started to deteriorate.
Affordability and access to finance are increasingly being cited as constraining issues on the buying side, while high degrees of financial stress-related selling also assist in keeping the balance of power tilted in favour of that group of buyers that is financially solid and has access to finance. While agents report an increase in pessimism in the market, this is more due to economic conditions which are perceived to be deteriorating, and not seemingly due to any negative political factors.
FNB Home Buying Confidence Indicator
0.37
0.0
0.1
0.2
0.3
0.4
0.5
2005 2006 2007 2008 2009 2010
Scal
e -1
to +
1
Home Buying Composite Confidence Indicator (Scale -1 to +1)
Residential Property Demand Indicator5.665.965.685.654.794.84.594.134.424.965.095.295.786.695.995.456.336.335.836.066.757.447.326.737.57.667.63 6.35
0
1
2
3
4
5
6
7
8
Q4 Q1 Q2 Q3 Q4 Q1 Q2 Q3 Q4 Q1 Q2 Q3 Q4 Q1 Q2 Q3 Q4 Q1 Q2 Q3 Q4 Q1 Q2 Q3 Q4 Q1 Q2 Q3
Leve
l of A
ctiv
ity
Not Very Active Stable Active Very Active
2004 2005 200820072006 20092003 2010

According to the FNB Estate Agent Survey for the 3RD quarter of 2010, home buying demand activity has weakened mildly for the 2nd successive quarter, following a strengthening trend that started back in late-2008.
In the survey, the sample of agents participating is asked to provide an estimate of how they experience residential demand in their area on a scale of 1 to 10. After a relative high point of 6.35, reached in the 1st quarter of 2010, the level has retreated to 5.66 by the 3rd quarter survey, which took place in August.
We had by-and-large expected the decline in this estimate of demand, because interest rate cutting had, as at August, all but ground to a halt, with only one 50 basis point reduction in the last 12 months. In addition, 2nd quarter economic growth estimates had already pointed to a slowing economy.
Part of any such decline during the winter months can also be seasonal factors, with the market tending to get a little quiet during this period. However, when we calculate the year-on-year percentage change on the demand activity ratings, we see that the 3rd quarter growth in the demand rating dropped sharply to 0.2%, well-down from 24.4% growth in the previous quarter. This suggests that the slowing perceived by agents is more than just seasonal.
Residential Property Demand Indicator5.665.965.685.654.794.84.594.134.424.965.095.295.786.695.995.456.336.335.836.066.757.447.326.737.57.667.63 6.35
0
1
2
3
4
5
6
7
8
Q4 Q1 Q2 Q3 Q4 Q1 Q2 Q3 Q4 Q1 Q2 Q3 Q4 Q1 Q2 Q3 Q4 Q1 Q2 Q3 Q4 Q1 Q2 Q3 Q4 Q1 Q2 Q3
Leve
l of A
ctiv
ity
Not Very Active Stable Active Very Active
2004 2005 200820072006 20092003 2010
Rate of Change in Demand Activity Levels according to FNB Property Barometer
0.2%
-30%
-20%
-10%
0%
10%
20%
30%
40%
2005 2006 2007 2008 2009 2010
%
Level of Residential Demand Activity - y/y%
Percentage of agents reporting very active levels (levels of 9 or 10) in their areas
0%
10%
20%
30%
40%
2004 2005 2006 2007 2008 2009 2010
2. DEMAND CONDITIONS - BUYER DEMAND WEAKENS FOR THE 2ND SUCCESSIVE QUARTER
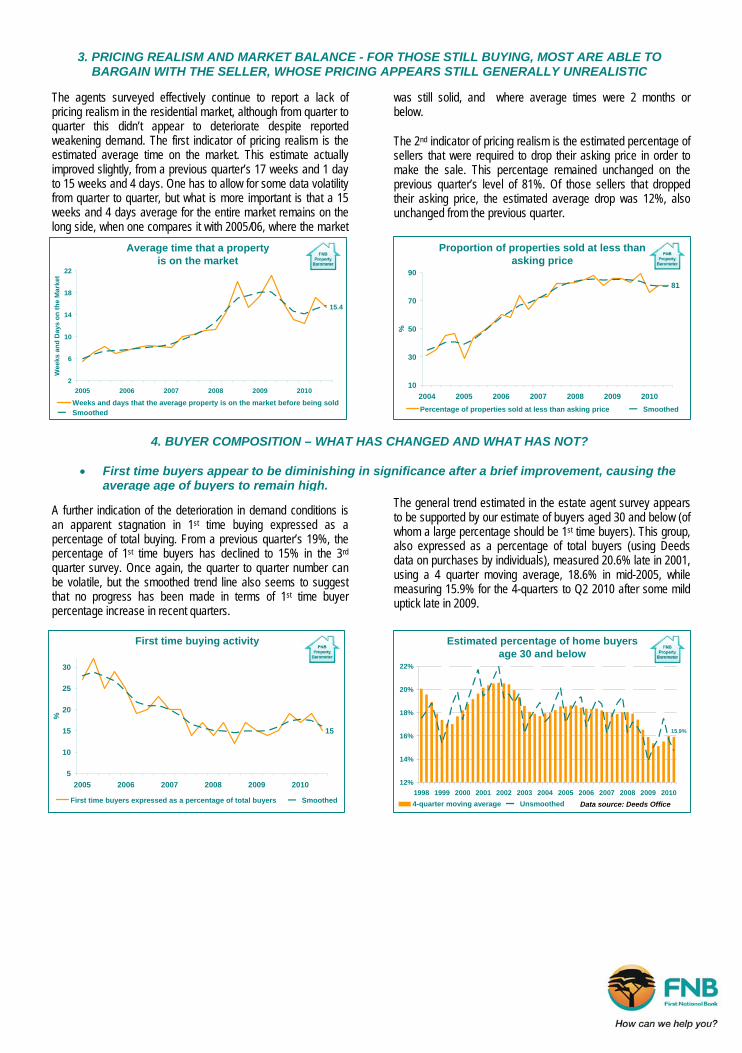
The agents surveyed effectively continue to report a lack of pricing realism in the residential market, although from quarter to quarter this didn’t appear to deteriorate despite reported weakening demand. The first indicator of pricing realism is the estimated average time on the market. This estimate actually improved slightly, from a previous quarter’s 17 weeks and 1 day to 15 weeks and 4 days. One has to allow for some data volatility from quarter to quarter, but what is more important is that a 15 weeks and 4 days average for the entire market remains on the long side, when one compares it with 2005/06, where the market
was still solid, and where average times were 2 months or below.
The 2nd indicator of pricing realism is the estimated percentage of sellers that were required to drop their asking price in order to make the sale. This percentage remained unchanged on the previous quarter’s level of 81%. Of those sellers that dropped their asking price, the estimated average drop was 12%, also unchanged from the previous quarter.
A further indication of the deterioration in demand conditions is an apparent stagnation in 1st time buying expressed as a percentage of total buying. From a previous quarter’s 19%, the percentage of 1st time buyers has declined to 15% in the 3rd quarter survey. Once again, the quarter to quarter number can be volatile, but the smoothed trend line also seems to suggest that no progress has been made in terms of 1st time buyer percentage increase in recent quarters.
The general trend estimated in the estate agent survey appears to be supported by our estimate of buyers aged 30 and below (of whom a large percentage should be 1st time buyers). This group, also expressed as a percentage of total buyers (using Deeds data on purchases by individuals), measured 20.6% late in 2001, using a 4 quarter moving average, 18.6% in mid-2005, while measuring 15.9% for the 4-quarters to Q2 2010 after some mild uptick late in 2009.
Average time that a property is on the market
15.4
2
6
10
14
18
22
2005 2006 2007 2008 2009 2010
Wee
ks a
nd D
ays
on th
e M
arke
t
Weeks and days that the average property is on the market before being soldSmoothed
3. PRICING REALISM AND MARKET BALANCE - FOR THOSE STILL BUYING, MOST ARE ABLE TO BARGAIN WITH THE SELLER, WHOSE PRICING APPEARS STILL GENERALLY UNREALISTIC
4. BUYER COMPOSITION – WHAT HAS CHANGED AND WHAT HAS NOT?
• First time buyers appear to be diminishing in significance after a brief improvement, causing the average age of buyers to remain high.
Proportion of properties sold at less than asking price
81
10
30
50
70
90
2004 2005 2006 2007 2008 2009 2010%
Percentage of properties sold at less than asking price Smoothed
First time buying activity
15
5
10
15
20
25
30
2005 2006 2007 2008 2009 2010
%
First time buyers expressed as a percentage of total buyers Smoothed
Estimated percentage of home buyersage 30 and below
15.9%
12%
14%
16%
18%
20%
22%
1998 1999 2000 2001 2002 2003 2004 2005 2006 2007 2008 2009 20104-quarter moving average Unsmoothed Data source: Deeds Office

The result of tougher economic times in recent years, therefore, has been a rise in the average age of home buyers, with young buyers being the most sensitive to economic shocks or interest rate hiking. Using Deeds data for transactions by individuals, we
have estimated the average age of buyers on a half-yearly basis. Since 1995, the highest average age of buyers was recorded in the 1st half of 1999, i.e. 48.6 years, the lagged response to the huge interest rate shock of 1998 (prime rate peaking at 25.5%). The massive interest rate reduction of 1999/2000 caused average age to decline to a low of 38.6 years by the 1st half of 2002, before rate hiking in 2002 cause a sudden increase to 43.4 years of age. Thereafter, we had a significant drop in average age to 39.9 years in the 1st half of 2003, and then a steady rise on the back of rising debt levels, deteriorating affordability, interest rate hikes ending in mid-2008, and then a recession.
The 2009 interest rate cuts and an improvement of sorts in the economy, brought about a mild decline in buyer average age to 43.8 years by the 2nd half of 2010, from a peak of 44.7 years in the 1st half of 2009, but by the levels of the past decade-and-a-half, this would still appear to be a high average age.
According to the survey panel, a further apparent result of tougher economic times has been a decline in the significance of individual buyers versus that of couples that purchase property.
As at the beginning of 2007, single people buying property were estimated at 21% of total buyers. This group has diminished to an estimated 13% by the 3rd quarter 2010 survey, weaker than the 15% recorded in the previous quarter’s survey.
There are 3 probable reasons for the relative demise of the single buyers:
Firstly, one probably finds that there are more aspirant single buyers amongst the younger age groups, and who are would-be 1st time buyers. Such individuals have more flexibility than established families, and can remain either in the rental market or in their parents’ home for longer when economic times turn tough. On average, single individuals probably have more flexibility than couples, many of whom are established families and need their own home.
Secondly, couples can pool their resources to qualify for finance, so on average they probably have an advantage over the aspirant single buyers in terms of ability to qualify for finance.
Thirdly, and related to the first reason, is the fact that the economy is currently weak, translating into weak job creation for young people trying to enter the labour market. This probably hits the singles market a little harder.
According to the latest survey, primary residential demand continues to overwhelmingly dominate buying, with all forms of non-essential residential buying remaining very much on the backburner. Primary residential demand is always going to be the biggest driver in the major metropolitan markets. However, one can see that non-essential buying, i.e. buy-to-let, holiday home buying, and home buying for primary residential purposes of relatives, used to make up an estimated 20% back at the start of 2007, and that this had declined to 10% by the 3rd quarter 2010. This means primary residential demand is now an estimated 90% of all major metro buying, unchanged from the previous quarter’s survey.
The decline in importance of all 3 forms of non-essential property buying is further reflection of the tough economic and financial
times in which we find ourselves, as well as a lack of capital growth currently making non-essential buying unattractive from a speculator point of view.
All 3 forms of non-essential buying remain unchanged as a percentage of total buying from the 2nd quarter survey, i.e. buy-to-let buying accounting for 7% of total buying, holiday property buying 2%, and buying for relatives 1%. However, from the 1st quarter of 2007, buy-to-let is down from 10%, and both holiday buying, as well as buying for relatives, down from 5%. The shift in the composition of total buying away from non-essential buying has had a profound impact on smaller holiday property-driven regions. The graph below right shows the volumes of property transactions by individuals, in areas that we believe to be residential dominated, for the 6 major metropolitan
• The relative power of single buyers has also been eroded in tough economic times.
• Non-essential buying of residential property remains on the backburner
Couples buying property vs single people buying property
79 78 81 78 79 79 81 81 83 81 83 80 82 85 87
50%
60%
70%
80%
90%
100%
Q1-2007 Q1-2008 Q1-2009 Q1-2010
% o
f Tot
al B
uyin
g
Couples buying property Single buyers
Couples buying property expressed as a percentage of total buyers
Single people buying property expressed as a percentage of total buyers
Average Age of Individual Property Buyers
43.4
48.6
44.7
38.6
43.8
3032343638404244464850
1995 1997 1999 2001 2003 2005 2007 2009
Age
(Yea
rs)
Average Age of Individual Property Buyers (deeds Office Data)

regions versus that in areas known to be strongly holiday property-driven. The graph shows the holiday areas’ volumes having dropped by a greater magnitude than the more primary residence-driven metro markets. As at June 2010, the smoothed volume of transactions for the holiday towns was only 12.1% of the June
2004 peak in volumes, while the major metro area volume series shows volumes declining by a smaller margin, to 24.4% of the August 2006 peak in volumes. So, while most regions have been hit hard during the weakening in the market since the boom years, volumes in holiday towns appear to have been affected to a greater extent than major metro areas, due to the relative shift in buying focus towards essential buying.
There have been concerns from some quarters that buying by the so-called Black population would be negatively affected by recessionary conditions in 2008/09. This was undoubtedly the case, when one looks at the picture in absolute terms, as was the case for all 4 population groups, because we know that transaction volumes are sharply down on a few years ago.
However, on a relative basis, the agent survey suggests that the Black population group has held its own, sustaining its share of suburban buying, and possibly even increasing it a little in 2010.
The accompanying graph shows the estimated percentage of so-called White suburban buyers averaging 50 in 2008, 2009 and 2010 to date, after a declining trend in previous years. The 3 previously disadvantaged population groups have accounted for the other 50% of estimated suburban buying, but with the average Black buying for the 1st three quarters of 2010 increasing to its highest percentage yet, i.e. 32%, with the so-called Coloured group estimated to have lost some share.
Further gradual increase in the share of the majority Black population should be expected to continue, because labour
market transformation policies are aimed most strongly at this group, while we also pointed out previously that this population group’s income earners below an annual income of R500,000 had a markedly lower level of estimated debt-to-disposable income than the average, and so, from a low base we believe that this population group can boost the more affordable end of the residential property market.
Has this group supported the lower end of the suburban market? Well, survey respondents indicate that the Black population group’s buying in the lower income end of the suburban market has risen noticeably during 2010 to date, to 44%, up from the 40% average of the past 2 years.
Did the recession, and the general economic weakness that still persists, affect previously-disadvantaged groups more than the so-called White population group, when it comes to home buying? The agent survey doesn’t provide any evidence of this. However, there is little doubt that economic weakness did affect all population groups’ home buying heavily.
• Previously-disadvantaged suburban home buying appears to have held its own from a relative point of view.
Percentage of Suburban Buyers by Race Group
12 12 12 12 13 118 8 8 8 7 7
23.0 24.0 25.3 30.0 29.5 32.0
57 57 56 50 50 50
0%
20%
40%
60%
80%
100%
2005 2006 2007 2008 2009 2010Indian/Asian Buyers Coloured Buyers Black Buyers White Buyers
Trends in the composition of Home Buying - Primary Residential vs Non-Essential
828283818179
818176 79
8782
80
90 90
0%
10%
20%
30%
40%
50%
2007 2008 2009 2010
% o
f Tot
al B
uyin
g
Holiday Home Buying Buying primary residences for relativesBuying to let Primary residential demand for oneself
Primary Residential Demand
Holiday Town vs Major Metro Residential Area Property Transaction Volumes by
Individuals
0
4000
8000
12000
16000
20000
24000
199501 199701 199901 200101 200301 200501 200701 200901-
200
400
600
800
1,000
1,200
1,400
1,600
1,800
Transactions by Individuals in Major Metro Areas - SmoothedTransactions by Individuals in Holiday Towns - Smoothed (Right Axis)
Source: Deeds Office
Percentage of Suburban Buyers by Race Group in Lower Income Areas
37.534
43.3
40 40
44
15
25
35
45
2005 2006 2007 2008 2009 2010Black population group buyers in low income areas, expressed as a percentageof total buying in low income areas
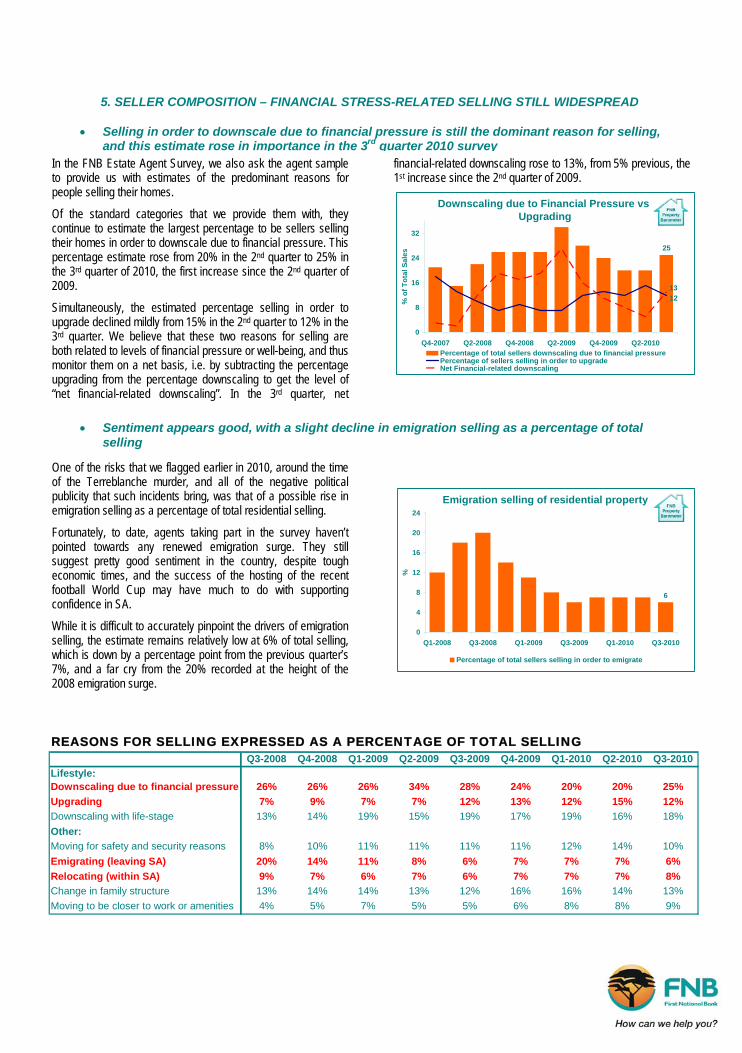
In the FNB Estate Agent Survey, we also ask the agent sample to provide us with estimates of the predominant reasons for people selling their homes.
Of the standard categories that we provide them with, they continue to estimate the largest percentage to be sellers selling their homes in order to downscale due to financial pressure. This percentage estimate rose from 20% in the 2nd quarter to 25% in the 3rd quarter of 2010, the first increase since the 2nd quarter of 2009.
Simultaneously, the estimated percentage selling in order to upgrade declined mildly from 15% in the 2nd quarter to 12% in the 3rd quarter. We believe that these two reasons for selling are both related to levels of financial pressure or well-being, and thus monitor them on a net basis, i.e. by subtracting the percentage upgrading from the percentage downscaling to get the level of “net financial-related downscaling”. In the 3rd quarter, net
financial-related downscaling rose to 13%, from 5% previous, the 1st increase since the 2nd quarter of 2009.
One of the risks that we flagged earlier in 2010, around the time of the Terreblanche murder, and all of the negative political publicity that such incidents bring, was that of a possible rise in emigration selling as a percentage of total residential selling.
Fortunately, to date, agents taking part in the survey haven’t pointed towards any renewed emigration surge. They still suggest pretty good sentiment in the country, despite tough economic times, and the success of the hosting of the recent football World Cup may have much to do with supporting confidence in SA.
While it is difficult to accurately pinpoint the drivers of emigration selling, the estimate remains relatively low at 6% of total selling, which is down by a percentage point from the previous quarter’s 7%, and a far cry from the 20% recorded at the height of the 2008 emigration surge.
5. SELLER COMPOSITION – FINANCIAL STRESS-RELATED SELLING STILL WIDESPREAD
• Selling in order to downscale due to financial pressure is still the dominant reason for selling, and this estimate rose in importance in the 3rd quarter 2010 survey
• Sentiment appears good, with a slight decline in emigration selling as a percentage of total selling
Emigration selling of residential property
6
0
4
8
12
16
20
24
Q1-2008 Q3-2008 Q1-2009 Q3-2009 Q1-2010 Q3-2010
%
Percentage of total sellers selling in order to emigrate
REASONS FOR SELLING EXPRESSED AS A PERCENTAGE OF TOTAL SELLINGQ3-2008 Q4-2008 Q1-2009 Q2-2009 Q3-2009 Q4-2009 Q1-2010 Q2-2010 Q3-2010
Lifestyle:Downscaling due to financial pressure 26% 26% 26% 34% 28% 24% 20% 20% 25%Upgrading 7% 9% 7% 7% 12% 13% 12% 15% 12%Downscaling with life-stage 13% 14% 19% 15% 19% 17% 19% 16% 18%Other:Moving for safety and security reasons 8% 10% 11% 11% 11% 11% 12% 14% 10%Emigrating (leaving SA) 20% 14% 11% 8% 6% 7% 7% 7% 6%Relocating (within SA) 9% 7% 6% 7% 6% 7% 7% 7% 8%Change in family structure 13% 14% 14% 13% 12% 16% 16% 14% 13%Moving to be closer to work or amenities 4% 5% 7% 5% 5% 6% 8% 8% 9%
Downscaling due to Financial Pressure vs Upgrading
25
1213
0
8
16
24
32
Q4-2007 Q2-2008 Q4-2008 Q2-2009 Q4-2009 Q2-2010
% o
f Tot
al S
ales
Percentage of total sellers downscaling due to financial pressurePercentage of sellers selling in order to upgradeNet Financial-related downscaling

When asked about prices obtained for investment properties put back on the market, the agents report a slightly higher percentage of properties having achieved some form of capital growth in the 3rd quarter of 2010.
The estimated percentage of properties being sold for less than their previous purchase price was 14%, slightly lower than the previous quarter’s 15%, while those being sold at a price equal to their previous purchase price also declined as a percentage of total sales, from a previous of 47% to 40%. This means that the total percentage of properties being sold at prices higher than their previous purchase price rose from 38% in the previous quarter to 46%. The most noticeable rise was in the category “properties being sold at 10% above previous purchase price”, which increased from 25% in the previous quarter to 38% in the 3rd quarter.
The improvement is believed to be largely the result of improvements in market strength in quarters prior to the past 2 quarters’ surveys.
This is a different way to look at capital growth to the usual house price index, and the obvious shortcoming is that it doesn’t track the dates of when the properties were purchased by the current sellers.
Despite some reported improvement in investment property capital growth, which is believed to be more the lagged impact of market strength of a few quarters ago still feeding through into price achieved, agents report that selling arguably became harder work in the 3rd quarter.
In the 2nd quarter, we started a new set of questions regarding how buyers and sellers approach transactions. While 2 quarters’ worth of data is too little to identify a trend yet, it would appear that selling got a little bit tougher going in the 3rd quarter of 2010.
We say this because the estimated percentage of sales that were subject to the sale of the buyer’s existing home increased mildly from 51% in the 2nd quarter to 54% of total sales in the 3rd quarter.
6. THE NATURE OF SALES – MORE CAPITAL GAINS, BUT LESS “CLEAN” SALES IN THE 3RD QUARTER. • An increased percentage of sales of investment properties achieved some capital growth, which
is probably an overhang of the “mini-recovery” up until earlier in 2010
Prices obtained for investment properties put back on the market
52
38 40
14
0
10
20
30
40
50
60
Purchase price+30%
Purchase price+20%
Purchase price+10%
Purchase price Less thanpurchase price
%
Q1-2008 Q2-2008 Q3-2008 Q4-2008 Q1-2009 Q2-2009Q3-2009 Q4-2009 Q1-2010 Q2-2010 Q3-2010
Q3-2010 Q2-2010Percentage of buyers who buy/make an offer prior to selling their existing home 24% 30%Percentage of buyers who sell existing home prior to buying/making an offer on a new home 40% 35%Percentage of buyers who simultaneously market their existing home and search for a new one 36% 35%
Percentage of unconditional sales made46% 49%
Percentage of sales that are subject to the sale of the buyer's existing home 54% 51%
PURCHASE AND SALE OF PRIMARY RESIDENCE: HOW BUYERS AND SELLERS APPROACH THE TRANSACTIONS
• Selling appeared to get tougher for agents, with an increase in the percentage of “subject to” sales

Each quarter, we ask agents to provide us with their expectations regarding the market’s direction over the next 3 months, i.e. they either expect the market to strengthen, remain the same or weaken. We quantify the answers, giving a “1” for strengthening, zero for remaining unchanged and “-1” for an expected weakening. We then calculate the average, but use a 4-quarter moving average to eliminate seasonal factors which are so often prevalent in the market and in the agents’ answers to this question. The graph below shows the overall result of this survey question, and is known as the FNB Home Buying Market Confidence Indicator. In the 3rd quarter, it showed a decline for the 2nd consecutive quarter, suggesting an average decline in the near term market expectations of the sample of agents surveyed.
Accompanying the question regarding near term expectations, we ask agents to provide the main factors influencing their expectations.
More agents feel that there exists a positive sentiment in the country than those who point to “general pessimism”. However, those pointing towards “general pessimism” have been on the increase in recent quarters. They indicate that this pessimism has much to do with a very weak economy and the financial pressure that it has brought. Also interesting is the return of the National Credit Act (NCA) as a key negative factor in agent perceptions, with many now pointing to would-be buyers being turned down on the grounds of affordability.
Along with the NCA, strict bank lending criteria feature prominently. These two categories often amount to the same thing, but can merely be different terms used by different agents to often describe the same thing.
Some agents go further, saying that it is not only banks choosing to be strict, or NCA, but an increasing number believe that home
pricing is far out of line with incomes. “Pricing and Affordability” has increased in prominence in the list of factors that influence near term perceptions/expectations. Since 2009, we have seen a broad rise in the percentage of agents who believe that “incomes have got far behind house price levels”. This percentage has risen to 52% of total agents, up from a previous quarter’s 43% and also up from 38% a year ago.
The 3rd quarter 2010 FNB Estate Agent Survey generally points to market weakness, driven by a household sector under very significant financial pressure.
Agents surveyed believe that residential demand weakened for the 2nd successive quarter, and that pricing still remains largely unrealistic, with average time on the market over 3 months and 81% of sellers having to drop their asking price.
Near term expectations regarding market performance have begun to deteriorate, and agents increasingly cite tight bank
lending criteria as well as the National Credit Act as negative factors influencing their expectations, while they also perceive incomes not having kept up with price levels.
Their perception of widespread financial pressure on households is reflected in their estimate that selling in order to downscale due to financial pressure remains the single most important reason for selling.
7. OUTLOOK – AGENT CONFIDENCE GRADUALLY WEAKENS? • Affordability and tight lending criteria featuring more strongly in estate agents’ deteriorating near
term future expectations
Non-Seasonal Factors that influence perceptions of near term future activity levels
0 10 20 30
Other2010 World Cup
Area Specific IssuesBuyer's Market
Buyer's MindsetStock Issues
More Relaxed Lending Stance by BanksInterest rates
Pricing and AffordabilityStrict Credit Environment
NCAGeneral Pessimism
Consumer Positive Sentiment
%
FNB Home Buying Confidence Indicator
0.37
0.0
0.1
0.2
0.3
0.4
0.5
2005 2006 2007 2008 2009 2010
Scal
e -1
to +
1
Home Buying Composite Confidence Indicator (Scale -1 to +1)
Affordability Perceptions - Agents who believe income levels haven't kept up with
prices
52.0
10
20
30
40
50
60
70
80
Q1-2004 Q1-2005 Q1-2006 Q1-2007 Q1-2008 Q1-2009 Q1-2010
%
Percentage of respondents stating that buyer income levels have got far behind price levelsSmoothed
8. CONCLUSION