AI 2015 Q1 Barometer: Cheap Labor Came at a High Price in 2014
20 June 2017
FNB HOME LOANS:
MARKET ANALYTICS AND
SCENARIO FORECASTING UNIT
JOHN LOOS:
HOUSEHOLD AND PROPERTY
SECTOR STRATEGIST
087-328 0151
THEO SWANEPOEL:
PROPERTY MARKET ANALYST
FNB HOME LOANS
087-328 0157
The information in this publication is
derived from sources which are regarded
as accurate and reliable, is of a general
nature only, does not constitute advice
and may not be applicable to all
circumstances. Detailed advice should be
obtained in individual cases. No
responsibility for any error, omission or
loss sustained by any person acting or
refraining from acting as a result of this
publication is accepted by Firstrand Group
Limited and / or the authors of the
material.
First National Bank – a division of FirstRand Bank
Limited. An Authorised Financial Services
provider. Reg No. 1929/001225/06
PROPERTY BAROMETER
Price Realism and Market Balance
National price realism deteriorates, but that’s more in
the Coastal regions, while Gauteng is solid.
On a national average basis, a resumption of the rise in average time of homes
on the market prior to sales points to a housing market moving away from
equilibrium, and into a space where supply exceeds demand.
However, a look at the major regional breakdown points to 2 very different
housing markets. Gauteng appears realistic and relatively well balanced,
averaging 12 weeks time on the market, having shortened slightly.
By comparison, it is the 3 Coastal metros whose average times on the market
have risen markedly, and who take the national average higher.
KEY POINTS
• The 2nd quarter saw the average time of homes on the market resume
its rise from 13 weeks and 4 days previous to 15 weeks and 4 days.
• From a multi-year low of 78% in the 2nd quarter of 2014, the market
weakening since then has brought about a mild upward trend to 92% of all
sellers dropping their asking price in the 2nd quarter of 2017.
• Interestingly, though, the estimated magnitude of drop in asking price
has broadly declined, from -8% for much of 2015 to -6.8% by the 2nd quarter of
2017. So more sellers are dropping their price but by a lesser magnitude.
• The once booming Namibian market is no longer. Whereas South
Africa’s estimated average time on the market was 15 weeks and 4 days in the
2nd quarter of 2017, Namibia’s had risen to as high as 23 weeks and 6 days.
• From a multi-year high average of 14.42 estimated serious viewers per
show house for the 4-quarters of 2013, we saw a noticeable decline to 10.66
average for the 4 quarters of 2015. Thereafter, the broad movement has been
more-or-less sideways up to the present, averaging 10.87 viewers for the 4
quarters up to and including the 2nd quarter of 2017.
• In the 2nd quarter of 2017 we saw a decline from a previous 12% of
agents citing “stock constraints” to 8%, and the percentage citing stock
constraints is now far below the 24% high of early 2015.
• Within South Africa, the shift away from market equilibrium, or towards
less realistic pricing, has taken place largely in the country’s Coastal Metros,
where we have seen the average time on the market rise to 20 weeks and 3
days in the 2nd quarter of 2017.
• The Gauteng region, by comparison, has become the “solid” region, and
appears to have improved in health, averaging 12 weeks time on the market in
the 2nd quarter. This is right on our subjective “market equilibrium”.

ESTIMATED AVERAGE TIME OF HOMES ON THE MARKET INCREASES
It is important to understand that, due to significant
resistance by home sellers to house price declines, in
times of economic and residential demand slowdown
the residential market can often move away from
market equilibrium price.
Average time of homes on the market rises
Therefore, the average market house price level, as
depicted by a house price index, is not necessarily the
“market equilibrium” price level. Often, in times of
market weakness, part of the weakness is reflected in
the average transaction price, or its inflation rate, and
part of it will be reflected in a longer average time that
it takes to sell a home.
The key question around the estimated average time of
properties on the market is what would be the average
time on the market that reflects market equilibrium?
The answer to this is subjective, but our view is that the
level is around 3 months average time on the market.
From 2014 to early-2016, the estimated average time
had been moving broadly sideways at levels around 12
weeks, i.e. slightly less than 3 months, and this was a
time with very mild average house price growth in real
terms (zero average house price growth in real terms
theoretically reflecting a well balanced market)
Through 2016 and into 2017, the market appears to
have been moving broadly away from that equilibrium.
In the FNB Estate Agent Survey for the 1st quarter of
2017, we did see a decline in the average time of homes
on the market, after 3 prior quarters of increase. This,
we thought, may be the start of some very mild
recovery in the residential market, with 2 consecutive
quarters of rise in the FNB Residential Activity Rating
also being witnessed up to and including the 1st quarter
of this year.
However, it was not yet to be, and the 2nd quarter saw
both the Residential Activity Rating recede, as well as
the average time of homes on the market resume its
rise from 13 weeks and 4 days in the 1st quarter to 15
weeks and 4 days in the 2nd quarter.
A greater percentage of sellers is required to drop their
asking price
A 2nd question related to price realism is where we ask
the agents to estimate the percentage of sellers
ultimately being required to drop their asking price to
make the sale.
While the overwhelming majority of sellers do tend to
start high and allow themselves to be bargained down
as a strategy, we nevertheless find this estimated
percentage of sellers having to drop their asking price to
have crept up. From a multi-year low of 78% in the 2nd
quarter of 2014, the market weakening since then has
brought about a mild upward trend to 92% of all sellers
dropping their asking price in the 2nd quarter of 2017,
according to the respondents’ estimates.

But interestingly, the estimated magnitude of the
average price drop continues to diminish
Interestingly, though, the estimated magnitude of
decline, for those being required to drop their asking
price, has broadly declined, from -8% for much of 2015
to -6.8% by the 2nd quarter of 2017. So more are
dropping their price but by a lesser magnitude.
The shift away from equilibrium/deteriorating price
realism is a delayed response to weaker demand.
The noticeable increase in the national average time on
the market since early last year was arguably the lagged
response to a slowing in housing demand through 2014
and 2015. During those 2 years we saw interest rates
rise, economic growth continue to slow, and housing
demand slow as a result.
A key residential “demand-side” question that is asked
to the survey respondents, in the FNB Estate Agent
Survey, is to give an estimate of how many serious
viewers per show house they get before making the
sale.
From a multi-year high average of 14.42 estimated
serious viewers per show house for the 4-quarters of
2013, we saw a noticeable decline to 10.66 average for
the 4 quarters of 2015. Thereafter, the broad
movement has been more-or-less sideways up to the
present, averaging 10.87 viewers for the 4 quarters up
to and including the 2nd quarter of 2017.
While according to this indicator, demand no longer
appears to be declining, the average number of serious
viewers since early 2016 has moved at a lower level
than in prior years, and this is seemingly at a level
where demand is not strong enough to mop up
available residential supply.
Stock constraints diminish
It is difficult to gauge the strength of supply of
residential stock through asking survey respondents for
their opinion. But when asking agents about their
market expectations in the near term, we allow them to
provide a list of factors that influence their
expectations, both in a positive and a negative way
After the percentage of agents citing “stock constraints”
as a key factor had intensified noticeably from 2012 to
early-2014, assisted by relatively low levels of
residential building activity since the end of the building
boom in 2008, they began to diminish through 2015, as
one would expect in most slowing demand
environments. In the 2nd quarter of 2017 we saw a
decline from the previous quarter’s 12% of agents to
8%, after 2 prior quarters of increase, and the
percentage citing stock constraints is now far below the
24% high of early 2015.
The percentage of agents citing “Ample Stock” equaled
those citing “Stock Constraints”, i.e. also 8%, after
having generally been below the “Stock Constraint”
estimate in recent years.
In short, agents have perceived stock constraints to
have eased significantly since 2015.
Namibia, the weak link in the Rand Area. Gauteng, the
strong point in terms of realism and balance.
When breaking down the key indicators of price realism
into the major survey regions, a key feature is the
weakness in Namibia relative to South Africa. The once
booming Namibian market is no longer. Whereas South
Africa’s estimated average time on the market was 15
weeks and 4 days in the 2nd quarter of 2017, Namibia’s
average time had risen to as high as 23 weeks and 6
days.

To boost survey sample size when breaking down the
survey into regions (to reduce volatility), we resort to a
2-quarter moving average.
For the 1st 2 quarters of 2017, the average estimated
time of homes on the market in South Africa was 14.57
weeks. By comparison, Namibia averaged a lengthy
22.36 weeks. The income levels of Namibia can no
longer sustain the high price levels following that
country’s meteoric rise in house prices over a decade-
and-a-half.
Gauteng, the strong point in terms of realism and
balance.
Within South Africa, the shift away from market
equilibrium, or towards less realistic pricing, has taken
place largely in the country’s Coastal Metros, where we
have seen the average time on the market rise to 20
weeks and 3 days in the 2nd quarter of 2017.
Notably, the recently very strong City of Cape Town has
also seen its average time on the market rise noticeably,
from 13 weeks and 6 days in the previous quarter to 18
weeks and 4 days in the 2nd quarter of 2017.
The Gauteng region, on the other hand, has become the
“solid” region, and appears to have improved in health,
averaging 12 weeks time on the market in the 2nd
quarter. This is right on our subjective “market
equilibrium” .
Using 2-quarter moving averages to boost sample size
at city level, the 3 coastal cities (Cape Town, Ethekwini
and Nelson Mandela Bay) are noticeably weaker, all 3
averaging above 16 weeks time on the market for the 1st
half of 2017.
By comparison, Joburg has averaged a heathier 12.86
weeks and Tshwane Metro an impressive 9.57 weeks for
the same 2 quarters
In the City of Cape Town, we believe that the recent rise
in average time on the market has much to do with
mounting home affordability challenges after a run of
very strong house price inflation in that region in recent
years.
However, just because Joburg and Tshwane have a far
lower average time on the market does not mean that
they are markets with strong demand and high levels of
seller pricing power. To the contrary, these 2 cities still
have relatively high estimates for the percentage of
sellers being required to drop their asking price to make
the sale. Joburg’s 2-quarter average was 89% of total
sellers being required to drop the price, while
Tshwane’s average was 95%, in the 1st 2 quarters of
2017. Far from having strong housing demand,
therefore, it would seem that after a few recent years of
weakness in demand in these markets their sellers are
more ready to accept a price drop.
Interestingly, though, is that while Cape Town’s average
time on the market has risen, suggesting a weakening in
the level of demand relative to supply at the high

prevailing price levels, still 29% of that city’s agents
perceived “stock constraints” as an issue in their lives in
the 1st 2 quarters of 2017. This is far higher than any
other city, whereas only 4% of agents in Joburg and zero
in Tshwane reported stock constraints.
However, we do expect that this percentage will decline
noticeably in the near term in Cape Town, given that
homes appear to be staying on the market for longer of
late.
The lower end is the “hot spot” in both South Africa
and Namibia
Examining the average time of homes on the market by
Income Area segment, both South Africa and Namibia
showed very wide differentials between the Lower
Income Area end and the High Net Worth end, with the
Lower Income end having far shorter average times on
the market.
While high end homes do generally take longer to sell,
we believe that the wide differential, i.e. 24 weeks in
the case of the High Net Worth segment and 8 weeks in
the Lower Income segment in the case of South Africa,
also in part reflects a stronger lower end of the market.
CONCLUSION
On a national average basis, a resumption of the rise in
average time of homes on the market prior to sales
points to a housing market moving away from
equilibrium, and into a space where supply exceeds
demand.
However, a look at the major regional breakdown points
to 2 very different housing markets. Gauteng appears
very much in equilibrium, averaging 12 weeks time on
the market, an average which has declined slightly.
By comparison, it is the 3 Coastal metros whose average
times on the market have risen markedly, and who take
the national average higher.
Since we have started the FNB Estate Agent Survey, it
has been an interesting feature of the housing market
that the Gauteng market seems to be a more realistic
one in general, more swiftly moving back to
“equilibrium” than the major coastal city markets.
This was shown in 2011/12. The market was trying to
recover from the 2008/9 recession (and widespread
financial stress) at the time. Gauteng started its broad
shortening in the average time on the market from mid-
2011 onward, whereas the Coastal Metros only saw
their average time peak as late as the 2nd quarter of
2012 at 21 weeks and 3 days, and only starting the
declining trend there-after.
This time around, it appears to be the same, Gauteng
having seemingly started its recovery with a decline in
average time on the market in the past 2 quarters, while
the Coastal regions’ average time is still on a rising path.
The explanation for this greater realism and adaptability
in Gauteng is not yet understood.
NOTE: A THEORETICAL REPRESENTATION OF THE MARKET SHIFT AWAY FROM EQUILIBRIUM
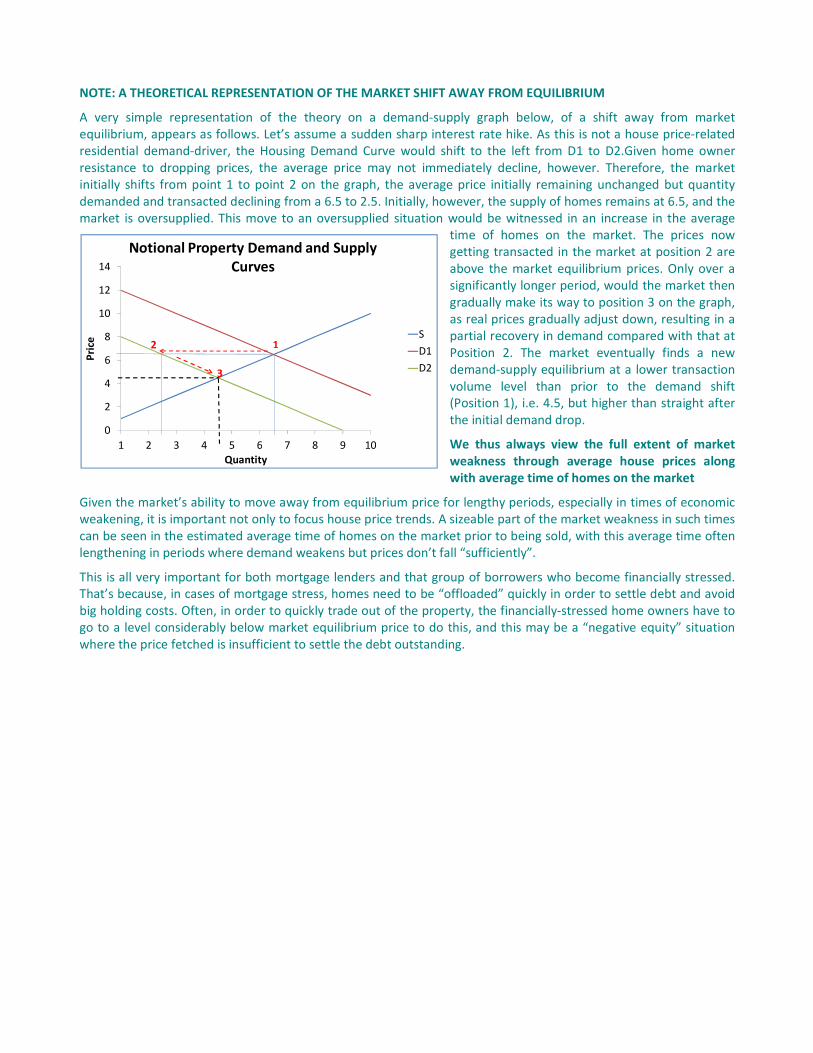
A very simple representation of the theory on a demand-supply graph below, of a shift away from market
equilibrium, appears as follows. Let’s assume a sudden sharp interest rate hike. As this is not a house price-related
residential demand-driver, the Housing Demand Curve would shift to the left from D1 to D2.Given home owner
resistance to dropping prices, the average price may not immediately decline, however. Therefore, the market
initially shifts from point 1 to point 2 on the graph, the average price initially remaining unchanged but quantity
demanded and transacted declining from a 6.5 to 2.5. Initially, however, the supply of homes remains at 6.5, and the
market is oversupplied. This move to an oversupplied situation would be witnessed in an increase in the average
time of homes on the market. The prices now
getting transacted in the market at position 2 are
above the market equilibrium prices. Only over a
significantly longer period, would the market then
gradually make its way to position 3 on the graph,
as real prices gradually adjust down, resulting in a
partial recovery in demand compared with that at
Position 2. The market eventually finds a new
demand-supply equilibrium at a lower transaction
volume level than prior to the demand shift
(Position 1), i.e. 4.5, but higher than straight after
the initial demand drop.
We thus always view the full extent of market
weakness through average house prices along
with average time of homes on the market
Given the market’s ability to move away from equilibrium price for lengthy periods, especially in times of economic
weakening, it is important not only to focus house price trends. A sizeable part of the market weakness in such times
can be seen in the estimated average time of homes on the market prior to being sold, with this average time often
lengthening in periods where demand weakens but prices don’t fall “sufficiently”.
This is all very important for both mortgage lenders and that group of borrowers who become financially stressed.
That’s because, in cases of mortgage stress, homes need to be “offloaded” quickly in order to settle debt and avoid
big holding costs. Often, in order to quickly trade out of the property, the financially-stressed home owners have to
go to a level considerably below market equilibrium price to do this, and this may be a “negative equity” situation
where the price fetched is insufficient to settle the debt outstanding.
0
2
4
6
8
10
12
14
1 2 3 4 5 6 7 8 9 10
Pri
ce
Quantity
Notional Property Demand and Supply
Curves
S
D1
D2
1
3
2