Fm11 ch 15 corporate valuation, value based management, and corporate governance
45
15 - 1 CHAPTER 15 Corporate Valuation, Value-Based Management, and Corporate Governance Corporate Valuation Value-Based Management Corporate Governance
-
Upload
nhu-tuyet-tran -
Category
Documents
-
view
92 -
download
1
Transcript of Fm11 ch 15 corporate valuation, value based management, and corporate governance
15 - 1
CHAPTER 15Corporate Valuation, Value-Based
Management, and Corporate Governance
Corporate ValuationValue-Based ManagementCorporate Governance
15 - 2
Corporate Valuation: List the two types of assets that a
company owns.
Assets-in-place
Financial, or nonoperating, assets
15 - 3
Assets-in-Place
Assets-in-place are tangible, such as buildings, machines, inventory.
Usually they are expected to grow.
They generate free cash flows.
The PV of their expected future free cash flows, discounted at the WACC, is the value of operations.
15 - 4
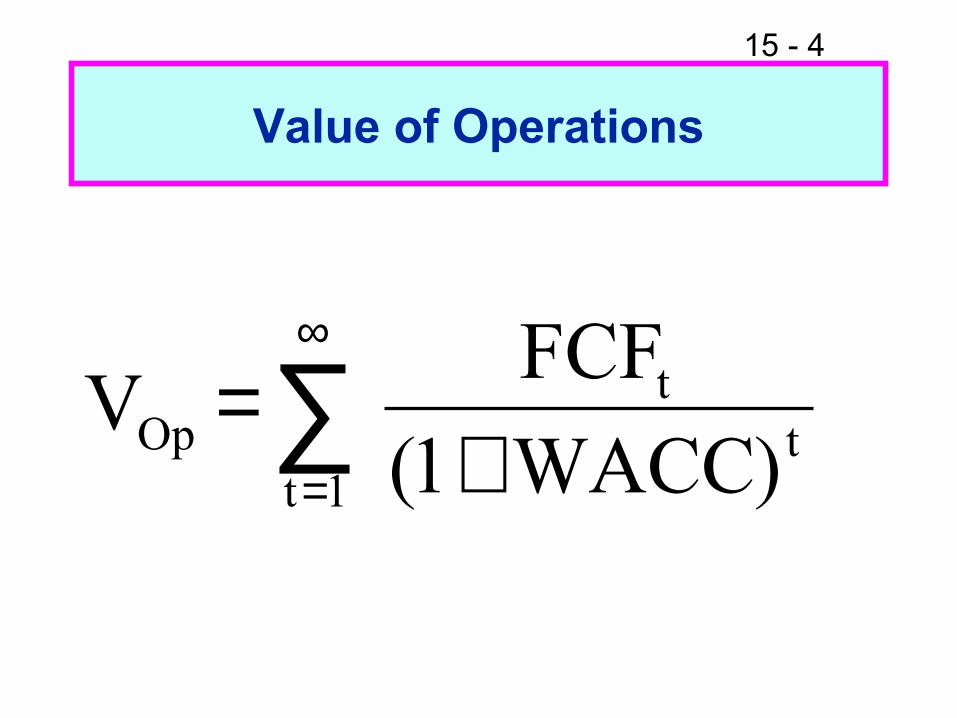
Value of Operations
∑∞
= +=
1tt
tOp )WACC1(
FCFV

15 - 5
Nonoperating Assets
Marketable securities
Ownership of non-controlling interest in another company
Value of nonoperating assets usually is very close to figure that is reported on balance sheets.
15 - 6
Total Corporate Value
Total corporate value is sum of:
Value of operations
Value of nonoperating assets

15 - 7
Claims on Corporate Value
Debtholders have first claim.
Preferred stockholders have the next claim.
Any remaining value belongs to stockholders.
15 - 8
Applying the Corporate Valuation Model
Forecast the financial statements, as shown in Chapter 14.
Calculate the projected free cash flows.
Model can be applied to a company that does not pay dividends, a privately held company, or a division of a company, since FCF can be calculated for each of these situations.
15 - 9
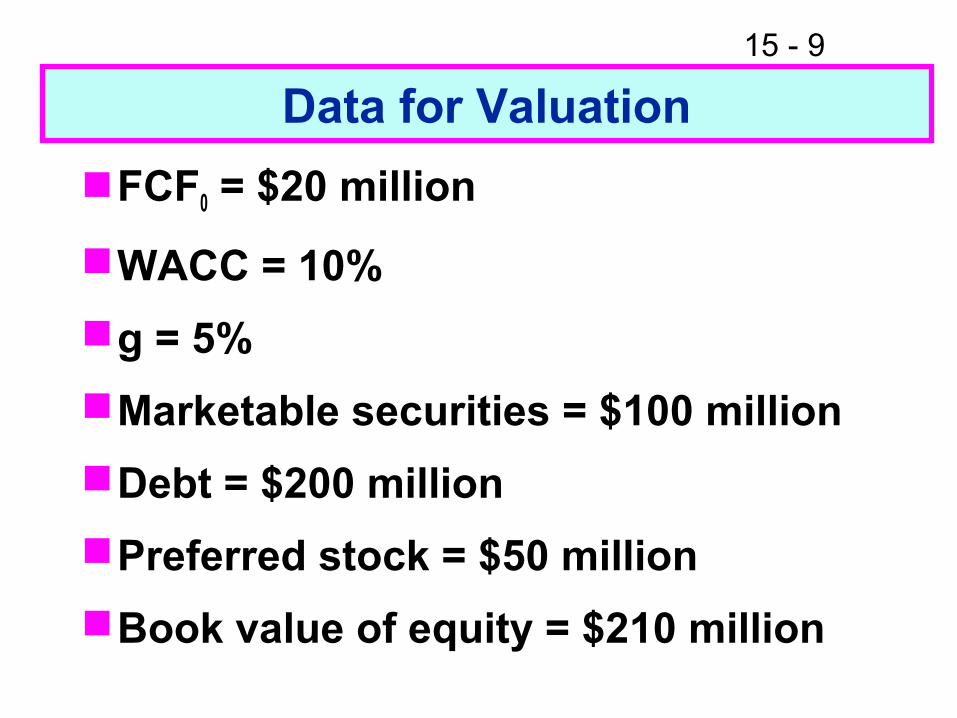
Data for Valuation
FCF0 = $20 million
WACC = 10%
g = 5%
Marketable securities = $100 million
Debt = $200 million
Preferred stock = $50 million
Book value of equity = $210 million
15 - 10
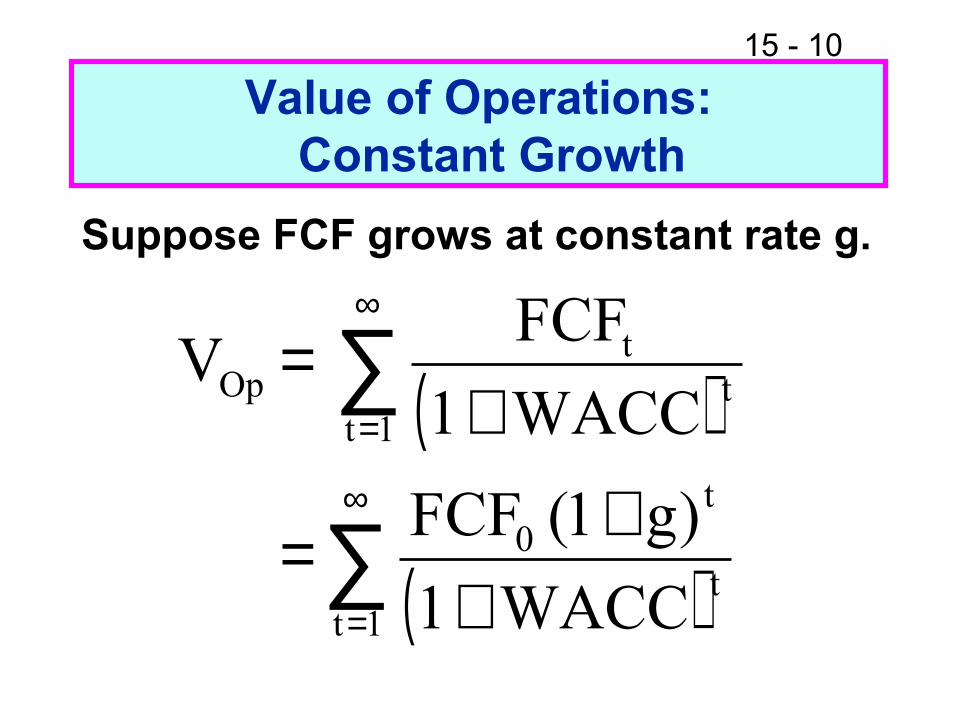
Value of Operations: Constant Growth
Suppose FCF grows at constant rate g.
( )
( )∑
∑∞
=
∞
=
++=
+=
1tt
t0
1tt
tOp
WACC1
)g1(FCF
WACC1
FCFV
15 - 11
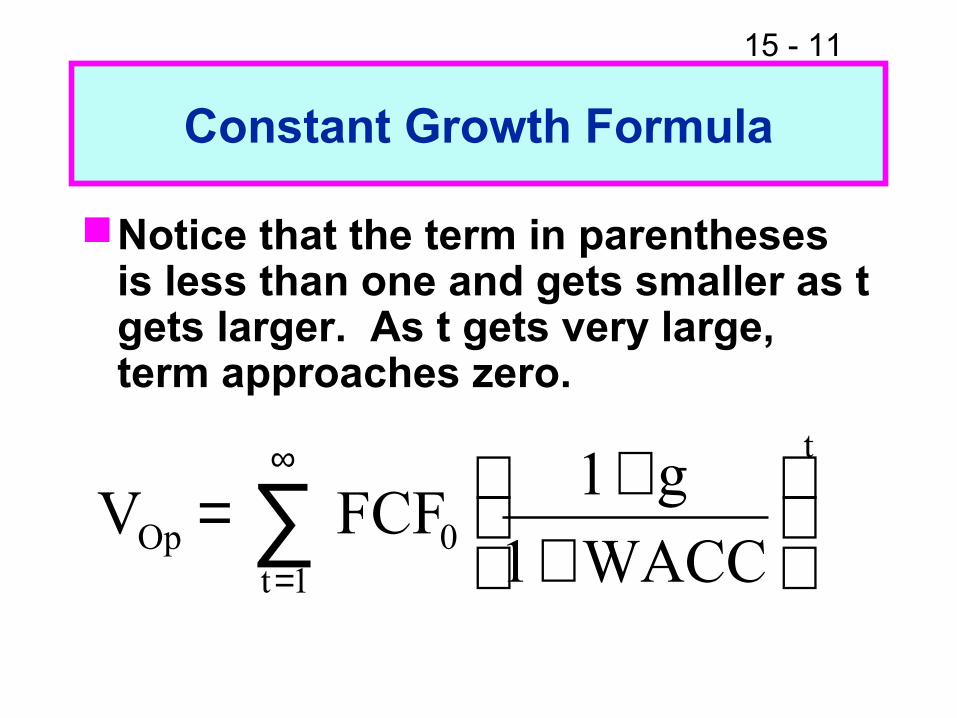
Constant Growth Formula
Notice that the term in parentheses is less than one and gets smaller as t gets larger. As t gets very large, term approaches zero.
∑∞
=
++=
1t
t
0Op WACC1
g1FCFV
15 - 12
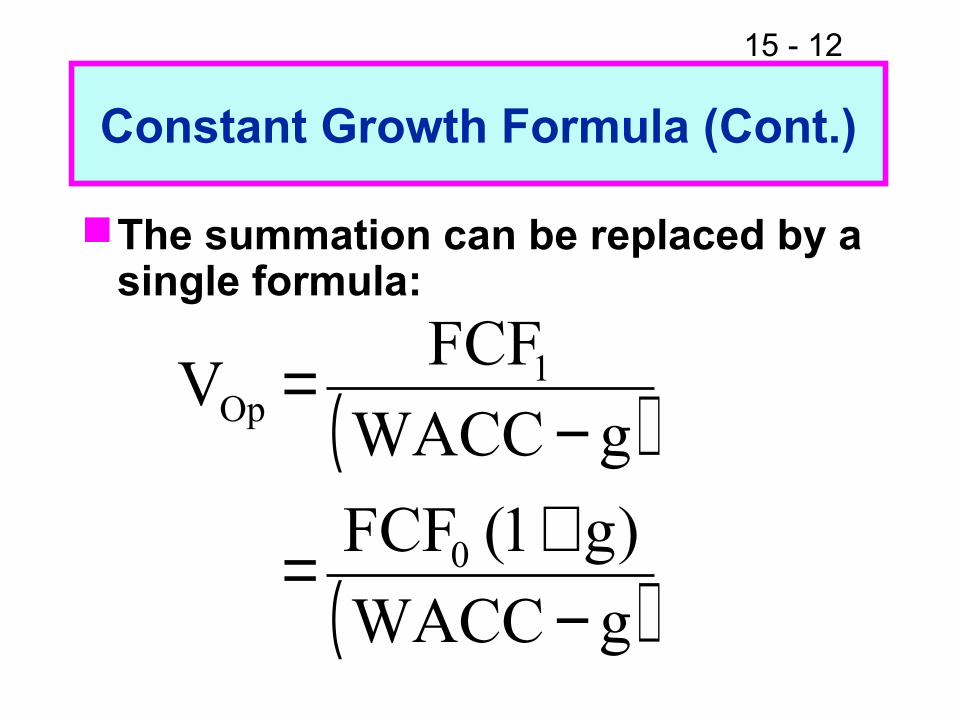
Constant Growth Formula (Cont.)
The summation can be replaced by a single formula:
( )
( )gWACC
)g1(FCF
gWACC
FCFV
0
1Op
−+=
−=
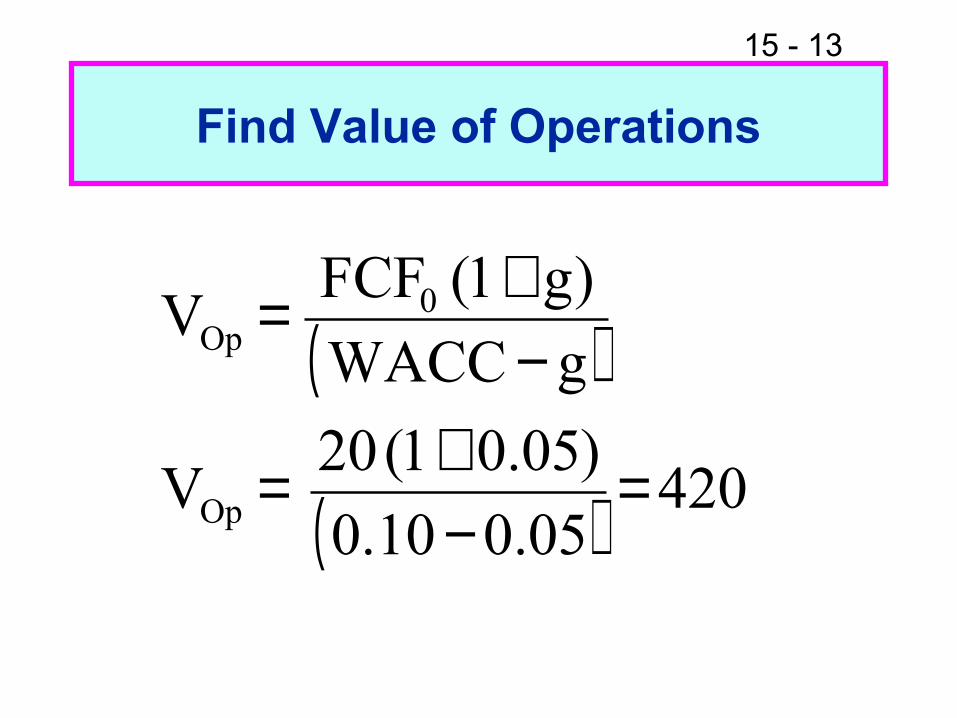
15 - 13
Find Value of Operations
( )
( ) 42005.010.0
)05.01(20V
gWACC
)g1(FCFV
Op
0Op
=−+=
−+=

15 - 14
Value of EquitySources of Corporate Value
Value of operations = $420
Value of non-operating assets = $100
Claims on Corporate Value
Value of Debt = $200
Value of Preferred Stock = $50
Value of Equity = ?
15 - 15
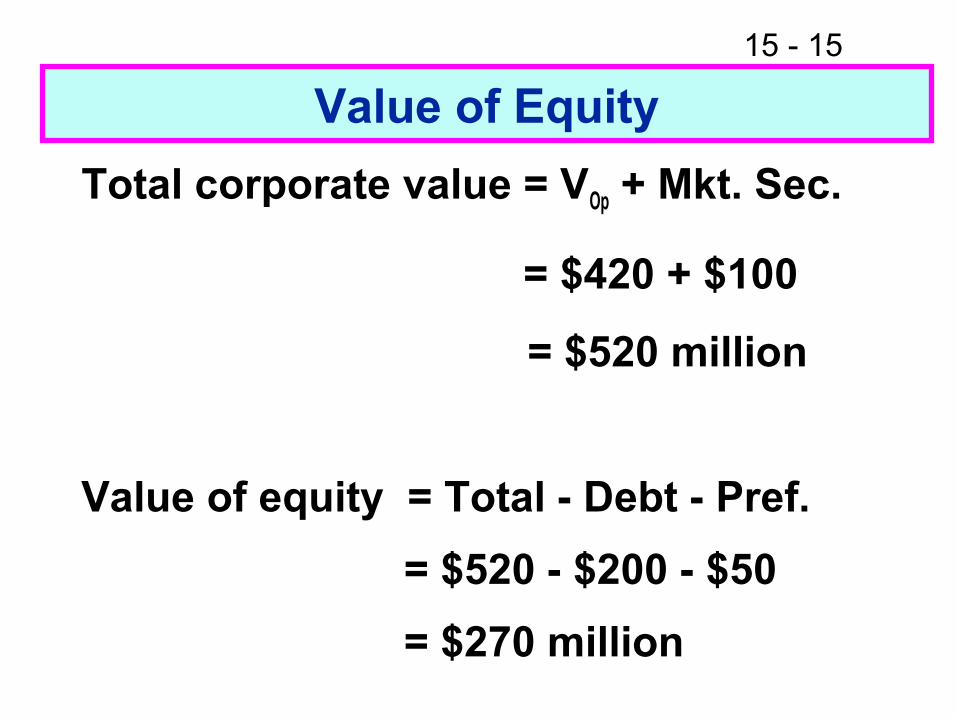
Value of Equity
Total corporate value = VOp + Mkt. Sec.
= $420 + $100
= $520 million
Value of equity = Total - Debt - Pref.
= $520 - $200 - $50
= $270 million
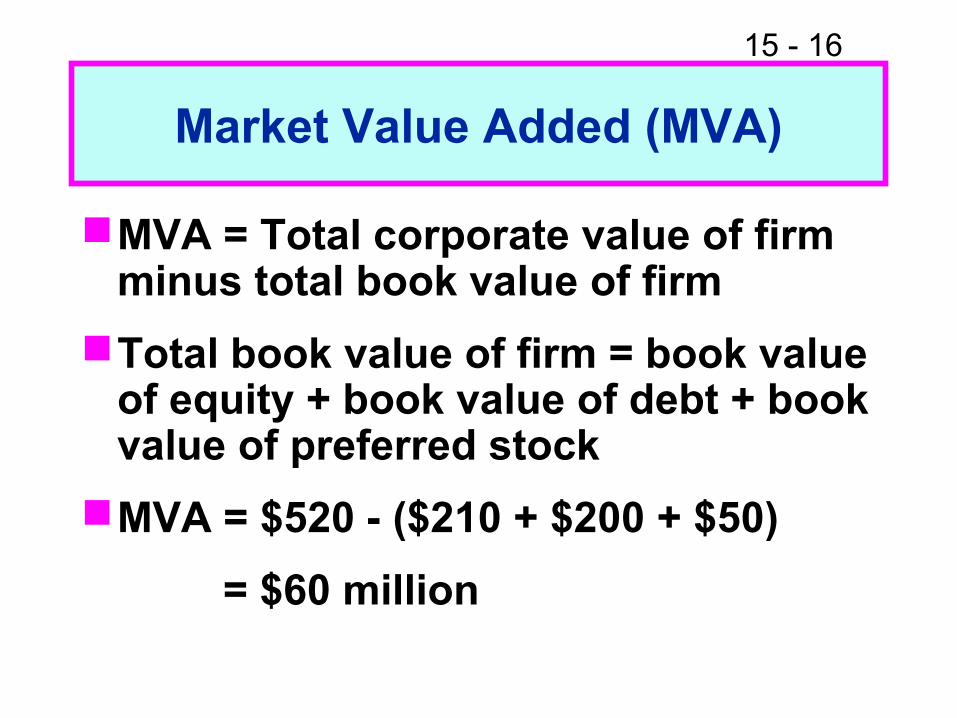
15 - 16
Market Value Added (MVA)
MVA = Total corporate value of firm minus total book value of firm
Total book value of firm = book value of equity + book value of debt + book value of preferred stock
MVA = $520 - ($210 + $200 + $50)
= $60 million
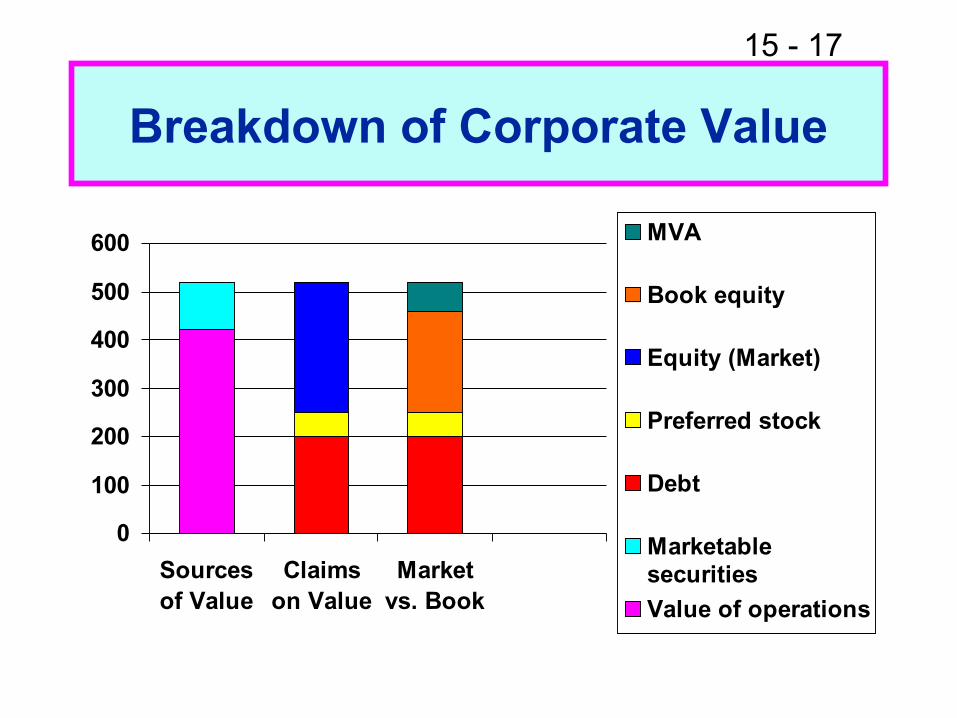
15 - 17
Breakdown of Corporate Value
0
100
200
300
400
500
600
Sourcesof Value
Claimson Value
Marketvs. Book
MVA
Book equity
Equity (Market)
Preferred stock
Debt
Marketablesecurities
Value of operations
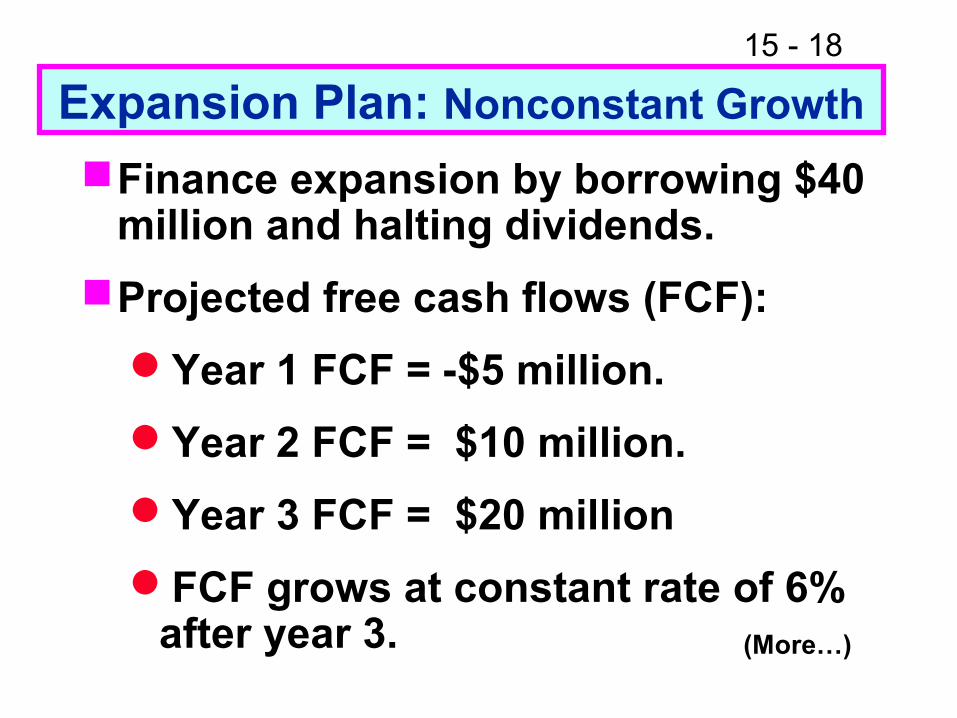
15 - 18
Expansion Plan: Nonconstant Growth
Finance expansion by borrowing $40 million and halting dividends.
Projected free cash flows (FCF):
Year 1 FCF = -$5 million.
Year 2 FCF = $10 million.
Year 3 FCF = $20 million
FCF grows at constant rate of 6% after year 3. (More…)
15 - 19
The weighted average cost of capital, rc, is 10%.
The company has 10 million shares of stock.
15 - 20
Horizon Value
Free cash flows are forecast for three years in this example, so the forecast horizon is three years.
Growth in free cash flows is not constant during the forecast,so we can’t use the constant growth formula to find the value of operations at time 0.
15 - 21
Horizon Value (Cont.)
Growth is constant after the horizon (3 years), so we can modify the constant growth formula to find the value of all free cash flows beyond the horizon, discounted back to the horizon.

15 - 22
Horizon Value Formula
Horizon value is also called terminal value, or continuing value.
( )gWACC
)g1(FCFVHV t
ttimeatOp −+==
15 - 23
Vop at 3
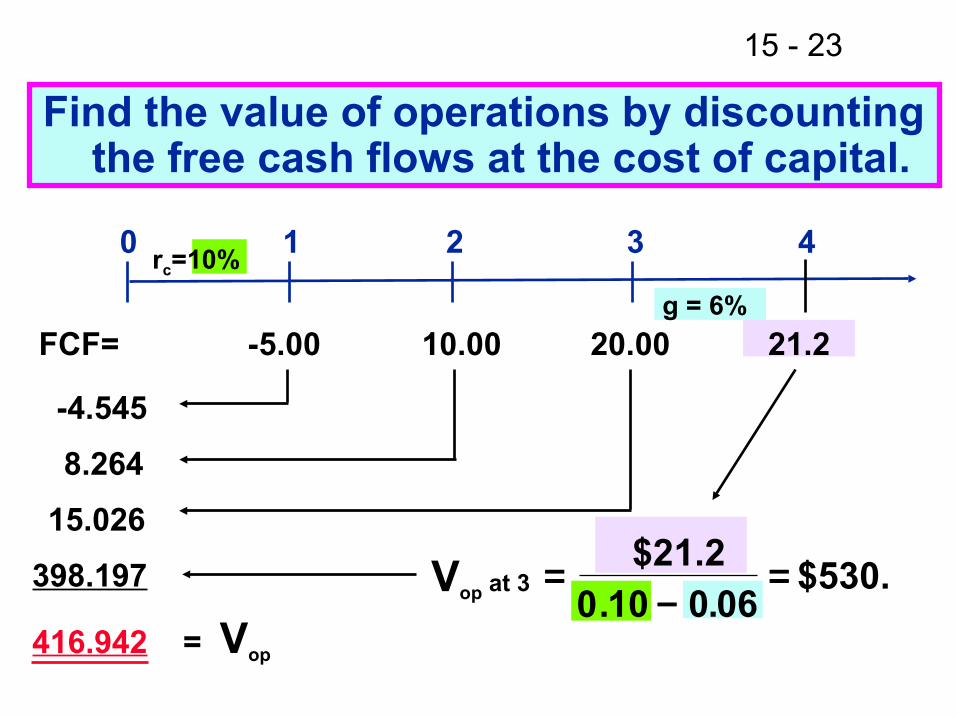
Find the value of operations by discounting the free cash flows at the cost of capital.
0
-4.545
8.264
15.026
398.197
1 2 3 4rc=10%
416.942 = Vop
g = 6%
FCF= -5.00 10.00 20.00 21.2
$21.2. .
$530.10 0 06
=−
=0
15 - 24
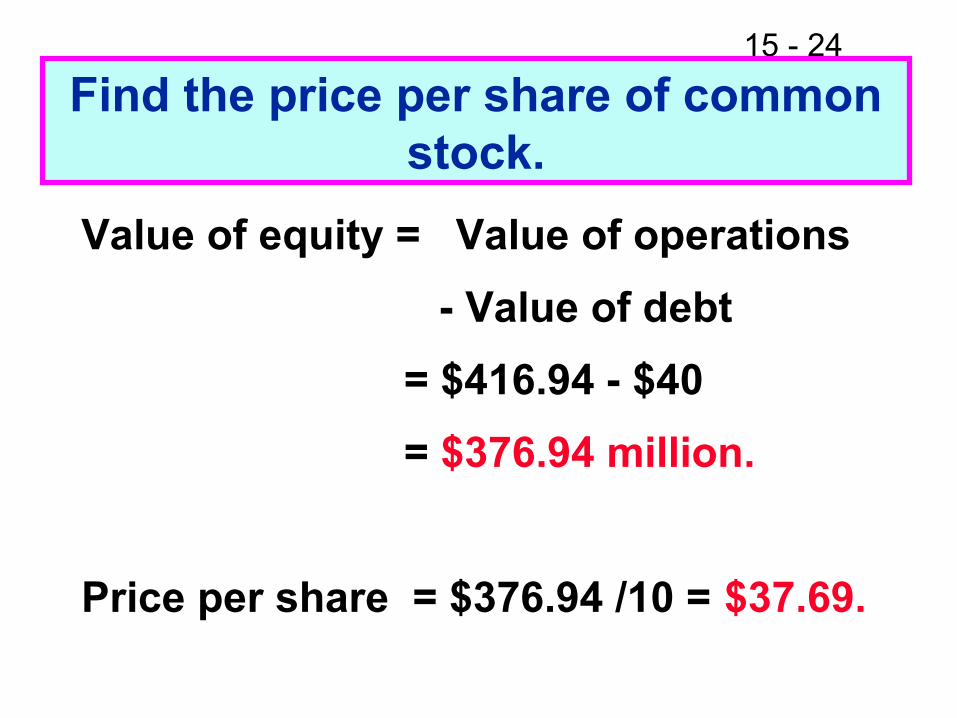
Find the price per share of common stock.
Value of equity = Value of operations
- Value of debt
= $416.94 - $40
= $376.94 million.
Price per share = $376.94 /10 = $37.69.
15 - 25
Value-Based Management (VBM)
VBM is the systematic application of the corporate valuation model to all corporate decisions and strategic initiatives.
The objective of VBM is to increase Market Value Added (MVA)

15 - 26
MVA and the Four Value Drivers
MVA is determined by four drivers:
Sales growth
Operating profitability (OP=NOPAT/Sales)
Capital requirements (CR=Operating capital / Sales)
Weighted average cost of capital
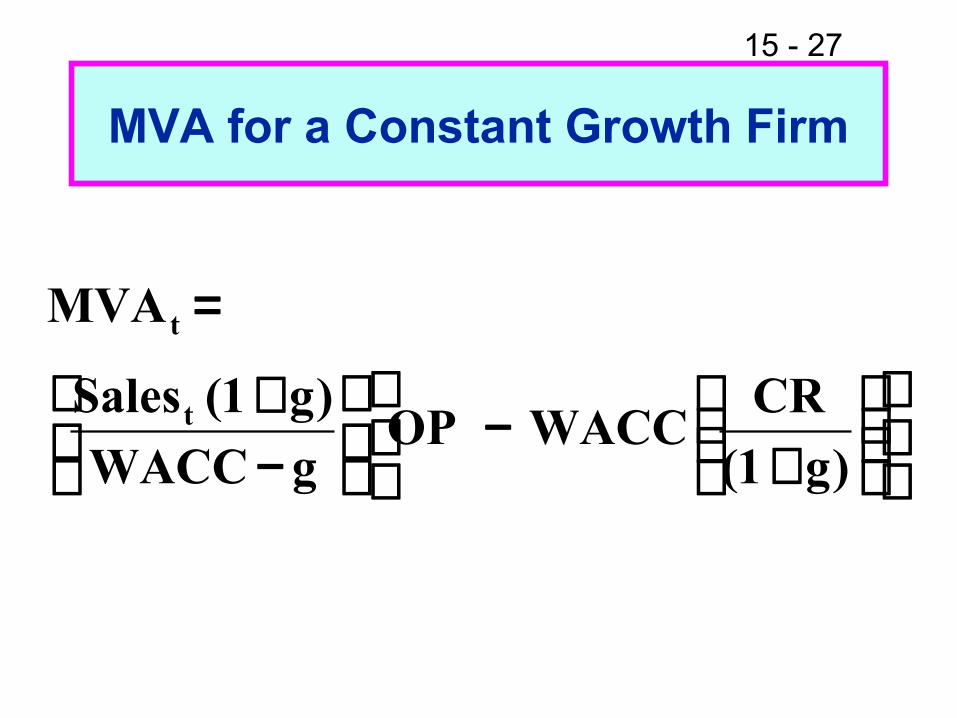
15 - 27
MVA for a Constant Growth Firm
+
−
−+
=
)g1(
CRWACCOP
gWACC
)g1(Sales
MVA
t
t
15 - 28
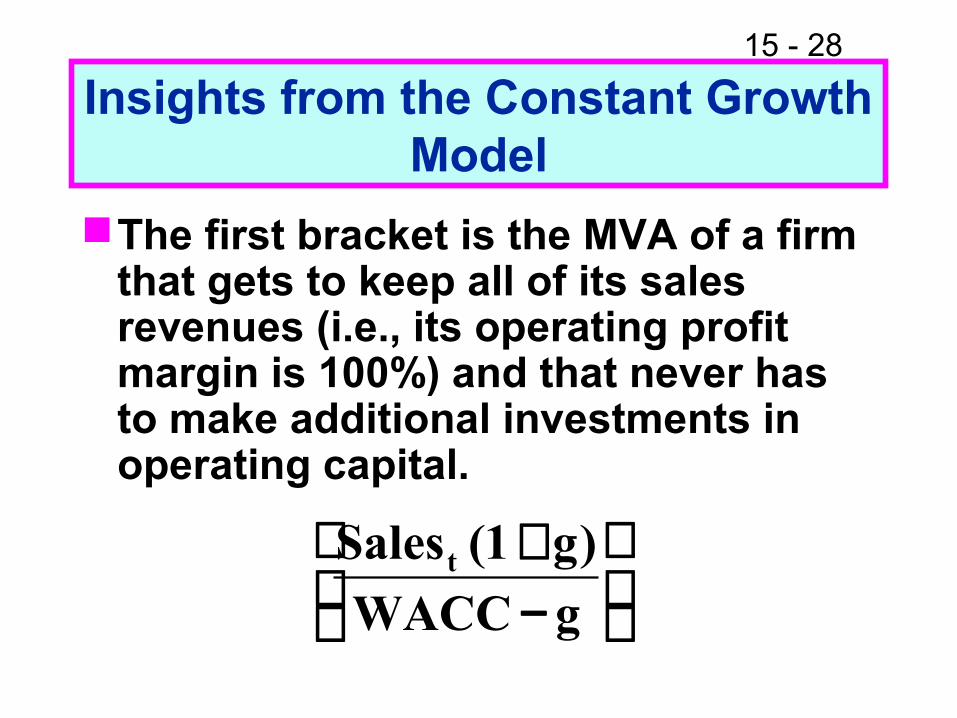
Insights from the Constant Growth Model
The first bracket is the MVA of a firm that gets to keep all of its sales revenues (i.e., its operating profit margin is 100%) and that never has to make additional investments in operating capital.
−+gWACC
)g1(Salest
15 - 29
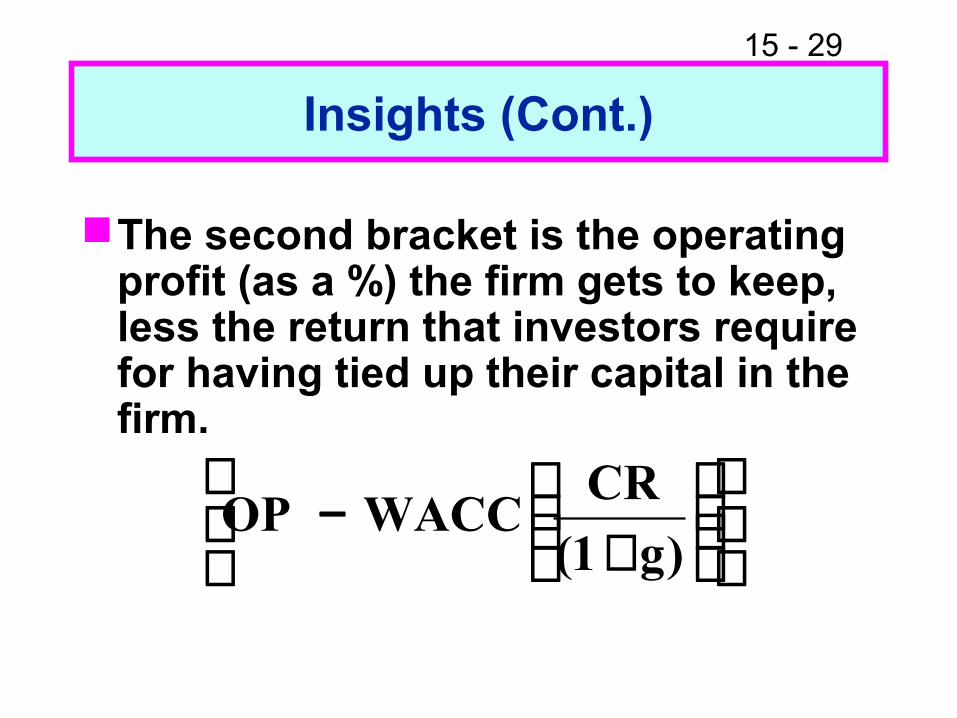
Insights (Cont.)
The second bracket is the operating profit (as a %) the firm gets to keep, less the return that investors require for having tied up their capital in the firm.
+
−)g1(
CRWACCOP
15 - 30
Improvements in MVA due to the Value Drivers
MVA will improve if:
WACC is reduced
operating profitability (OP) increases
the capital requirement (CR) decreases
15 - 31
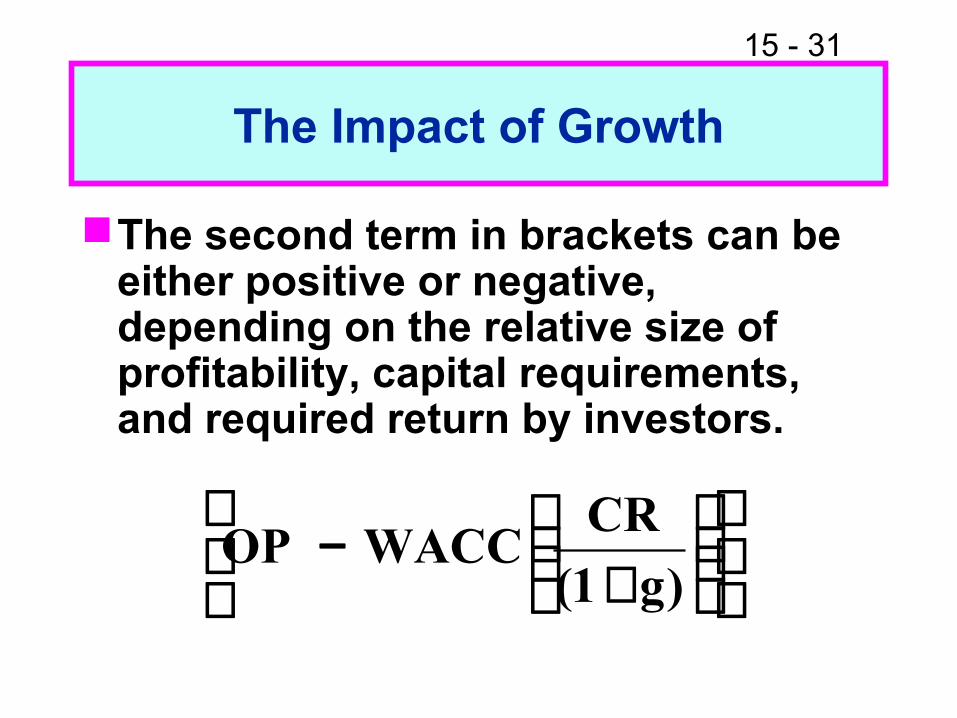
The Impact of Growth
The second term in brackets can be either positive or negative, depending on the relative size of profitability, capital requirements, and required return by investors.
+
−)g1(
CRWACCOP
15 - 32
The Impact of Growth (Cont.)
If the second term in brackets is negative, then growth decreases MVA. In other words, profits are not enough to offset the return on capital required by investors.
If the second term in brackets is positive, then growth increases MVA.
15 - 33
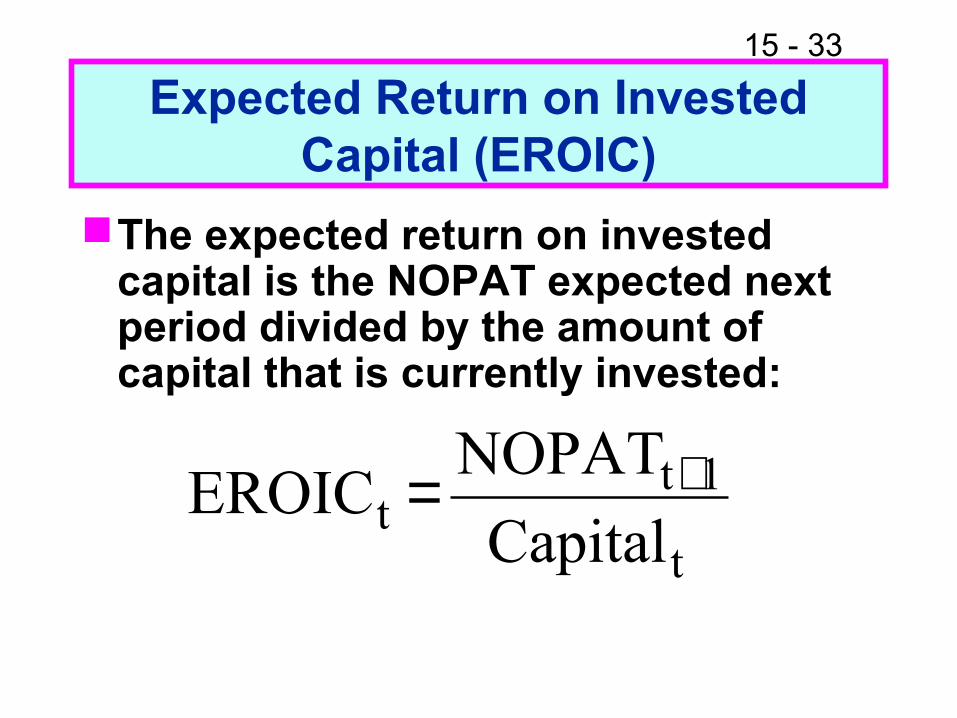
Expected Return on Invested Capital (EROIC)
The expected return on invested capital is the NOPAT expected next period divided by the amount of capital that is currently invested:
t
1tt Capital
NOPATEROIC +=
15 - 34
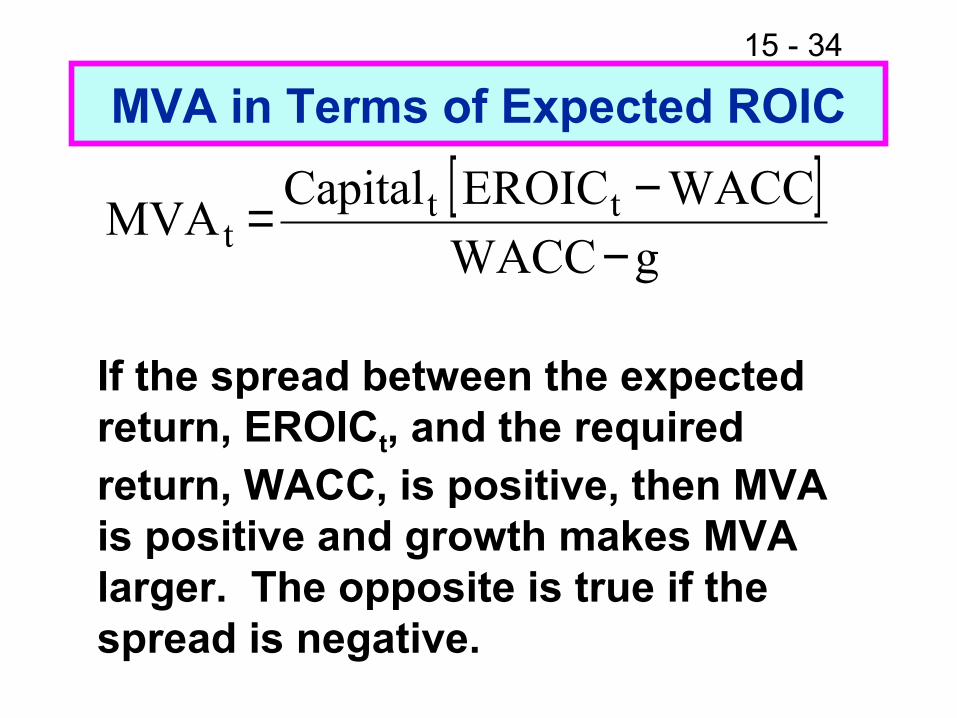
MVA in Terms of Expected ROIC
[ ]gWACC
WACCEROICCapitalMVA tt
t −−=
If the spread between the expected return, EROICt, and the required return, WACC, is positive, then MVA is positive and growth makes MVA larger. The opposite is true if the spread is negative.
15 - 35
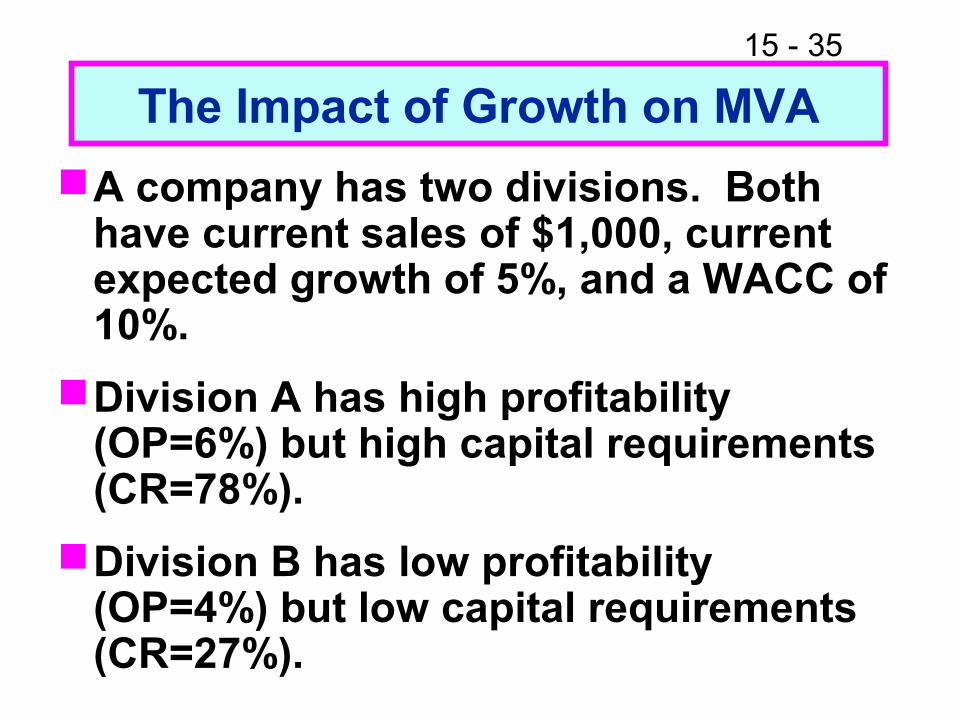
The Impact of Growth on MVA
A company has two divisions. Both have current sales of $1,000, current expected growth of 5%, and a WACC of 10%.
Division A has high profitability (OP=6%) but high capital requirements (CR=78%).
Division B has low profitability (OP=4%) but low capital requirements (CR=27%).

15 - 36
What is the impact on MVA if growth goes from 5% to 6%?
Division A Division B
OP 6% 6% 4% 4%
CR 78% 78% 27% 27%
Growth 5% 6% 5% 6%
MVA (300.0) (360.0) 300.0 385.0
Note: MVA is calculated using the formula on slide 15-27.
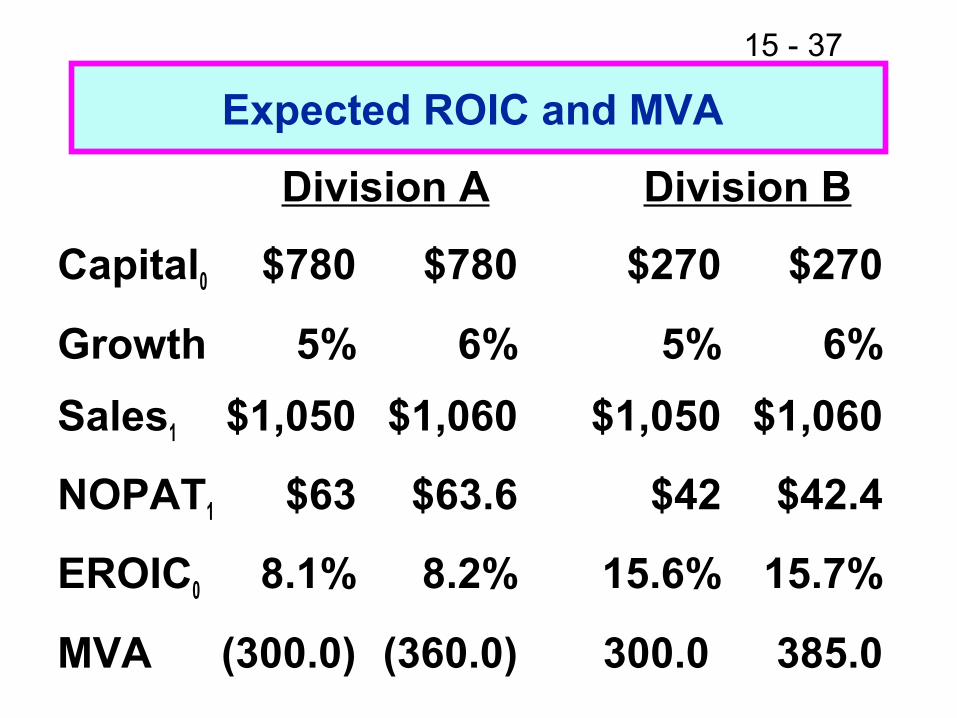
15 - 37
Expected ROIC and MVA
Division A Division B
Capital0 $780 $780 $270 $270
Growth 5% 6% 5% 6%
Sales1 $1,050 $1,060 $1,050 $1,060
NOPAT1 $63 $63.6 $42 $42.4
EROIC0 8.1% 8.2% 15.6% 15.7%
MVA (300.0) (360.0) 300.0 385.0
15 - 38
Analysis of Growth StrategiesThe expected ROIC of Division A is less
than the WACC, so the division should postpone growth efforts until it improves EROIC by reducing capital requirements (e.g., reducing inventory) and/or improving profitability.
The expected ROIC of Division B is greater than the WACC, so the division should continue with its growth plans.
15 - 39
Two Primary Mechanisms of Corporate Governance
“Stick”
Provisions in the charter that affect takeovers.
Composition of the board of directors.
“Carrot: Compensation plans.
15 - 40
Entrenched Management
Occurs when there is little chance that poorly performing managers will be replaced.
Two causes:
Anti-takeover provisions in the charter
Weak board of directors
15 - 41
How are entrenched managers harmful to shareholders?
Management consumes perks:
Lavish offices and corporate jets
Excessively large staffs
Memberships at country clubs
Management accepts projects (or acquisitions) to make firm larger, even if MVA goes down.
15 - 42
Anti-Takeover Provisions
Targeted share repurchases (i.e., greenmail)
Shareholder rights provisions (i.e., poison pills)
Restricted voting rights plans
15 - 43
Board of Directors
Weak boards have many insiders (i.e., those who also have another position in the company) compared with outsiders.
Interlocking boards are weaker (CEO of company A sits on board of company B, CEO of B sits on board of A).
15 - 44
Stock Options in Compensation Plans
Gives owner of option the right to buy a share of the company’s stock at a specified price (called the exercise price) even if the actual stock price is higher.
Usually can’t exercise the option for several years (called the vesting period).
15 - 45
Stock Options (Cont.)
Can’t exercise the option after a certain number of years (called the expiration, or maturity, date).