Fly - Fight - Win - dtcenter.org · Fly - Fight - Win 2d Weather Group Cloud Model Verification at...
47
Fly - Fight - Win 2d Weather Group Cloud Model Verification at the Air Force Weather Agency Matthew Sittel UCAR Visiting Scientist Air Force Weather Agency Offutt AFB, NE Template: 28 Feb 06
Transcript of Fly - Fight - Win - dtcenter.org · Fly - Fight - Win 2d Weather Group Cloud Model Verification at...
Fly - Fight - Win
2d Weather Group
Cloud Model Verification at the Air Force
Weather Agency Matthew Sittel
UCAR Visiting Scientist Air Force Weather Agency
Offutt AFB, NE Template: 28 Feb 06
Fly - Fight - Win
Overview
Cloud Models
Ground Truth
Verification Technique
Sample Statistics
MET Output
2

Fly - Fight - Win
Cloud Models
Three are currently run at AFWA Advect Cloud (ADVCLD)
Quasi-Lagrangian advection using global model winds Diagnostic Cloud Forecast (DCF)
Statistical relation based on recent performance of mesoscale model
Stochastic Cloud Forecast Model (SCFM) Statistical relation based on long-term performance of GFS
model
3

Fly - Fight - Win
Cloud Model Comparison
Model Domain Model Run Frequency
Forecast Time Step
Maximum Forecast
Hour
Grid Spacing
Vertical Layers
ADVCLD Hemispheric 3-hourly 1 hour 12 hours 16th mesh 5 DCF Theater 6-hourly 3 hours 72 hours 16th mesh 5
SCFM Hemispheric 6-hourly 3 hours 84 hours 45, 15 km 9
4

Fly - Fight - Win
Cloud Model Outputs
Total Cloud Amount
Cloud Base Height
Cloud Top Height
Cloud Type (DCF only)
5

Fly - Fight - Win
Cloud Model Outputs
Total Cloud Amount
Cloud Base Height
Cloud Top Height
Cloud Type (DCF only)
6

Fly - Fight - Win
Total Cloud Amount
ADVCLD and SCFM forecast cloud amount to the nearest 1%.
DCF does not…
7

Fly - Fight - Win
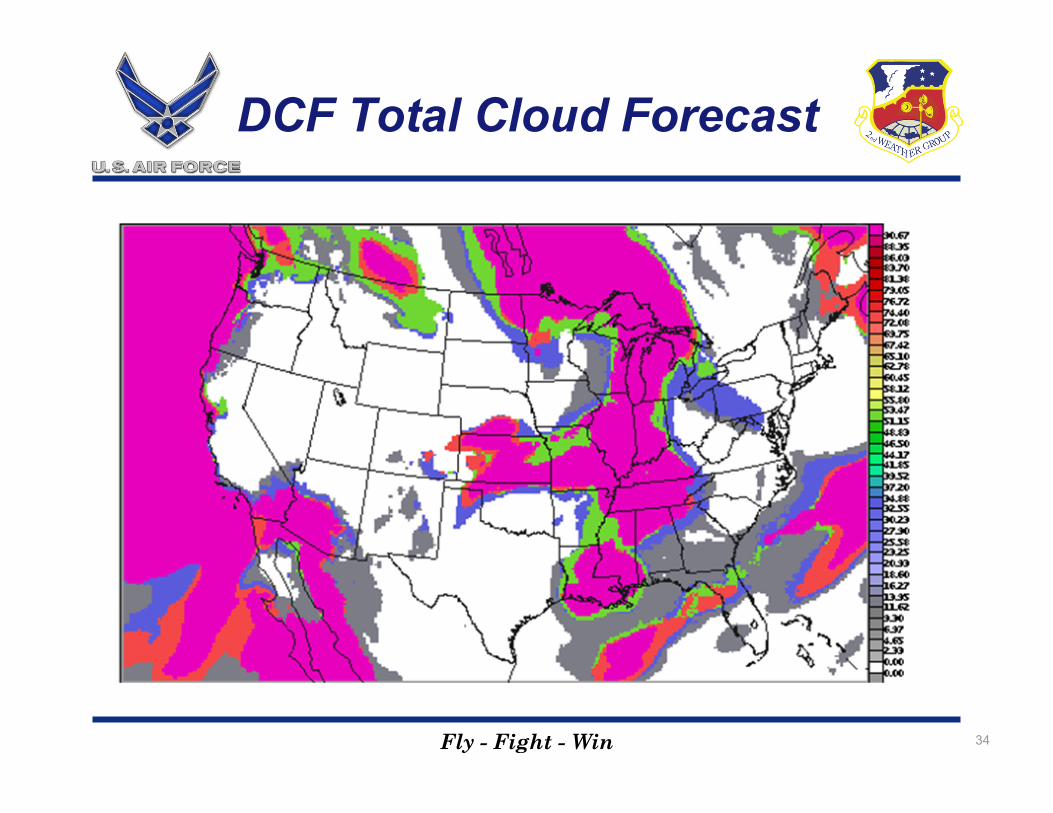
DCF Total Cloud
Cloud Amount Coded Value 0% 0% 1-20% 13% 21-40% 33% 41-60% 53% 61-80% 73% 81-100% 93%
8
SCFM and ADVCLD total cloud forecasts are converted to this categorical scheme when comparing to DCF.
Fly - Fight - Win
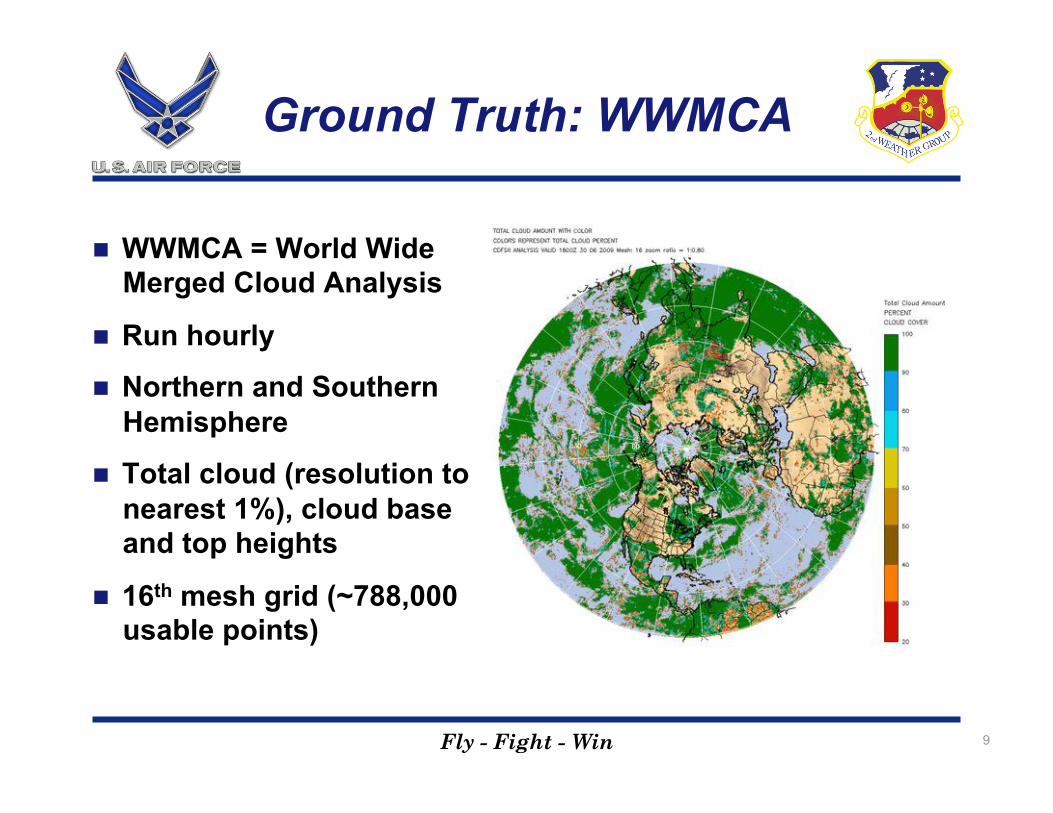
Ground Truth: WWMCA
WWMCA = World Wide Merged Cloud Analysis
Run hourly
Northern and Southern Hemisphere
Total cloud (resolution to nearest 1%), cloud base and top heights
16th mesh grid (~788,000 usable points)
9
Fly - Fight - Win 10
Polar Orbiting Data Geostationary Data
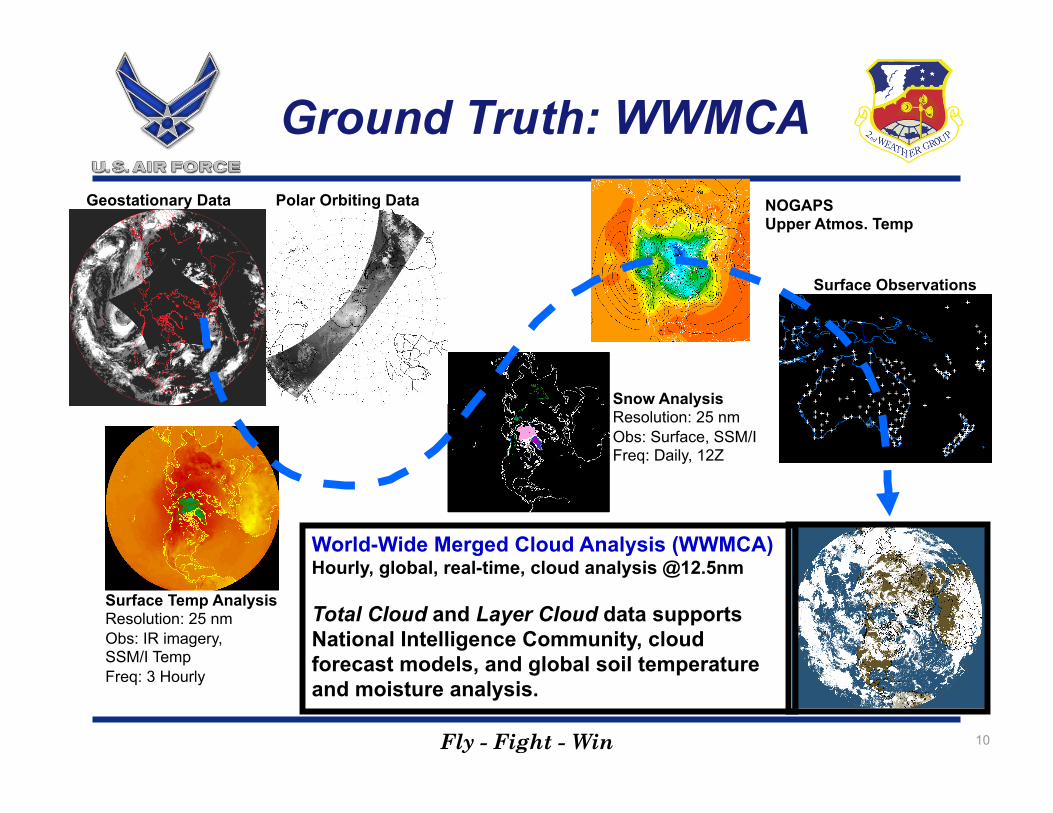
Snow Analysis Resolution: 25 nm Obs: Surface, SSM/I Freq: Daily, 12Z
Surface Temp Analysis Resolution: 25 nm Obs: IR imagery, SSM/I Temp Freq: 3 Hourly
NOGAPS Upper Atmos. Temp
Surface Observations
World-Wide Merged Cloud Analysis (WWMCA) Hourly, global, real-time, cloud analysis @12.5nm
Total Cloud and Layer Cloud data supports National Intelligence Community, cloud forecast models, and global soil temperature and moisture analysis.
Ground Truth: WWMCA

Fly - Fight - Win
WWMCA Components
11
Geostationary Satellites
Polar Orbiting Satellites
Surface Temperature Analysis
Snow Depth Analysis
Upper Air Temperature Data
Surface Observations
Manual QC

Fly - Fight - Win
“A Perfect WWMCA”
All satellites functioning properly
No problems with satellite data transmission
All satellite data received at AFWA correctly/on time
Satellite data conversion is problem-free
Availability of specialized analyses
Decision process is correct (e.g., snow vs. cloud)
Error-free observational data
Correct manual QC
12

Fly - Fight - Win
WWMCA Timeliness
Hemispheric analyses are not snapshots!
Age limits are applied
No data older than 120 minutes are used in verification
13

Fly - Fight - Win
WWMCA Data Counts
14
0
10
20
30
40
50
60
70
80
90
100
Perc
ent D
ata
Avai
labi
lity
Run Date (YYYYMMDDCC)
On average, 82% of WWMCA global data points are usable (~1.29 million data points per run).

Fly - Fight - Win
Verification Technique
Determine model-observation pairs
ADVCLD and SCFM are already co-located with WWMCA ground truth data points
DCF points depend on domain’s map projection
When ADVCLD or SCFM is compared to DCF, use nearest neighbor to map ADVCLD, SCFM and WWMCA to the DCF domain
WWMCA is ‘dumbed down’ to the 6 categories when compared to DCF
Data counts for total cloud contingency table categories (6 for DCF, 101 for ADVCLD, SCFM) are archived for long-term statistics calculations
15

Fly - Fight - Win
Cloud Verification Statistics
Root Mean Square Error
Mean Absolute Deviation
Forecast Bias
20-20 Index
16

Fly - Fight - Win
Cloud Verification Statistics
Root Mean Square Error
Mean Absolute Deviation
Forecast Bias
20-20 Index
17
Fly - Fight - Win
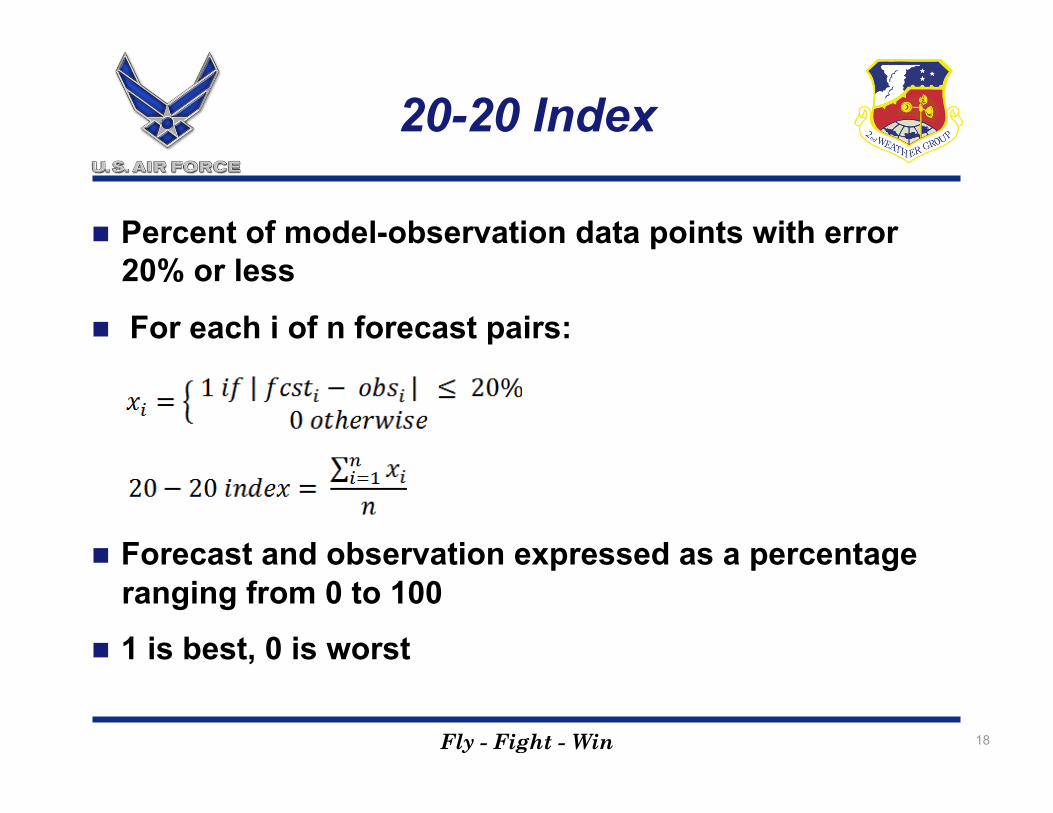
20-20 Index
Percent of model-observation data points with error 20% or less
For each i of n forecast pairs:
Forecast and observation expressed as a percentage ranging from 0 to 100
1 is best, 0 is worst
18

Fly - Fight - Win
Domain-Wide Statistics
19
40
41
42
43
44
45
46
47
48
49
50
6 12 18 24 30 36 42 48
Aver
age
RM
SE
Forecast Hour
June 2009 DCF RMSE

Fly - Fight - Win
Domain-Wide Statistics
20
40
41
42
43
44
45
46
47
48
49
50
6 12 18 24 30 36 42 48
Aver
age
MA
E
Forecast Hour
June 2009 DCF MAE
Fly - Fight - Win
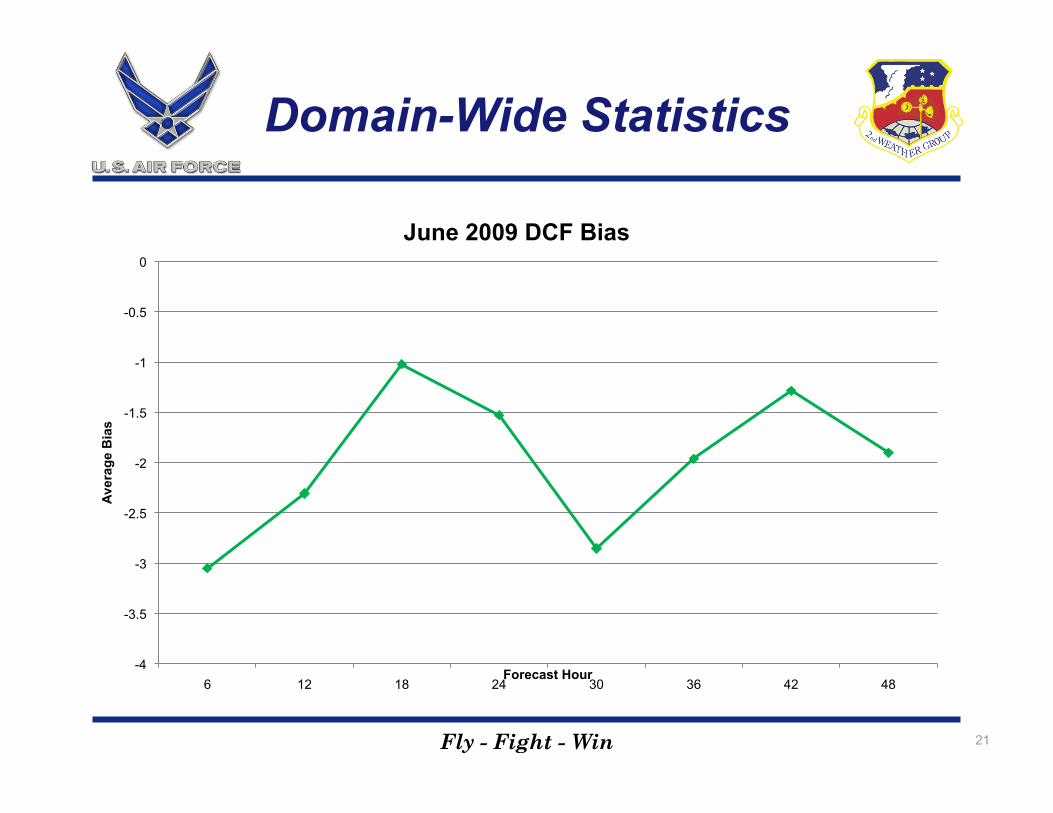
Domain-Wide Statistics
21
-4
-3.5
-3
-2.5
-2
-1.5
-1
-0.5
0
6 12 18 24 30 36 42 48
Aver
age
Bia
s
Forecast Hour
June 2009 DCF Bias
Fly - Fight - Win
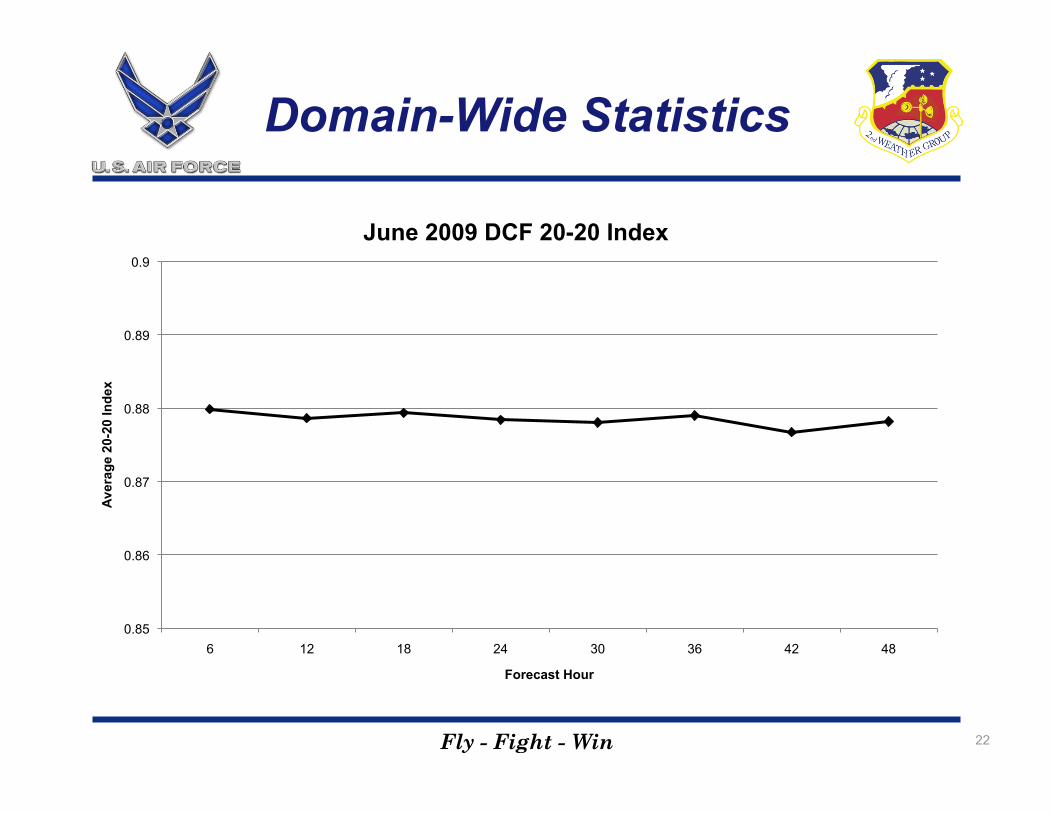
Domain-Wide Statistics
22
0.85
0.86
0.87
0.88
0.89
0.9
6 12 18 24 30 36 42 48
Aver
age
20-2
0 In
dex
Forecast Hour
June 2009 DCF 20-20 Index

Fly - Fight - Win
Sample WWMCA Distribution
23
0
5000
10000
15000
20000
25000
0 2 4 6 8 10
12
14
16
18
20
22
24
26
28
30
32
34
36
38
40
42
44
46
48
50
52
54
56
58
60
62
64
66
68
70
72
74
76
78
80
82
84
86
88
90
92
94
96
98
100
Cou
nt
Total Cloud Percentage
June 30, 00Z (both hemispheres combined) Almost 70% of the data points are 0 or 100%. This is a typical amount.
Fly - Fight - Win
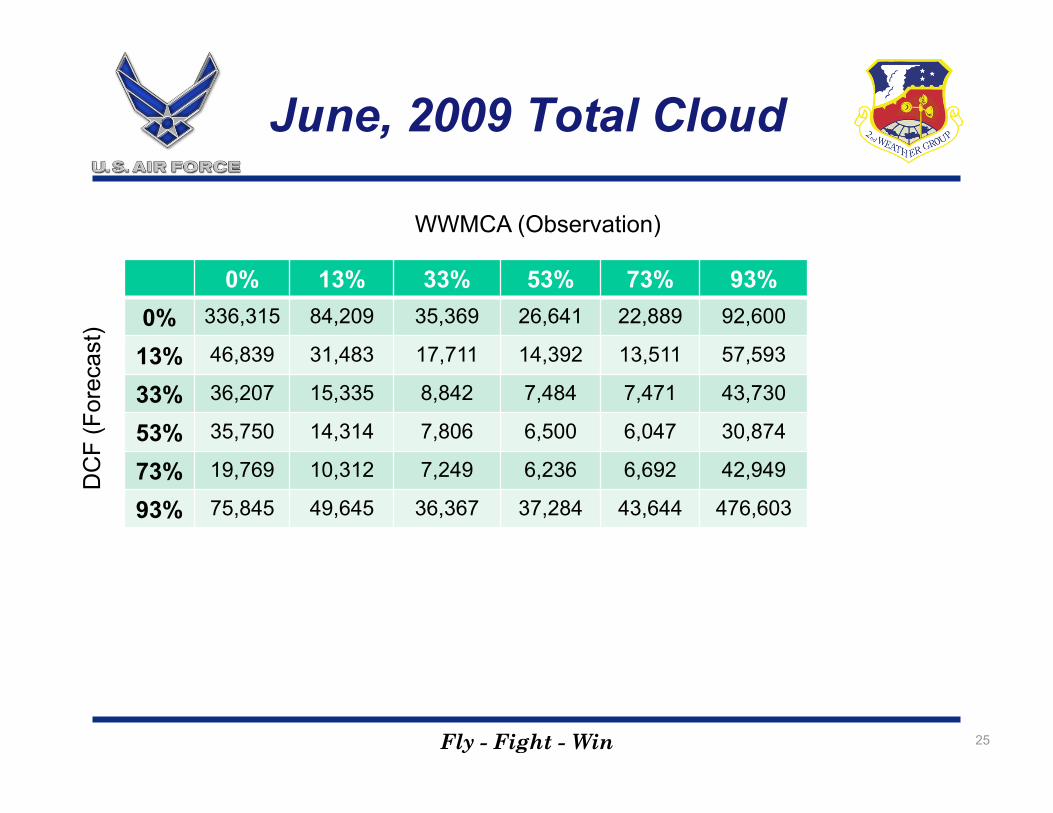
Sample Contingency Tables
24
24-hour total cloud forecasts
CONUS domain
18Z model run
30 day totals: June 1-30, 2009
6 DCF cloud categories = 6x6 table
Fly - Fight - Win
June, 2009 Total Cloud
0% 13% 33% 53% 73% 93% 0% 336,315 84,209 35,369 26,641 22,889 92,600
13% 46,839 31,483 17,711 14,392 13,511 57,593
33% 36,207 15,335 8,842 7,484 7,471 43,730
53% 35,750 14,314 7,806 6,500 6,047 30,874
73% 19,769 10,312 7,249 6,236 6,692 42,949
93% 75,845 49,645 36,367 37,284 43,644 476,603
25
WWMCA (Observation)
DC
F (F
orec
ast)

Fly - Fight - Win
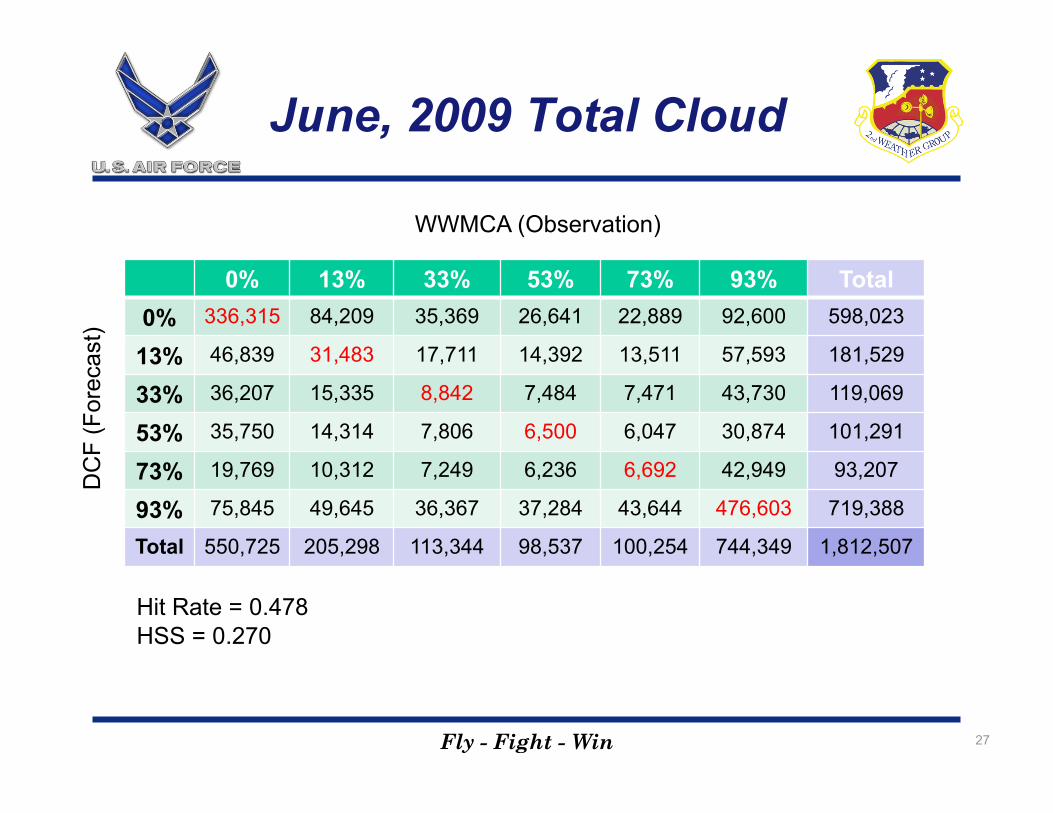
June, 2009 Total Cloud
0% 13% 33% 53% 73% 93% Total 0% 336,315 84,209 35,369 26,641 22,889 92,600 598,023
13% 46,839 31,483 17,711 14,392 13,511 57,593 181,529
33% 36,207 15,335 8,842 7,484 7,471 43,730 119,069
53% 35,750 14,314 7,806 6,500 6,047 30,874 101,291
73% 19,769 10,312 7,249 6,236 6,692 42,949 93,207
93% 75,845 49,645 36,367 37,284 43,644 476,603 719,388
Total 550,725 205,298 113,344 98,537 100,254 744,349 1,812,507
26
WWMCA (Observation)
DC
F (F
orec
ast)
Fly - Fight - Win
June, 2009 Total Cloud
0% 13% 33% 53% 73% 93% Total 0% 336,315 84,209 35,369 26,641 22,889 92,600 598,023
13% 46,839 31,483 17,711 14,392 13,511 57,593 181,529
33% 36,207 15,335 8,842 7,484 7,471 43,730 119,069
53% 35,750 14,314 7,806 6,500 6,047 30,874 101,291
73% 19,769 10,312 7,249 6,236 6,692 42,949 93,207
93% 75,845 49,645 36,367 37,284 43,644 476,603 719,388
Total 550,725 205,298 113,344 98,537 100,254 744,349 1,812,507
27
WWMCA (Observation)
DC
F (F
orec
ast)
Hit Rate = 0.478 HSS = 0.270

Fly - Fight - Win
June, 2009 Total Cloud
0% 13% 33% 53% 73% 93% 0% 336,315 84,209 35,369 26,641 22,889 92,600
13% 46,839 31,483 17,711 14,392 13,511 57,593
33% 36,207 15,335 8,842 7,484 7,471 43,730
53% 35,750 14,314 7,806 6,500 6,047 30,874
73% 19,769 10,312 7,249 6,236 6,692 42,949
93% 75,845 49,645 36,367 37,284 43,644 476,603
28
WWMCA (Observation)
DC
F (F
orec
ast)
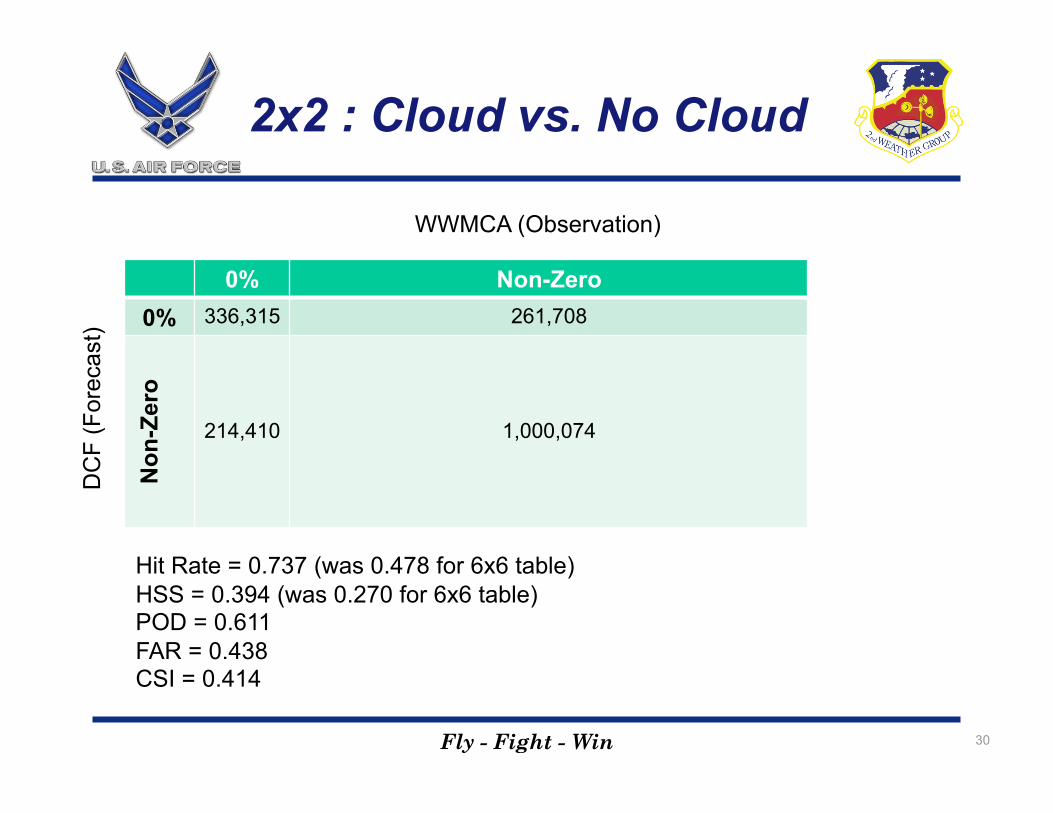
Let’s simplify to a 2x2 contingency table – cloud vs. no cloud

Fly - Fight - Win
2x2 : Cloud vs. No Cloud
0% Non-Zero 0% 336,315 261,708
Non
-Zer
o
214,410 1,000,074
29
WWMCA (Observation)
DC
F (F
orec
ast)
Fly - Fight - Win
2x2 : Cloud vs. No Cloud
0% Non-Zero 0% 336,315 261,708
Non
-Zer
o
214,410 1,000,074
30
WWMCA (Observation)
DC
F (F
orec
ast)
Hit Rate = 0.737 (was 0.478 for 6x6 table) HSS = 0.394 (was 0.270 for 6x6 table) POD = 0.611 FAR = 0.438 CSI = 0.414
Fly - Fight - Win
Using MET MODE
MET = Model Evaluation Tools
MODE = Method for Object-Based Diagnostic Evaluation Tool
How does MODE perform with cloud forecasts?
31

Fly - Fight - Win
MET MODE Example
Total Cloud Cover
Sample Event: July 15, 2009 06Z Model Run, 6-hour forecast
15 km CONUS DCF vs. 16th mesh WWMCA (~24 km)
WWMCA is re-mapped to exactly match the DCF domain for use in MODE
32

Fly - Fight - Win
Resolving Objects: Threshold
DCF is already limited to 6 categories
Non-zero cloud amounts are dominated by 100% cases
All 100% cases are coded as 93% in DCF
Threshold is the 93% DCF category (81-100% cloud)
Used “ge81.0” for both raw forecast and observation value in the configuration file
33
Fly - Fight - Win
DCF Total Cloud Forecast
34

Fly - Fight - Win
WWMCA Ground Truth
35

Fly - Fight - Win
IR Satellite Image
36

Fly - Fight - Win
WWMCA Ground Truth
37
Satellite Pass Boundary
Terrain?

Fly - Fight - Win
WWMCA Objects, > 0 gs (Default)
38

Fly - Fight - Win
MODE Defaults
Area Threshold for Objects: 0 grid squares (gs)
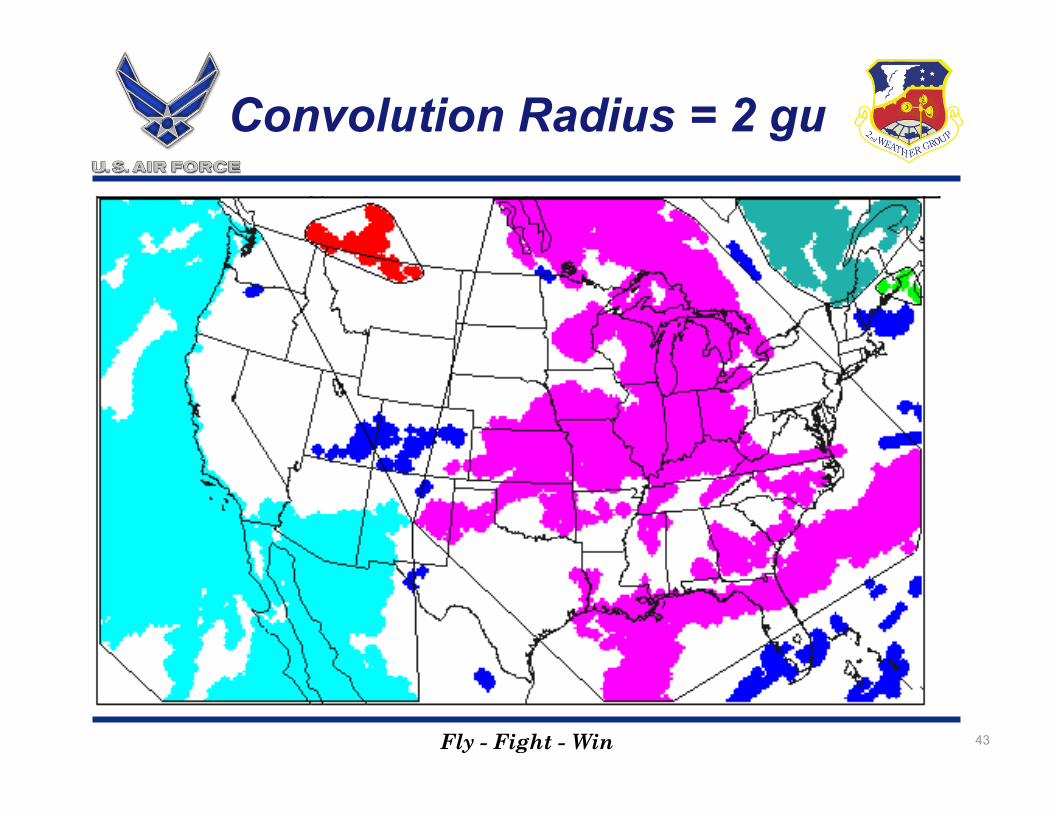
Convolution Radius: 4 grid units (gu)
Is there any benefit to changing these?
39

Fly - Fight - Win
WWMCA Objects, > 50 gs
40

Fly - Fight - Win
WWMCA Objects, > 100 gs
41

Fly - Fight - Win
Convolution Radius = 4 gu (Default, Objects set to 50 gs)
42
Fly - Fight - Win
Convolution Radius = 2 gu
43

Fly - Fight - Win
Convolution Radius = 1 gu
44

Fly - Fight - Win
MODE Summary Plot (using Defaults)
45
Fly - Fight - Win
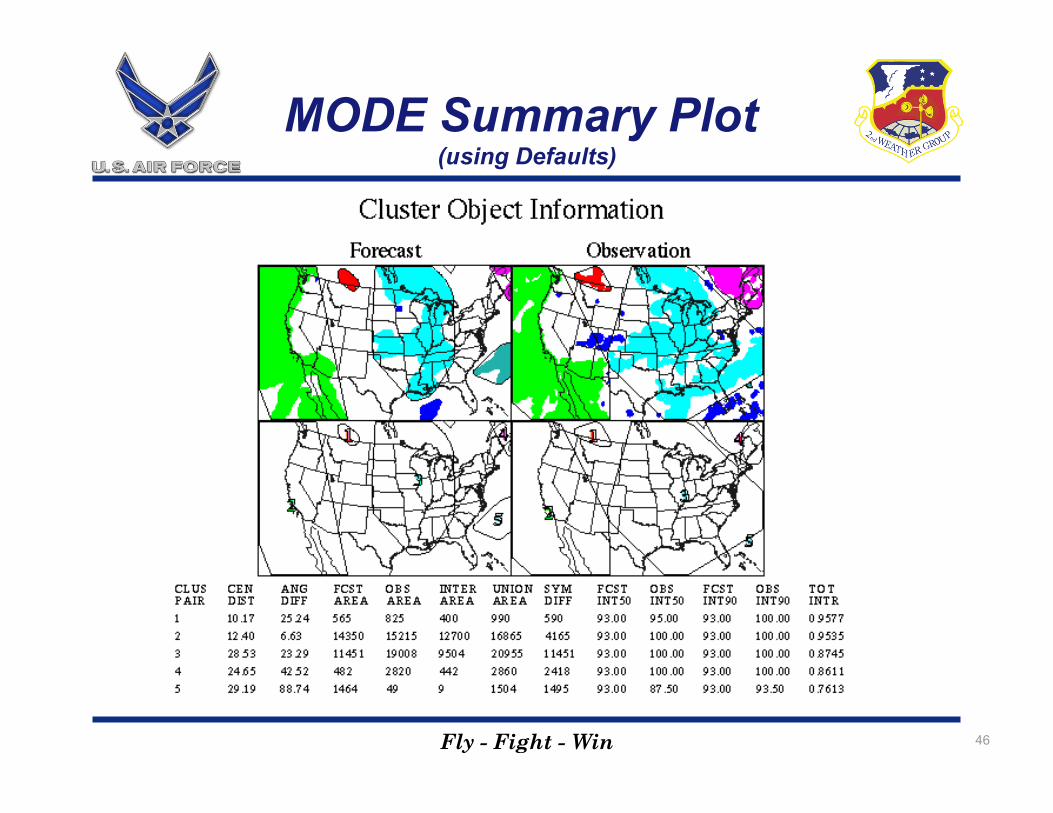
MODE Summary Plot (using Defaults)
46
Fly - Fight - Win
Diagnosing DCF Performance
How is MODE best used for cloud model verification? Domain-wide summaries?
dominated by large objects? Noisy WWMCA adds to the challenge
Geographic subregions? “Persistent objects” (e.g., Coastal stratus)
47