Fly Ash - Caltrans - California Department of Transportation€¦ · · 2016-12-19Fly Ash ....
25
Fly Ash Current and Future Supply A Joint Effort Between Concrete Task Group of the Caltrans Rock Products Committee and Industry
Transcript of Fly Ash - Caltrans - California Department of Transportation€¦ · · 2016-12-19Fly Ash ....

Fly Ash Current and Future Supply
A Joint Effort Between Concrete Task Group of the Caltrans Rock Products Committee and Industry

Office of Structural Materials
pg. i
Thanks to the Concrete Task Group: Charley Rea Director of Communications & Policy CalCIMA
Charles Suszko, P.E. Chief Office of Construction Engineering Materials Engineering & Testing Services Caltrans
Keith Hoffman, P.E. Acting Chief Office of Structural Materials Materials Engineering & Testing Services Caltrans
Ken Darby, P.E. Acting Chief Office of Concrete Pavements Office of Construction Engineering Caltrans
Kirk McDonald V.P. Technical Services - Cement Group Cal Portland
Special Thanks to: Bruce Carter, P.E. Southwest Concrete Pavement Association
Corey Gardner, P.E. Structural Materials Representative Material Engineering & Testing Services Caltrans / Alta Vista Solutions
Doug Yeggy Technical Sales Representative Headwaters Incorporated Edgar Benitez Technical Services Manager Forterra Jacquelyn Wong, P.E. Concrete Materials Testing Branch Chief, Acting Office of Structural Materials, METS-DES Caltrans James Carusone Vice President - Business Development Salt River Materials Group
Jay Lukkarila Mining Engineer 3M Industrial Minerals Products Division
Jeff Hearne Vice President of Quality Assurance Salt River Materials Group
James Sagar, P.E. Concrete Materials Testing Branch Chief Office of Structural Materials, METS-DES Caltrans Jinesh Mehta, P.E. Vice President Quality at Alta Vista Solutions Caltrans/Alta Vista Solutions
Juan Maiz Regional Engineering Manager Northern California Oldcastle Precast
Julia Rockenstein Assistant Structural Materials Representative Material Engineering & Testing Services Caltrans
Ken Sears Area Sales Manager, Western Region Headwaters Incorporated

Office of Structural Materials
pg. ii
Leah Budu, P.E. Chief, Quality Assurance and Source Inspection Branch, Vallejo Materials Engineering and Testing Services Caltrans
Mark Hill Director Technical Services CEMEX Maurice Sanchez Northern California Sales Representative Sika Mike Donovan, P.E., FACI President Geofortis Patrick Frawly P.E. Director of Quality Assurance Central Concrete
Pete Conlin Teichert Construction Russell Tripp P.E. California Engineer/Director American Concrete Pipe Association
Tom Adams, P.E. Technical Sales Representative Nevada Cement Venkatesh Iyer, PhD, P.E Senior Principal Engineer Amec Foster Wheeler Caltrans/AMECFW
Vijay Jain, PhD, P.E. Cementitious Materials Specialist Materials Engineering and Testing Services Caltrans

Office of Structural Materials
pg. iii
TABLE OF CONTENTS Executive Summary .................................................................................................................................... 1
Background ................................................................................................................................................. 3
Historical Fly Ash Use and Shortages ...................................................................................................... 3
Environmental regulations ........................................................................................................................ 4
Industry specifications .............................................................................................................................. 5
Recent Fly Ash Shortage ............................................................................................................................ 6
Lower Power Demand Due to Warm Weather ......................................................................................... 6
Economic Shutdowns from Cheap Natural Gas........................................................................................ 6
Power Plant Retirement Due to Environmental Regulations .................................................................... 8
Unique Issues to California ....................................................................................................................... 8
Long Term Outlook for Fly Ash Supply ................................................................................................... 9
Fly Ash Production and Utilization .......................................................................................................... 9
Environmental Regulations ..................................................................................................................... 11
Mitigating the Effects of a Fly Ash Shortage .......................................................................................... 13
Recovering Fly Ash from Dump Sites .................................................................................................... 13
Constructing Large Storage Silos ........................................................................................................... 13
Class C Fly Ash ...................................................................................................................................... 13
Slag ......................................................................................................................................................... 14
Silica Fume ............................................................................................................................................. 14
Metakaolin .............................................................................................................................................. 14
Rice Hull Ash .......................................................................................................................................... 15
Natural Pozzolan ..................................................................................................................................... 15
Recycled Glass ........................................................................................................................................ 15
Lithium .................................................................................................................................................... 16
Limestone Dust ....................................................................................................................................... 16
Blended Cements .................................................................................................................................... 17
Blended SCMs ........................................................................................................................................ 17
REFERENCES. .......................................................................................................................................... 18
APPENDIX ................................................................................................................................................. 19

Office of Structural Materials
pg. 1
Executive Summary
Fly ash is a byproduct of coal-fired power plants, it has been historically viewed as a waste product. However, because of results from studies by the construction industry and rulings by the Environmental Protection Agency on the benefits of using fly ash, it has become an important component in concrete and other construction materials. Fly ash enhances concrete workability, increases ultimate strength, protects reinforcement steel, and prevents harmful chemical reactions in the concrete mix. Currently the US produces about 50 million short tons of fly ash, nearly none of which is produced in California, and uses around 50% of that amount annually.
The availability of fly ash is a concern to Caltrans, since it is the most common supplementary cementitious material (SCM) used in concrete to meet Caltrans specifications. Caltrans specifications call for the use of SCMs to both mitigate alkali silica reactivity (ASR) in concrete and for lower greenhouse gas (GHG) intensive concrete mixes. The requirement to use fly ash or other SCM for ASR mitigation dates back to 1998. It has typically required a minimum SCM/fly ash amount of 25%, unless the aggregate source can be proved innocuous, in which case only 15% SCM/fly ash is required. In addition, Caltrans amended its specifications in 2010 to allow for less energy intensive concrete mixes by removing the minimum requirements for the amount of cement, removing maximum limits on the amount of fly ash and other SCMs, and allowing the blending of up to 3 cement/SCM materials in concrete mixes. The result is that Caltrans projects consume about one-third of the fly ash used in California, or about 375,000 tons of the roughly 1-million-tons of fly ash used in California annually.
The US experienced a fly ash shortage in the winter and spring of 2016. Approximately a month after the shortage, the Caltrans and Industry Rock Products Committee (RPC) members discussed the issue and approved a scoping document to investigate the shortage of fly ash. A few months after the effort by the RPC began, American Association of State Highway Transportation Officials (AASHTO) formed a similar group to conduct a survey of Department of Transportation (DOTs) to study the issue. This shortage was due to many factors including: lower electric power demand due to unseasonably warm weather; seasonal shutdowns for large maintenance projects at coal-fired power plants, which generally happen in March or April to prepare for high summer power demand; economic shutdowns of coal-fired power plants due to lower electricity prices from natural gas burning power plants; shutdowns of coal-fired power plants from environmental regulations; and large snow volumes leading to an increased availability of hydro power. This lead to the need to assess the risk of a future shortage event occurring and possible mitigative actions.
The US Energy Information Agency (EIA) provides research data on coal usage and predictions for domestic energy markets. Other entities that perform studies and analysis of not only fly ash but other construction materials are the Coal Ash Association of America, the American Road and Transportation Builders Association and the United States Geologic Survey (USGS). The data provided by these agencies and groups together gives a reasonable view of what can be expected for fly ash supply in the future. Domestic fly ash supply is predicted to be stable for the next five years. Beyond that, there is a possibility of the fly ash supply decreasing due to decreased coal usage because of the implementation of the Clean Power Plan (CPP) in 2020. In the Western US,

Office of Structural Materials
pg. 2
there are fewer coal-fired power plants than the Eastern US and limited transportation options. If the fly ash supply were to decline, with the utilization of fly ash at only 50% of current production, there would likely be a period after 2020 where the fly ash supply would decrease but the effects would not be immediately felt in the market. However, as this gap between production and utilization decreases, fluctuations in supply caused by events such as those previously mentioned compounds the likelihood of future shortages. This supply issue is intensified by the fact that California is geographically furthest from the fly ash supply and more likely to see the impact of production issues.
To mitigate the effects of a fly ash shortage, the construction industry has the option to use other SCMs and admixtures allowed by Caltrans Standard Specifications to prevent ASR. Some of these materials are currently available, but are not a viable replacement option. Mitigation options that are available include: recovery of fly ash that has been disposed of, blast furnace slag, silica fume, metakaolin, rice husk ash, natural pozzolans, recycled glass, lithium, Limestone, blended cements and blended SCMs. Each of these materials provide qualities to concrete with some mitigating ASR, improving concrete properties or producing lower GHG emissions. One of the primary obstacles to replacing fly ash is the large volume that would be required to fill a supply shortfall. Based on expert industry representatives and data available from the USGS, natural pozzolans have the greatest single potential supply volume. However, the other mitigative measures discussed have advantages in the qualities they provide to concrete and are not mutually exclusive, individually or in combinations, when being considered as an additive in concrete instead of fly ash.

Office of Structural Materials
pg. 3
Background For the decades between 1960-2000 the utilization of fly ash and other coal combustion products (CCPs) have increased due to a number of factors, including various rulings by the Environmental Protection Agency and the development of industry standards and specifications requiring their use in construction products. Since 2000, the volume of fly ash produced has declined, due to several factors discussed below. In addition, fly ash quality issues have arisen, in part due to new environmental controls on power plants and other factors. With the increase in demand for fly ash and the projected growth over the coming decades, concerns have been raised that demand will outpace available supply. In the spring of 2016, industry encountered a shortage of flyash, which affected projects throughout the country. This event raised further concerns for possible future shortages or scarcity of fly ash, how likely they are and what can be done to alleviate any impacts from another shortage.
Historical Fly Ash Use and Shortages According to the American Road & Transportation Builders Association’s (ARTBA) report on the historic market analysis of coal combustion products in the U.S., “Since 1974, the production of fly ash has increased 29 percent from 40.4 million short tons to 53.4 million short tons in 2013, growing at an average annual rate of just under one percent.” This is illustrated below in Figure 1. The utilization of fly ash in the US over the same period has increased on an annual average of 4.4% from 3.4 million short tons to 23.3 million short tons, also shown in Figure 1. The percentage of total fly ash utilized compared to the total fly ash produced has grown from 8.4% to 43.7% over the same time period. More recent numbers released by the American Coal Ash Association (ACAA) show that fly ash production was down by 13% while it’s overall utilization was up 6% from 2014 to 2015.
Figure 1: Historical Fly Ash Production and Utilization
0
10,000,000
20,000,000
30,000,000
40,000,000
50,000,000
60,000,000
70,000,000
1966
1968
1970
1972
1974
1976
1978
1980
1982
1984
1986
1988
1990
1992
1994
1996
1998
2000
2002
2004
2006
2008
2010
2012
2014
Met
ric T
ons
Fly Ash Production and Utilization1966 - 2014
Fly ash production Fly ash used

Office of Structural Materials
pg. 4
The benefits of fly ash have been highlighted over the years by a number of guidelines and standards, case studies and environmental regulations, which have encouraged the utilization of fly ash as an additive to concrete mixes. Some of these benefits are: the reduction of water required in concrete mixes, improving the pumpability of the concrete, increasing ultimate strength, protecting steel reinforcement from corrosion, resistance to sulfate attack, reducing the overall carbon footprint of concrete production, and helping to prevent alkali-silica reaction (ASR) in concrete. Another important benefit is that it lowers the heat of hydration, preventing the concrete from reaching higher temperatures and the possibility of delayed ettringite formation.
Preventing ASR is possibly the greatest benefit when fly ash is used in a concrete mix as a SCM. ASR leads to expansion inside the concrete which can lead to cracks and weakening of the concrete structure. It is a reaction which occurs over time in concrete when highly alkaline cement paste and reactive silica in the aggregate combine to form alkali silicate gel (ASG). ASG will react with calcium ions and increase in volume. This expansion exerts an outward force inside the concrete leading to cracking and the degradation of the strength of the concrete. Shown below in Figure 2 are the effects of ASR on concrete. On the left is a picture of the macroscopic effects ASR has on concrete and the picture on the right shows the microscopic effects that lead to these larger cracks with the yellow arrows pointing to the areas where ASR has occurred inside the concrete. This degradation can become a bigger issue for structures with longer design lives because the expansion of the gel can progress over long periods.
Figure 2: Alkali-Silica Reaction in Concrete
Environmental regulations Since the 1970s there have been multiple laws and environmental regulatory determinations by the Environmental Protection Agency (EPA) that brought concerns about the use of fly ash as a possible hazardous product and how to properly dispose of it. In 1997 the EPA adopted the “Comprehensive Guideline for the Procurement of Products Containing Recovered Waste” and the “Recovered Materials Advisory Notice”. These guidelines suggested that all federal, state and local government agencies using federal funds, revise or develop their cement and concrete procurement to allow the use of fly ash. In May 2000 the EPA issued a final regulatory determination that reaffirmed a 1993 notice that considered fly ash a solid waste subject to state regulations and the EPA did not want to place any barriers on the beneficial use of fly ash in concrete. This determination contributed to an increase in production and utilization.

Office of Structural Materials
pg. 5
The recent EPA Mercury and Air Toxics (MATS) rule required additional abatement measures at many power plants, often using activated carbon to adsorb mercury. The addition of this carbon can make the fly ash unusable in markets requiring air entrainment for freeze-thaw resistance because it also adsorbs the air entraining additives, or even by causing it to fail the loss on ignition (LOI) specification. Implementation of this rule played a role in the decrease of usable fly ash and the closure of a number of coal-fired power plants.
Industry specifications Along with the EPA regulations, ASTM and AASHTO have developed guidelines and standards for using fly ash and other coal combustion products. Specifically, the development of ASTM C 618 “Coal Fly Ash and Raw or Calcined Natural Pozzolan for Use in Concrete.” ASTM defines a pozzolan as:
“…a siliceous or siliceous and aluminous material that in itself possesses little or no cementitious value but will, in finely divided form and in the presence of water, chemically react with calcium hydroxide at ordinary temperatures to form compounds possessing cementitious properties.”
More than a dozen federal agencies that have published articles, guidelines and standards on the beneficial use of fly ash, supporting its use by elucidating the improvements in material performance and cost reduction mentioned previously.
Office of Structural Materials
pg. 6
Recent Fly Ash Shortage Fly ash is produced from the burning of coal, consequently the supply fluctuates with power production from coal-fired power plants, which are the largest sources of power in the US. Some of the main contributing factors to the recent shortage were:
• Lower electric power demand due to unseasonably warm weather. • Economic shutdowns of coal-fired power plants due to lower electricity prices from
natural gas burning power plants. • Shutdowns of coal-fired power plants due to environmental regulations. • Seasonal shutdowns for large maintenance projects at coal-fired power plants, which
generally happen in spring to prepare for high summer power demand.
In the past there have been fluctuations in CCP supply due to the aforementioned events happening individually or a few at a time, but in the case of 2016, they all occurred simultaneously.
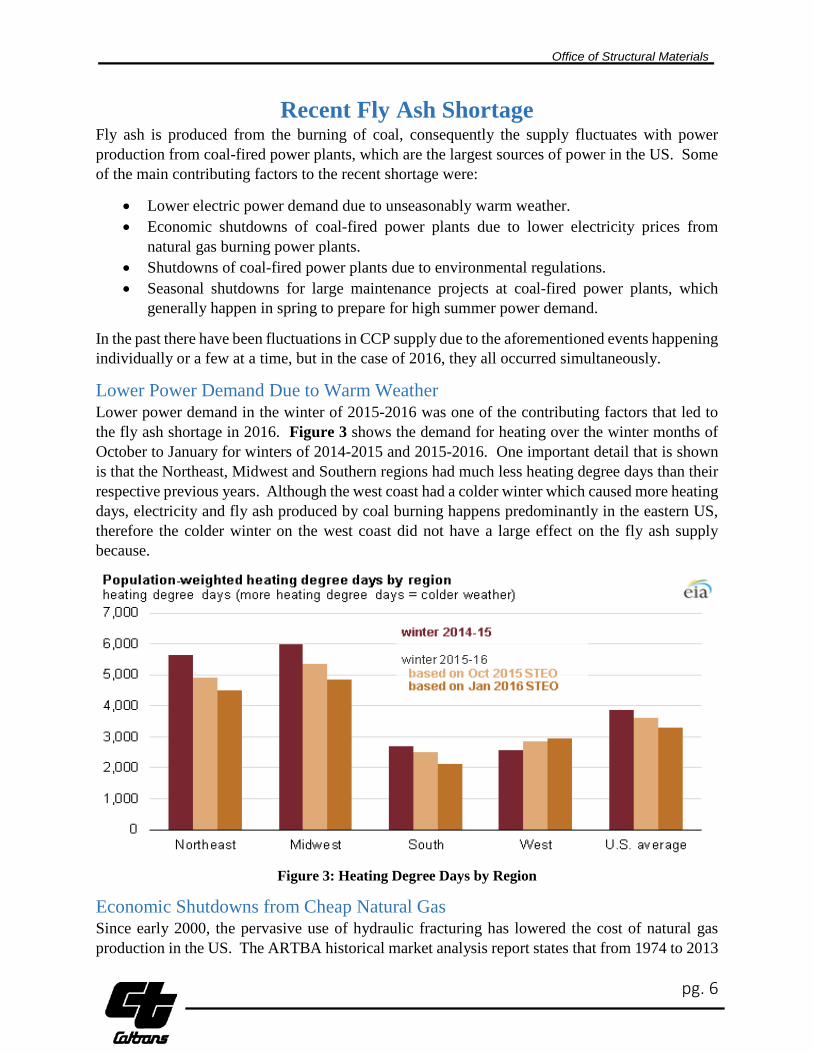
Lower Power Demand Due to Warm Weather Lower power demand in the winter of 2015-2016 was one of the contributing factors that led to the fly ash shortage in 2016. Figure 3 shows the demand for heating over the winter months of October to January for winters of 2014-2015 and 2015-2016. One important detail that is shown is that the Northeast, Midwest and Southern regions had much less heating degree days than their respective previous years. Although the west coast had a colder winter which caused more heating days, electricity and fly ash produced by coal burning happens predominantly in the eastern US, therefore the colder winter on the west coast did not have a large effect on the fly ash supply because.
Figure 3: Heating Degree Days by Region
Economic Shutdowns from Cheap Natural Gas Since early 2000, the pervasive use of hydraulic fracturing has lowered the cost of natural gas production in the US. The ARTBA historical market analysis report states that from 1974 to 2013

Office of Structural Materials
pg. 7
the share of electricity produced by natural gas in the US grew from 17 percent to 27 percent. Although there have been fluctuations in the price of natural gas, as shown in Figures 4 and 5 below, between 2009 and 2016 the price dropped from $7.50 to below $3.00 per thousand cubic foot. This drop in natural gas price gave a competitive advantage, in some cases, over coal-fired power.
Figure 4: Natural gas prices from 2009 to June 2016
Figure 5: Natural gas prices from 2015 to June 2016
00.5
11.5
22.5
33.5
44.5
55.5
66.5
77.5
8
Jan-
2009
May
-200
9
Sep-
2009
Jan-
2010
May
-201
0
Sep-
2010
Jan-
2011
May
-201
1
Sep-
2011
Jan-
2012
May
-201
2
Sep-
2012
Jan-
2013
May
-201
3
Sep-
2013
Jan-
2014
May
-201
4
Sep-
2014
Jan-
2015
May
-201
5
Sep-
2015
Jan-
2016
May
-201
6
Dola
rs p
er T
hous
and
Cubi
c Fe
et
United States Natural Gas Industrial PriceJanuary 2009 - June 2016
2
2.5
3
3.5
4
4.5
5
5.5
Dola
rs p
er T
hous
and
Cubi
c Fe
et
United States Natural Gas Industrial Prices January 2015 - June 2016

Office of Structural Materials
pg. 8
Power Plant Retirement Due to Environmental Regulations According to the EIA, in 2015, 18 gigawatts of electric generating capacity were retired, of which 80% were coal-fired. Of those, approximately 30% were retired in April of 2015 when the US EPA’s Mercury and Air Toxins Standards rule went into effect. During that time, several plants received one-year extensions to sustain electric grid reliability, which were subsequently shut down in April of 2016. The states which had closures were Ohio, Georgia, Kentucky, Indiana, West Virginia and Virginia. The coal-fired plants that shut down were primarily built from 1950 to 1970, with an average age of 54 years, and it was not cost effective to comply with the MATS rule. Furthermore, these coal-fired plants were smaller in size with an average capacity of 133 megawatts (MW) compared with the remaining coal-fired plant’s average of 278MW. Although these plants were predominantly in the Eastern US and didn’t supply fly ash directly to California, the effect of losing these sources of fly ash still influenced the overall market.
Unique Issues to California There are additional issues outside of the production and supply of fly ash that are unique to California which relate to the transportation logistics of moving fly ash from where it is predominantly produced to California. This transportation distance leads to an increase in the price of fly ash in the California market. Northern California fly ash is supplied from Arizona and Wyoming while southern California is sourced from Arizona, Nevada and Utah. Additionally, there is no stockpiling of fly ash between the producers and the end users, making supply fluctuations more noticeable. California has predominantly used Class F fly ash for two reasons. First, most of the sources that California imports fly ash from produce Class F which typically contains less than 7% calcium-oxide (CaO). The type of fly ash produced by a coal-fired power plant depends on the source and chemical constituents of the coal being burned. The second reason is that Caltrans allows only fly ash with under 15% CaO to be used in concrete mix designs. This excludes a large percentage of Class C fly ash produced because of the CaO content being over the 15% limit.

Office of Structural Materials
pg. 9
Long Term Outlook for Fly Ash Supply
Fly Ash Production and Utilization The energy market is the primary driver when determining future fly ash production. The overall use of coal, and consequently fly ash as a byproduct, has declined in recent years. The utilization of fly ash in the US is still only approximately 50% of what is produced in the US according to data from the EIA.
The excess supply of fly ash is due to seasonality of power supply and demand (i.e., maximum electricity generation is in the winter and the construction season is in the summer), logistics and quality. While most usable fly ash is sold, fly ash that is not used is typically landfilled or pumped as slurry into waste ponds, mixing any good excess ash with unusable ash. Although much talk and marketing efforts by new technology vendors is underway to reclaim such ash, the additional cost is generally prohibitive. Fly ash in landfills or impoundments has been wet, causing agglomeration and requiring costly drying and grinding to produce a usable product. The unusable ash is typically high in unburned carbon from the coal itself or added in the air pollution control processes to reduce mercury. Removing the carbon or treating it to be nonreactive further increases cost. Even though the US only uses approximately 50% of the produced fly ash, there is no definitive data on what portion of the remaining fly ash is of a usable quality and could be stored for later use.
According to the ARTBA’s market forecast report, the production of fly ash is projected to grow 2.2% from the 2013 volume of 53.4 million short tons to 54.6 million short tons in 2033. The forecast, with confidence intervals according to ARTBA, is shown in Figure 6.
Figure 6: Fly Ash Production Forecast from 2013 - 2033
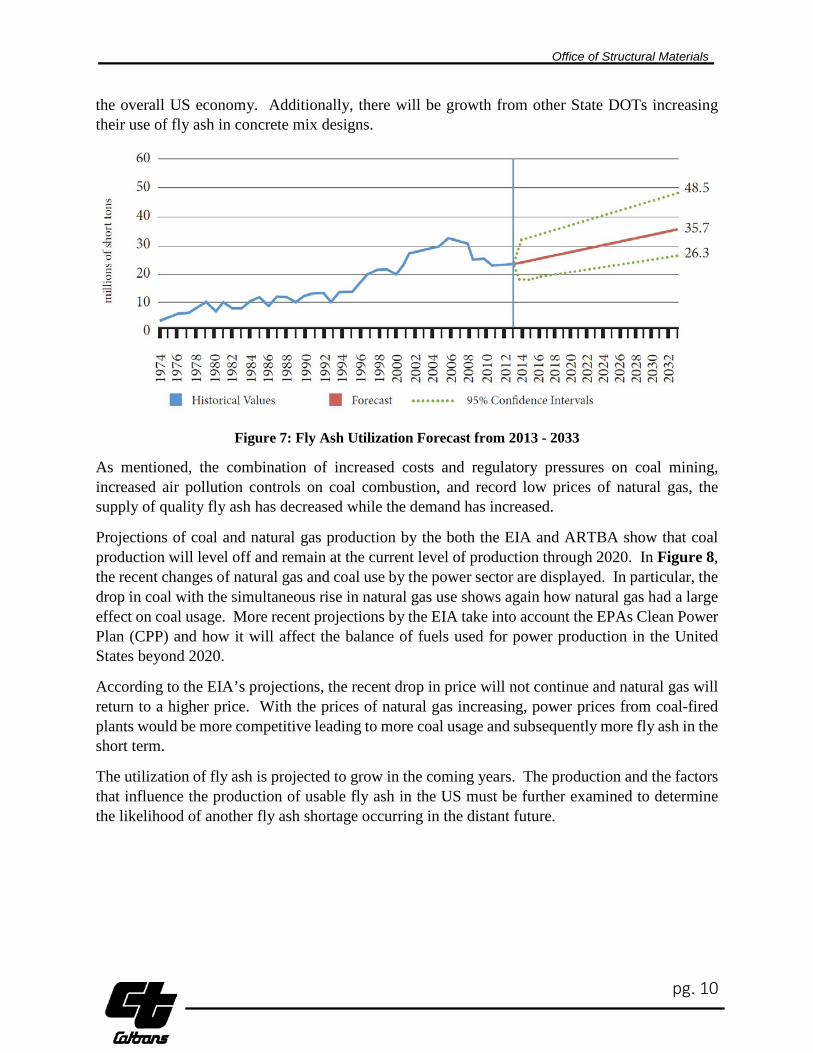
The ARTBA’s Market Forecast Report for utilization in 2013, shown in Figure 7, was determined to be 23.3 million short tons for the US and is projected to grow by 53.1% to 35.7 million short tons by 2033. The most recent numbers reported by the ACAA for fly ash utilization from 2014 to 2015 follow this prediction with a rise in utilization of 6% from 2014 to 2015. Many factors contribute to the growth in utilization, including the expanded use of fly ash in high volume applications and general growth in ready-mixed concrete markets which are largely influenced by
Office of Structural Materials
pg. 10
the overall US economy. Additionally, there will be growth from other State DOTs increasing their use of fly ash in concrete mix designs.
Figure 7: Fly Ash Utilization Forecast from 2013 - 2033
As mentioned, the combination of increased costs and regulatory pressures on coal mining, increased air pollution controls on coal combustion, and record low prices of natural gas, the supply of quality fly ash has decreased while the demand has increased.
Projections of coal and natural gas production by the both the EIA and ARTBA show that coal production will level off and remain at the current level of production through 2020. In Figure 8, the recent changes of natural gas and coal use by the power sector are displayed. In particular, the drop in coal with the simultaneous rise in natural gas use shows again how natural gas had a large effect on coal usage. More recent projections by the EIA take into account the EPAs Clean Power Plan (CPP) and how it will affect the balance of fuels used for power production in the United States beyond 2020.
According to the EIA’s projections, the recent drop in price will not continue and natural gas will return to a higher price. With the prices of natural gas increasing, power prices from coal-fired plants would be more competitive leading to more coal usage and subsequently more fly ash in the short term.
The utilization of fly ash is projected to grow in the coming years. The production and the factors that influence the production of usable fly ash in the US must be further examined to determine the likelihood of another fly ash shortage occurring in the distant future.

Office of Structural Materials
pg. 11
Figure 8: Natural Gas and Coal Consumption by the Power sector Jan 2001-June 2016
Environmental Regulations The EPA published a final CPP on October 23, 2015 which calls for a 32% GHG reduction from 2005 levels for existing power plants by 2030. One study by Doyle Trading Consultants LLC's Sherry Orton predicts that coal use for power in the US could fall from a little less than 800 million tons in 2022, the first year for implementation of the US EPA’s CPP, to a low of less than 400 million tons in 2030. However, the EIA’s Annual Energy Outlook for 2016 projects a smaller decrease in coal usage. Coal production and usage is projected to remain level for the next five years. With the CPP being implemented in 2022, the US will likely see a decrease in coal usage from plants either shutting down or being retrofitted for natural gas to meet GHG emissions regulations from the CPP. These projections are shown in Figure 9 below, with natural gas and renewables predicted to increase to meet future power demands. On February 9, 2016, the Supreme Court stayed implementation of the Clean Power Plan pending judicial review.

Office of Structural Materials
pg. 12
Figure 9: Net Electricity Generation by Fuel (2000-2040)
Fly ash supply is predicted to be stable for the next five years. Beyond that, there is a possibility of the fly ash supply decreasing for the US with a forecasted decrease in coal usage. Figure 10 below shows a prediction from the EIA of which coal producing regions would be most affected and by how much the supply may change due to the CPP rule coming into effect. The western region will lose the most supply which may put an additional strain on California’s fly ash supply, but it’s difficult to determine with certainty if the lost supply will come from coal-fired plants which supply fly ash to California. Even if fly ash supply were to lessen, the utilization of fly ash is currently 50% of production so there would likely be a span of time after 2020 where fly ash supply would decrease but the effects would not be immediately felt in the market.
Figure 10: Coal Supply Region changes with CPP implementation

Office of Structural Materials
pg. 13
Mitigating the Effects of a Fly Ash Shortage The major benefits when using fly ash in concrete are a reduction in the GHG emissions associated with concrete production by cement replacement, and mitigation of ASR in concrete. There are many potential supplementary cementitious materials available to use in the place of fly ash, but the physical qualities provided by each differ when used in concrete. Also, when considering alternatives to fly ash, the quantities available need to be considered. The California fly ash market is between 800,000 and 1.3 million tons depending on the year. In the occurrence of another fly ash shortage, mitigative measures will depend on what qualities are desired in the concrete being produced and the amount of the material required to compensate for the shortage.
Recovering Fly Ash from Dump Sites Every year a great deal of fly ash that is produced is disposed of because of a lack of demand or infrastructure to ship the product from where it is produced. There is potential to recover this same fly ash, but identifying usable product locations, the chemical characteristics and the labor to excavate disposal sites create obstacles to utilizing this option.
Constructing Large Storage Silos Storage capacity for excess fly ash could create a buffer during shortage events. This option would have to be economically beneficial before the investment would be made.
• Pros o Would prevent more fly ash from being disposed of in dump sites. o Fly ash market could become more stable.
• Cons o Building new storage would be very costly to permit and construct. o Would only buffer shortages until the utilization grows beyond the production of
fly ash. o Extra material handling and transportation would add cost to stored product.
Class C Fly Ash Class C fly ash has higher CaO content than Class F fly ash and the physical properties of Class C are different. A rough estimate of Class C fly ash available to the California market is 50,000-100,000 tons. Both Class F and Class C fly ash are byproducts of burning coal so the carbon footprints are similar if not identical to each other.
• Pros o There are supplies of Class C fly ash near California.
• Cons o Caltrans Standard Specifications do not allow CaO percentage above 15% for fly
ash. o Requires a larger percentage replacement in a concrete mix to mitigate ASR
compared to Class F fly ash. o Many of the sources have high SO3 contents because of sulfur scrubbing.

Office of Structural Materials
pg. 14
Slag Blast-furnace slag is produced in a blast furnace during the reduction of iron ore to iron. It consists of silicates and aluminosilicates of calcium and other bases.
• Pros o Provides sulfate resistance, prevents ASR and reduces permeability in concrete. o Can replace up to 50% cement in a concrete mix. o It is a byproduct of steel manufacturing.
• Cons o Must be imported into California. o Limited supply even when imported.
Silica Fume Silica fume is a byproduct of producing silicon metal or ferrosilicon alloys. When using silica fume in concrete, there are additional benefits compared with using fly ash in concrete. Silica fume is more expensive than fly ash but the extra benefits it gives make a direct comparison difficult.
• Pros o Adding to concrete gives it extremely low permeability which leads to greater
durability, resistance to chlorides and ASR. o Using silica fume in concrete will produce a higher strength than concrete with just
fly ash and cement (e.g. above 10,000 psi). • Cons
o Dry form poses respiratory health risks. o Can result in workability and placement problems for contractors, leading to the
need for admixtures. o Volume of available product may not be enough to cover a fly ash shortage. o Using too much Silica Fume can lead to surface cracks in the concrete.
Metakaolin Metakaolin generally comes from natural deposits, but can be obtained as a secondary product to paper sludge waste and oil sand tailings. It’s produced from heating kaolinite to chemically change it into metakaolin which has pozzolanic properties and can be used in concrete. This could potentially be less carbon intensive but there is a large amount of energy expenditure to process Metakaolin.
• Pros o Provides very high strength to concrete. o Low permeability of concrete giving it resistance to ASR, reduced shrinkage and
chemical resistance. • Cons
o Currently there is a lack of industrial capacity to produce metakaolin. o Transportation challenges because there are no commercial sources near California.

Office of Structural Materials
pg. 15
Rice Hull Ash Rice hull ash is produced from burning rice hulls at a specific temperature. Rice hull ash has very similar properties to silica fume. California has a large rice producing industry and converting the byproduct of rice hulls to a usable pozzolanic material could be done in state and lead to carbon savings for producing concrete. Caltrans Translab concrete expert Dr. Vijay Jain has studied rice hull ash and its benefits.
• Pros o Reduces the permeability and increases the strength of the concrete. o Can reduce carbon footprint of concrete. o Could mitigate ASR in a similar way to silica fume.
• Cons o There are no plants in California producing this product therefore a significant
investment would be required to start producing in usable quantities. o Low density of the product for transportation makes it expensive to ship.
Natural Pozzolan Natural Pozzolans (NP) are mined from natural deposits. There are large natural pozzolan deposits throughout the US with a possibility of large quantities being produced in the event of a fly ash shortage.
• Pros o Currently available to California. o Large potential for supply. o Mitigates ASR. o Used world-wide, especially in countries that do not burn coal for power. o It is a byproduct from some industrial processes.
• Cons o Different characteristics with water demand when used in concrete so the use of
admixtures may be necessary. o As a primary product NPs require drying and grinding. o There would be a learning curve for many California contractors. o The deposits can vary in chemical constituents and would have different
characteristics unique to their origin when used in concrete.
Recycled Glass Recycled glass has a high level of available alkalis. As an aggregate it is reactive because of the high alkali content but as a powder it may mitigate ASR.
• Pros o Is a recycled product. o Increases strength of concrete and long term durability of the concrete.
• Cons o Recycled glass is not readily available to the southwest or California. o Supply to California would take significant investment to start producing in large
quantities.

Office of Structural Materials
pg. 16
o No current specification for ground glass. There is currently a task group in both ACI and ASTM to develop standards for this product.
o Not all glass can be recycled to be used as a pozzolan. o Not currently allowed by Caltrans specifications
Lithium Lithium admixtures have been demonstrated to help mitigate ASR damage and have similar effectiveness to fly ash for mitigating ASR. In addition to mitigation, lithium can be used after production to slow or stop ASR if it presents in the structure.
• Pros o Similar to the effectiveness of fly ash in mitigating ASR.
• Cons o Only one supplier for the west coast. o Doesn’t provide other benefits to concrete. o Energy intensive to produce. o The current demand from other industries is out pacing the supply of lithium.
Limestone Dust A new ASTM specification has been developed, C1797 for calcium carbonate use in concrete mixtures.
• Pros o There are several suppliers in the California market. o Improves compressive strengths. o Reduces chloride permeability. o Compensates for early strength and setting issues that other SCMs may cause. o As part of an SCM blend, it can be used to optimize the performance.
• Cons o Some concerns about sulfate resistance of mixes with high contents of limestone
dust. o Not currently allowed by CALTRANS specifications o Does not mitigate ASR.

Office of Structural Materials
pg. 17
Blended Cements Blended hydraulic cements consist of two or more inorganic constituents (at least one of which is not Portland cement or Portland cement clinker). Blended hydraulic cement can be a “binary” blend which consists of Portland cement with either a slag, a pozzolan or a limestone or a “ternary” blend consisting of a Portland cement with either a combination of two different pozzolans, slag and a pozzolan, a pozzolan and a limestone, or a slag and a limestone.
• Pro o Many different qualities possible with a cement and different SCMs. o Wouldn’t require separate storage silos.
• Con o Depending on what constituents make up the blend, the GHG emissions
associated with the blend will vary. o Not all blends are currently allowed by CALTRANS specifications
Blended SCMs Blended SCMs are a designed product that can take advantage of the positive aspects of each constituent and reduce or eliminate negative aspects.
• Pros o Can bring out of specification materials into specification increasing overall SCM
supply. o Can use one SCM’s positive attribute to compensate for another SCM’s
properties. o May be able to utilize smaller sources of SCMs that currently aren’t viable
because of quantity or consistency of supply. o SCMs can be custom blended for local markets and environmental conditions o Has the potential to bridge the fly ash supply over time.
• Cons o Caltrans does not currently recognize blended SCMs in their specifications o Industry will have to develop consistent processes to blend and certify the
material that would create a consistent quality. o ASTM has a new specification C1697 for blended SCMs but it currently only
allows Class N pozzolan, Class F Fly ash, Class C fly ash, silica fume and slag into blend.

Office of Structural Materials
pg. 18
REFERENCES. • American Road and Transportation Builders Association report, Production and Use of
Coal Combustion Products in the US – Historic Market Analysis and Market Forecast reports.
• ASTM C618 • ASTM C1797 • ASTM C1697 • Caltrans Activities to Reduce Climate Change, April 2013 • US Energy Information Administration (EIA) • EIA Annual Energy Outlook 2016
(http://www.eia.gov/pressroom/presentations/sieminski_06282016.pdf) • Code of Federal Regulations - Title 40 - Protection of Environment, PART 247—
COMPREHENSIVE PROCUREMENT GUIDELINE FOR PRODUCTS CONTAINING RECOVERED MATERIALS (https://www.gpo.gov/fdsys/pkg/CFR-2012-title40-vol26/xml/CFR-2012-title40-vol26-part247.xml)
• Millard, Marcus J., Effects of Lithium Nitrate Admixture on Early Age Concrete Behavior, 2006 (https://smartech.gatech.edu/handle/1853/11615)
• Study Forecasts Huge Fall in US Coal Burn Under EPA's Clean Power Plan http://www.power-eng.com/articles/2015/12/study-forecasts-huge-fall-in-us-coal-burn-under-epa-s-clean-power-plan.html
• Jain, Vijay, Rice Husk Ash as a Mineral Admixture in Concrete
Office of Structural Materials
pg. 19
APPENDIX
A. Rock Products Committee Concrete Task Group Investigation Scoping Document

Office of Structural Materials
pg. 20
APPENDIX A: Rock Products Committee scoping document
Office of Structural Materials
pg. 21
Approvals obtained via email.