Fluvial Freeboard: Background InformationD Project Record W5/042/1 i CONTENTS Page LIST OF FIGURES...
54
Fluvial Freeboard: Background Information R&D Project Record W5/042/1 A.M. Kirby and J.R.V. Ash Research Contractors: Mott MacDonald Ltd Risk & Policy Analysts Ltd
Transcript of Fluvial Freeboard: Background InformationD Project Record W5/042/1 i CONTENTS Page LIST OF FIGURES...

Fluvial Freeboard: Background Information
R&D Project Record W5/042/1
A.M. Kirby and J.R.V. Ash
Research Contractors:Mott MacDonald LtdRisk & Policy Analysts Ltd

Publishing OrganisationEnvironment AgencyRio HouseWaterside DriveAztec WestAlmondsburyBristol BS32 4UD
Tel: 01454 624400 Fax: 01454 624409
© Environment Agency 2000 ISBN: 1 85705 364 8
All rights reserved. No part of this document may be produced, stored in a retrieval system,or transmitted, in any form or by any means, electronic, mechanical, photocopying, recordingor otherwise without the prior permission of the Environment Agency.
The views expressed in this document are not necessarily those of the Environment Agency.Its officers, servants or agents accept no liability whatsoever for any loss or damage arisingfrom the interpretation or use of the information or reliance upon views contained herein.
Dissemination StatusInternal: Released to RegionsExternal: Released to Public Domain
Statement of UseThis report summarises the findings of research carried out into the use of freeboard forfluvial flood defences. The information within this document is for use by EnvironmentAgency staff and others involved in the planning, design and implementation of flooddefences and development control within river catchments.
Research ContractorThis document was produced under R&D Project W5-042 by:
Mott MacDonald LtdDemeter HouseStation RoadCambridgeCB1 2RS
Tel: 01223 463 500 Fax: 01223 461 007
Environment Agency’s Project ManagerThe Environment Agency’s Project Manager for R&D Project W5-042 was:Stuart Pedder – Environment Agency, North East Region

R&D Project Record W5/042/1 i
CONTENTSPage
LIST OF FIGURES iiLIST OF TABLES ii
1. LAYOUT OF THE PROJECT RECORD 1
2. FREEBOARD QUESTIONNAIRES 3
2.1 Examples of Questionnaires 32.2 Responses to Questionnaires 4
3. BACKGROUND AND DERIVATION OF HYDROLOGICAL AND HYDRAULICUNCERTAINTY 15
3.1 Introduction 153.2 Stochastic Processes 153.3 Return Period 193.4 Risk Level 193.5 Stochastic Properties of Linear Systems 213.6 Composite Exceedance Probability 24
4. FREEBOARD AND DEVELOPMENT CONTROL 27
4.1 Development and Flood Risk Guidelines 274.2 Suitability of Guidelines 28
5 REVIEW OF PROJECT APPRIASAL IMPLICATIONS 33
5.1 Purpose of Review 335.2 River Cam Case Study 375.3 River Cam – Short Record Case Study 375.4 River Ouse at Selby Case Study 385.5 Clipstone Brook Case Study 395.6 Summary of Results 40
Appendix A: Selby Flood Alleviation Scheme Design Note – FreeboardAppendix B: Clipstone Brook Uncer tainty Allowance

R&D Project Record W5/042/1 ii
LIST OF FIGURES
Figure 2.1 Current components of freeboardFigure 2.2 Future components of freeboardFigure 2.3 Importance of parametersFigure 2.4 Causes of defence failure
Figure 3.1 Probability density function (PDF)Figure 3.2 Cumulative distribution function (CDF)Figure 3.3a Risk versus annual exceedance probabilityFigure 3.3b Risk versus annaul exceedance probability
Figure 4.1 Non-dimensional flood damage
Figure 5.1 Illustration of the use of freeboard in scheme appraisalFigure 5.2 Example of comparison of return periodsFigure 5.3 River Cam water level return period relationshipFigure 5.4 River Cam short record water level return period relationshipFigure 5.5 River Ouse at Selby water level return period relationshipFigure 5.6 Clipstone Brook water level return period relationshipFigure 5.7 Existing defence comparison of standard of protection and threshold of flooding
(0.5 standard deviation)Figure 5.8 Existing defence comparison of standard of protection and threshold of flooding
(1.0 standard deviation)Figure 5.9 Proposed defence comparison of standard of protection and threshold of flooding
(0.5 standard deviation)Figure 5.10 Proposed defence comparison of standard of protection and threshold of flooding
(1.0 standard deviation)
LIST OF TABLES
Table 2.1 Number of responses to detailed questionnaireTable 2.2 Number of responses to short questionnaire
Table 5.1 River Cam – comparison of return periodsTable 5.2 River Cam short record – comparison of return periodsTable 5.3 River Ouse at Selby – comparison of return periodsTable 5.4 Clipstone Brook – comparison of return periodsTable 5.5 Summary of results

R&D Project Record W5/042/1 1
1. LAYOUT OF THE PROJECT RECORD
The Project Record sets out information concerning the research project into Freeboard that iscomplementary to R&D Technical Report W187. For this research project four areas ofinformation are included in the Project Record:
• information on a questionnaire that was distributed as part of the project;
• background information on the derivation of the methods for estimatinghydrological/hydraulic uncertainty;
• consideration of development control issues in relation to freeboard;
• assessment of how the inclusion use of freeboard affects the standard of protection of adefence
Chapter 2 provides a summary of who the questionnaire was sent to, how many responses werereceived and factual data on the responses.
Chapter 3 provides information on the derivation of the methods used in the Technical Report forestimating hydraulic/hydrological uncertainty. This was considered to be at too great a level ofdetail to be included in the Technical Report.
Chapter 4 considers the issue of how Development Control Officers may take account offreeboard when giving advice on floor levels in flood risk areas. However a National Group isalso looking at the issue.
Chapter 5 is a review of how freeboard affects the standard of a defence compared with not usingfreeboard and considers a number of case studies where the freeboard methods presented in theGuidance Note have been applied.

R&D Project Record W5/042/1 2

R&D Project Record W5/042/1 3
2. FREEBOARD QUESTIONNAIRES
2.1 Examples of Questionnaires
Two questionnaires were developed, a detailed questionnaire and a briefer short questionnairecontaining only a selection of the questions in the detailed questionnaire. Blank copies of eachquestionnaire are contained at the end of this section.
The detailed questionnaire was sent out to representatives in each of the eight Agency Regions.Some 225 questionnaires were sent out and about 150 were then distributed by therepresentatives in each Region to Flood Defence Engineers and Development Control Officers. Inaddition a number of questionnaires were distributed within Mott MacDonald, Risk & PolicyAnalysts Ltd (RPA) and to other consultants. Of these questionnaires 65 completed ones werereturned, with questionnaires being returned from all Regions. This represents a 40 % response,which was considered a very good response.
The short questionnaire was sent out to 480 CIWEM Rivers and Coastal Group members. 74completed questionnaires were returned, which represents a 15 % response. This is againconsidered to be a good response given the unsolicited nature of the questionnaire and the factthat many members are not engineers. Table 2.1 and Table 2.2 show which Regions andorganisations responded. A good mix of organisations responded and hence the informationreceived was considered to represent a fair cross section of the flood defence sector.
Table 2.1 Number of responses to Detailed Questionnaire
Detailed Questionnaire
Region Number of respondents
AnglianMidlandsNorth EastSouth WestSouthernWelshThamesNorth WestOther (Consultants)
15512853773
Total 65

R&D Project Record W5/042/1 4
Table 2.2 Number of responses to Shor t Questionnaire
Shor t Questionnaire
Employment Type Number of respondents
ConsultantsGovernment (Environment Agency,MAFF, Drainage Boards, research bodies)Other (retired or unknown)
3524
15Total 74
2.2 Responses to Questionnaires
Most people responding (80 %) did not have a standard method for determining freeboard withintheir organisation and most (85 %) would welcome guidance on a consistent method. There wasconsiderable variation in what people considered was included in their estimates of freeboard.Most agreed that it should include settlement, an allowance for wear/degradation and for waveovertopping but that it should not include for changes occurring in the future, for example,changes in catchment or channel roughness. There was no real consensus whether uncertainties inhydrological and hydraulic processes should be allowed for in freeboard or in the design waterlevel, though the latter was preferred. There was also some variation in what parameters wereconsidered important for determining freeboard though the reliability of hydrological andhydraulic data and analysis, settlement and the consequences of failure scored highly. Suchthings as wind set up, changes in channel roughness, siltation were not considered to beimportant factors, neither, interestingly was public confidence.
A number of comments appeared repeatedly, including:
• site specific conditions are important, hence rigid guidelines are unlikely to be helpful;
• the consequences of overtopping are important;
• guidance should be straightforward;
• risk should be considered;
• advice on freeboard in relation to PAGN, high ground, standard of protection is needed.
Figure 2.1 shows which parameters respondents thought was currently included in freeboardallowances. Figure 2.2 shows which parameters respondents thought should be included infreeboard allowances in the future. Figure 2.3 shows which parameters were considered the mostimportant when determining freeboard. Figure 2.4 shows which failure mechanisms respondentsconsidered had caused flooding in their experience.
The written comments to questions in the detailed and the short questionnaires have beensummarised and are set out below.

R&D Project Record W5/042/1 5
Detailed Freeboard QuestionnaireSummary of Written Comments
PART 2.1
How freeboard is evaluated:
• Built up from main factors (settlement, modelling tolerance, waves, etc)
• Built up from main factors
• Built up from main factors
• Built up from main factors
• Built up from main factors
• Built up from main factors
• Built up from main factors
• Built up from main factors + sensitivity analysis
• DWL + 0.0 m hard, 0.3 m soft
• DWL + 0.15 m hard, 0.25 m soft
• DWL + 0.15 m hard, 0.3 to 0.5 m soft
• DWL + 0.15 m hard, 0.3 m soft
• DWL + 0.15 m hard, 0.3 m soft
• DWL + 0.15 m hard, 0.3 m soft
• DWL + 0.15 to 0.3 m hard, 0.6 m soft
• DWL + 0.3 m hard, 0.5 m soft
• DWL + 0.3 m hard, 0.5 m soft
• DWL + 0.3 m hard, 0.6 m soft
• DWL + 0.3 m hard, 0.6 m soft
• DWL + 0.3 m hard, 0.6 m soft
• DWL + 0.3 m hard, 0.6 m soft
• DWL + 0.3 m hard, 0.6 m soft
• DWL + 0.3 to 0.6 m
• cost and type of additional material, importance of defence
• Welsh Office requirements
• Agency Eng. Dept. Instruction Nr 30 Design Standards for Sea Defences formerly 400mm fluvial, 600 mm tidal now built up from main factors
• Consequences of overtopping
R&D Project Record W5/042/1 6
• Client requirements
• DWL + 0.3 m or velocity head, whichever is higher
• DWL + 0.15 m for hard & soft client requirements
• engineering judgement
PART 2.2
Risk assessment car r ied out?
• Risk assessment of overall scheme
• Freeboard a potential issue
• Risk could justify any additional costs
• To ensure the factors under engineering judgement are taken into account
• Consider susceptibility to debris & cattle degradation
• Consider blockage at bridges
• not yet but possibility in future
• concept of a “notional” freeboard has been abandoned, additional height is addedbased on an informal risk assessment
• no but likely in future
• informally when deciding on freeboard
• because confidence in water level and risk of damage varies between projects needfinal built scheme to be secure to expected standard – so we can all sleep easy at night
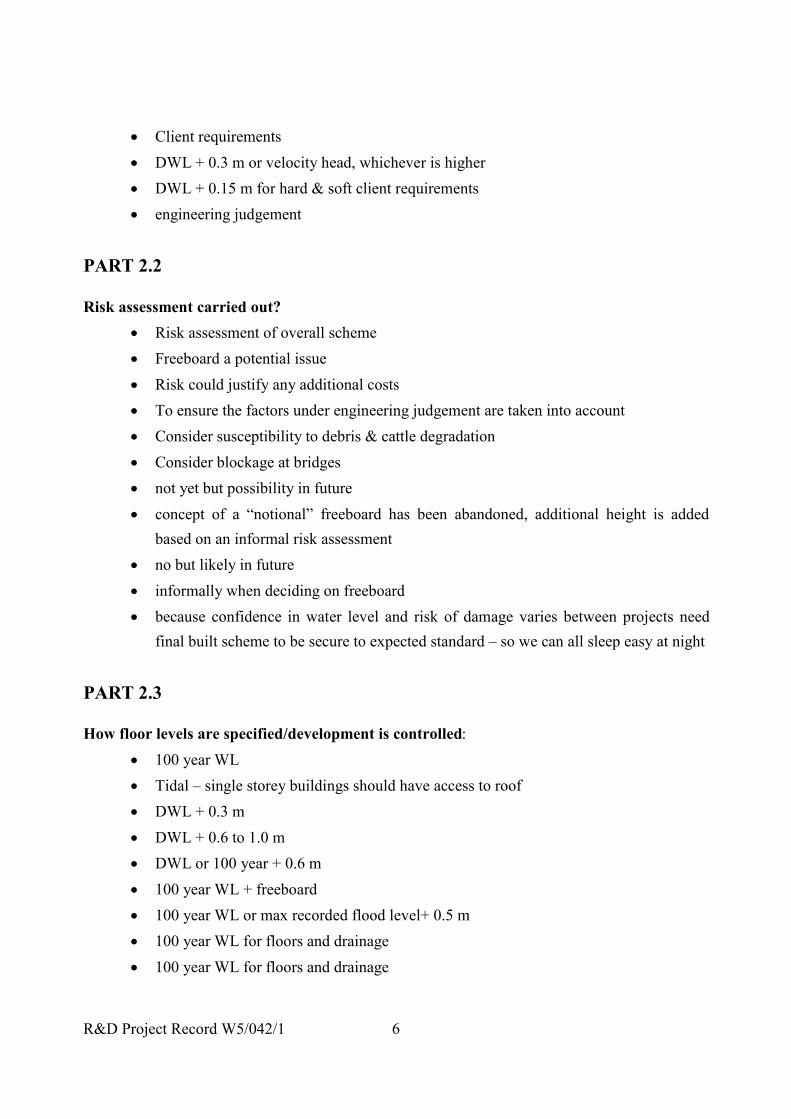
PART 2.3
How floor levels are specified/development is controlled:
• 100 year WL
• Tidal – single storey buildings should have access to roof
• DWL + 0.3 m
• DWL + 0.6 to 1.0 m
• DWL or 100 year + 0.6 m
• 100 year WL + freeboard
• 100 year WL or max recorded flood level+ 0.5 m
• 100 year WL for floors and drainage
• 100 year WL for floors and drainage

R&D Project Record W5/042/1 7
• 100 year WL +0.5 m for floors, 100 year level for general site levels
• 100 year WL + 0.6 m
• Max recorded flood + 0.5 m or 100 year WL
• Max recorded flood level + 0.6 m or 100 year WL + 0.6 m
• Max recorded flood level + 0.6 m or 100 year WL + 0.6 m
• Max recorded flood level + 0.6 m or 100 year WL + 0.6 m or locally determined floodlevel + 0.6 m
• Max recorded flood level + 0.6 m or 100 year
• Max recorded flood level + 0.25 m
• Max recorded flood level + 0.3 m
• Max recorded flood level + 0.3 to 0.5 m
• Max recorded flood level + 0.5 m
• Max recorded flood level + 0.5 m
• Max recorded flood level + 0.5 m
• Max recorded flood level + 0.6 m
• Max recorded flood level + 0.6 m
• Max recorded flood level + 0.6 m
• Max recorded flood level + 1.0 m
• Behind existing defence – at same level
• Behind defences, ground level + 0.6 m
• Behind defences, ground level + 0.6 m
• No consistency
• For bridges, some regions specify 100 year level + 0.6 m others 100 year level + 0.3m, for arched bridges what should be taken as soffit ?
• tidal: 200 year still tide level + 0.6 m + allowance for sea level rise,
• fluvial: 100 year level + 0.6 m or max recorded flood level + 0.6 m
• For bridges Agency often specify 100 year WL + 0.5 m. Is this for afflux ? (which isunlikely to be this large) or for floating debris (which could easily be larger).
• in past max recorded WL + allowance, now asking developers to assess risk based onAgency information

R&D Project Record W5/042/1 8
PART 3
Which components included ?
• Design Engineer to choose but document it
• statistical analysis should be carried out
• Siltation – in past not allowed for as maintenance procedures assumed to be in place
• risk of blockage
• size of watercourse
• environmental impact
• sensitivity of water levels to flows
PART 4
What factors are impor tant ?
• maintenance regime
• the relative importance varies enormously between situations therefore we do not relyon written procedure but rely on judgement by experienced staff
PART 5.2
Causes of failure:
• non-main river culverts
• main river – blockages, weed growth
• drainage system failure
• fuse embankment/spillway important
• temporary works in channel
• blockages very common cause of flooding
• failure due to vermin never heard of – but may be because controlled
PART 6.1
Would value guidance on:
• waves and fissuring
• how to deal with PAGN
• standard method

R&D Project Record W5/042/1 9
• finished floor levels
• hydraulics/hydrology
• list of parameters to build up freeboard
• weighted factors, build up should be transparent
• risk assessment method using factors in questionnaire
• defence level for soft defences – include topsoil etc or not ?
• climate change
• public confidence
• consistency is the keyword
• consistency
• Clarification of freeboard in PAGN
• statistical analysis
• how to combine probabilities simply
• economic costs and benefits of freeboard
• consistent approach
• separate guidance on tidal/coastal
• tolerance range for each element of freeboard
• energy head
• fissuring and vermin
• advice not needed as Welsh Office guidance used
• freeboard is a factor of ignorance
• guidance on risk analysis
• bridge blockage scenarios
• local effects at bends
• shingle & groyne formation & their effects
• is MAFF grant aid eligible on freeboard if it exceeds the Indicative Standard ofProtection ?
• scale of allowances for different parameters
• how should parameters be combined ?
• could risk based approach be preferable ?
• wave run up
• should be assessed on case by case basis

R&D Project Record W5/042/1 10
• standard approach useful but needs to cater for specific circumstances / cost / politics.Guidance on sensible range of variables would be useful
• standard approach but not prescriptive
ADDITIONAL COMMENTS
• problem of estimating design standards
• definition of standard of protection (freeboard in or out)
• development seen as major problem
• engineer should be given the freedom to decide
• should consider safe overtopping (spillway etc)
• legislation needed for consistency
• risk based approach
• DWL should be best estimate
• Engineering judgement will always come into play
• New procedures should not increase the amount of modelling work
• maintenance procedures essential to ensure standard maintained
• what about freeboard on soffit levels of bridges culverts etc
• coastal/tidal advice would be useful
• smaller freeboards for higher return periods ?
• risk methodology best way forward
• if method is changed from normal +0.3 hard, +0.6 m soft, then revised advice fordevelopment control essential
• remember that water levels not flows cause flooding
• how to approach time related elements( settlement, climate change etc) with respect toPAGN
• designers must pass on information to maintenance teams so design standards can bemaintained
• document should be guidance rather than rigid standard as situations vary so much
• peace of mind for riparian residents
• be aware that the sample of experience is small
• are we becoming too design orientated
• site specific knowledge may over ride calculated values
• clear definition of varying parameters essential for this study

R&D Project Record W5/042/1 11
• need to define what is included in water level what in freeboard
• if natural ground level is above DWL but below DWL + freeboard what should bedone ?
• for situations where high confidence not required then freeboard should be a simplesafety factor, where high degree of confidence required (e.g. tidal situations) thengreater freeboard/more detailed analysis appropriate
• would like to see leaflet produced to pass to developers advising them what factorsshould be considered.
• do not want idiots guide, but guidance on main factors and their size
• hope that all questionnaire answers are not treated with equal weight

R&D Project Record W5/042/1 12
Shor t Freeboard QuestionnaireSummary of Comments
PART 2.1
How freeboard is evaluated:
• Built up from site specific elements
• Built up from site specific elements
• Built up from site specific elements
• Built up from site specific elements
• No freeboard except for allowance for settlement – Midlands policy re PAGN
• NRA Standard Practice Document
• DWL + 0.3 m hard, 0.45 m soft
• DWL + 0.3 m hard, 0.45 m soft
• Total inconsistency
• Minimum is v2/2g above water level
• 0.3 m river banks, 1.0m tidal
• Max recorded + 0.3 m
• DWL + 0.15 hard, 0.3 m soft or velocity head
• DWL + 0.6 m
• DWL + 0.3 m hard, 0.6 m soft
• DWL + 0.3 m
PART 3
What factors are impor tant ?
• security of flood gates/stoplogs
• blockages
• availability of information an issue
• superelevation
• changes in hydraulic structures
• materials
• location from the defence

R&D Project Record W5/042/1 13
• access for maintenance
• return period protected against
• flood warning capabilities
• height of defence above protected area
• consequences of failure very important
• client requirements
• visual amenity
• geotechnical data
• height & profile of defence
• land use behind defence
PART 4 ADDITIONAL INFORMATION
• In past catch all, rigorous approach desirable
• Passing on design information to maintenance teams essential
• Assessment of multiple factors weighted combination or similar
• Uncertainty in hydrology main factor
• Allowance for settlement can have adverse effect if embankment designed to beovertopped
• Development and its effect on small catchments serious
• Maintenance practices and “n” values important
• one person’s factor of safety is another person’s factor of danger
• aim to reduce uncertainty rather than quantify it
• difference between flood defence failure and structural failure – what counts is theprobability of failure within the design life span.
• Freeboard formerly more applied to recorded events to take account of the uncertaintyof the historic flood return period
• Case of replacement flood defences higher than PAGN optimum owing to PRimplications of them being overtopped
• Summing components can lead to excessive estimate, joint probability timeconsuming so use judgement & client requirements
• needs to stand up to rigorous examination in political debate
• maintenance practices important

R&D Project Record W5/042/1 14
• designer needs to be clear what event he/she is designing for and whether failure inevents that exceed the design are acceptable
• failures due to scour of toe

R&D Project Record W5/042/1 15
3. BACKGROUND AND DERIVATION OF HYDROLOGICALAND HYDRAULIC UNCERTAINTY
3.1 Introduction
In this Chapter some basic definitions related to statistical parameters are defined and therelationship between levels of risk and return period/probability of exceedence are defined inorder to set out a basis for future development of freeboard in terms of risk assessment andprobabilities.
The combined analysis of hydrological events and corresponding hydraulic responses are used todefine design water levels in systems such as rivers, canals and reservoirs. The design waterlevels can vary randomly with mean value around the design level, and can be regarded asexpected water levels at a selected risk level. The randomness in water levels is associated witherrors in the estimation of incoming loads (flows) as well as the random nature of the capacity ofthe system. Traditionally, a freeboard above the design level is allowed for to accommodate theuncertainties associated with the hydrological and hydraulic analysis. This procedure does notgive absolute safety against failure at the selected risk level (return period) but does minimise therisk of failure. The terminology return period is traditionally used to define the annual risk offailure. However the level of risk or the long term risk is a function of time and the selectedreturn period. Thus there is a greater risk of failure over a long period than over a shorter period.
3.2 Stochastic Processes
Hydrological processes are generally characterised by deterministic and random/stochasticcomponents and processes of this nature are defined as stochastic processes. When the stochasticcomponent is large in comparison with the deterministic component the process can beconsidered as purely random. The definition of statistical parameters is given in this Chapter assome understanding of statistical concepts is needed in the uncertainty analysis. Thus over a longtime period there is a greater risk of failure than over a short time period.
Probability Density Function (PDF)
The probability density function (PDF) is the functional representation of the probabilitydistribution of a random variable within a range which can vary from finite to infinite values, seeFigure 3.1.
If the PDF of a random variable x is f(x), then the following properties are applicable for thedistribution.
• total area under the distribution curve f(x) is one

R&D Project Record W5/042/1 16
• the probability of occurrence of a random variable between values x1 to x2 is the area underthe curve between x1 and x2.
It should be noted that the probability of occurrence of a value x is zero which can bemathematically interpreted as the area under a point of data on the distribution curve. Any singlevalue has an infinite number of decimal places so that the exact value may never be truly defined.
Figure 3.1PROBABILITY DENSITY FUNCTION (PDF)
x
P(x
) P(x1<X<x2)
x1 x2
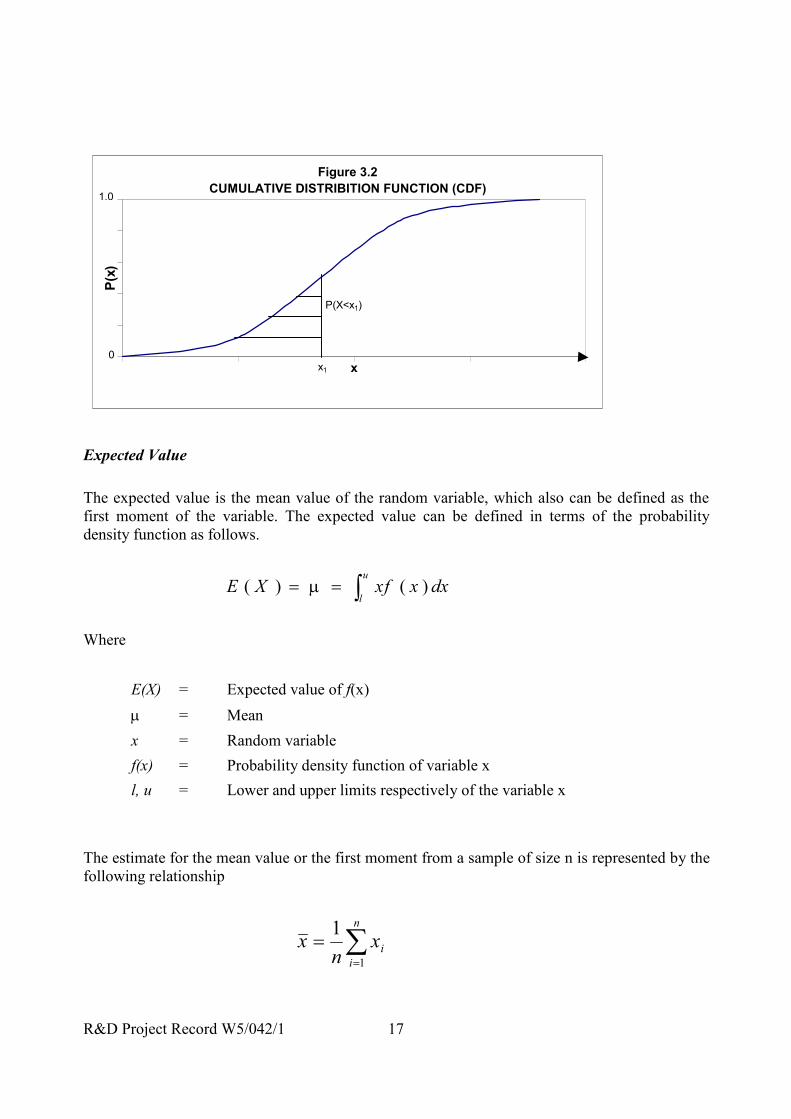
Cumulative Distribution Function (CDF)
The cumulative distribution function of random variable x is defined as the total area of the PDFfrom the lower limit of the distribution to the point x. The mathematical relationship betweenPDF and CDF is given below, see Figure 3.2.
WhereF(x) = Cumulative distribution functionu = Dummy variable of integration
The following properties are applicable for the CDF.
• CDF of a random variable x is the probability of occurrence of a value lesser than x
• The starting value of the CDF for the lower limit is zero and the value of CDF for the upperlimit is one
• The derivative of the CDF is the PDF
( ) ( )duufxFx
∫ ∞−=
R&D Project Record W5/042/1 17
Figure 3.2CUMULATIVE DISTRIBITION FUNCTION (CDF)
x
P(x
)
1.0
0
P(X<x1)
x1
Expected Value
The expected value is the mean value of the random variable, which also can be defined as thefirst moment of the variable. The expected value can be defined in terms of the probabilitydensity function as follows.
Where
E(X) = Expected value of f(x)
µ = Mean
x = Random variablef(x) = Probability density function of variable xl, u = Lower and upper limits respectively of the variable x
The estimate for the mean value or the first moment from a sample of size n is represented by thefollowing relationship
∫==u
ldxxxfXE )()( µ
∑=
=n
iix
nx
1
1

R&D Project Record W5/042/1 18
It is essential to have a sample of adequate size which is representative of the population. Thesampling errors will decrease with increase in the number of data.
Variance
The variance is the measure of the variability (scatter) of the random process, which can also bedefined as the second moment about the mean.
Where
E[(x-µ)2] = Expected value of f[(x-µ)2]
σ2 = Variance
σ = Standard deviation
Coefficient of Skewness
Coefficient of skewness define the shape of the distribution in relation to symmetry. A positiveskewness value represent a longer right tail and conversely a negative skewness represent alonger left tail. The extreme value distributions such as Gumbel, Pearson Type III and Gammaconform to positive skewness. These extreme distributions are applicable for annual maximumrainfall or flood flows. The coefficient of skewness is defined as the third moment about themean and defined by the following expression.
Where
E[(x-µ)3] = Expected value of f[(x-µ)3]
γ = Coefficient of skewness
Coefficient of variation
The coefficient of variation is the standard deviation divided by the mean, which is non-dimensional. This parameter is a non-dimensional measure of the scatter or the spread of the data
( )[ ] ( ) ( )dxxfxxEu
l
222 ∫ −==− µσµ
( )[ ]33
1µ
σγ −= xE
( )[ ] ( ) ( )dxxfxxEu
l
33 ∫ −=− µµ

R&D Project Record W5/042/1 19
set. The coefficient of variation is used frequently in this Note for analysis associated withuncertainties.
3.3 Return Per iod
The frequency of occurrence or probability of exceedence are generally used to assess the riskassociated with random variables. The definition of return period is commonly used to assess therisk of flood or to select the magnitude design engineering works.
The return period can be interpreted in the frequency domain as the value of the annual maximumdischarge which is likely to be exceeded on average once in a specified return period. The floodcorresponding to a T year return period is defined to have an average recurrence interval of Tyears or the probability exceedence equal to the inverse of the return period.
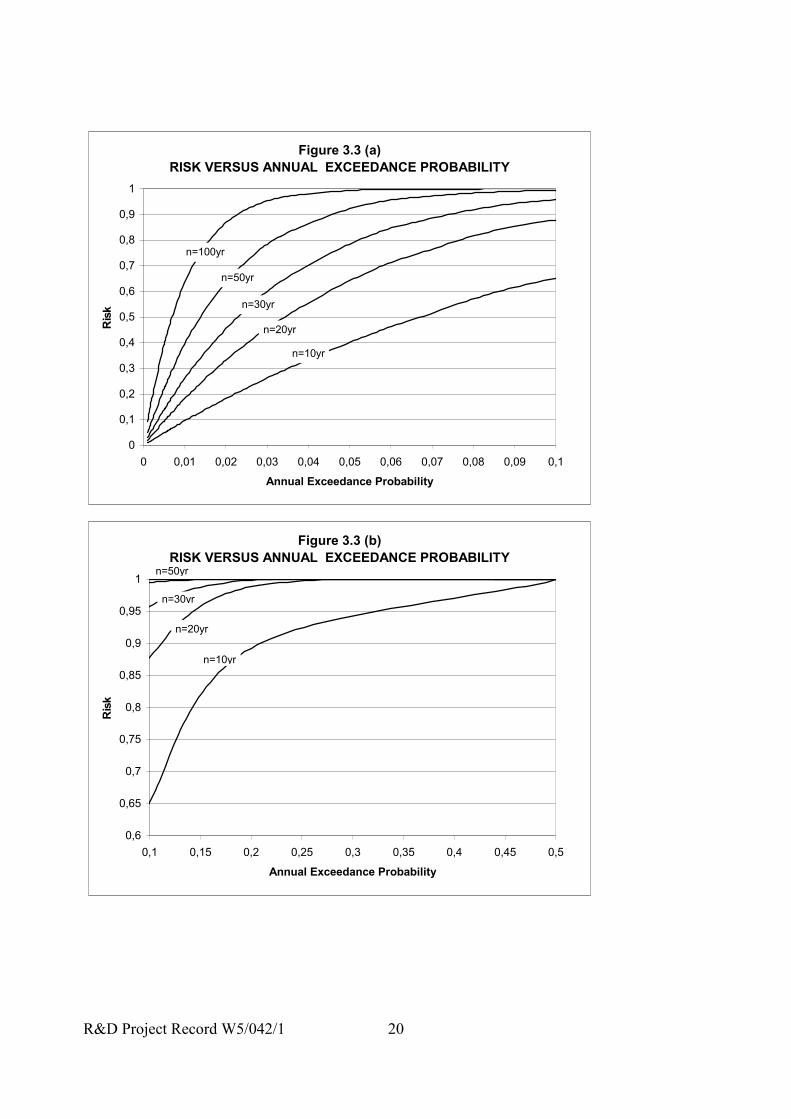
3.4 Risk Level
The level of risk is defined as the probability of exceeding a design value such as water level,discharge, or capacity of system, within a selected period which is generally the planning horizonof a system. Based on the above definition, the inverse of a return period of an event is theprobability of exceeding the event in any year, which is the risk associated in a period of oneyear. As the period increases the level of risk or the probability of exceeding an event alsoincreases. The risk of exceeding an event x with a probability density function f(x) and during aperiod of N years is defined by the following expression.
WhereR = Risk of exceeding event value xN = Number of years
The above equation can also be defined in relation to the return period (T years) with thefollowing expressions.
The plots of level risk versus probability of exceedence are presented in Figure 3.3 for selectedperiods. Figure 3.3(b) is a continuation of the plots in Figure 3.3(a) for annual exceedanceprobabilities greater than 0.1.
( )
−−= ∫
∞ N
xxfR 11
−−=
N
TR 111
R&D Project Record W5/042/1 20
Figure 3.3 (a)RISK VERSUS ANNUAL EXCEEDANCE PROBABILITY
0
0,1
0,2
0,3
0,4
0,5
0,6
0,7
0,8
0,9
1
0 0,01 0,02 0,03 0,04 0,05 0,06 0,07 0,08 0,09 0,1
Annual Exceedance Probability
Ris
k
n=10yr
n=20yr
n=30yr
n=100yr
n=50yr
Figure 3.3 (b)RISK VERSUS ANNUAL EXCEEDANCE PROBABILITY
0,6
0,65
0,7
0,75
0,8
0,85
0,9
0,95
1
0,1 0,15 0,2 0,25 0,3 0,35 0,4 0,45 0,5
Annual Exceedance Probability
Ris
k
n=10yr
n=20yr
n=30yr
n=50yr

R&D Project Record W5/042/1 21
3.5 Stochastic Proper ties of Linear Systems
River systems are characterised by non-linear behaviour in relation to variation of water level,change in discharges or resistance parameters. However the system may be represented as linearwhen changes in water level or discharges are small. As the incremental change in level ordischarge increases the accuracy of prediction based on linearity becomes less.
The design estimates of flows, resistance parameters and water levels include some degree ofuncertainty which are inherited from measurement errors, sampling errors and the accuracy of theequations used in the analysis. The predicted parameters can be regarded as random with its meanequal to the estimated value. The priori distribution of a random variable and its statisticalparameters can be either obtained from measurements or from analysis or from judgement of thepossible state of nature. In this context the priori distribution of independent variables can berelated to the inflows, channel resistance or flow area.
The posteriori distribution for the dependent variable such as water level can be evaluated usingthe priori distribution. Two approaches are recommended to obtain the posteriori distribution.The first one is based on approximation to linear behaviour of the system in relation to the inputs.The second approach is based on evaluating the posteriori distribution by using large number ofgenerated data for the priori distribution and applying an appropriate model or equation to predictthe results, which are then analysed to obtain the appropriate distribution. The first approach isalso defined as First Order Error Analysis and the latter is commonly termed as Monte CarloSimulation. Both these approaches are described in the following sections.
3.5.1 First Order Er ror Analysis (FOEA)
The FOEA requires the estimates of the mean and variance of the independent variables. Thisinformation is used to obtain the properties of the dependent variable such as water level at adefined location in a channel. Assume a dependent variable y related to n number of randomvariables x1, x2, x3 …….and xn with the following functional relationship.
Using Taylor’s series expansion about the mean value, the function can be represented in thefollowing form up to first order term.
).................,,( 321 nxxxxfy =
)(),........,(1
21 ii
n
i in xx
xy
xxxfy −∂∂
+= ∑=

R&D Project Record W5/042/1 22
The expected value of y for the above function is given by:
The variance of y is defined as:
When the variables are independent the variance is expressed as:
and the standard deviation of the dependent variable y is given by:
The above expression is useful for the FOEA. The Manning’s Equation is generally used toobtain the water level for a given discharge and the equation is given below.
Where
Q - Discharge in m3/sA - Flow area in m2
P - Wetted perimeter in mN - Manning’s resistance coefficientS f - Friction slope
Assume Q, N, A, P and S f are random and independent then the standard deviation of thedependent variable y (water level) is given by:
)......,,.........,()( 21 xxxfYEy ==
),()(1 1
jij
n
i
n
j i
xxCovxy
xy
yV∂∂
∂∂
= ∑ ∑= =
)()()()(2
2
2
21
2
1n
n
xVarxyxVar
xyxVar
xyyV
∂∂+−−−−−−−−+
∂∂+
∂∂=
2
2
22
2
2
21
2
1
2n
ny S
xy
Sxy
Sxy
S
∂∂
+−−−−−−−−+
∂∂
+
∂∂
=
fSPA
NA
Q3/2
=
2
2
22
22
22
22
2
fSPNQS
SyS
PyS
AyS
NyS
QyS
fAy
∂∂
+
∂∂
+
∂∂
+
∂∂
+
∂∂
=

R&D Project Record W5/042/1 23
The first partial derivative in the above equation is expressed using Manning’s equation as:
The partial derivatives for the second variable is derived by using the following relationship:
Similarly the partial derivatives for the other variables are defined below:
Using the above expressions the standard deviation of the dependent variable is expressed by thefollowing equation.
Where CV is the coefficient of variation of each variable, which is denoted in the suffix of CV,The above equation can also be derived using differencing technique instead of differentiation.The differencing technique involves applying a small change (or perturbation) for each variableand obtaining the corresponding variation of independent variable. The derivative is thenobtained by dividing the change in y with the applied value of perturbation for the correspondingvariable. The differencing technique can also be employed in hydraulic models.
In estimating the standard deviation for y, the variables with insignificant variability can beignored. An example of using Manning’s equation for FOEA is given in the main Guidance Note.
CQQ
yP
PyA
AQy 1
32
35
1=
∂∂
−∂∂
=∂∂
NCy
QNQ
Ny 11 =
∂
∂
∂∂=
∂∂
ACyQN
QAy
351
=
∂∂
∂∂
=∂∂
PCyQP
QPy
321
=
∂∂
∂∂
=∂∂
CSyQS
QSy
fff 211
=
∂∂
∂∂
=∂∂
5.022222
41
94
9251
++++=
FSPANQy CVCVCVCVCVC
S

R&D Project Record W5/042/1 24
3.5.2 Monte Car lo Simulation (MCS)
For non-linear systems, a recommended approach is to obtain the output of the dependentvariable by performs repeated simulation using randomised inputs based on their probabilitydistribution. This technique is called the Monte Carlo Simulation is a very useful approach tostudy the probability distribution characteristics of the output variable. The analysis involveslarger number of simulations required to define the PDF of the dependent variable. MCSrepresents an attractive method and the increase in computer speeds and the robustness of thehydraulic models making this method very attractive for decision makers.
3.6 Composite Exceedance Probability
The risk of failure associated with hydrologic processes is in general defined in terms ofprobability of exceedance for a defined period. For any design level or return period, there arenumber of sources of uncertainty in the estimates arising from measurement errors, samplingerrors and the accuracy of equations and methodology used in the analysis.
Conventionally design water levels are selected by calculating the water level at a chosen returnperiod. When design water levels are exceeded it is then often assumed that the discharge wasgreater than the return period designed for. However there is not a one to one relationshipbetween discharge and water level and there are other factors influencing water level other thanthe magnitude of the discharge. Variations in channel properties such as cross-sectional area androughness from mean design values, account for variations in water level for any given discharge.Therefore for any return period of discharge there is a range of water levels that can be expecteddue to these uncertainties.
Composite risk analysis produces an overall risk by combining the uncertainties at all risk levelsfor the selected design level. For example at a selected design water level which is based on adischarge of certain return period and estimated parameter values such as Manning’s n and area,there is some probability that this water level will be exceeded at all return periods due to theuncertainties in the hydraulic properties of the channel. The actual probability density function ismulti-dimensional. Composite risk analysis enables the probability of exceedance (or risk offailure) for any design water level to be estimated.
Using first-order error analysis as described previously the standard deviation of the dependentvariable can be obtained knowing the mean and variance of the independent variables. Theprobability density function at each return period (or risk level) can be defined from which theprobability of exceedance at each return period (or risk level) can be calculated for a selecteddesign water level. This probability of exceedance is integrated across the entire range of risklevels to obtain a composite exceedance probability.
Often design procedures account for uncertainties by applying arbitrary safety factors orfreeboard. Composite risk analysis can be used to estimate what factor of safety is required toaccount for the uncertainties in design level prediction.

R&D Project Record W5/042/1 25
Composite exceedance probability can be defined by the function:
For numerical integration, this equation can be represented by
Where,
f(x) = Probability density function of expected water level x (∞ < x < -∞)
g(x,y) = Probability density function of uncertainty for an expected water level x (∞
< y < -∞)
yf = Selected design water level which is equal to the water level correspondingto the design return period plus the added freeboard.
The probability density function g(x,y) is assumed to be represented by a normal distribution. Ingeneral the accuracy of a normal distribution increases with the sample size.
The accuracy of the integration in the second equation depends on the chosen intervals for ∆x.The smaller the interval, the greater the final accuracy of the summation. The recommendedprocedure is to adjust ∆x in the solution domain until the solution converges to an acceptablelevel.
∫ ∫∞
∞−
∞
fydydxyxgxf ),()(
∑ ∑∞
−∞=
∞=
=
∆∆x
y
yy
yyxgxxff
),(.)(

R&D Project Record W5/042/1 26

R&D Project Record W5/042/1 27
4. FREEBOARD AND DEVELOPMENT CONTROL
4.1 Development and Flood Risk Guidelines
Guidance on development in flood risk areas in England and Wales is provided by theDepartment of the Environment Circular 30/92, Development and Flood Risk (Department of theEnvironment, 1992). This supersedes Circular 17/82, Development in Flood Risk Areas - Liaisonbetween Planning Authorities and Water Authorities (Department of the Environment 1982). Itsets out the process and responsibilities of the Environment Agency in its role as a statutoryconsultee in the preparation of local authority Development Plans and in its role as a consultantfor development in flood risk areas.
Guidelines on planning in flood risk areas in Scotland are provided by the Scottish Office’sNational Planning Policy Guideline, NPPG7, Planning and Flooding (The Scottish Office, 1995).It provides guidance to planning authorities, developers and the public on flood risk and itsconsequences that could affect planning and development decisions. Though Scotland is notwithin the area of responsibility of the Environment Agency it is useful to compare thisGuidance.
Neither guidance document gives specific guidance on how or whether freeboard should be takeninto account during the preparation of development plans or when responding to consultations onplanning applications. Circular 30/92 does however note that development plans and policiesrelating to development plans in flood risk areas should relate to the degree of flood risk asnotified by the Agency, primarily in the form of Section 105 surveys. Freeboard has been used inthis Guidance to quantify the degree of flood risk and hence should be considered in developmentplanning and control.
The Environment Agency has developed guidelines on how to respond to consultations onplanning applications in the Flood Defence Regulation Manual (Environment Agency ProceduralManual – Volume 31). The Manual provides brief guidance on specifying floor levels in relationto flood levels for developments both within natural floodplains and behind flood defences. Therelevant extract from Volume 31 is reproduced below for reference:
‘6.6 DEVELOPMENT ADJACENT TO FLOODPLAINS AND IN DEFENDEDAREAS (FREEBOARD)
6.6.1 Where development takes place outside the floodplain, there is still a r isk offlooding. In areas immediately adjacent to the floodplain we should thereforerecommend to the planning author ities and developers that floor levels be raisedto be 600 mm above highest recorded flood level or 600 mm above the 1 in 100year flood level if known. The additional freeboard is to provide a reasonablemargin against uncer tainty in the flood level and for other factors such as windor vehicle generated waves.

R&D Project Record W5/042/1 28
6.6.2 When consulted over new development in defended areas, the Agency mustconsider the standard of those defences. The design flood levels, asset condition,ar rangements for maintenance and the r emaining life of the defences should allbe taken into account.
6.6.3 The Agency should object to development proposals behind existing flood or seadefences where those defences are not of an appropr iate standard fordevelopment. It may be appropr iate for the development to take place providedthat the developer is r equired to protect the new proper ty to a suitable standardas par t of the development. This may involve upgrading the defences or raisingthe proper ty threshold levels.
6.6.4 For development in areas protected by a 1 in 100 year defence, we shouldnever theless recommend floor levels be raised 600 mm above existing groundlevel as a nominal protection against over topping or breach of the defence. If alesser standard defence protects the area, then proper ty should be raised to beabove the 1 in 100 year level at least.
6.6.5 These freeboard recommendations may need to be var ied in relation to existingcircumstances or local custom and practice.
6.6.6 Adequate provision must always be made for the disposal of sur face waterrunoff from new development in a protected area dur ing flood times whengravity discharge is impeded.’
Section 4.2 discusses the suitability of the above guidelines in the light of the findings of thisR&D study.
It should be noted that this Guidance Note’s definition of freeboard is the difference between awater level and a defence level. The guidelines above relate water levels to floor levels andhence are outside the strict definition of freeboard. Some of the principles, however, remain thesame.
4.2 Suitability of Guidelines
4.2.1 Threshold of flood loss
Clauses 6.6.1 and 6.6.4 of the Flood Defence Regulation Manual provide recommendations onfloor levels in relation to flood levels. The first aspect to establish is whether advice should relateto floor levels or whether significant flood damage either begins to occur at a lower level or onlyoccurs at a higher level.
By examining flood damage against flood depth data from the Flood Loss AssessmentInformation Report (FLAIR) an assessment can be made of the threshold of flood damage forresidential and non-residential assets. Figure 4.1 shows flood depth/direct flood loss curves forsome typical asset types. The curves show, as might be expected, that for most types of asset
R&D Project Record W5/042/1 29
flood loss for flood levels below floor levels are relatively small but that once flood levels riseabove floor levels then significant damage occurs. This confirms that the threshold of flood losscan in most cases be considered to be floor level.
4.2.2 Developments unprotected by defences
Clause 6.6.1 of the Flood Defence Regulation Manual recommends that floor levels inundefended areas should be 600 mm above the highest recorded flood level or 600 mm above the100 year flood level.
The adoption of the 100 year flood level as a standard relates to Circular 30/92, which describesit as normally defining the limits of the floodplain. This is also consistent with PAGN’sIndicative Standard for urban areas. It may be appropriate to reconsider this as a standard. PAG3,for example, gives a range of return periods for its Indicative Standards, in particular 50 to 200years for a typical urban area. In addition the Easter 1998 Floods Report by Bye and Horner intothe Easter flooding recommends re-evaluation of standards:
1.6 (11) ‘Underlying standards of flood protection were appropriate prior to Easterbut should be re-examined taking account of the resulting changed understandings ofrisk and having regard to climate change implications.’
Deciding on an appropriate ‘benchmark’ return period flood is outside the scope andresponsibility of this Guidance Note. It is suggested though, that the nature of the development betaken into account when deciding on an appropriate return period flood. As an example it may beappropriate to specify protection against a higher return period flood for a residential care homecompared with a retail outlet because of the societal consequences of flooding.
In many areas flood levels associated with specific return periods are not known as statisticalanalysis of flood records and flood routing has not been carried out. Instead only historical floodlevels are known and frequently only the highest recorded level has been recorded. In these casesunless a statistical analysis is carried out it will not be known whether the highest recorded floodlevel has a higher or a lower return period than the ‘benchmark’ return period flood level.
There is therefore greater uncertainty associated with using the highest recorded flood level.Hence any planning recommendation should take this into account and where appropriate requestthat the developer carries out investigations to obtain flood level information. At its most basicthis may take the form of using the Flood Studies Report, or its replacement the Flood EstimationHandbook, to develop the flood hydrograph for the ‘benchmark’ flood at the site and assumesteady state conditions to estimate the flood water level.
Clause 6.6.1 describes the 600 mm allowance above the flood level as an allowance foruncertainty in the flood level and for other factors such as wind or vehicle generated waves. Howappropriate 600 mm is as an allowance can be considered in relation to the findings of Chapters 4to 6. Section 4.3 gives a method for determining a wind generated wave surcharge allowance.
R&D Project Record W5/042/1 30
However, this method is used to determine an allowance to reduce the risk of failure of a flooddefence embankment. The method cannot therefore be compared directly with avoiding flooddamage as a result of wind generated wave action. Vehicles traversing flooded roads generatewaves in a similar manner to boatwash and this can have an impact on the flood damage tonearby properties. It therefore appears reasonable to make an allowance for wind and vehiclegenerated waves. Experience would suggest that an allowance of between 200 and 300 mm forcombined wind and vehicular wave action would be appropriate.
It is suggested that this allowance be determined using the multi-attribute technique set out inChapter 5.
4.2.3 Developments protected by defences
Clause 6.6.4 of the Agency’s guidance document recommends floor levels for developmentsprotected by existing flood defences. For developments protected by defences of a 1 in 100 yearstandard, floor levels 600 mm above ground level are specified. Where the defence is of less thana 1 in 100 year standard then floor levels at or above the 100 year return period flood level arerecommended.
The raising of floor levels above ground level for new developments behind existing defencesappears to be a valid common sense approach. It means that if defences fail, or are bypassed, or ifthere is flooding owing to surface drainage problems then properties have a safety margin againstflooding.
Whether 600 mm is an appropriate safety margin behind defences protected to a 100 yearstandard is open to debate. Determining a different safety margin for each development wouldrequire a consideration of how a flood wave might propagate from, for example, a breach.Analysis of flood wave propagation is complex and highly dependent on the shape of the floodhydrograph, the breach mechanism and topography. Hence generalisations based on the physicalresponse of the area being flooded are difficult to make. An allowance of 600 mm appears areasonable value. However where either of the following two situations apply, a differentallowance may have to be considered.
• development immediately behind a defence;
• development in floodplains with a limited amount of storage where the flood water level inthe floodplain would rapidly rise to river flood level.
For developments behind defences which have a standard of less than 100 years therecommendation given in Clause 6.6.4 is that floor levels should be set to at least the 100 yearflood level. The concept behind this recommendation would appear to be that developmentsshould be protected to a reasonable and consistent standard even if existing adjacentproperties/assets are not currently being protected to that standard. It may be that the investmentto improve the protection of those existing properties has not yet been made or it may be the casethat improvements are not justifiable economically.

R&D Project Record W5/042/1 31
The recommendation is less stringent than the recommendation for areas unprotected bydefences. This is probably based on two assumptions:
• there is a probability that the defence will in fact protect to a higher standard;
• when flooding does occur, flood levels behind the defence may not rise to the same level asthe flood water level in the river.
In many cases the recommendation will result in floor levels being set to greater than 600 mmabove ground level but in other cases, particularly at the edges of floodplains, floor levels will beless than 600 mm above the ground level.
As discussed in Section 4.2.2, use of the 100 year flood level and the 100 year defence standardmay have to be reviewed in the light of the Easter 1998 Floods Report.
4.2.4 Other recommendations
The advice given in Clause 6.6.5 of the Flood Defence Regulation Manual that freeboardrecommendations should suit the particular circumstances is considered to be apt, though it doesmake consistency nationwide more difficult.
4.3 Section 105 Surveys
Section 105 (2) of the Water Resources Act 1991 requires the Environment Agency to carry outsurveys to identify the extent of floodplains and land liable to flood. The surveys are underwayand are being used for development planning and development control. An example of theirinfluence was given in the 1998 MAFF Conference (Ramsbottom et al, 1998). At a developmentin Oxfordshire, land on the river side of the 100 year flood envelope was valued at £4 000 perhectare whereas land immediately outside the flood envelope was valued at £600 000 per hectare.The difference was owing to planning permission being granted for land outside the floodenvelope.
However, it must be borne in mind that the flood envelopes are only best estimates and have adegree of uncertainty associated with them. The uncertainty arises from reasons includinguncertainties in the methods used to derive or estimate the flood level, changes in land use withinthe catchment, changes in maintenance practices, assumptions regarding the operation ofstructures, assumptions about blockages and possibly future climate change.
There is therefore a valid argument to add an allowance for uncertainty on to the best estimate ofthe flood level when developing flood maps, to avoid under-estimation of the flood extent. Thisapproach may face opposition from local authorities and developers given the pressure on landuse and the effect of flood limits on land values. As a first step towards a discussion on this issuethose commissioning and using Section 105 surveys should be aware that flood envelopes have adegree of uncertainty and the size of that uncertainty will be related, amongst other things, to thetype of method used to undertake the survey.

R&D Project Record W5/042/1 32

R&D Project Record W5/042/1 33
5 REVIEW OF PROJECT APPRIASAL IMPLICATIONS
5.1 Purpose of Review
5.1.1 Freeboard and Project Appraisal
Chapter 2 of the Freeboard Guidance Note sets out the approach to be used for taking account offreeboard during the Project Appraisal process and in particular during the analysis of costs andbenefits and when assigning Standards of Protection to existing or proposed defences. Theapproach is summarised below and illustrated in Section 5.1.2:
From PAG3:
‘Freeboard should only be used to take account of uncertainty in scheme performance…. Wherethe height of the defence (including freeboard) is then designed to accommodate such uncertaintythe benefits of the defence should be those appropriate to the calculated design standard.
For example if a 50 year standard defence is constructed with an additional crest height to allowfor uncertainty in the hydrology and hydraulic analysis then the only benefits that should beassumed to accrue will be those appropriate to the 50 year standard (ie 0.02 probability ofovertopping).’
Flood defences are designed to provide a “standard of protection” which has traditionally beenexpressed as the frequency or return period of the design flood (e.g. the 1 in 50 year flood, orsimply the 50 year flood). This does not mean, of course, that the level of the defence is set at theestimated water level for this event. A freeboard (or safety margin) is usually added to give ahigh degree of confidence that the defence will provide protection of the standard intendedthroughout its design life.
This system works well for the design of new defences, but can cause problems whendetermining the standard of protection of an existing defence. To provide a consistent approach,an allowance for uncertainty and physical processes (i.e. freeboard) should be deducted from theexisting defence level to derive a flood level. There is then a high degree of confidence that thedefence will protect against this flood level. The return period of the flood level is the standard ofprotection.
It is important to note that the standard of protection and the threshold of flooding/overtopping ofa defence are not the same. The former is the standard that will be withstood with a high degreeof certainty. The latter is the best estimate of how the defence would respond to floods.
Advice:Freeboard does not change the assumed threshold
of flooding used in the economic analysis
R&D Project Record W5/042/1 34
5.1.2 Illustration of the use of Freeboard in Scheme Appraisal
Figure 5.1 shows an example of a typical water level–return period relationship. Confidencelimits, shown dashed, can be derived for this relationship. The figure shows the inter-relationshipbetween water level, freeboard, defence level and return period.
With reference to Figure 5.1, if:A = allowance for physical processesB = allowance for Uncertainties
then the following applies for determining benefits:Assessment of Return Period (Y) for the onset of flooding – Existing DefenceThis should be assessed as the return period at which the water level = level of existing defenceminus A.Assessment of Return Period (Z) for the onset of residual flooding – Proposed DefenceThis should be assessed as the return period at which the water level = level of proposed defenceminus A minus B.
In addition the following applies when stating Standards of Protection:Assessment of the Standard of Protection (X)– Existing DefenceThis should be assessed as the return period at which the water level = level of existing defenceminus A minus BAssessment of the Standard of Protection (Z)– Proposed DefenceThis should be assessed as the return period at which the water level = level of proposed defenceminus A minus B
Once constructed the Proposed Defence becomes an Existing Defence and:Assessment of Return Period (W) for the onset of flooding – Now an Existing DefenceThis should be assessed as the return period at which the water level = level of defence minus A.
5.1.3 Issues raised by Approach
The purpose of the review was to consider how this approach compares with an approach thatdoes not consider an allowance for freeboard. In particular two issues are raised:
Existing Defence
Threshold of Flooding ≠ Standard of Protection so how does the threshold of flooding (Y inFigure 5.1) compare with Standard of Protection (X in Figure 5.1).
Threshold of Flooding ≠ Standard of Protection
R&D Project Record W5/042/1 35
Proposed DefenceHow does the Standard of Protection of a proposed defence (Z in Figure 5.1) compare with thethreshold of flooding if that defence is analysed in the future (W in Figure 5.1).
5.1.4 Comment on Review
Chapter 6 of the Guidance Note shows that the current (deterministic) methods for determiningthe water level- return period relationship are underestimating the probability of occurrence offlood levels compared with probabilistic methods. Thus the issue raised by the review is not astraightforward comparison of “including freeboard” versus “not including freeboard” and theconsequences for Project Appraisal. Instead it in fact compares the current deterministic methodwith the use of probabilistic methods.
5.1.5 Methodology
Four case studies were reviewed with the aim that they represented a reasonable cross-section ofsituations that will occur in practice. The Case Studies are:
River CamThis case study was used in the main Guidance Note and therefore information was readilyavailable to analyse. It represents a medium sized lowland river (Q50 = 50 m3/s approximately)for which there is a good flow record (50 years in length).
River Cam – shor t recordOf interest in the review is the effect that a short length of flow records would have on freeboard.Therefore the flow record for the River Cam was artificially shortened to 10 years and comparedwith the main River Cam Case Study.
River Ouse at SelbyA Flood Alleviation Scheme is currently under consideration at Selby to protect against floodingfrom the River Ouse. The freeboard approach used in the Guidance Note was tested on thescheme. Appendix A is a Design Note summarising the findings. The Ouse at Selby is tidal hencestrictly it is outside the scope of the Guidance Note. However the methods were developed toapply in this situation. The Ouse represents a large river (Q50 > 500 m3/s).
Clipstone BrookThis is a fairly small (Q50 = 22 m3/s) river in Hertfordshire for which a short flow record (13years) was readily available. Clipstone Brook represents a small flashy rural stream.
The three stages in the review methodology are summarised below:
1) Der ive the standard deviation in water levelThe standard deviation in water level was derived using the method of first order error analysis(FOEA) described in Chapter 6 of the Guidance Note. Five return period events were consideredin each Case Study: 10, 20, 50, 100 and 200 year events each with different standard deviationsin water level.

R&D Project Record W5/042/1 36
Chapter 6 proposes that to account for uncertainty in the hydraulic/hydrological processesbetween half and one standard deviations in water level should be added to the water levelderived from current (deterministic methods) as a freeboard allowance.
2) Show graphically the water level – r eturn per iod relationshipThe water level – return period relationship was determined (or was available from previouswork) and was plotted graphically.Curves were added to this graph for:water level + 0.5 standard deviationswater level + 1.0 standard deviations
3) Compare return per iodsTwo comparisons were made from the graphs as summarised in Section 5.1.3:
Existing DefenceThreshold of Flooding ≠ Standard of Protection so how does the threshold of flooding (Y inFigure 5.1) compare with Standard of Protection (X in Figure 5.1).
Proposed DefenceHow does the Standard of Protection of a proposed defence (Z in Figure 5.1) compare with thethreshold of flooding if that defence is analysed in the future (W in Figure 5.1).
The comparisons were made for each of the five return period events for:a freeboard allowance of 0.5 standard deviationsa freeboard allowance of 1.0 standard deviationsThe details of how this was carried out is shown in the example below:
Example of Compar isonFigure 5.2 shows the water-level return period relationship for the River Cam with a curve addedshowing water level + 1.0 standard deviations.
From the figure the following can be determined:
1) For an existing defence with a crest level of 4.25 mAOD, the onset of flooding would be at areturn period (Y) of 50 years. The Standard of Protection (X) claimed would be equivalent tothe return period that corresponds with a water level = 4.25 – 0.20 (1.0 standard deviation) =4.05 mAOD. The water level return period relationship shows that for this water level thereturn period is 17 years.
2) For a proposed defence that will have a 20 year Standard of Protection (Z) the defence wouldbe constructed to a crest level of 4.07 + 0.22 (1.0 standard deviation) = 4.29 mAOD. In thefuture if this defence is analysed the onset of flooding would occur when the water levelreaches 4.29 mAOD. The water level return period relationship shows that for this water levelthe return period (W) is 62 years.

R&D Project Record W5/042/1 37
5.2 River Cam Case Study
The standard deviation in water level was derived during work carried out for the Case Study inthe Guidance Note for a full range of return periods. Figure 5.3 shows the water level returnperiod relationship for the River Cam and curves of water level + 0.5 and + 1.0 standarddeviations. Comparisons were made between return periods ‘X’ and ‘Y’ and between returnperiods ‘Z’ and ‘W’ as described in Section 5.1.5. The results are summarised in Table 5.1:
Table 5.1 River Cam – Compar ison of Return Per iods
Standard of Protection X (years)Threshold offlooding Y (years) 0.5 standard
deviations1.0 standarddeviations
Existing Defence 102050100200
6.913254991
4.98.5172848
Future threshold of flooding W (years)Standard ofProtection Z
(years)0.5 standarddeviations
1.0 standarddeviations
Proposed Defence 102050100200
1634105225480
2562210500
> 1000
5.3 River Cam – Shor t Record Case Study
The main River Cam Case Study uses a flow record of 50 years length. This was artificiallytruncated to a flow record of 10 years to examine the effect that this would have on freeboard.The same discharge - return period relationship as for the Main Case Study was used for thisCase Study but with the discharges having larger standard deviations to reflect the greateruncertainty in discharge for the smaller flow record. The standard deviation in water level wasderived using FOEA for a range of return periods. This is plotted along with the water level –return period relationship on Figure 5.4.
The increase in standard deviation in water level compared with the Main Case Study was of theorder of 50 to 100 mm. For example for the 10 year return period event the standard deviation in

R&D Project Record W5/042/1 38
water level was 0.20 m for the 50 year flow record and 0.26 m for the 10 year flow record.Similarly for the 100 year return period event the standard deviations were 0.26 m and 0.35 m forthe 50 year and the 10 year flow records respectively. This represents an increase of about 30 %in the standard deviation and hence in the magnitude of freeboard that would be adopted fordesign.
Comparisons were made between return periods ‘X’ and ‘Y’ and between return periods ‘Z’ and‘W’ as described in Section 5.1.6. The results are summarised in Table 5.2:
Table 5.2 River Cam Shor t Record – Compar ison of Return Per iods
Standard of Protection X (years)Threshold offlooding Y (years) 0.5 standard
deviations1.0 standarddeviations
Existing Defence 102050100200
6.311244073
4.47.1132132
Future threshold of flooding W (years)Standard ofProtection Z
(years)0.5 standarddeviations
1.0 standarddeviations
Proposed Defence 102050100200
1841130300
>500
3395330
>500>1000
5.4 River Ouse at Selby Case Study
A flood alleviation scheme is currently under appraisal for the River Ouse at Selby. As part of theappraisal a suitable value for freeboard was determined. The Ouse at Selby is tidal hence thefreeboard procedure developed in the Guidance Note was adjusted to apply for this situation.Both the Quick Method and the FOEA were used to estimate a freeboard value for a 200 yearsstandard flood alleviation scheme. The Quick Method indicated an allowance for uncertainty of0.15 m was appropriate while the FOEA indicated that 0.10 m was appropriate. This wasconsidered a reasonable correlation between methods given the assumptions made. Appendix Asummarises the procedure used and serves as an example of the use of the methods in practice.

R&D Project Record W5/042/1 39
For this review the standard deviation in water level was determined for a range of return periodsand is plotted in Figure 5.5 on the water level return period graph.
Comparisons were made between return periods ‘X’ and ‘Y’ and between return periods ‘Z’ and‘W’ as described in Section 5.1.5. The results are summarised in Table 5.3:
Table 5.3 River Ouse at Selby – Compar ison of Return Per iods
Standard of Protection X (years)Threshold offlooding Y (years) 0.5 standard
deviations1.0 standarddeviations
Existing Defence 102050100200
8.714275967
7.710163045
Future threshold of flooding W (years)Standard ofProtection Z
(years)0.5 standarddeviations
1.0 standarddeviations
Proposed Defence 102050100200
143683300600
2067210900
>1000
5.5 Clipstone Brook Case Study
Clipstone Brook is a small rural stream for which 13 years of flow records and some limitedtopographic survey were available. It was therefore considered to represent the situation whererelatively limited data is available for a small flood alleviation scheme.
The flow record was analysed and a discharge - return period relationship was determined. Asteady state computational hydraulic model was set up using HYDRO of a short length (about500 m) of the Brook and a stage - discharge relationship at the location being considered wasdetermined. Hence a water level - return period relationship was derived. An allowance foruncertainty was determined using both the Quick Method and FOEA for a range of returnperiods. The results given by the different methods compared well: for the 50 year water level astandard deviation from FOEA of 0.24 m was determined, while the Quick Method gave anallowance of 0.26 m. Appendix B summarises the results of both methods.

R&D Project Record W5/042/1 40
The water level - return period relationship was plotted and curves of 0.5 and 1.0 standarddeviations were added, see Figure 5.6.
Comparisons were made between return periods ‘X’ and ‘Y’ and between return periods ‘Z’ and‘W’ as described in Section 5.1.5. The results are summarised in Table 5.4:
Table 5.4 Clipstone Brook – Compar ison of Return Per iods
Standard of Protection X (years)Threshold offlooding Y (years) 0.5 standard
deviations1.0 standarddeviations
Existing Defence 102050100200
7.112294263
5.39.1182533
Future threshold of flooding W (years)Standard ofProtection Z
(years)0.5 standarddeviations
1.0 standarddeviations
Proposed Defence 102050100200
1733145330700
28635001000
>1000
5.6 Summary of Results
Comparison of the results of the Case Studies shows that results are consistent between CaseStudies irrespective of whether there is a high or low degree of uncertainty in the water levelpredicted. There is a wider variation between whether 0.5 or 1.0 standard deviations are used asan uncertainty allowance than between Case Studies. Figures 5.7 and 5.8 compare, for an existingdefence, the threshold of flooding(Y) with the Standard of Protection (X) for uncertaintyallowances of 0.5 and 1.0 standard deviations respectively.
Figure 5.9 and 5.10 compare, for a proposed defence, the Standard of Protection (Z) with thethreshold of flooding if that defence is analysed in the future (W) for uncertainty allowances of0.5 and 1.0 standard deviations respectively.
Table 5.5 summarises the typical range of results:

R&D Project Record W5/042/1 41
Table 5.5 Summary of Results
Existing Defence
Threshold of flooding Y =1/Probability of exceedance
Standard of Protection X (years)
102050100200
5 – 79 – 1317 – 2828 – 5040 – 80
Proposed Defence
Standard of Protection Z(years)
Future Threshold of flooding W =1/Probability of exceedance
102050100200
17 – 2738 – 70
110 – 300300 – 650
550 - >1000Note: lower bound is for uncertainty allowance of 0.5 standard deviations, upper bound for 1.0 standard deviations
A reasonable difference in return periods/probabilities is apparent between X and Y and betweenZ and W. This does not however mean that the analysis is flawed or that it is over-conservative,instead it demonstrates what is intuitively known that:
• the difference in water level between return periods is often less then the uncertainty in waterlevel prediction;
• there are dangers in the deterministic approach where the uncertainty in water level is notconsidered as this can lead to the construction of defences that will not protect against lowerthan design standard floods with a high degree of confidence.
Overarching this is the principle described at the start of this Chapter that the current(deterministic) methods for determining the water level- return period relationship areunderestimating the probability of occurrence of flood levels compared with probabilisticmethods, which the table above demonstrates.
Another conclusion that can be drawn for this review is the value of a good flow record. The CamCase Study showed a 30 % decrease in uncertainty as the length of the flow record increasedfrom 10 years to 50 years.
The review also looked at the effect that the inclusion of freeboard would have on the choice ofscheme during Project Appraisal compared with a situation where freeboard was not considered.

R&D Project Record W5/042/1 42
The River Cam Case Study was used as an example. The additional cost of constructing afloodwall to various standards with freeboard was compared with the cost of construction withoutfreeboard. A cost benefit analysis was carried out for both conditions. The cost benefit analysesshowed that the inclusion of freeboard did not affect which option was the preferred option. It’sonly effect was to reduce the benefit-cost ratios of all options by a small amount (less than 5 %).

R&D Project Record W5/042/1 43
APPENDIX A: SELBY FLOOD ALLEVIATION SCHEMEDESIGN NOTE – FREEBOARD
A.1 Introduction
This design note summarises the analysis carried out to determine appropriate freeboard valuesfor the proposed Selby Flood Alleviation Scheme. The analysis uses the methods set out in theAgency’s Fluvial Freeboard Guidance Note R&D Technical Report W187. The Guidance Note,though not yet published, and in the public domain is in its final draft. The Guidance Note isintended for use on fluvial river only. Thus the methods have had to be developed to beappropriate to the tidal conditions experienced during flood events at Selby.
A.2 Summary of Methodology
The concept behind the Guidance Note is to move away from fixed freeboards for flood defencesand instead consider the processes that may affect the integrity of a defence on a case by casebasis. Freeboard can be divided into two elements:
• an allowance for physical processes (other than water level) that affect the integrity of thedefence level e.g. waves, settlement
• an allowance for uncertainty in our predictions of water level etc (i.e. a safety factor)
The methodology used is outlined in the attached Figure 3.1 from the Guidance Note. Freeboarddetermination cannot be isolated from the other parts of the design or project appraisal process.Therefore once a freeboard has been estimated it should be reviewed in the wider context of thescheme e.g. how the defences will perform during floods in excess of the design flood, and mayneed revising, see attached Figure 3.2.
A.3 Physical Processes
A.3.1 Defence Elements
Different parts of the Selby flood defences may require different freeboards. The followingdefence elements have been considered:
• embankment, adjacent to river• floodwalls, through Selby• embankment set back from river (north of Bank House Farm)• bends

R&D Project Record W5/042/1 44
A.3.2 Wave Over topping Allowance
The allowance is to avoid failure of the defence owing to wind generated waves during the designflood.
FloodwallsNo allowance for floodwalls is necessary.
Embankment adjacent to r iverThe Guidance Note gives a rapid method for estimating a wave overtopping allowance forrivers less than 50 m wide. However the River Ouse at Selby has a typical effective fetch ofabout 55 m. The method presented in ICE Floods and Reservoir Safety was therefore used toestimate a wave overtopping allowance. An allowance of 0.175 m was estimated for anembankment with grassed crest and backslope.
Embankment set back from r iverWaves can be generated between the low bund next to the river and the main embankment.Using F&RS an allowance of 0.65m was estimated. NB Waves may be limited by the lowwater depth in the floodplain between the main embankment and the bund.
A.3.3 Settlement Allowance
The allowance is to ensure that the defence provides the design defence level throughout itsdesign life.
FloodwallsNo allowance for floodwalls is necessary.
EmbankmentsGround conditions were judged from the draft Interpretive Report on GroundInvestigation, Volume 2, July 1999 and consolidation test results. The foundation materialfor the embankment raising was assumed to be alluvial silt with mv values of 0.05 to 0.2m2/MN. Given that embankment raising is relatively small (about 0.75m), setttlements areestimated to be of the order of 0 to 0.05m. Settlement of existing embankments isassumed to be negligible. No allowance for settlement is considered necessary though it isrecommended that the construction contract is worded to ensure that the contractoraccepts that settlement during construction is his risk, and that the embankments are to thedesign level at the end of the Defects Correction Period.
A.3.4 Superelevation
Superelevation at the two main bends in the Ouse was checked but found to be insignificantduring the design flood event.
A.3.5 Other effects
No other physical effects were considered to affect the design defence level.

R&D Project Record W5/042/1 45
A.4 Uncer tainty
A.4.1 Quick method
A quick method for estimating uncertainty is presented in the Guidance Note. It is a qualitativemethod that uses a scoring and weighting system:
Six ‘uncertainty parameters’ are considered and given a score from 1 to 5 where 1 represents lowuncertainty and 5 represents high uncertainty. The parameters are not directly applicable to tidalconditions but judgement has been used to apply the scoring system to Selby FAS.
Parameter ScoreAccuracy of hydrological dataSelby water levels strongly influenced by tide levels derived from a good 70 yeartide level record at Goole 2
Accuracy of hydrological methodRouting of tide levels Goole to Barmby to Selby introduces some uncertainty 3
Accuracy of hydraulic dataWell defined hydraulic data. Sedimentation may affect predicted water levels to minor extent 2
Accuracy of hydraulic modelWell calibrated model. Selby water levels fairly well defined by boundaryconditions at Barmby. Fluvial-tidal interaction modelled by Bullens 1
Significance of physical effects (waves etc)Wave overtopping only main concern and then only for embankments 2
Consequences of failureUrban area at risk 4
The scores are summed and then converted to an uncertainty allowance using the formula givenbelow.
where FL = derived flood level (m)MAMWL = Mean Annual Maximum Water Level (m) as derived from the
mean annual maximum flowk = a factor, initially proposed as 0.5
MAMWL)(FL30
30)6range(in scoreOverall(m)AllowanceyUncertaint −×
−×= k

R&D Project Record W5/042/1 46
Uncertainty allowance = 0.5 x 14/30 x ( 6.56 – 5.92 ) = 0.15 m
Reality Check: seems reasonable value.
A.4.2 Detailed Method
The detailed method presented in the Guidance Note analyses the uncertainty in the derivation ofdesign water level by considering the sources and size of error in the water level prediction. Asimilar method can be applied to the Selby FAS.
There are three main elements to the derivation of water levels at Selby each introducesuncertainty or error in the water level prediction:
• derivation of the tidal relationship at Goole• correlation of water levels at Goole to water levels at Barmby (downstream boundary of
model)• routing between Barmby and Selby
The tide level vs return period relationship at Goole is based on 70 years of record with astandard deviation at the 200 year return period of 0.053 m (Humber Tidal Defences DataCollection and Analysis Final Report May ’91, Posford Duvivier).
Tide levels at Goole are correlated to tide levels at Barmby by comparing observed tide levels(Table 9.6, Lower Ouse Hydraulic Study Ouse/Wharfe Hydrological Report, September 1998,Bullen Consultants). The data has a standard deviation of 0.085m.
Water levels are derived at Selby using the Ouse/Wharfe hydraulic model. Correlation betweenpredicted and observed water levels at Selby appear good, relatively low errors are predicted.Standard deviation in water level estimated to be of the order of 0.02 m.
These uncertainties in the three elements can be combined to determine the overall expecteduncertainty in water level at Selby. Combination of these uncertainties gives an estimatedstandard deviation in water level at Selby of about 0.10m. It is recommended that this be used asthe uncertainty allowance for the Selby FAS.
Reality Check: compares reasonably with Quick Method.
A.5 Conclusions
The following freeboard allowances have been estimated:

R&D Project Record W5/042/1 47
Defence TypeEmbankmen
tFlood Wall Embankment Nor th of
Bank House FarmWave AllowanceSettlement AllowanceSuperelevationOtherUncertainty Allowance
0.175nilnilnil
0.10
nilnilnilnil
0.10
0.65nilnilnil
0.10Total FreeboardAllowance
0.275 m1 0.10 m 0.75 m
1 In view of construction tolerance on earthworks, it is suggested that this is rounded up to 0.30m.
However three further aspects should be considered before setting the final defence level:
• the wave allowance for the embankment north of Bank House Farm is high and furtheranalysis would be worthwhile to check that this is suitable if this defence will be a significantpart of the Selby FAS.
• the flooding mechanism for floods in excess of the design flood must be considered. Theflood walls through the centre of town have a lower freeboard than the embankments in themore outlying areas. What can be done to reduce the risk that when flooding occurs it willstart in heavily built up areas?
• the difference in water level between the upstream end of Selby CS28 and the downstreamend CS33 may mean that it is worthwhile varying the defence level through Selbyaccordingly.

R&D Project Record W5/042/1 48

R&D Project Record W5/042/1 49
APPENDIX B: CLIPSTONE BROOK UNCERTAINTY ALLOWANCE
The text below summaries the analysis carried out to determine an uncertainty allowance forClipstone Brook. The 50 year water level has been used as an example.
B.1 Quick methodA quick method for estimating uncertainty is presented in the Guidance Note. It is a qualitativemethod that uses a scoring and weighting system:
Parameter ScoreAccuracy of hydrological dataSmall catchment, gauging station nearby 2
Accuracy of hydrological methodRelatively short record (13 years) 3
Accuracy of hydraulic dataHydraulic conditions fairly well defined, limited floodplain flow 3
Accuracy of hydraulic modelSimple steady state model, no complex flow interactions 3
Significance of physical effects (waves etc)Other effects not of great significance 2
Consequences of failureHigh grade agricultural land and some properties at risk 3
The scores are summed and then converted to an uncertainty allowance using the formula givenbelow.
where FL = derived flood level (m)MAMWL = Mean Annual Maximum Water Level (m) as derived from the
mean annual maximum flowk = a factor, initially proposed as 0.5
MAMWL = 85.98 mAODDesign flood level (50 year) = 86.94 mAOD
Uncertainty allowance = 0.5 x 16/30 x ( 85.98 – 86.94 ) = 0.26 m
MAMWL)(FL30
30)6range(in scoreOverall(m)AllowanceyUncertaint −×
−×= k

R&D Project Record W5/042/1 50
22
22
22
2AnQy S
Ay
Sny
SQy
S
∂∂
+
∂∂
+
∂∂
=
Reality Check: seems reasonable value.
B.2 First order Er ror Analysis
Step 1 Determine the Standard Deviation in the main var iablesDischarge QFrom 13 years flow record the standard deviation in flow at the 50 year return period = 4.62 m3/s.
AreaThe standard deviation in area is estimated to be of the order of 5% of the flow area at the 50 yeardischarge = 0.05 x 16.0 = 0.8 m2.
Roughness nThe mean channel roughness was determined to be 0.05. From Figure 6.4 of the Guidance Notethe standard deviation in roughness is estimated to be 0.017.
Step 2 Calculate the change in water level for a small change in the main var iableThe hydraulic model was used to determine water levels for a small change in variable:
Variable Small change invariable
Change in y (dy) Derivative
Discharge Q dQ = 1m3/s 0.025 dy/dQ = 0.025
Area A dA = 0.4 m2 0.031 dy/dA = 0.0775
Roughness n dn = 0.005 0.058 dy/dn =11.6
Step 3 Determine the standard deviation in water level
Therefore:Sy
2 = 0.0252 x 4.622 + 0.07752 x 0.82 + 11.62 x 0.0172
Standard deviation in water level Sy = 0.237 m