Fluorescence tomographic imaging using a handheld-probe-based optical imager: extensive phantom...
9
Fluorescence tomographic imaging using a handheld-probe-based optical imager: extensive phantom studies Jiajia Ge, Sarah J. Erickson, and Anuradha Godavarty* Optical Imaging Laboratory, Department of Biomedical Engineering, Florida International University, 10555 West Flagler Street EC 2675, Miami, Florida 33174, USA *Corresponding author: [email protected] Received 5 June 2009; revised 21 October 2009; accepted 23 October 2009; posted 27 October 2009 (Doc. ID 112310); published 10 November 2009 Handheld-probe-based optical imagers are a popular approach toward breast imaging because of their potential portability and maximum patient comfort. A novel handheld-probe-based optical imager has been developed and its feasibility for three-dimensional fluorescence tomographic imaging demon- strated. Extensive tomography studies were performed on large slab phantoms (650 ml) to assess the performance limits of the handheld imager. Experiments were performed by using different target volumes (0:1–0:45 cm 3 ), target depths (1–3 cm), and fluorescence (Indocyanine Green) absorption con- trast ratios in a nonfluorescing (1∶0) and constant fluorescing backgrounds (1000∶1 to 5∶1). The esti- mated sensitivity and specificity of the handheld imager are 43% and 95%, respectively. © 2009 Optical Society of America OCIS codes: 170.6960, 110.6955. 1. Introduction Fluorescence-enhanced optical imaging is an emer- ging technology toward early-stage diagnostic imag- ing of breast tissue. In recent years, handheld optical imaging devices have been an alternative attraction, since they can be developed as a portable device with the ability to image any tissue volume or curvature with maximum patient comfort [1–6]. Handheld op- tical imagers developed to date have been focused on spectroscopic applications, and not tomographic ima- ging (unless used with a second imaging modality, such as ultrasound [5]). Recently, a handheld- probe-based optical imager was developed at the Op- tical Imaging Laboratory toward three-dimensional (3D) fluorescence tomographic imaging applications. The imager uses a 5 cm × 10 cm handheld probe that has the ability to simultaneously illuminate and col- lect light signals for rapid data acquisition over lar- ger areas and with improved signal strength [7,8]. The 3D fluorescence tomography feasibility of this handheld-based optical imager has been demon- strated on tissue phantoms of large volumes (650 ml) [8]. In the current work, extensive tomography studies were carried out by using the handheld optical imager on large tissue phantoms under various ex- perimental conditions. The focus of this work is to as- sess the performance limits of the handheld imager, with a goal to translate the technology to the clinic. Fluorescence-enhanced optical tomography studies were carried out under various experimental condi- tions of target depth (up to 3:0 cm), target volume (as small as 0:1 cm 3 ), and target to background (T∶B) absorption contrast ratio (as small as 5∶1), using frequency-domain measurements. A preliminary evaluation of the diagnostic sensitivity and specifi- city of the system is reported. 2. Materials and Methods A. Instrumentation The handheld-based optical imager (Fig. 1) consists primarily of a handheld probe that is connected to the laser diode (80 mW, Sanyo DL7140-201S, 0003-6935/09/336408-09$15.00/0 © 2009 Optical Society of America 6408 APPLIED OPTICS / Vol. 48, No. 33 / 20 November 2009
Transcript of Fluorescence tomographic imaging using a handheld-probe-based optical imager: extensive phantom...
Fluorescence tomographic imaging usinga handheld-probe-based optical imager:
extensive phantom studies
Jiajia Ge, Sarah J. Erickson, and Anuradha Godavarty*Optical Imaging Laboratory, Department of Biomedical Engineering, Florida International University,
10555 West Flagler Street EC 2675, Miami, Florida 33174, USA
*Corresponding author: [email protected]
Received 5 June 2009; revised 21 October 2009; accepted 23 October 2009;posted 27 October 2009 (Doc. ID 112310); published 10 November 2009
Handheld-probe-based optical imagers are a popular approach toward breast imaging because of theirpotential portability and maximum patient comfort. A novel handheld-probe-based optical imager hasbeen developed and its feasibility for three-dimensional fluorescence tomographic imaging demon-strated. Extensive tomography studies were performed on large slab phantoms (650ml) to assess theperformance limits of the handheld imager. Experiments were performed by using different targetvolumes (0:1–0:45 cm3), target depths (1–3 cm), and fluorescence (Indocyanine Green) absorption con-trast ratios in a nonfluorescing (1∶0) and constant fluorescing backgrounds (1000∶1 to 5∶1). The esti-mated sensitivity and specificity of the handheld imager are 43% and 95%, respectively. © 2009Optical Society of America
OCIS codes: 170.6960, 110.6955.
1. Introduction
Fluorescence-enhanced optical imaging is an emer-ging technology toward early-stage diagnostic imag-ing of breast tissue. In recent years, handheld opticalimaging devices have been an alternative attraction,since they can be developed as a portable device withthe ability to image any tissue volume or curvaturewith maximum patient comfort [1–6]. Handheld op-tical imagers developed to date have been focused onspectroscopic applications, and not tomographic ima-ging (unless used with a second imaging modality,such as ultrasound [5]). Recently, a handheld-probe-based optical imager was developed at the Op-tical Imaging Laboratory toward three-dimensional(3D) fluorescence tomographic imaging applications.The imager uses a 5 cm × 10 cm handheld probe thathas the ability to simultaneously illuminate and col-lect light signals for rapid data acquisition over lar-ger areas and with improved signal strength [7,8].The 3D fluorescence tomography feasibility of this
handheld-based optical imager has been demon-strated on tissue phantoms of large volumes(650ml) [8].
In the current work, extensive tomography studieswere carried out by using the handheld opticalimager on large tissue phantoms under various ex-perimental conditions. The focus of this work is to as-sess the performance limits of the handheld imager,with a goal to translate the technology to the clinic.Fluorescence-enhanced optical tomography studieswere carried out under various experimental condi-tions of target depth (up to 3:0 cm), target volume (assmall as 0:1 cm3), and target to background (T∶B)absorption contrast ratio (as small as 5∶1), usingfrequency-domain measurements. A preliminaryevaluation of the diagnostic sensitivity and specifi-city of the system is reported.
2. Materials and Methods
A. Instrumentation
The handheld-based optical imager (Fig. 1) consistsprimarily of a handheld probe that is connected tothe laser diode (80mW, Sanyo DL7140-201S,
0003-6935/09/336408-09$15.00/0© 2009 Optical Society of America
6408 APPLIED OPTICS / Vol. 48, No. 33 / 20 November 2009

Thorlabs Inc., Newton, New Jersey) and image inten-sified (FS9910, ITT Night Vision, Virginia) CCDcamera (PI-SCX 7495-0002, Roper Scientific, Tren-ton, New Jersey) along with appropriate power sup-plies and electronic components to operate in boththe continuous-wave (CW) and frequency-domainmodes of imaging [8]. Initially, modulated light at100MHz is launched onto the tissue phantom atmultiple (six) point locations simultaneously via thehandheld probe. The generated modulated signal (at-tenuated input signal and/or fluorescence signal) iscollected simultaneously from 165 point locationsspaced over a 5 cm × 10 cm handheld probe area. Thiscollected signal is in turn simultaneously detected byusing the custom-built gain-modulated intensifiedCCD camera. Modulation at the source and detectorend is generated by using individual oscillators,which are phase locked. By changing the phase delay(from 0 to 2π) between these oscillators, phase sensi-tive steady-state images are acquired and processed(via fast Fourier transforms) in order to obtainfrequency-domain measurements (in terms of ampli-tude and phase shift). More details of the instru-mentation and data acquisition procedure can befound elsewhere [8]. Appropriate optical filters areused to separate the attenuated input near-infrared
light from the fluorescence signal (at a higherwavelength).
B. Phantom Studies
Extensive phantom studies were performed by usinglarge slab geometries to assess the current per-formance limits of the handheld imager. The perfor-mance was assessed in terms of the limits in targetsize, target depth, and target-to-background (T∶B)optical contrast ratio recovery from the tomographicimages. In study I, experiments were performed inwhich a target was present in a homogeneous (i.e.,uniform absorption–scatteringmedium) tissue phan-tom, with T∶B > 1∶1. In study II, experiments wereperformed in which a target was either absent or pre-sent with T∶B ¼ 1∶1 in a homogeneous phantom.
1. Study I: Experiments with T∶B > 1∶1
Experimental studies were performed on a 10 cm ×10 cm × 10 cm cubical phantom that was filled with1% Liposyn (Liposyn II, 20%, Henry Schein, Melville,New Jersey) up to 6:5 cm height (i.e., a phantomvolume of 650ml). A hollow clear plastic sphere filledwith 1 μM Indocyanine Green (ICG) in 1% Liposynsolution was used to mimic a single target (or tumor).Sodium polyaspartate (molecular weight 3000–8000)was used as a stabilizing agent for ICG [9]. Theoptical properties of the background and fluorescenttarget are given in Table 1 (similar to previousstudies [8]).
In study I-A, all experimental cases haveT∶B ¼ 1∶0, wherein ICG was present only in thetarget and not the background (i.e., perfect-uptakescenario). Experiments were carried out by usingdifferent target volumes (0:45 cm3, 0:23 cm3 and0:1 cm3) and depths (1–3 cm) as described in Table 2(cases 1–6). Cases with large target volumes placedcloser to the surface were not included in the currentstudy (presented elsewhere [8]).
In study I-B, all experimental cases have T∶B ¼x∶1 (here, x ¼ 1000–5), where ICG was present inboth the target and the background at different con-centrations (i.e., imperfect-uptake scenario). Experi-ments were carried out by using a 0:45 cm3 targetlocated up to 2:5 cm deep and at various fluorescenceabsorption contrast ratios (x∶1 of 1000∶1 to 5∶1), asdescribed in Table 2 (cases 7–28). In these studies,
Fig. 1. (Color online) (a) Laboratory setup for the hand-held-probe-based optical imager, with illustration of the fre-quency-domain based imaging, (b) Handheld probe, with theillumination–collection fiber layout.
Table 1. Optical Properties of Fluorescent Target and Background for All Phantom Studiesa
Optical Properties
μax (cm−1) μam (cm−1)
μsx (cm−1) μsm (cm−1) Φ τ (ns)μaxf μaxi μamf μami
Target 0.3 0.04 0.506 0.046 10.87 9.82 0.01088 0.56Background (T∶B ¼ 1∶0) 0.00 0.04 0.00 0.046 9.42 6.95Background (T∶B ≥ 1∶1) 0:3=ðT∶BÞ 0.04 0:506=ðT∶BÞ 0.046 9.42 6.95aμaxf , μamf , absorption coefficient due to the fluorophores at excitation and emission wavelengths, respectively; μaxi, μami, absorption
coefficient due to the chromophores at excitation and emission wavelengths, respectively; μsx, μsm, reduced scattering coefficient dueto the chromophores at excitation and emission wavelengths, respectively; φ and τ, quantum efficiency and lifetime for ICG, respectively.
20 November 2009 / Vol. 48, No. 33 / APPLIED OPTICS 6409
the ICG concentration in the target was maintainedat 1 μM, and the ICG concentration in the back-ground was altered in order to obtain the T∶B con-trast ratio of interest.
2. Study II: Experiments with T∶B ¼ 1∶1 or withNo Target
Experimental studies in study II were also per-formed by using a 650ml tissue phantom filled with1% Liposyn solution (similar to study I). The optical
properties of the fluorescing background and target(if any) were similar to background properties of theimperfect-uptake cases as described in Table 1. Instudy II-A, all experimental cases had no targetembedded, and instead the ICG concentration wasvaried from 0:001 μM to 0:2 μM in background as de-scribed in Table 3 (cases 29–36). In study II-B, all ex-perimental cases have T∶B ¼ 1∶1, wherein ICG waspresent in equal concentrations (0:01 μM) in targetand background. Experiments were carried out byusing a single 0:45 cm3 target located at various
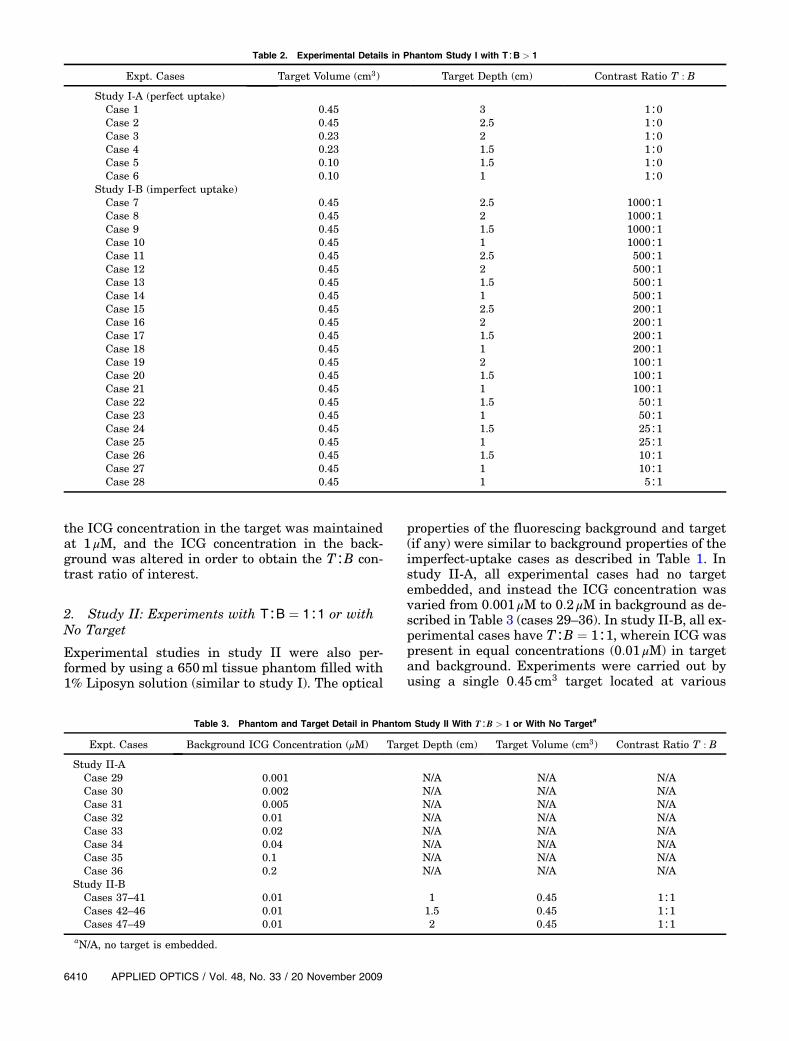
Table 2. Experimental Details in Phantom Study I with T∶B > 1
Expt. Cases Target Volume (cm3) Target Depth (cm) Contrast Ratio T : B
Study I-A (perfect uptake)Case 1 0.45 3 1∶0Case 2 0.45 2.5 1∶0Case 3 0.23 2 1∶0Case 4 0.23 1.5 1∶0Case 5 0.10 1.5 1∶0Case 6 0.10 1 1∶0
Study I-B (imperfect uptake)Case 7 0.45 2.5 1000∶1Case 8 0.45 2 1000∶1Case 9 0.45 1.5 1000∶1Case 10 0.45 1 1000∶1Case 11 0.45 2.5 500∶1Case 12 0.45 2 500∶1Case 13 0.45 1.5 500∶1Case 14 0.45 1 500∶1Case 15 0.45 2.5 200∶1Case 16 0.45 2 200∶1Case 17 0.45 1.5 200∶1Case 18 0.45 1 200∶1Case 19 0.45 2 100∶1Case 20 0.45 1.5 100∶1Case 21 0.45 1 100∶1Case 22 0.45 1.5 50∶1Case 23 0.45 1 50∶1Case 24 0.45 1.5 25∶1Case 25 0.45 1 25∶1Case 26 0.45 1.5 10∶1Case 27 0.45 1 10∶1Case 28 0.45 1 5∶1
Table 3. Phantom and Target Detail in Phantom Study II With T∶B > 1 or With No Targeta
Expt. Cases Background ICG Concentration (μM) Target Depth (cm) Target Volume (cm3) Contrast Ratio T : B
Study II-ACase 29 0.001 N/A N/A N/ACase 30 0.002 N/A N/A N/ACase 31 0.005 N/A N/A N/ACase 32 0.01 N/A N/A N/ACase 33 0.02 N/A N/A N/ACase 34 0.04 N/A N/A N/ACase 35 0.1 N/A N/A N/ACase 36 0.2 N/A N/A N/A
Study II-BCases 37–41 0.01 1 0.45 1∶1Cases 42–46 0.01 1.5 0.45 1∶1Cases 47–49 0.01 2 0.45 1∶1
aN/A, no target is embedded.
6410 APPLIED OPTICS / Vol. 48, No. 33 / 20 November 2009
depths (1–2 cm) as described in Table 3 (cases37–49). Experimental cases 37–41 all have the sametarget depth (z ¼ 1 cm) but different target locationsalong the x–y axis. Similarly, experimental cases42—46 and 47–49 have 1.5 and 2 cm deep targets, re-spectively, under varying target x–y locations.
C. Image Reconstructions
3D fluorescence-enhanced optical tomography wascarried out by using a computational efficient versionof an algorithm based on the approximate extend-ed Kalman filter[8,10]. Initially, a finite-element-based Galerkin approach was implemented by usingthe adjoint formulation [11] toward the forward mod-el simulations. A 10 cm × 6:5 cm × 10 cm phantomwas generated and discretized into tetrahedral ele-ments by using Gambit 2.1.6 software (Fluent Inc.,Lebanon, New Hampshire). The simulated phantomconsisted of 10,835 nodes and 53,467 volume ele-ments. The actual source strengths from six sourceswere measured by using an optical powermeter (PM100, Thorlabs Inc., Newton, New Jersey) and wereaccounted for in the forward model.3D image reconstructions were performed by using
a computationally efficient version of the approxi-mate extended Kalman filter algorithm to obtain the3D optical property map of the fluorescence absorp-tion coefficient at excitation wavelength (μaxf ). TheKalman filter is a linear state Bayesian estimatorused in process control for estimating a state recur-sively, based on its previous observations. The advan-tages of this Bayesian estimator include (i) the use ofmeasurement error (error between measurement re-petitions) and model error (due to the mathematicalsimplifications of the diffusion equation) to weightthe updates in each iteration and regularize the ma-trix inversion and (ii) the estimation of parameter er-ror values (or the confidence in the parameter value),apart from the estimation of the parameter value it-self, and using these parameter error values to dampand regularize the inversions. The approximate ex-tended Kalman filter algorithm recursively mini-mizes the variance of parameter error (i.e., error inμaxf for this study), given the estimates of measure-ment, system, and parameter error covariances [8].In all the experimental cases, the parameter errorcovariance is defined as the error in the spatially dis-tributed (unknown) parameter values (μaxf ), which isused to damp into the inversion for better conver-gence. The initial parameter error covariance wasset to an empirical value of 0.001 for all cases. Themeasurement error was estimated from the var-iances of the repeated measurements obtained ateach detector point; the system error was estimatedas ¥ of the measurement error. The reconstructionswere assumed to have converged when the root meansquare output error was less than 1% or when thetotal number of iterations exceeded 50.For perfect-uptake experimental cases (study I-A),
the initial guess for the reconstruction parameter(μaxf ) was arbitrarily set to a small value of
0:003 cm−1. Additionally, subtracted measurements[8] were used toward image reconstructions for studyI-A. Subtracted measurements were obtained by ac-counting for the nonfluorescing background’s excita-tion leakage during data postprocessing (prior toimage reconstructions). For imperfect-uptake experi-mental cases (study I-B) and other cases with ICG inthe background (studies II-A and II-B), μaxf was set toits true value of ICG concentration presented in thephantom background. Additionally, the raw fluores-cence measurements were used during reconstruc-tions without subtracting the background signal,since the strong fluorescing background dominatesthe nonfluorescing excitation leakage from the samebackground. Additionally, the use of subtracted mea-surements for imperfect-uptake cases is unrealisticin a clinical environment.
Contour slice plots of the reconstructed parameter(μaxf ) at various depths in the tissue phantom arepresented in 3D by using TecPlot 360 (Tecplot Inc.,Bellevue, Washington). These plots provide a quali-tative estimation of the reconstructed target’s sizeand location. For quantitative estimation of the re-constructed target’s details, a cutoff value in μaxfwas selected based on the first break point of histo-gram plot of μaxf . The reconstructed target was com-pared with that of the true target, in terms of (i)target transverse (x–y axis) recovery and depth re-covery based on the estimated centroid location ofthe reconstructed target, (ii) target volume, and(iii) T∶B contrast ratio. Herein, the recovered T∶Bcontrast ratio is determined as the ratio betweenvolume weighted and averaged μaxf value of all theelements whose μaxf is above the cutoff value andthat of the rest of the elements.
The recovered T∶B contrast ratio was also used to-ward differentiating positive and negative cases inoptical tomography. If this T∶B contrast ratio wasgreater than a predetermined threshold [see Eq. (1)],the reconstruction was considered a positive test (i.e.,targets were recovered or differentiable from thebackground) and vice versa for a negative test. Thechoice of this threshold value is described in more de-tail in Subsection 3.A and is given by
AverageðμaxfnodestargetÞAverageðμaxfnodesbackgroundÞ
> Threshold: ð1Þ
The image reconstruction results from all the ex-perimental studies (studies I and II) were categor-ized as positive or negative, and the performanceof the imaging system was evaluated by using sensi-tivity and specificity analyses.
D. Sensitivity and Specificity Studies
The diagnostic sensitivity of an imaging modality isdefined as the probability of obtaining a positive testresult among patients with the disease (here a targetpresent with T∶B > 1∶1), and the diagnostic specifi-city is the probability of obtaining a negative test re-sult among patients without the disease (here a
20 November 2009 / Vol. 48, No. 33 / APPLIED OPTICS 6411

target present with T∶B ¼ 1∶1 or no target). Thesensitivity and specificity can be calculated basedon Eqs. (2) and (3), respectively:
Sensitivity ¼ TPTPþ FN
; ð2Þ
Specificity ¼ TNTNþ FP
; ð3Þ
where definitions of TP, FP, FN, and TN are truepositive, false positive, false negative, and true nega-tive, respectively (see Fig. 2).
3. Results and Discussion
A. Study I: Experiments with T∶B > 1∶1
The phantom studies performed in study I employedboth perfect-uptake (study I-A) and imperfect-uptake(study I-B) experimental cases. 3D image reconstruc-tions were performed for 26 out of 28 experimentalcases. Two cases were excluded as described in thenext paragraph. The recovered T∶B contrast ratiosfrom the 26 reconstruction cases are plotted (on alogarithmic scale) against the difference in distance(distance off) between the true and the reconstructedtarget centroid location (see Fig. 3). The 26 experi-mental cases were distinctly differentiated into 2groups in terms of the recovered T∶B contrast ratioand distance off. Fourteen experimental cases re-covered a very low T∶B contrast ratio ranging from1.1 to 1.7, and the remaining 12 experimental casesrecovered a T∶B contrast ratio >20. Hence, thechoice of the threshold value [see Eq. (1)] was distinctfrom these plots and could be chosen anywhere be-tween 2 and 20 in an attempt to different the positiveand negative tests from the reconstruction results. Inthis study, a threshold value of 2 was chosen, to avoidmisinterpreting too many targets as artifacts bychoosing a higher threshold value of 20. The tomo-graphy results from the 14 experimental cases (cases
5, 7, 8, 11, 12, 15, 16, 19, 20, 22, 24, 26, 27, and 28)with recovered T∶B contrast ratio <2 were consid-ered negative, and the remaining 12 experimentalcases were considered positive. Additionally, it wasobserved that when the recovered T∶B contrast ratiowas less than 2, the distance off between the trueand the reconstructed target’s centroid was larger(>0:5 cm) than that observed at higher T∶B contrastratios. This further indicates that all negative testspossibly recovered artifacts and not the actual tar-gets. The recovered target volume was also calcu-lated and compared with true target volume for allcases in study I. However, no obvious correlation wasobserved between recovered volume error and re-covered contrast ratio, which in turn determineswhether the reconstruction result is positive ornegative. Hence the parameter of recovered targetvolume is not included here, to limit discussion toparameters that are crucial to sensitivity and speci-ficity study.
For all perfect-uptake experimental cases (1–6,study I-A), a subtraction-based postprocessingtechnique was employed for eliminating excitationleakage. By subtracting the background noise (i.e.,measurements obtained from homogeneous non-fluorescing phantoms) from fluorescence opticalmeasurements obtained from a given experimentalcase, the excitation leakage was minimized to themaximum extent possible. However, the ampli-tude measurements after subtraction in cases 1(0:45 cm3 target volume, 3 cm depth, T∶B ¼ 1∶0) and3 (0:23 cm3 target volume, 2 cm depth, T∶B ¼ 1∶0)were less than 0. This indicated that the acquiredraw measurements for these experimental caseswere at noise level, and no valuable signal was de-tected from the target. Hence image reconstructionswere not performed for these experimental cases(1 and 3), and they were automatically considered ne-gative (after reconstructions). From perfect-uptake-based experimental cases (study I-A), the depth ofthe reconstructed target using our imaging system is
Fig. 2. Diagnostic sensitivity and specificity in the context of thecurrent optical tomography studies. T∶B, target to backgroundcontrast ratio; s, threshold value [shown in Eq. (1)] for differentiat-ing positive and negative tomographic results.
Fig. 3. (Color online) Recovered T∶B contrast and recovered dis-tance off for all experimental cases (1–28) in phantom study I witha tumor-mimicking target. Experimental cases 1 and 3 were notincluded.
6412 APPLIED OPTICS / Vol. 48, No. 33 / 20 November 2009
1 cm for a 0:1 cm3 target, 1:5 cm for a 0:23 cm3 target,and 2:5 cm for a 0:45 cm3 target. These results implythat the tomographic reconstructions are limited inrecovering positive targets when the target becomessmaller and/or deeper. This can be attributed to theexponentially attenuating fluorescence signal from asmaller or deeper target, which may approach thenoise floor of the imaging system and hence cannotbe differentiated with respect to the background.For all imperfect-uptake experimental cases (7–28,
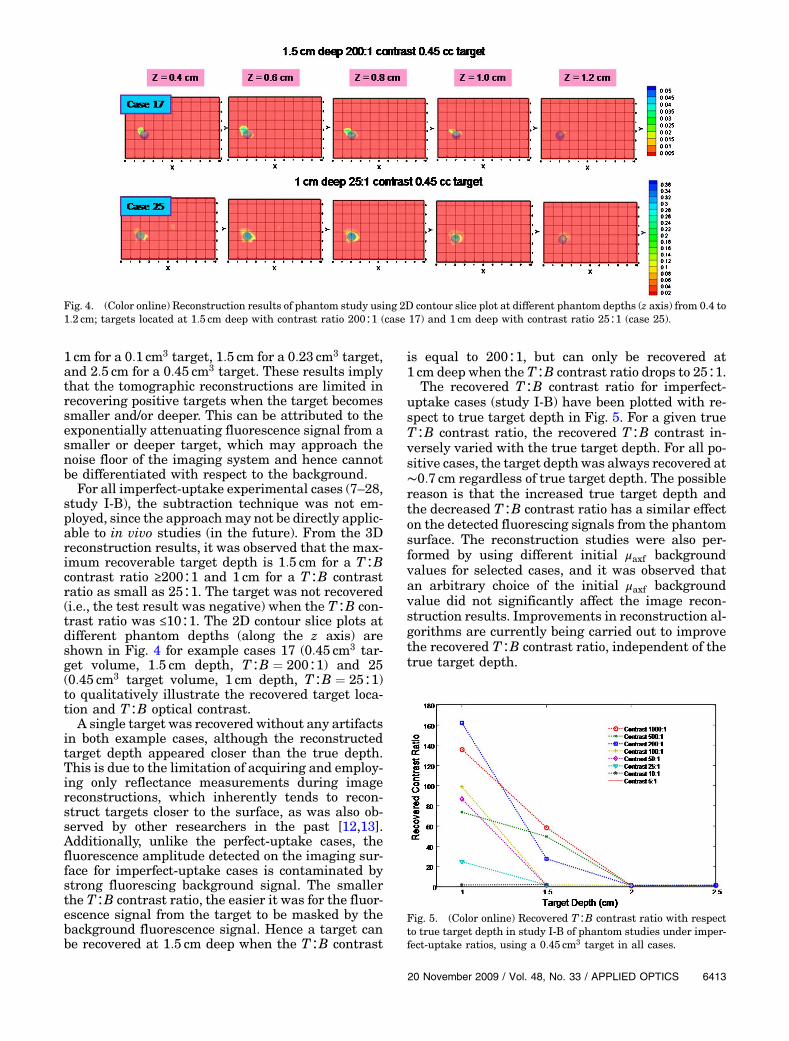
study I-B), the subtraction technique was not em-ployed, since the approachmay not be directly applic-able to in vivo studies (in the future). From the 3Dreconstruction results, it was observed that the max-imum recoverable target depth is 1:5 cm for a T∶Bcontrast ratio ≥200∶1 and 1 cm for a T∶B contrastratio as small as 25∶1. The target was not recovered(i.e., the test result was negative) when the T∶B con-trast ratio was ≤10∶1. The 2D contour slice plots atdifferent phantom depths (along the z axis) areshown in Fig. 4 for example cases 17 (0:45 cm3 tar-get volume, 1:5 cm depth, T∶B ¼ 200∶1) and 25(0:45 cm3 target volume, 1 cm depth, T∶B ¼ 25∶1)to qualitatively illustrate the recovered target loca-tion and T∶B optical contrast.A single target was recovered without any artifacts
in both example cases, although the reconstructedtarget depth appeared closer than the true depth.This is due to the limitation of acquiring and employ-ing only reflectance measurements during imagereconstructions, which inherently tends to recon-struct targets closer to the surface, as was also ob-served by other researchers in the past [12,13].Additionally, unlike the perfect-uptake cases, thefluorescence amplitude detected on the imaging sur-face for imperfect-uptake cases is contaminated bystrong fluorescing background signal. The smallerthe T∶B contrast ratio, the easier it was for the fluor-escence signal from the target to be masked by thebackground fluorescence signal. Hence a target canbe recovered at 1:5 cm deep when the T∶B contrast
is equal to 200∶1, but can only be recovered at1 cm deep when the T∶B contrast ratio drops to 25∶1.
The recovered T∶B contrast ratio for imperfect-uptake cases (study I-B) have been plotted with re-spect to true target depth in Fig. 5. For a given trueT∶B contrast ratio, the recovered T∶B contrast in-versely varied with the true target depth. For all po-sitive cases, the target depth was always recovered at∼0:7 cm regardless of true target depth. The possiblereason is that the increased true target depth andthe decreased T∶B contrast ratio has a similar effecton the detected fluorescing signals from the phantomsurface. The reconstruction studies were also per-formed by using different initial μaxf backgroundvalues for selected cases, and it was observed thatan arbitrary choice of the initial μaxf backgroundvalue did not significantly affect the image recon-struction results. Improvements in reconstruction al-gorithms are currently being carried out to improvethe recovered T∶B contrast ratio, independent of thetrue target depth.
Fig. 4. (Color online) Reconstruction results of phantom study using 2D contour slice plot at different phantom depths (z axis) from 0.4 to1:2 cm; targets located at 1:5 cm deep with contrast ratio 200∶1 (case 17) and 1 cm deep with contrast ratio 25∶1 (case 25).
Fig. 5. (Color online) Recovered T∶B contrast ratio with respectto true target depth in study I-B of phantom studies under imper-fect-uptake ratios, using a 0:45 cm3 target in all cases.
20 November 2009 / Vol. 48, No. 33 / APPLIED OPTICS 6413
Currently, alternate approaches using the hand-held optical imager (in terms of implementing noisefiltering tools during data postprocessing, and probehead design to acquire transillumination measure-ments as well) are attempted in our Optical ImagingLaboratory in order to improve the target depth re-covery at smaller T∶B contrast ratios when smallertargets are used (i.e., to extend the performance cap-abilities of the system). In addition, research is beingcarried out by various other research groups to devel-op more tumor-specific contrast agents to increasethe T∶B contrast ratio toward improved early-stageor deep target detection.
B. Study II: Experiments with T∶B ¼ 1∶1 or with NoTarget
In study II-A, experiments with no target present(cases 29–36) were performed in order to study theeffect of fluorescence background signal on target re-covery. The fluorescence background signal acquiredfrom the phantom surface is unevenly distributed(due to nonuniform simultaneous source strengths)and tends to have much stronger signal closer to thesource points. Hence, image reconstruction studieswere performed to study the ability of the imag-ing system to differentiate background fluorescence(noise) signal with no target as a negative test result.Study II-B experiments with a T∶B contrast ratio of1∶1 (cases 37–49) were performed to study the effectof normal tissue structure on target recovery (byusing a structurally different target in a homoge-neous background with similar ICG concentrationsthroughout). The image reconstructions were per-formed to study the ability of the imaging systemto differentiate fluorescing heterogeneity from struc-tural heterogeneity.From image reconstructions, it was observed that
20 out of 21 experimental cases in study II (-A and-B) recovered a T∶B contrast ratio less than 2 (thethreshold value). This demonstrates the robustnessof the imaging system in avoiding false positive casesby not recovering structural heterogeneity or fluores-cence background noise in most of the cases.
C. Sensitivity and Specificity Analyses
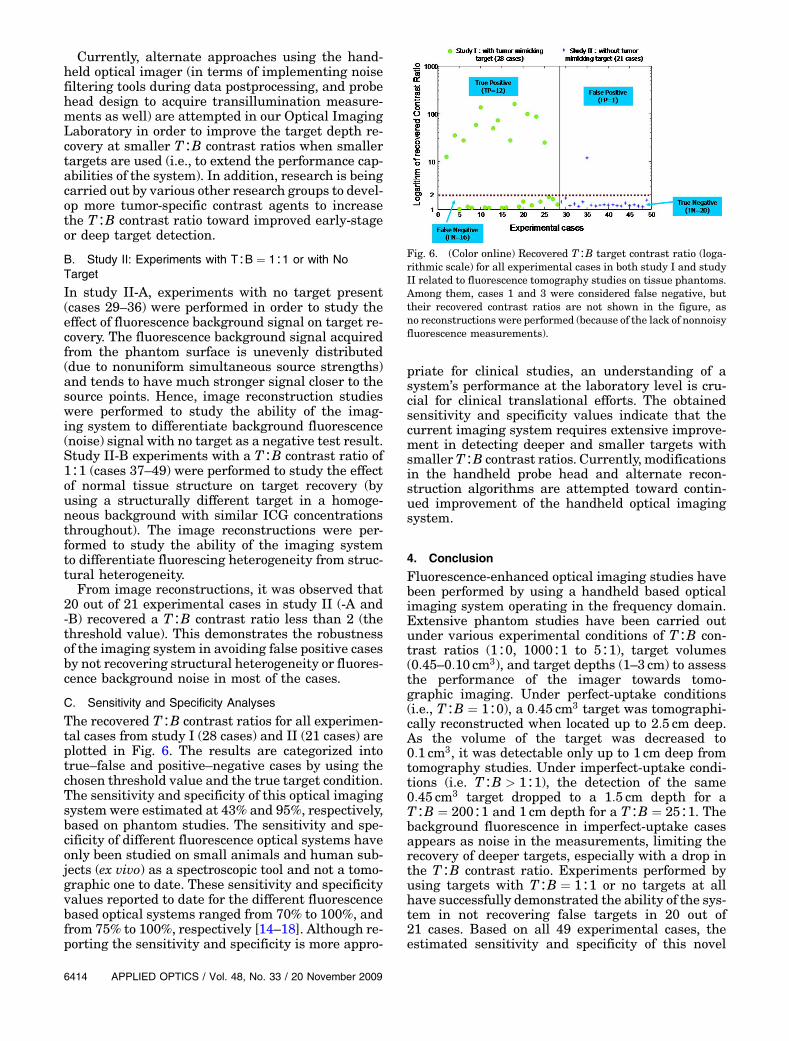
The recovered T∶B contrast ratios for all experimen-tal cases from study I (28 cases) and II (21 cases) areplotted in Fig. 6. The results are categorized intotrue–false and positive–negative cases by using thechosen threshold value and the true target condition.The sensitivity and specificity of this optical imagingsystem were estimated at 43% and 95%, respectively,based on phantom studies. The sensitivity and spe-cificity of different fluorescence optical systems haveonly been studied on small animals and human sub-jects (ex vivo) as a spectroscopic tool and not a tomo-graphic one to date. These sensitivity and specificityvalues reported to date for the different fluorescencebased optical systems ranged from 70% to 100%, andfrom 75% to 100%, respectively [14–18]. Although re-porting the sensitivity and specificity is more appro-
priate for clinical studies, an understanding of asystem’s performance at the laboratory level is cru-cial for clinical translational efforts. The obtainedsensitivity and specificity values indicate that thecurrent imaging system requires extensive improve-ment in detecting deeper and smaller targets withsmallerT∶B contrast ratios. Currently, modificationsin the handheld probe head and alternate recon-struction algorithms are attempted toward contin-ued improvement of the handheld optical imagingsystem.
4. Conclusion
Fluorescence-enhanced optical imaging studies havebeen performed by using a handheld based opticalimaging system operating in the frequency domain.Extensive phantom studies have been carried outunder various experimental conditions of T∶B con-trast ratios (1∶0, 1000∶1 to 5∶1), target volumes(0:45–0:10 cm3), and target depths (1–3 cm) to assessthe performance of the imager towards tomo-graphic imaging. Under perfect-uptake conditions(i.e., T∶B ¼ 1∶0), a 0:45 cm3 target was tomographi-cally reconstructed when located up to 2:5 cm deep.As the volume of the target was decreased to0:1 cm3, it was detectable only up to 1 cm deep fromtomography studies. Under imperfect-uptake condi-tions (i.e. T∶B > 1∶1), the detection of the same0:45 cm3 target dropped to a 1:5 cm depth for aT∶B ¼ 200∶1 and 1 cm depth for a T∶B ¼ 25∶1. Thebackground fluorescence in imperfect-uptake casesappears as noise in the measurements, limiting therecovery of deeper targets, especially with a drop inthe T∶B contrast ratio. Experiments performed byusing targets with T∶B ¼ 1∶1 or no targets at allhave successfully demonstrated the ability of the sys-tem in not recovering false targets in 20 out of21 cases. Based on all 49 experimental cases, theestimated sensitivity and specificity of this novel
Fig. 6. (Color online) Recovered T∶B target contrast ratio (loga-rithmic scale) for all experimental cases in both study I and studyII related to fluorescence tomography studies on tissue phantoms.Among them, cases 1 and 3 were considered false negative, buttheir recovered contrast ratios are not shown in the figure, asno reconstructions were performed (because of the lack of nonnoisyfluorescence measurements).
6414 APPLIED OPTICS / Vol. 48, No. 33 / 20 November 2009

handheld probe based optical imager is around 43%and 95%, respectively.In all the experimental cases with T∶B > 1∶1, the
tomographic reconstructions recovered the targetcloser to the imaging surface than the true targetdepth because of the limitation of acquiring only re-flectance measurements from the handheld probe.Hence, the handheld optical imager represents botha 2D detection probe with greater accuracy and animaging system with lesser accuracy in the depthreconstructions. The measurements in the futurecan improve the accuracy in reconstructing the tar-get depth, apart from its 2D location. Currently, asecond-generation handheld-optical-probe-based im-ager is being developed in the Optical ImagingLaboratory, with unique abilities to acquire both re-flectance as well as transillumination measurements(as in x-ray mammography), such that the device isadaptable for detection as well as imaging.In addition to the development of the second
generation probe, modifications in the data acquisi-tion techniques are being implemented in order toacquire both excitation and fluorescence (emission)signals during experimental studies. These measure-ments when used together via appropriate referen-cing techniques (e.g., emission–excitation signals ateach detection point) may improve the tomographiccapabilities of the imager. Additionally, the use ofhomogeneous phantoms (with uniform fluorescenceconcentration) as calibration units can help ac-count for the background fluorescence signal fromimperfect-uptake studies as well. However, develop-ment of a single standard calibration phantom ischallenging and may be challenging (yet possible)for future in vivo studies.The first in vivo fluorescence tomography (feasibil-
ity) study on human subjects was reported byCorlu et al. [19], using a soft-compression, parallel-plane transmission geometry and a frequency-domain technique based on sequential illuminationand area collection. Besides this in vivo study, fluor-escence tomographic studies are limited to phantomsand small animals. The current extensive work onphantoms is a precursor to our future in vivo effortstoward translating fluorescence optical tomography,using a portable device, to the clinic. In addition, theongoing research efforts are the (i) performance of invitro tomographic imaging by using chicken-breast-based phantom models in an attempt to mimic het-erogeneity in the background and (ii) development ofappropriate coregistration tools in an attempt to ac-quire positional and optical information in real-timetoward a coregistered image for in vivo tomographicanalysis using the handheld device [20].In summary, extensive tissue phantom studies
were performed to assess the robustness of thishandheld-probe-based intensified CCD imager to-ward future clinical translation. The preliminary re-ported sensitivity and specificity results obtainedfrom phantom studies are currently used as guidancefor improving the system in terms of both instrumen-
tation and data analysis. As an initial assessmentstudy of this handheld optical imager, feasibility of3D target localization toward early diagnosis is theimmediate future direction. In the future, the accu-racy of the recovered target volume and optical prop-erties will be addressed on further development ofsystem instrumentation and data acquisition andreconstruction algorithms. The ultimate goal of thisresearch is to translate the handheld optical imagerfor 3D diffuse and fluorescence tomographic imagingin a clinical environment, toward breast imaging atvarious stages of the disease.
The authors thank the National Institutes ofHealth (R15-CA119253) and the Department ofDefense (BC083282) for their funding support.
References
1. N. Chen, M. Huang, H. Xia, and D. Piao, “Portable near-infrared diffusive light imager for breast cancer detection,”J. Biomed. Opt. 9, 504–510 (2004).
2. B. Chance, S. Nioka, J. Zhang, E. F. Conant, E. Hwang,S. Briest, S. G. Orel, M. D. Schnall, and B. J. Czerniecki,“Breast cancer detection based on incremental biochemicaland physiological properties of breast cancers: a six-year,two-site study,” Acad. Radiol. 12, 925–933 (2005).
3. B. J. Tromberg, “Optical scanning and breast cancer,” Acad.Radiol. 12, 923–924 (2005).
4. K. S. No and P. H. Chou, “Mini-FDPM and heterodyne mini-FDPM: handheld non-invasive breast cancer detectors basedon frequency domain photonmigration,” IEEE Trans. CircuitsSyst. 52, 2672–2685 (2005).
5. Q. Zhu, S. H. Kurtzma, P. Hegde, S. Tannenbaum, M. Kane,M. Huang, N. G. Chen, B. Jagjivan, and K. Zarfos, “Utilizingoptical tomography with ultrasound localization to image het-erogeneous hemoglobin distribution in large breast cancers,”Neoplasia 7, 263–270 (2005).
6. J. R. X. Xu, B. Qiang, J. J. Mao, and S. P. Povoski, “Develop-ment of a handheld near infrared imager for dynamic charac-terization of in vivo biological tissue systems.,” Appl. Opt. 46,7442–7451 (2007).
7. B. Jayachandran, J. Ge, S. Regalado, and A. Godavarty, “De-sign and development of a hand-held optical probe towardsfluorescence diagnostic imaging,” J. Biomed. Opt. 12,054014 (2007).
8. J. Ge, B. Zhu, S. Regalado, and A. Godavarty, “Three-dimensional fluorescence-enhanced optical tomography usinga hand-held probe based imaging system,” Med. Phys. 35,3354–3363 (2008).
9. R. Rajagopalan, P. Uetrecht, J. E. Bugaj, S. A. Achilefu, andR. B. Dorshow, “Stabilization of the optical tracer agent Indo-cyanine Green using noncovalent interactions,” Photochem.Photobiol. 71, 347–350 (2000).
10. M. J. Eppstein, D. E. Dougherty, D. J. Hawrysz andE. M. Sevick-Muraca, “Three dimensional Bayesian opticalimage reconstruction with domain decomposition,” IEEETrans. Med. Imaging 20, 147–163 (2001).
11. F. Fedele, J. P. Laible, and M. J. Eppstein, “Coupled complexadjoint sensitivities for frequency-domain fluorescence tomog-raphy: theory and vectorized implementation,” J. Comput.Phys. 187, 597–619 (2003).
12. A. Joshi, W. Bangerth, K. Hwang, J. C. Rasmussen, andE. M. Sevick-Muraca, “Plane-wave fluorescence tomographywith adaptive finite elements,” Opt. Lett. 31, 193–195 (2006).
20 November 2009 / Vol. 48, No. 33 / APPLIED OPTICS 6415

13. D. S. Kepshire, S. C. Davis, H. Dehghani, K. D. Paulsen, andB. W. Pogue, “Challenges in sub-surface fluorescence diffuseoptical imaging,” Proc. SPIE 6434, 64340V (2007).
14. T. M. Breslin, F. Xu, G. M. Palmer, C. Zhu, K. W. Gilchrist, andN. Ramanujam, “Autofluorescence and diffuse reflectanceproperties of malignant and benign breast tissues,” Ann. Surg.Oncol. 11, 65–70 (2004).
15. N. G. Deane, H. C. Manning, A. C. Foutch, M. K. Washington,B. A. Aronow, D. J. Bornhop, and R. J. Coffey, “Targetedimaging of colonic tumors in Smad3−=−Smad3 mice discrimi-nates cancer and inflammation,” Mol. Cancer Res. 5, 341–349(2007).
16. R. Hage, P. R. Galhanone, R. A. Zangaro, K. C. Rodrigues,M. T. T. Pacheco, A. A. Martin, M. M. Netto, F. A. Soares,and I. W. Da Cunha, “Using the laser-induced fluorescencespectroscopy in the differentiation between normal and neo-plastic human breast tissue,” Lasers Med. Sci. 18, 171–176(2003).
17. Z. Volynskaya, A. S. Haka, K. L. Bechtel, M. Fitzmaurice,R. Shenk, N. Wang, J. Nazemi, R. R. Dasari, and M. S. Feld,“Diagnosing breast cancer using diffuse reflectance spectro-scopy and intrinsic fluorescence spectroscopy,” J. Biomed.Opt. 13, 024012 (2008).
18. C. F. Zhu, G. M. Palmer, T. M. Breslin, J. Harter, andN. Ramanujam, “Diagnosis of breast cancer using fluores-cence and diffuse reflectance spectroscopy: a Monte-Carlo-model-based approach,” J. Biomed. Opt. 13, 034015(2008).
19. A. Corlu, R. Choe, T. Durduran, M. A. Rosen, M. Schweiger,S. R. Arridge, M. D. Schnall, and A. G. Yodh, “Three-dimensional in vivo fluorescence diffuse optical tomographyof breast cancer in humans,” Opt. Express 15, 6696–6716(2007).
20. S. Regalado, S. J. Erickson, B. Zhu, J. Ge, and A. Godavarty,“Automated coregistered imaging using a hand-held probe-based optical imager,” Rev. Sci. Instrum. (to be published).
6416 APPLIED OPTICS / Vol. 48, No. 33 / 20 November 2009