Fluorescence method using on-line sodium cholate coacervate surfactant mediated extraction for the...
33
Author's Accepted Manuscript Fluorescence method using on-line sodium cholate coacervate surfactant mediated ex- traction for the flow injections analysis of Rhodamine B Gimena Acosta, María C. Talio, Marta O. Luconi, Willie L. Hinze, Liliana P. Fernández PII: S0039-9140(14)00470-6 DOI: http://dx.doi.org/10.1016/j.talanta.2014.06.014 Reference: TAL14835 To appear in: Talanta Received date: 28 February 2014 Revised date: 9 June 2014 Accepted date: 10 June 2014 Cite this article as: Gimena Acosta, María C. Talio, Marta O. Luconi, Willie L. Hinze, Liliana P. Fernández, Fluorescence method using on-line sodium cholate coacervate surfactant mediated extraction for the flow injections analysis of Rhodamine B, Talanta, http://dx.doi.org/10.1016/j.talanta.2014.06.014 This is a PDF file of an unedited manuscript that has been accepted for publication. As a service to our customers we are providing this early version of the manuscript. The manuscript will undergo copyediting, typesetting, and review of the resulting galley proof before it is published in its final citable form. Please note that during the production process errors may be discovered which could affect the content, and all legal disclaimers that apply to the journal pertain. www.elsevier.com/locate/talanta
Transcript of Fluorescence method using on-line sodium cholate coacervate surfactant mediated extraction for the...

Author's Accepted Manuscript
Fluorescence method using on-line sodiumcholate coacervate surfactant mediated ex-traction for the flow injections analysis ofRhodamine B
Gimena Acosta, María C. Talio, Marta O. Luconi,Willie L. Hinze, Liliana P. Fernández
PII: S0039-9140(14)00470-6DOI: http://dx.doi.org/10.1016/j.talanta.2014.06.014Reference: TAL14835
To appear in: Talanta
Received date: 28 February 2014Revised date: 9 June 2014Accepted date: 10 June 2014
Cite this article as: Gimena Acosta, María C. Talio, Marta O. Luconi, Willie L.Hinze, Liliana P. Fernández, Fluorescence method using on-line sodiumcholate coacervate surfactant mediated extraction for the flow injectionsanalysis of Rhodamine B, Talanta, http://dx.doi.org/10.1016/j.talanta.2014.06.014
This is a PDF file of an unedited manuscript that has been accepted forpublication. As a service to our customers we are providing this early version ofthe manuscript. The manuscript will undergo copyediting, typesetting, andreview of the resulting galley proof before it is published in its final citable form.Please note that during the production process errors may be discovered whichcould affect the content, and all legal disclaimers that apply to the journalpertain.
www.elsevier.com/locate/talanta
1
Fluorescence method using on-line sodium cholate coacervate surfactant mediated
extraction for the flow injections analysis of Rhodamine B
Gimena Acostab, María C. Talio
b, Marta O. Luconi
a, Willie L. Hinzec, Liliana P.
Fernández∗a,b
a Área de Química Analítica, Facultad de Química, Bioquímica y Farmacia,
Universidad Nacional de San Luis, San Luis, Argentina
b Instituto de Química de San Luis (INQUISAL-CONICET),
Chacabuco y Pedernera, 5700 San Luis, Argentina.
c Department of Chemistry, Wake Forest University
Winston-Salem, North Carolina 2710, United States of America.
“In memoriam” of Dr. Adriana Masi, a prominent researcher,
dear colleague and friend,
who passed away prematurely,
as a consequence of public insecurity,
killed by a shot to the head at the door of her home
∗ Correponding author: Dra. Liliana Fernández E-mail adress: [email protected] Phone: 54-0266-4425385
2
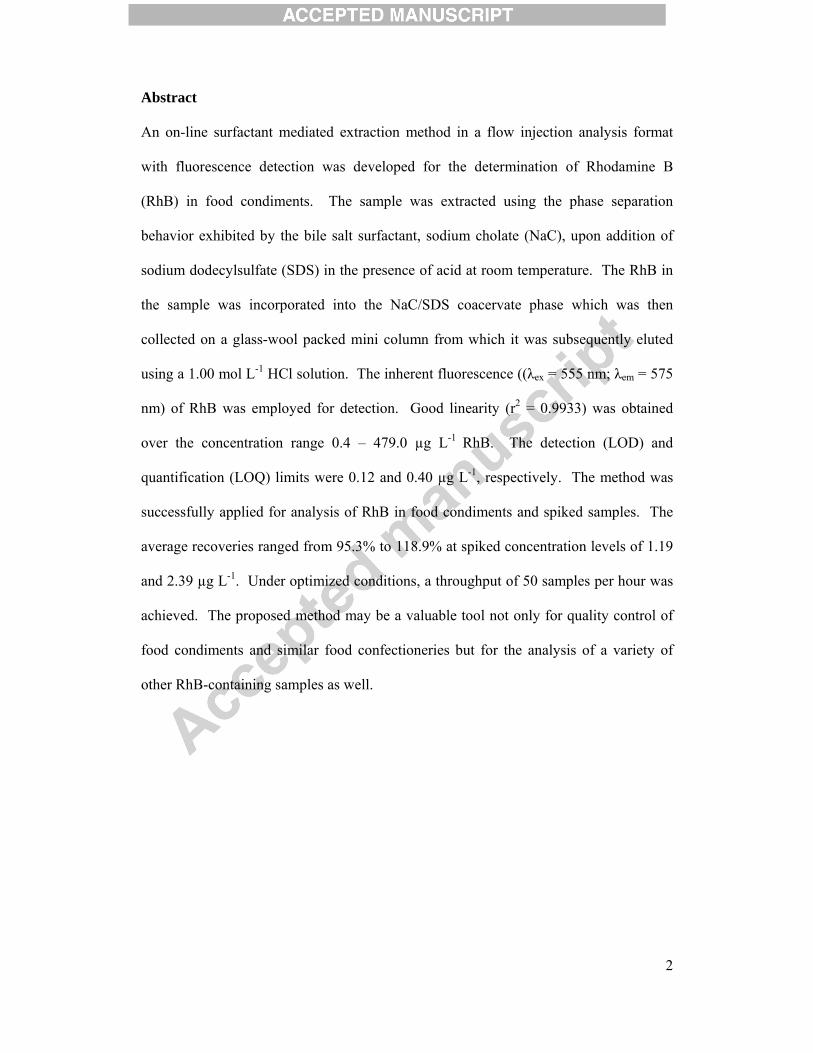
Abstract
An on-line surfactant mediated extraction method in a flow injection analysis format
with fluorescence detection was developed for the determination of Rhodamine B
(RhB) in food condiments. The sample was extracted using the phase separation
behavior exhibited by the bile salt surfactant, sodium cholate (NaC), upon addition of
sodium dodecylsulfate (SDS) in the presence of acid at room temperature. The RhB in
the sample was incorporated into the NaC/SDS coacervate phase which was then
collected on a glass-wool packed mini column from which it was subsequently eluted
using a 1.00 mol L-1 HCl solution. The inherent fluorescence ((λex = 555 nm; λem = 575
nm) of RhB was employed for detection. Good linearity (r2 = 0.9933) was obtained
over the concentration range 0.4 – 479.0 µg L-1 RhB. The detection (LOD) and
quantification (LOQ) limits were 0.12 and 0.40 µg L-1, respectively. The method was
successfully applied for analysis of RhB in food condiments and spiked samples. The
average recoveries ranged from 95.3% to 118.9% at spiked concentration levels of 1.19
and 2.39 µg L-1. Under optimized conditions, a throughput of 50 samples per hour was
achieved. The proposed method may be a valuable tool not only for quality control of
food condiments and similar food confectioneries but for the analysis of a variety of
other RhB-containing samples as well.
3
Keywords: Flow injection analysis; Sodium cholate; Surfactant mediated extraction; Spectrofluorimetry; Rhodamine B; Food condiments.

4
1. Introduction
Synthetic xanthene dyes, such as Rhodamine 6G, Rhodamine B ([9-(2-
carboxyphenyl)-6-diethylamino-3-xanthenylidene]-diethylammonium chloride), etc.
have been widely employed in textile applications as coloring dyes for fabrics and other
materials as well as trace markers for a variety of agricultural agents (i.e., herbicides,
pesticides) among others. They have also been employed as color adulterants in food
products and beverages. Since rhodamines are considered to be neurotoxic,
carcinogenic and mutagenic agents [1], there is a continuing need for new analytical
methodology for their detection at trace levels. In most instances, a preconcentration or
enrichment step is required prior to spectroscopic determination of rhodamine dyes in
order to achieve the necessary sensitivity.
Rhodamine B (RhB) can exist in many different forms in aqueous solution that
can be characterized by their absorption and fluorescent spectra [2,3]. The apparent pKa
for conversion of the zwitterion form to the protonated form, RhB+, is reported to be
3.22 in water and 4.15 and 4.75 in the presence of nonionic surfactant Triton X-100 and
anionic SDS micellar solutions, respectively [3]. Protonated rhodamines are expected to
bind to anionic surfactant micelles due to favorable electrostatic as well as hydrophobic
interactions. A binding constant of 34.6 L mol-1 has been reported for the binding of
Rhodamine 123 to sodium cholate (NaC) surfactant micelles [4]. Likewise, stronger
binding of the cationic form of RhB to anionic sodium dodecylsulfate (SDS) micelles
has been observed relative to that seen with nonionic surfactant (Triton or Brij) micelles
[3]. In general, the cationic form of RhB better binds micelles compared to its
zwitterionic form [3,5]. This is why interaction and binding of RhB with anionic NaC
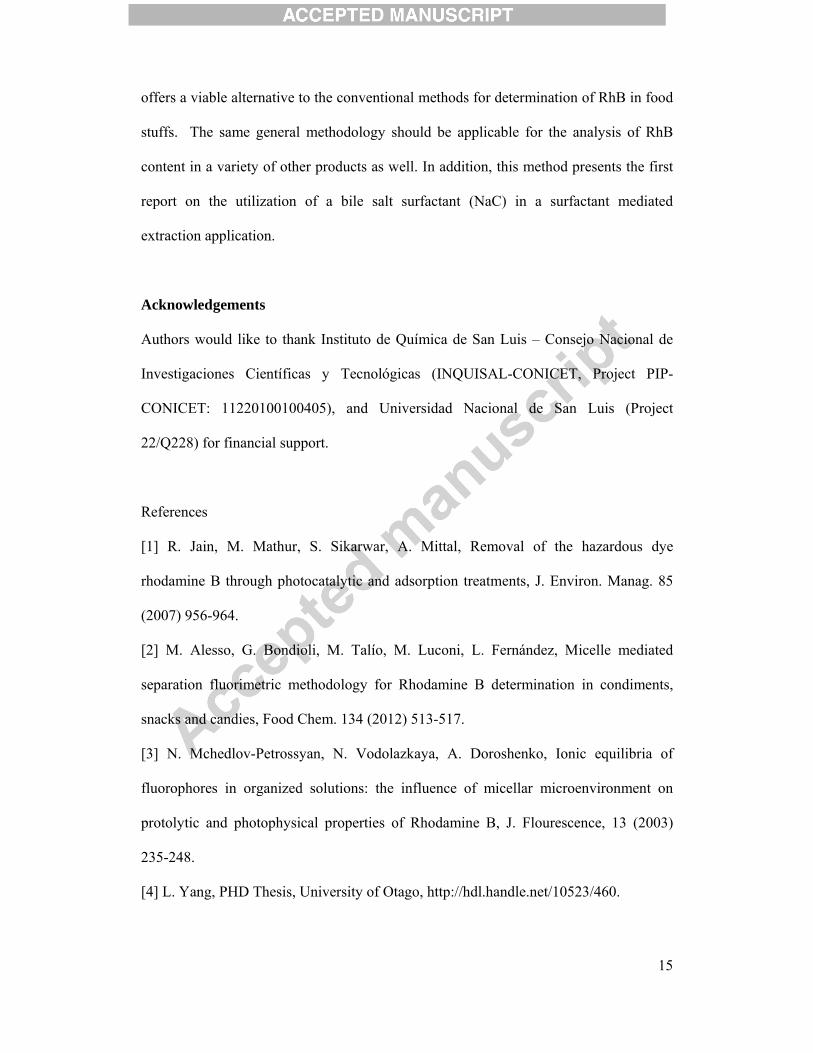
micellar aggregates at low pH values is expected (Fig. 1). When bound to micelle
5
aggregates, the fluorescence of RhB is intensified relative to that observed in aqueous
solutions in their absence [2,3,6].
Surfactant mediated extractions (SME), also known as cloud point (CPE),
coacervate, aqueous two phase surfactant or supramolecular extractions, among others,
have become a popular approach to enrich and/or recover metal ions as well as organic
and biological compounds from aqueous (or solid) matrices [7-11]. SME can be
employed for samples with complex matrices due to the possibilities of manipulating
and chemically modifying the matrix during the phase separation preconcentration step
[12]. Previously, some batch SME methods had been employed for the preconcentration
of different rhodamine dyes, including RhB, prior to spectroscopic detection [2,13-15].
Most SME are performed in the batch mode [7-12,16,17], although there have
been some reports of their utilization in flow injection analysis (FIA) formats [18-24].
Batch mode SME typically involves several steps which can result in poor precision and
lower enrichment factors [25,26]; in addition to the approach being time consuming and
difficult to automate. In contrast, on-line FI-SME offers advantages in terms of greater
sensitivity and precision as well as of a significant reduction of the amounts of the
sample and reagents required and wastes generated [18, 21, 26]. SME was first
incorporated within a flow injection format by Huie, et. al., who utilized a cotton mini-
column to collect the analyte-containing surfactant coacervate phase followed by elution
of the analyte with an appropriate solvent [18]. Others have since reported similar
designs with FI-SME configurations using non-ionic surfactants, such as Triton X-100,
PONPE-7.5 and Triton X-114 [19-24]. In some of these applications, high temperature
(30 - 70oC) was required to induce phase separation [21,22, 27]. However, elevated
temperature, in addition to being experimentally complicated due to the necessity of a
heating device, may affect the stability of thermally labile analytes [15].

6
Bile salts (BS) are biosurfactants that are synthesized from cholesterol in the liver.
The BS molecule is concave with one side being hydrophobic (studded with methyl
groups) while the other is hydrophilic (with hydroxyl and the carboxylate moieties)
[28]. In common with traditional surfactant micelles, BS micelles, such as sodium
cholate, have unique properties that can be exploited in chemical analysis and
separation science applications: such as the ability to solubilize solutes selectively, alter
the rate and equilibria of chemical processes, modify the effective microenvironment
(polarity, viscosity, surface tension) of bound solutes, etc. [29]. However, in contrast
to traditional surfactants (e.g. Triton X-110, Triton X-114, SDS), bile salt micellar
solutions are much easier to work with since they foam and scatter light to a much
lesser extent, which is beneficial in spectroscopic measurements [30]. The BS
aggregation behavior is also different from that observed for conventional surfactants.
Namely, they exhibit a sequential aggregation pattern and their micelle aggregation
number is typically much less than that of conventional surfactant micelles. Moreover,
their critical micelle concentration (CMC) is affected to a lesser extent by changes in
experimental conditions (such as pH, ionic strength, temperature) relative to that of
traditional surfactants [30]. These features of BS simplify experimental procedures and
offer greater flexibility in optimization of analytical protocols relative to that possible
with conventional surfactant media [31].
BS surfactants reportedly serve as coacervate promoters when added to aqueous
solution of nonionic surfactants [32,33]. In addition, aqueous solutions of BS, such as
NaC, can form coacervate phases in the presence of additives such as quaternary
ammonium surfactants, alcohols or acids [34-36].
This manuscript reports on the design and optimization of a FIA manifold coupled
to a fluorescence detector for the on-line extraction and fluorimetric determination of
7
Rhodamine B using a glass wool mini-column to collect the bile salt coacervate phase.
The proposed method was successfully applied for determination of Rhodamine B in
commercially available Argentinian food condiment samples.
2. Experimental section
2.1 Materials
The required materials, Rhodamine B dye (Fluka AG, Chemische Fabrik, Buchs
SG, Switzerland), sodium dodecylsulfate (Tokyo Kasei Industries, Chuo-Ku, Tokyo,
Japan), sodium cholate (Sigma Chemical Co., St. Louis, MO, United States) and
absolute ethanol, HCl and acetonitrile (Merck, Darmstadt, Germany), were acquired as
indicated and used as received without further purification. All other reagents employed
in this study were of analytical grade quality.
2.2 Instrumentation and apparatus
A Shimadzu RF-5301PC spectrofluorimeter (Shimadzu Corporation, Analytical
Instrument Division, Kyoto, Japan), equipped with a Xenon discharge lamp was used
for the fluorescent measurements. A 1.0 cm quartz cell was employed for the batch
assays and a 12 µL LC flow cell unit (Shimadzu Corporation, Analytical Instrument
Division, Kyoto, Japan) for the flow measurements. The RhB fluorescence
measurements were carried out operating the spectrofluorimeter in the time-course
mode (transient signals; λex = 555 nm; λem = 575 nm, slits: 5/3 nm).
The FIA manifold (Fig. 2) consisted of a Rheodyne (Rohnert Park, CA) model-
5020 six-port two-way rotary valve. The reagent and sample solutions were pumped
8
through the FIA system with two Gilson (Villiers, France) Minipuls 3 peristaltic pumps
connected to 1.3 mm i.d. Tygon tubing (Middleton, WI, USA).
A Model EA 940 pH-meter (Orion Expandable Ion Analyzer, Orion Research,
Cambridge, MA, USA) equipped with a glass combination electrode was employed for
all pH measurements.
2.3 Reagents and stock solutions
1.0 x10⁻⁶
mol L-1
RhB stock solutions were prepared weekly by dissolution of
suitable amounts of dye in ultrapure water. Likewise, 0.020 mol L-1 sstandard solutions
of NaC and SDS were prepared by dissolution of the required mass of the solid
surfactant in ultrapure water. A 1.0 mol L−1 HCl solution was prepared by step-wise
dilution of concentrated HCl with ultrapure water.
2.4 Samples and sample preparation
Samples of different Argentinian manufactured food condiments (i.e., paprika,
chimi-churri, rice and pizza spices) were acquired in local shops. About 2.0 g of each
condiment were dissolved in ultrapure water and homogenized for 5 minutes using a
magnetic shaker after which they were filtered using filter paper (black ribbon). The
samples were then transferred to a 100.0 mL volumetric flask and diluted to 100.0 mL
with ultrapure water.
2.5 On-line extraction and fluorescence monitoring protocol
To perform the on-line surfactant mediated extraction, 1.00 mL NaC (0.020 mol
L-1), 1.00 mL SDS (0.020 mol L-1), 1.00 mL of analytical sample and 300 µL HCl (1.0
mol L-1) were added into a 10.0 mL volumetric flask, and diluted to final volume with

9
ultrapure water. The resulting RhB solution was immediately introduced into the FIA
system for on-line extraction and subsequent spectrofluorimetric analysis. Long term
storage of acidic SDS solutions should be avoided in order to prevent acid hydrolysis of
SDS which results in formation of dodecanol [37].
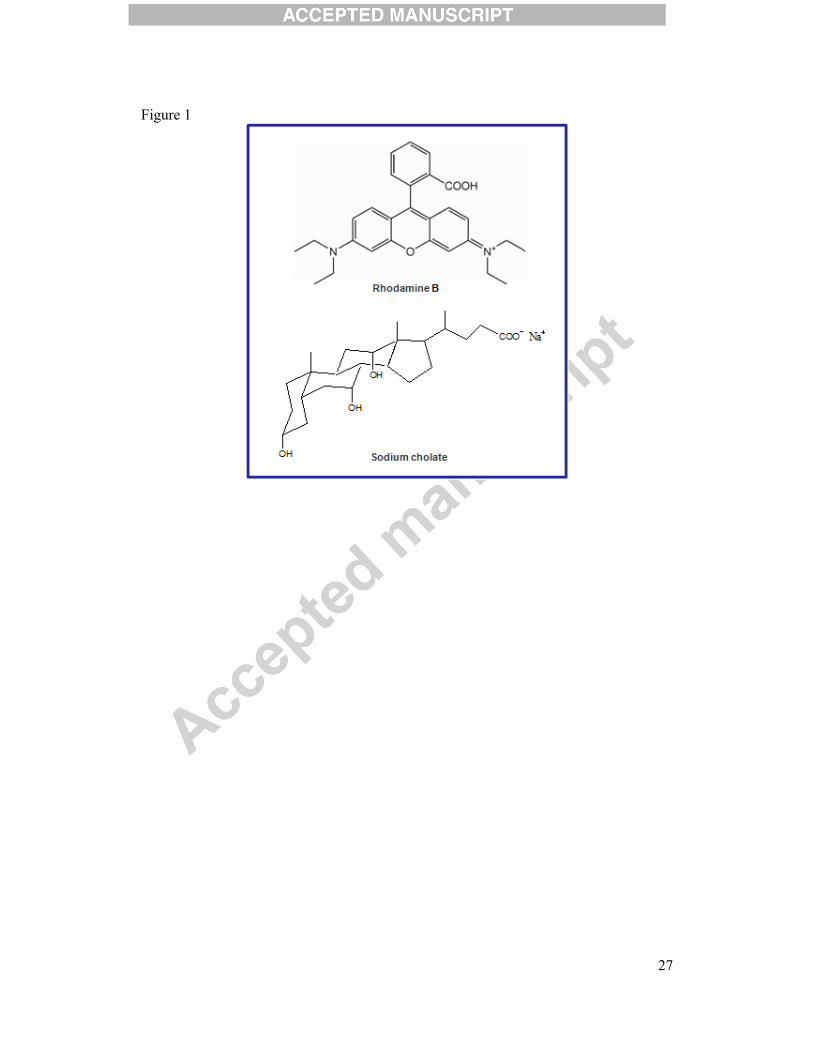
The specific FIA protocol was as follows: A glass wool mini-column, mC,
(comprised of a 1.5 mm i.d. by 3.0 cm long glass tube filled with 25 mg of glass wool),
was loaded with the RhB standard (or sample) solution prepared as just noted, (Line S)
with valve V in load position (Fig. 2-a), allowing for the retention of the surfactant-rich
coacervate phase containing the analyte, while the filtrate was sent to waste.
Simultaneously, the mobile phase (1.0 mol L-1 HCl solution) flowed through the eluent
line (Line E) to the detector to record the baseline fluorescence. During this step, 1.0
mL of the RhB standard/sample was loaded at a flow rate of 2.0 mL min-1 into the mC
(Fig. 2-a). After this loading step, valve V was switched to the injection position (Fig.
2-b), so that the mobile phase flowed through the mC (2.0 mL min-1) and the retained
coacervate phase was eluted (in the opposite direction from which it was initially loaded
in order to minimize analyte dispersion effects) to the flow cell of the fluorescence
detector (Fig. 2-b). Afterwards, valve V was switched to load position and the sequence
started again for the next sample.
3. Results and discussion
The method presented in this work is based on the on-line preconcentration/
separation of RhB via surfactant mediated extraction using NaC as the coacervate agent
at room temperature. NaC is an anionic surfactant and its CMC value in water has been
reported to be in the 5.0 – 9.0 mM range [29,38].

10
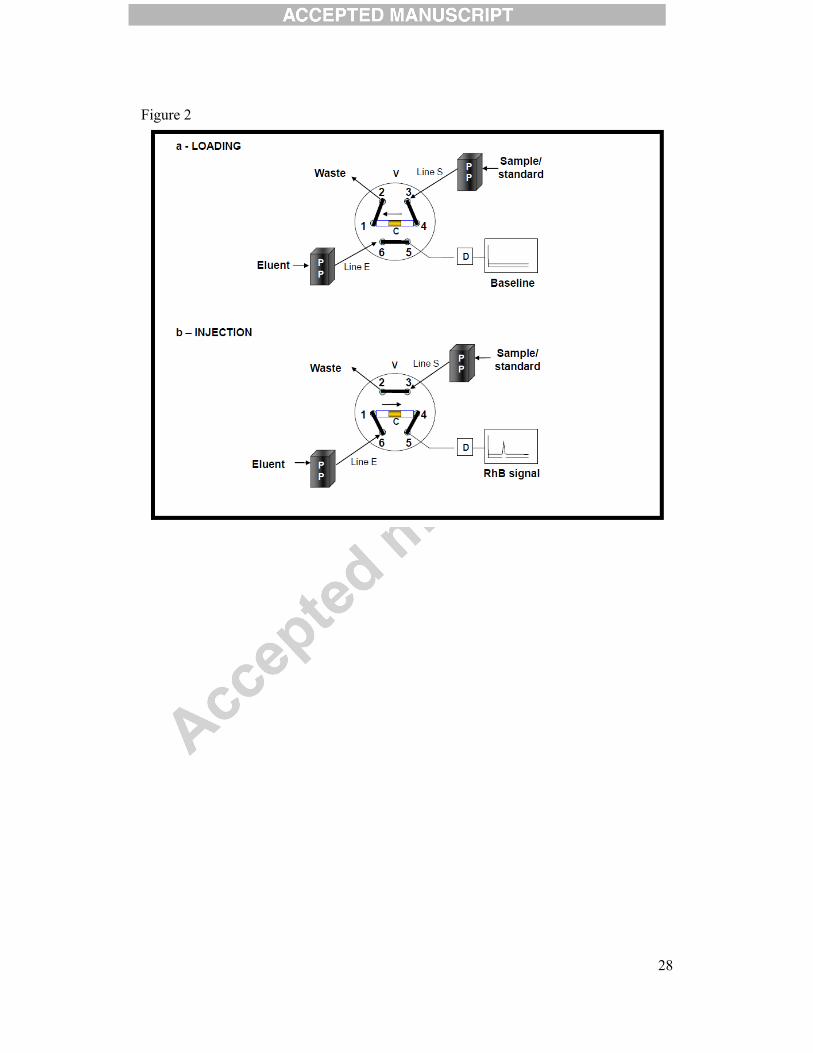
The fluorescence emission spectrum of RhB in aqueous solution alone and in
anionic surfactant NaC and SDS solutions was determined (Fig. 3). The fluorescence
signal was greater in NaC compared to water and still greater in the mixed NaC/SDS
surfactant system. This probably reflects the altered microenvironment experienced by
RhB (relative to that in water alone) upon its binding to the NaC surfactant or mixed
NaC/SDS surfactant aggregate system. NaC and SDS are known to form mixed
micellar aggregates with the CMC value for 1:1 NaC-SDS systems reported as 8.0 mM
[38,39]. The presence of bulky hydrophobic ions, like protonated RhB, is known to
diminish such CMC values and/or lead to formation of pre-micellar aggregates; and
such is probably the case here.
3.1. Optimization of experimental variables
Experiments were conducted in order to optimize the experimental conditions so
that the best sensitivity and reproducibility for RhB determination as well as stable and
quantitative extractant coacervate phase retention were achieved. In addition, the FIA
parameters (such as sample loading time, mobile phase composition and flow rate) were
optimized using univariate analysis.
3.1.1. Coacervate formation
The ability of different substances to induce phase separation and coacervate
formation in aqueous solutions of sodium cholate at room temperature was surveyed.
Namely, variable amounts of calcium chloride, potassium iodide, sodium chloride, and
sodium dodecylsulfate (SDS), both in the absence and presence of hydrochloric acid,
were added to aqueous solutions of NaC containing RhB (Table 1) and the solutions
assessed for signs of coacervate (or precipitant) formation as well as the degree of

11
partitioning of the RhB into the coacervate phase. Although all of the noted additives
were effective in terms of inducing NaC coacervate (or precipitate-like) formation, the
features of the NaC coacervate formed upon addition of SDS/HCl were optimal
considering the aggregate size. It should be noted that aqueous solutions of NaC/SDS
mixed micelles have been frequently employed as the run buffer in electrokinetic
chromatographic separations and that the interactive properties of these mixed micelles
is different from that of the individual NaC or SDS micelles alone [40]. Such mixed
NaC/SDS micellar surface may provide ideal binding sites for the protonated RhB
analyte.
Some batch studies were conducted in order to determine the optimal volumes
(concentrations) of SDS and HCl required for retention of the formed coacervate on the
glass wool in the mC (as gauged by its physical appearance) and for obtainment of the
maximum RhB fluorescence signal. The influence of HCl volume on the coacervate
formation of solutions containing RhB was evaluated in the range 0.0 to 0.5 mL. The
results (such as the fluorescence profiles shown in Fig. 4) indicate that the optimal
amounts were 1.0 mL of 0.020 mol L-1 SDS, 1.0 mL of 0.020 mol L-1 NaC and 0.30 mL
of 1.0 mol L-1 HCl. This corresponds to the following molar concentrations of these
reagents in the sample mixtures: 0.0020 mol L-1 SDS; 0.0020 mol L-1 NaC and 0.030
mol L-1 HCl. All subsequent experiments were conducted using these conditions.
3.1.2 Eluent composition and concentration
Different solvents, such as water, ethanol, acetonitrile, aqueous HCl solutions, and
mixtures thereof, were tested as eluents to achieve complete release of the RhB analyte
from the NaC/SDS coacervate with adequate analytical signal. Weak fluorescence
signals (peak area) were obtained when water, ethanol, acetonitrile, water:ethanol or

12
water:acetonitrile mixtures were employed as the eluent solvent system. However,
satisfactory elutions were achieved when aqueous solutions of HCl were employed as
the eluent. Consequently, HCl was selected as eluent for the subsequent experiments.
Next, the effect of HCl concentration over the range 1.0 mmol L-1 to 1.0 mol L-1 was
examined. The optimal concentration considering the quantitative elution of RhB was
found to be 1.0 mol L-1 HCl. Optimization of FIA system and flow conditions
The variables influencing the performance of the FIA method were examined one-
at-a-time in order to determine the conditions necessary for an optimal fluorescence
signal and best reproducibility. Column design, packing material and packing
conditions were experimentally evaluated (data not shown) by measuring the RhB
fluorescence signal in the waste line (filtrate) as a function of the parameter being
varied. Results led to the design of the FIA manifold shown in Fig. 2 and indicated that
a mC filled with 25 mg of glass wool was sufficient for quantitative retention of the
NaC/SDS coacervate containing the RhB and subsequent stripping of the analyte RhB
allowing for maximal signals and reproducible (and symmetric) elution peaks.
3.1.3.1. Sample loading rate
The sample flow rate through the mini-column is a compromise parameter related
to (i) the time of contact between the NaC/SDS coacervate phase and glass wool solid
support; and (ii) the total time of analysis [41]. The effect of sample flow rate on the
preconcentration efficiency was evaluated using loading flow rates between 0.5 and 2.5
mL min−1. It was found that the analytical signal decreased slightly upon increasing the
sample flow rate above 2.0 mL min−1 presumably because of incomplete coacervate
retention. Therefore, a sample flow rate of 2.0 mL min−1 was selected as optimal.

13
3.1.3.2. Eluent flow rate
The effect of eluent flow rate on the analytical response was studied at flow rates
between 1.0 and 3.0 mL min-1. In general terms, it was observed that the analytical
signal increased with the eluent flow rate. However, despite the benefit of greater speed
of analysis, flow rates greater than 3.0 mL min-1 generated large and undesirable back-
pressures. Therefore, an elution flow rate of 2.0 mL min-1 was selected as optimal
because it allowed for a reasonable analysis time and acceptable mini-column
backpressure.
Reports indicate that better sensitivity is obtained if the elution flow is in an
opposite direction to that of sample loading onto a packed column [42]. The impact of
the direction of the elution flow upon the analytical signal was examined and indeed the
best results in terms of sensitivity and peak shape (i.e., symmetry, sharpness) were
obtained when the elution was performed in a countercurrent manner (Fig. 2).
3.2. Analytical performance
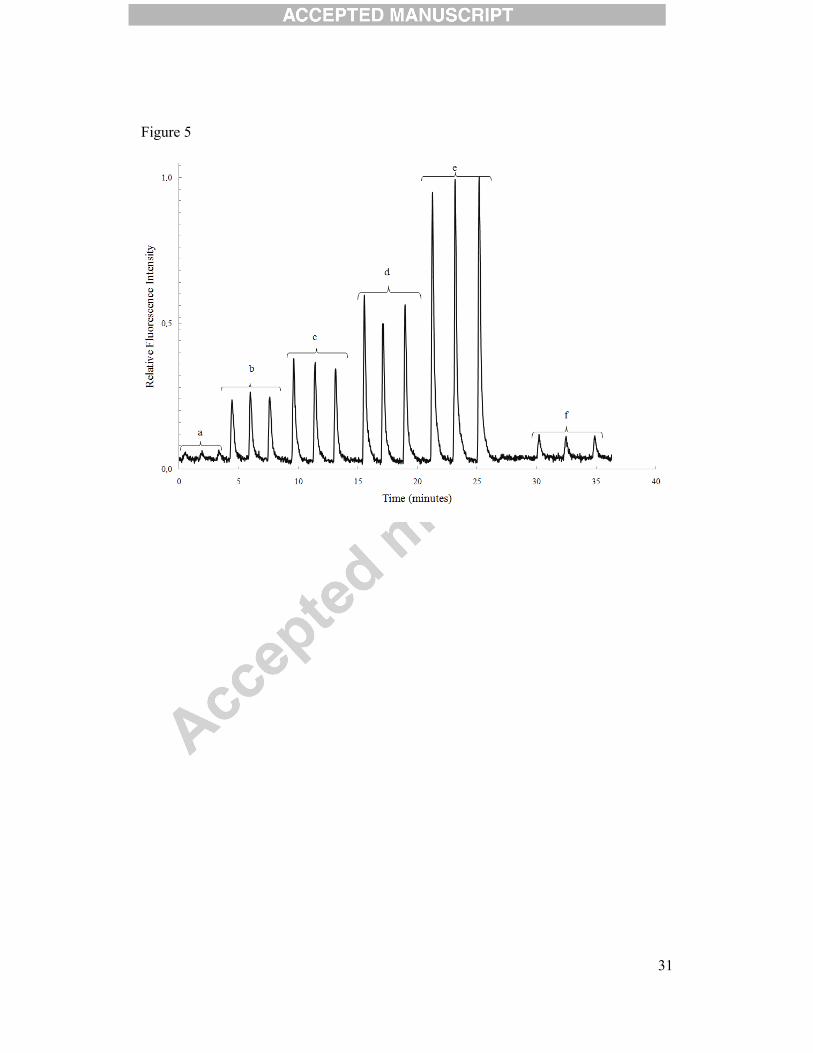
Figure 5 shows the transient responses (FIAgram) obtained for the blank,
standards and a real sample analyzed using the recommended optimized procedure. The
calibration plot of FIA fluorescence peak area vs. RhB concentration was linear over the
concentration range (limit of linearity, LOL) of 0.4 to 479.0 µg L-1 RhB (r2 = 0.9933).
The limits of detection (LOD) and quantification (LOQ) were calculated in the usual
manner [2], using the relation k(SD)/m where k=3 for LOD and 10 for LOQ and SD
represents the standard deviation from 15 replicate blank responses and m is the slope
of the calibration curve. Table 2 summarizes the analytical figures of merit for this
method for determination of RhB.

14
A comparison of the sensitivity of this method relative to reported methods in the
literature [2,14,15,43-49] is presented in Table 3. Many of the published methods
require a number of steps (such as heating, centrifugation, cooling, dilution of the
extractant phase (lower sensitivity)), or the need to specially synthesize the solid phase
extraction material [2,14,15,45-49]. In contrast, no such manipulations or steps are
required in the proposed methodology. In addition, the method is sensitive, simple,
convenient and rapid offering high sample throughput (50 samples per hour).
3.3. Applications
RhB’s use as a food colorant is illegal in many countries due to its toxicity
towards humans and animals [1,24]. In Argentina, there is no official regulation
regarding the use of RhB in food stuffs. It is very important to achieve RhB
quantification in foods owing to health risks derived from its consumption. Hence, the
developed methodology was applied to different food condiment samples in order to
determine their RhB content. The results (Table 4) indicate that all four of the
condiment samples contained RhB (in the concentration range of 0.7 – 1.49 µg L-1).
The recovery achieved from spiked samples was also satisfactory (Table 4). These
results indicate that the proposed method can be successfully employed for the
determination of RhB in different food stuffs.
4. Conclusions
An on-line surfactant mediated extraction method using NaC/SDS as the
coacervate extractant phase with fluorimetric detection for determination of trace
amounts of RhB in food condiments has been developed. The method is safe,
convenient, simple, economic and rapid as well as sensitive. The proposed methodology
15
offers a viable alternative to the conventional methods for determination of RhB in food
stuffs. The same general methodology should be applicable for the analysis of RhB
content in a variety of other products as well. In addition, this method presents the first
report on the utilization of a bile salt surfactant (NaC) in a surfactant mediated
extraction application.
Acknowledgements
Authors would like to thank Instituto de Química de San Luis – Consejo Nacional de
Investigaciones Científicas y Tecnológicas (INQUISAL-CONICET, Project PIP-
CONICET: 11220100100405), and Universidad Nacional de San Luis (Project
22/Q228) for financial support.
References
[1] R. Jain, M. Mathur, S. Sikarwar, A. Mittal, Removal of the hazardous dye
rhodamine B through photocatalytic and adsorption treatments, J. Environ. Manag. 85
(2007) 956-964.
[2] M. Alesso, G. Bondioli, M. Talío, M. Luconi, L. Fernández, Micelle mediated
separation fluorimetric methodology for Rhodamine B determination in condiments,
snacks and candies, Food Chem. 134 (2012) 513-517.
[3] N. Mchedlov-Petrossyan, N. Vodolazkaya, A. Doroshenko, Ionic equilibria of
fluorophores in organized solutions: the influence of micellar microenvironment on
protolytic and photophysical properties of Rhodamine B, J. Flourescence, 13 (2003)
235-248.
[4] L. Yang, PHD Thesis, University of Otago, http://hdl.handle.net/10523/460.

16
[5] B. Haglund, D. Wurster, L. Sundelof, S Upadrashta, Effect of SDS micelles on
rhodamine-B diffusion in hydrogels, J. Chem. Educ., 73 (1996) 889-893.
[6] Z. Konefal, Influence of detergents on the bleaching process: laser properties of
Rhodamine 6G and Rhodamine B in aqueous solutions, Z. Naturoschlung Sect. A., J.
Physical Sci., 34 (1979) 551-556.
[7] H. Watanabe, H. Tanaka, A non-ionic surfactant as a new solvent for liquid—liquid
extraction of zinc(II) with 1-(2-pyridylazo)-2-naphthol, Talanta 25 (1978) 585-589.
[8] G. Jia, L. Li, J. Qiu, X. Wang, W. Zhu, Y. Sun, Z. Zhou, Determination of carbaryl
and its metabolite 1-naphthol in water samples by fluorescence spectrophotometer after
anionic surfactant micelle-mediated extraction with sodium dodecylsulfate,
Spectrochim. Acta A 67 (2007) 460-464.
[9] Z. Sosa Ferrera, C. Padron Sanz, C. Mahugo Santana, J.J. Santana Rodríguez, The
use of micellar systems in the extraction and pre-concentration of organic pollutans in
the environmental samples, Trends Anal. Chem. 23(2004) 469-479.
[10] M. Luconi, R. Olsina, L. Fernández, M. Silva, Determination of lead in human
saliva by combined cloud point extraction- capillary zone electrophoresis with indirect
UV detection, J. Hazard. Mater. B 128 (2006) 240-246.
[11] M. Talío, M. Luconi, A. Masi, L. Fernández, Determination of cadmium at ultra-
trace levels by CPE–molecular fluorescence combined methodology, J. Hazard. Mater.
170 (2009) 272-277.
[12] M. Talío, M. Luconi, A. Masi, L. Fernández, Cadmium Monitoring in Saliva and
Urine as Indicator of Smoking Addiction, Sci. Total Environ. 408 (2010) 3125–3132.
[13] C. Duran, D. Ozdes, V. Bulut, M. Tufekci, M. Soylak, Cloud-point extraction of
rhodamine 6G by using Triton X-100 as the non-ionic surfactant, J. AOAC Intl. 94
(2011) 286-292.

17
[14] N. Pourreza, S. Rastegarzadeh, A. Larki, Micelle-mediated cloud point extraction
and spectrophotometric determination of rhodamine B using Triton X-100, Talanta 77
(2008) 733–736.
[15] K.E. Ates, K. Mittendorf, H. Senyuva, LC/MS Method using Cloud Point
Extraction for the determination of permitted and illegal food colors in liquid,
semiliquid, and solid food matrixes: single-laboratory validation, J. AOAC Intl. 94
(2011) 1853-1862.
[16] Z. Zhou, J. Chen, D. Zhao, M. Yang, Determination of four carbamate pesticides in
corn by cloud point extraction and high-performance liquid chromatography in the
visible region based on their derivatization reaction, J. Agric. Food Chem. 57 (2009)
8722–8727.
[17] V.A. Doroshchuk, N.A. Gonta, M.V. Drozdova, S.A. Kulichenko, Determination
of furosemide in urine by HPLC with preconcentration by micellar-extraction, J. Anal.
Chem. 64 (2009) 1054–1058.
[18] Q. Fang, M. Du, C.W. Huie, Online incorporation of cloud point extraction to flow
injection analysis, Anal. Chem. 73 (2001) 3502–3505.
[19] Y.J. Li, B. Hu, Z.C. Jiang, On-line cloud point extraction combined with
electrothermal vaporization inductively coupled plasma atomic emission spectrometry
for the speciation of inorganic antimony in environmental and biological samples, Anal.
Chim. Acta 576 (2006) 207-214.
[20] E.K. Paleologos, A.G. Vlessidis, M.I. Karayannis, N.P. Evmiridis, On-line sorption
preconcentration of metals based on mixed micelle cloud point extraction prior to their
determination with micellar chemiluminescence: Application to the determination of
chromium at ng l−1 levels, Anal. Chim. Acta 477 (2003) 223-231.

18
[21] M. Garrido, M.S. DiNezio, A.G. Lista, M. Palomeque, B.S. Fernández Band,
Cloud-point extraction/preconcentration on-line flow injection method for mercury
determination, Anal. Chim. Acta 502 (2004) 173-177.
[22] C. Ortega, S. Cerutti, R.A. Olsina, L.D. Martinez, M.F. Silva, Simultaneous
determination of dysprosium and iron in urine by capillary zone electrophoresis coupled
to cloud point extraction, J. Pharm. Biomed. Anal. 36 (2004) 721-727.
[23] G.Q. Song, C. Lu, K. Hayakawa, J.M. Lin, Comparison of traditional cloud-point
extraction and on-line flow-injection cloud-point extraction with a chemiluminescence
method using benzo[a]pyrene as a marker, Anal. Bioanal. Chem. 384 (2006) 1007-
1012.
[24] E. Silva, P. Roldan, Simultaneous flow injection preconcentration of lead and
cadmium using cloud point extraction and determination by atomic absorption
spectrometry, J. Hazard. Mater. 161 (2009) 142-147.
[25] Y. Yamini, M. Faraji, S. Shariati, R. Hassani, M. Ghambarian, On-line metals
preconcentration and simultaneous determination using cloud point extraction and
inductively coupled plasma optical emission spectrometry in water samples, Anal.
Chim. Acta 612 (2008) 144-151.
[26] B.S. Fernández-Band, M. Garrido, M.S. Di Nezio, A.G. Lista, M. Palomeque,
Cloud point extraction/preconcentration flow injection method for mercury
determination, Anal. Chim. Acta 502 (2004) 173-177.
[27] H. Filik, S. Demirci Çekiç, Cloud Point Extraction of Pesticide Residues, in: M.
Stoytcheva (Ed.), Pesticides in the Modern World – Trends in Pesticides Analysis,
Publisher: InTech, 2011 pp. 247-280.

19
[28] A. Navas Díaz, F. García Sánchez, A. García Pareja, Cholic acid behavior in water
and organic solvent: study of normal and inverted aggregates, Colloid Surfaces A 142
(1998) 27-34.
[29] W.L. Hinze, Bile Acid/Salts Surfactant Systems, Second Ed., Stamford,
Connecticut, 2000.
[30] L.B. McGown, S. Meyerhoffer, P. Hertz, G. Li, Luminescence measurements in
bile salt micelles. In Organized Assemblies in Chemical Analysis in: W. Hinze, Ed.,
Bile Acid/Salt Surfactant Systems, JAI Press: Stamford, CT, 2000 pp. 167-186.
[31] S. Selvam, A fluorescence parameter based analysis on the solubilization of
carvedilol by bile salt media, J. Photochem. Photobiol. B: Biology 116 (2012) 105-113.
[32] Ç. Arpa Şahin, M. Efeçmar, N. Şatiroğlu, Combination of cloud point extraction
and flame atomic absorption spectrometry for preconcentration and determination of
nickel and manganese ions in water and food samples, J. Hazard. Mater. 176 (2010)
672–677.
[33] B. de Castro, P. Gameiro, C. Guimaraes, J.L.F.C. Lima, S. Reis, Partition
coefficients of beta-blockers in bile salt/lecithin micelles as a tool to assess the role of
mixed micelles in gastrointestinal absorption, Biophys. Chem. 90 (2001) 31-43.
[34] M. Jendric, N. Vincekovic, M. Vincekovic, M. Bujan, I. Primozic, Phase behavior
of bis(quaternary ammonium bromide)/sodium cholate/H2O system, J. Dispersion Sci.
Technol., 26 (2007) 39-51.
[35] B. Barry, G. Gray, Micelle formation and coacervation in mixtures of
alkyltrimethylammonium bromides with di and trihydroxy bile salts, J. Colloid Interface
Sci., 52 (1975) 327-339.
[36] M. Khaledi, S. Jenkins, S. Liang, Perfluorinated alcohols and acids induce
coacervation in aqueous solutions of amphiphiles, Langmuir, 29 (2013) 2458-2464.

20
[37] J. Charboneau, R. von Wandruszka, The clouding of an anionic surfactant in acidic
solution: mechanistic and analytical implications, J. Surfact. Deterg. 13 (2010) 281-286.
[38] P. Jana, S. Moulik, Interaction of bile salts with hexadecyltrimethylammonium
bromide and sodium dodecyl sulfate, J. Phys. Chem., 95 (1991) 9525-9532.
[39] A. Bandyopadhyay, S. Moulik, Counterion binding behavior of micelles of sodium
dodecyl sulfate and bile salts in pure state, in mutually mixed states and mixed with a
nonionic surfactant, Colloid Polym. Sci., 268 (1988) 455-461.
[40] M. Khaledi, J. Bumgarner, M. Hadjmohammadi, Characterization of mixed
micellar pseudostationary phases in electrokinetic chromatography using linear
solvation energy relationships, J. Chromatogr., 802 (1998) 35-47.
[41] Y. Li, B. Hu, Z. Jiang, On-line cloud point extraction combined with
electrothermal vaporization inductively coupled plasma atomic emission spectrometry
for the speciation of inorganic antimony in environmental and biological samples, Anal.
Chim. Acta 576 (2006) 207-214.
[42] Z. Fang, Flow injection separation and preconcentration, VCH, Weinheim,
Germany, 1993.
[43] C. Wang, A. Masi, L. Fernández, On-line micellar-enhanced spectrofluorimetric
determination of rhodamine dye in cosmetics, Talanta 75 (2008) 135-140.
[44] M. Soylak, Y. Unsal, E. Yilmaz, M. Tuzen, Determination of rhodamine B in soft
drink, waste water and lipstick samples after solid phase extraction, Food Chem.
Toxicol. 49 (2011) 1796-1799.
[45] H. Bagheri, R. Daliri, A. Roostaie, A novel magnetic poly(aniline-naphthylamine)-
based nanocomposite for micro solid phase extraction of rhodamine B, Anal. Chim.
Acta 794 (2013) 38-46.

21
[46] L. Xiao-Yan, Determination of Rhodamine B in Red Wine by Solid Phase
Extraction-High Performance Liquid Chromatography, Food Sci., 32 (2011) 238-243.
[47] F. Yin, Z. Ding, Z. Yang, Determination of Rhodamine B in spices by solid phase
extraction-high performance liquid chromatography-tandem mass spectrometry, Se Pu
(Chinese), 30 (2012) 672-676.
[48] W. Yong, W. Na, Determination of Rhodamine B in food using HPLC-UV
method, Chinese Food Science, 1 (2012) 37-39.
[49] M. Taziki, F. Shemirani, B. Majidi, Robust ionic liquid against high concentration
of salt for preconcentration and determination of rhodamine B, Sep. Purif. Tehnol. 97
(2012) 216-220.

22
Table 1
Summary of the different additives examined for their effectiveness in inducing phase
separation in aqueous solutions of sodium cholate containing Rhodamine Ba
Coacervate Inducer Volume Range Examined (mL) CaCl2 (1.0 mol L-1) 0 - 0.5 KI (1.0 mol L-1) 0 - 0.5 NaCl (1.0 mol L-1) 0 - 0.5 SDS (0.020 mol L-1) 0.5 - 1.5 HCl (1.0 mol L-1) 0 - 0.5
aNaC (1.0 mL, 0.020 mol L-1); RhB (250 μl 1.0×10⁻⁶ mol L-1)

23
Table 2
Analytical figures of merit for the FIA on-line SME – fluorimetric determination of
Rhodamine B.
Parameter Value (μg L-1) LOD 0.12 LOQ 0.40 LOL 0.40 - 479.0 r2 0.9933

24
Table 3
Comparison of the sensitivity of the proposed method to published methods for the
extractive determination of Rhodamine B.
Detection system Preconcentration Method
LOD Ref.
UV-visible spectrophotometry CPE (with TX-100)a 1.3 μg L-1 [14] Spectrofluorimetry SMEb 0.014 µg L-1 [2] Mass spectrometry CPE - LC
(with TX-114)c 30 μg kg-l [15]
Spectrofluorimetry None 0.24 µg L-1 [43] UV-visible spectrophotometry SPEd 3.14 μg L-1 [44]
Spectrofluorimetry Micro SPE 1.0 μg L-1 [45] UV-visible spectrophotometry SPE – LC 250 µg L-1 [46]
Mass spectrometry SPE - LC 0.36 µg kg-1 [47] UV-visible spectrophotometry LLEe – LC 5 µg kg-1 [48] UV-visible spectrophotometry DLLMEf 1.05 µg L-1 [49]
Spectrofluorimetry CPE (with NaC/SDS) 0.12 μg L-1 Proposed Method
aCPE refers to cloud point extraction; TX-100 refers to Triton X-100 as surfactant. bRefers to surfactant mediated extraction with the surfactant PONPE-7.5. cRefers to Triton X-114 as surfactant. dRefers to solid phase extraction. eRefers to classical liquid - liquid extraction (with acetone/hexane).
fRefers to ionic liquid based dispersive liquid - liquid microextraction; ionic liquid was
1-hexyl-3-methylimidazolium hexafluorophosphate.

25
Table 4
Determination of RhB in different food condiment samples.
Sample RhB added (μg L-1) RhB found ± CV(μg L-1) Recovery (%, n=3)
RhB found (ng/g)*
Paprika - 1.19 2.39
1.06 ± 0.01 2.33 ± 0.02 3.41 ± 0.01
- 106.6 98.4
530
Chimi churri
- 1.19 2.39
1.49 ± 0.03 2.84 ± 0.02 3.80± 0.02
- 113.3 96.7
745
Rice spice - 1.19 2.39
0.70 ± 0.01 1.88 ± 0.04 3.10 ± 0.07
- 99.2 100.2
350
Pizza spice - 1.19 2.39
0.75 ± 0.02 2.16 ± 0.03 3.03 ± 0.05
- 118.9 95.3
375
* RhB contained in 1 g of sample

26
FIGURE CAPTIONS Figure 1- Chemical structures of the analyte and sodium cholate at the optimized pH value of the SME-FIA experiments. Figure 2-Schematic diagram of the on-line SME/FIA system. mC, minicolumn; PP, peristaltic pumps; V, load/injection valve (a, load position and b, injection position); Line S, sample line; Line E, eluent line; and D, spectrofluorimeter. Figure 3- Emission spectra of RhB (1×10⁻⁸ mol L-1) in water and micellar media. (A) aqueous solution; (B) NaC (2×10⁻³ mol L-1); and (C) NaC (2×10⁻³ mol L-1)/SDS (2×10⁻³ mol L-1); λex = 555 nm and λem = 575 nm with excitation and emission slit widths equal to 5 nm and 5 nm, respectively. Figure 4- Effect of variation of the amount (volume) of (A) SDS; (B) NaC; and (C) HCl upon the fluorescence intensity. [Conditions: (A) 0.020 mol L-1 SDS (HCl = 3 x 10⁻² mol L-1, NaC = 2 x 10⁻³ mol L-1); (B) 0.020 mol L-1 NaC (SDS = 2 x 10⁻³ mol L-1, HCl = 3 x 10⁻² mol L-1 ); (C) 1.0 mol L-1 HCl (NaC = 2 x 10⁻³ mol L-1, SDS = 2 x 10⁻³ mol L-1). Figure 5-Calibration and sample signal traces. (a) reagent blank; standard solutions of RhB: (b) 5×10⁻¹⁰ mol L-1; (c) 1.0×10⁻⁹ mol L-1; (d) 2.5×10⁻⁹ mol L-1; (e) 5.0×10⁻⁹ mol L-1; and (f) real sample (chimichurri). [Conditions: λex = 555 nm and λem = 575 nm; with excitation and emission slit widths equal 5nm and 3 nm, respectively. Injection time: 30 s.]
27
Figure 1
28
Figure 2
29
Figure 3

30
Figure 4
31
Figure 5
32
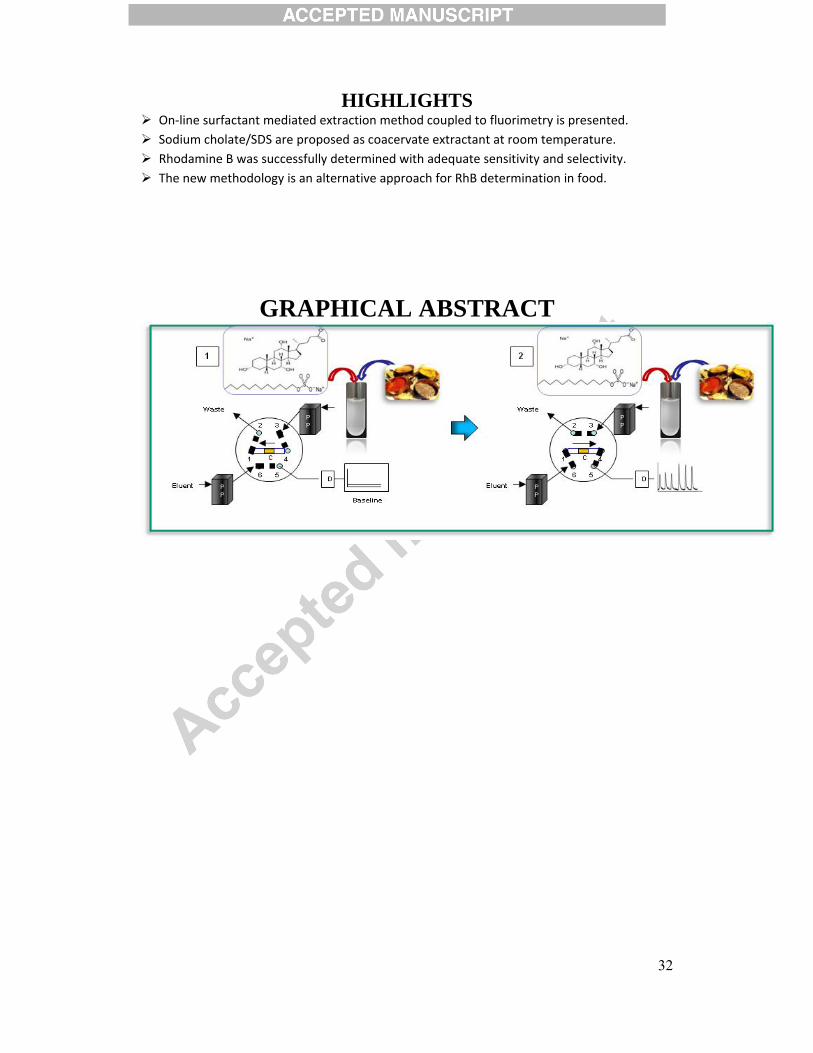
HIGHLIGHTS On‐line surfactant mediated extraction method coupled to fluorimetry is presented. Sodium cholate/SDS are proposed as coacervate extractant at room temperature. Rhodamine B was successfully determined with adequate sensitivity and selectivity. The new methodology is an alternative approach for RhB determination in food.
GRAPHICAL ABSTRACT