Fluid Friction
14
1 MEASUREMENT OF MAJOR AND MINOR LOSSES THROUGH PIPES OF DIFFERENT DIAMETER AND DISCHARGE COEFFICIENT OF VARIOUS FLUID FLOW RATE MEASURING DEVICES Submitted To: Dr. Inam-Ui-Huq Submitted By: Zaheer Hussain Department: Nuclear Engineering ID: 23064 Group: 9th Pakistan Institute of engineering and applied sciences Islamabad
-
Upload
james-rodriguez -
Category
Documents
-
view
239 -
download
0
Transcript of Fluid Friction

1
MEASUREMENT OF MAJOR AND MINOR LOSSES THROUGH PIPES OF DIFFERENT
DIAMETER AND DISCHARGE COEFFICIENT OF VARIOUS FLUID FLOW RATE
MEASURING DEVICES
Submitted To: Dr. Inam-Ui-Huq
Submitted By: Zaheer Hussain
Department: Nuclear Engineering
ID: 23064
Group: 9th
Pakistan Institute of engineering and applied sciences
Islamabad

2
Table of Contents
1 Abstract ........................................................................................................................................................................... 4
2 Procedure ........................................................................................................................................................................ 4
3 DATA ANALYSIS ............................................................................................................................................................... 5
3.1 Calculation and Observation for Major Losses ....................................................................................................... 5
3.1.1 Half Inch Diameter Pipe .................................................................................................................................. 5
3.1.2 ¾ Inch Diameter Pipe ...................................................................................................................................... 6
3.1.3 One Inch Diameter Pipe .................................................................................................................................. 6
3.2 Observations and Calculation for Minor Losses ..................................................................................................... 7
3.2.1 Minor Losses due to 90 Degree Bend in Pipe ................................................................................................. 7
3.2.2 Minor Losses due to Sudden Enlargement in Pipe ......................................................................................... 8
3.2.3 Minor Losses due to Contraction in Pipe ........................................................................................................ 9
3.2.4 Minor Losses due to Gate Valve in Pipe .......................................................................................................... 9
3.2.5 Minor Losses due to Globe Valve in Pipe ...................................................................................................... 10
3.2.6 Minor Losses due to Cock in Pipe ................................................................................................................. 11
3.3 Measurement of Discharge Coefficient for Volume Flow Rate Measuring Devices ............................................. 11
3.3.1 Discharge Co-efficient (Cv) of Venturi ........................................................................................................... 12
3.3.2 Discharge Co-efficient (Cn) of Nozzle ............................................................................................................ 12
3.3.3 Discharge Co-efficient (Co) of Orifice ............................................................................................................ 13
4 Result and Discussion .................................................................................................................................................... 14
5 Conclusions ................................................................................................................................................................... 14

3
List of Tables
Table 1: Observations and Calculation for half inch pipe diameter ....................................................................... 5
Table 2: Observations and Calculation for 3/4 inch pipe diameter pipe................................................................. 6
Table 3: Observations and Calculation for one inch pipe diameter pipe ................................................................ 6
Table 4: Observation and Calculation for 90 Degree Bend in Pipe ........................................................................ 7
Table 5; Observation and Calculation for Sudden Enlargement in Pipe ................................................................ 8
Table 6: Observation and Calculation for Contraction in Pipe ............................................................................... 9
Table 7: Observation and Calculation for Gate Valve in Pipe................................................................................ 9
Table 8: Observation and Calculation for Globe Valve in Pipe ........................................................................... 10
Table 9: Observation and Calculation for Minor Losses due to Cock in Pipe ..................................................... 11
Table 10: Observations and calculations for Venturi tube.................................................................................... 12
Table 11; Observations and calculations for Nozzle ............................................................................................ 12
Table 12: Observations and calculations for Orifice ............................................................................................ 13
List of Figures
Figure 1: A graphical relationship between Renold number and friction factor for half inch pipe diameter ......... 5
Figure 2: A graphical relationship between Renold number and friction factor for 3/4 inch pipe diameter .......... 6
Figure 3: A graphical relationship between Renold number and friction factor for one inch pipe diameter ......... 7
Figure 4: A graphical relationship between Renold number and head loss coefficient for 90 degree bend pipe... 8
Figure 5: A graphical relationship between Renold number and head loss coefficient for sudden enlargement. .. 8
Figure 6: A graphical relationship between Renold number and head loss coefficient for Contraction in pipe .... 9
Figure 7: A graphical relationship between Renold number and head loss coefficient for gate valve in pipe..... 10
Figure 8: A graphical relationship between Renold number and head loss coefficient for Globe valve in pipe . 10
Figure 9: A graphical relationship between Renold number and head loss coefficient for cock in pipe ............. 11
Figure 10: A graphical relationship between Renold number and discharge coefficient for Venturi tube .......... 12
Figure 11: A graphical relationship between Renold number and discharge coefficient for Nozzle .................. 13
Figure 12: A graphical relationship between Renold number and discharge coefficient for orfice ..................... 13
4
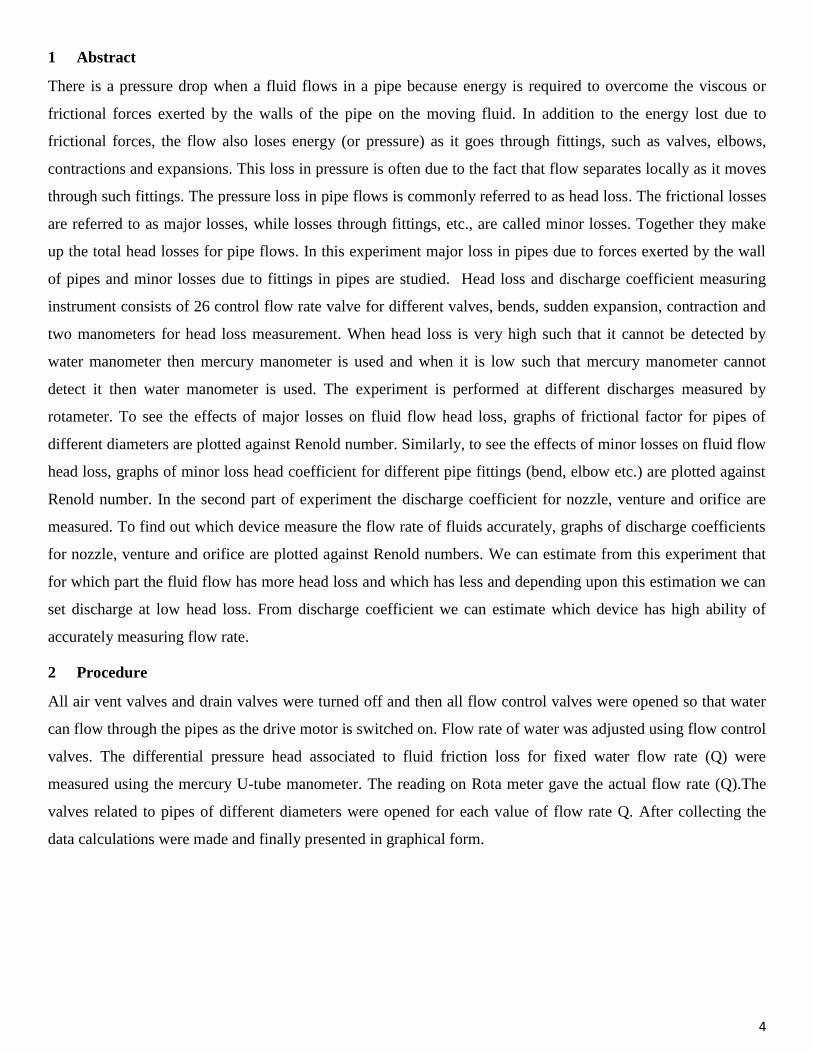
1 Abstract
There is a pressure drop when a fluid flows in a pipe because energy is required to overcome the viscous or
frictional forces exerted by the walls of the pipe on the moving fluid. In addition to the energy lost due to
frictional forces, the flow also loses energy (or pressure) as it goes through fittings, such as valves, elbows,
contractions and expansions. This loss in pressure is often due to the fact that flow separates locally as it moves
through such fittings. The pressure loss in pipe flows is commonly referred to as head loss. The frictional losses
are referred to as major losses, while losses through fittings, etc., are called minor losses. Together they make
up the total head losses for pipe flows. In this experiment major loss in pipes due to forces exerted by the wall
of pipes and minor losses due to fittings in pipes are studied. Head loss and discharge coefficient measuring
instrument consists of 26 control flow rate valve for different valves, bends, sudden expansion, contraction and
two manometers for head loss measurement. When head loss is very high such that it cannot be detected by
water manometer then mercury manometer is used and when it is low such that mercury manometer cannot
detect it then water manometer is used. The experiment is performed at different discharges measured by
rotameter. To see the effects of major losses on fluid flow head loss, graphs of frictional factor for pipes of
different diameters are plotted against Renold number. Similarly, to see the effects of minor losses on fluid flow
head loss, graphs of minor loss head coefficient for different pipe fittings (bend, elbow etc.) are plotted against
Renold number. In the second part of experiment the discharge coefficient for nozzle, venture and orifice are
measured. To find out which device measure the flow rate of fluids accurately, graphs of discharge coefficients
for nozzle, venture and orifice are plotted against Renold numbers. We can estimate from this experiment that
for which part the fluid flow has more head loss and which has less and depending upon this estimation we can
set discharge at low head loss. From discharge coefficient we can estimate which device has high ability of
accurately measuring flow rate.
2 Procedure
All air vent valves and drain valves were turned off and then all flow control valves were opened so that water
can flow through the pipes as the drive motor is switched on. Flow rate of water was adjusted using flow control
valves. The differential pressure head associated to fluid friction loss for fixed water flow rate (Q) were
measured using the mercury U-tube manometer. The reading on Rota meter gave the actual flow rate (Q).The
valves related to pipes of different diameters were opened for each value of flow rate Q. After collecting the
data calculations were made and finally presented in graphical form.

5
3 DATA ANALYSIS
3.1 Calculation and Observation for Major Losses
The major head loss in pipe flows is expressed in the following way:
Where, L and D are the length and diameter of the pipe, respectively, and V is the average fluid velocity through the
pipe. This may be taken as a definition of the friction factor, f. In general, the friction factor is a function of the Reynolds
number Re and the non-dimensional surface roughness, and is determined experimentally. The plot between f vs. Re is
usually referred to as the Moody Diagram.
To calculate and observe the major losses in pipes of different diameter due to fluid flow, data was collected for
pies of different diameter.
3.1.1 Half Inch Diameter Pipe
Table 1: Observations and Calculation for half inch pipe diameter
𝛒 𝛍 D A L Q Q V F.F Re
m2/s m m2 m l/h m3/s m/s mmHg m
998 9.96E-07 0.0127 0.000127 2 500 0.000139 1.09389 9 0.1131944 0.01177 13948.16
998 9.96E-07 0.0127 0.000127 2 800 0.000222 1.75022 15 0.1886573 0.00787 22317.06
998 9.96E-07 0.0127 0.000127 2 1100 0.000305 2.40655 24 0.3018517 0.00749 30685.96
998 9.96E-07 0.0127 0.000127 2 1400 0.000388 3.06289 48 0.6037034 0.00725 39054.86
998 9.96E-07 0.0127 0.000127 2 1700 0.000471 3.71922 71 0.892978 0.00715 47423.76
998 9.96E-07 0.0127 0.000127 2 2000 0.000554 4.37555 100 1.2577154 0.00708 55792.66
998 9.96E-07 0.0127 0.000127 2 2200 0.000609 4.81311 140 1.7608016 0.00696 61371.92
998 9.96E-07 0.0127 0.000127 2 2500 0.000693 5.46944 180 2.2638878 0.00682 69740.82
Figure 1: A graphical relationship between Renold number and friction factor for half inch pipe diameter
0
0.002
0.004
0.006
0.008
0.01
0.012
0.014
12000 22000 32000 42000 52000 62000
Fric
tio
n F
acto
r(f.
f)
Renold Number(Re)
6
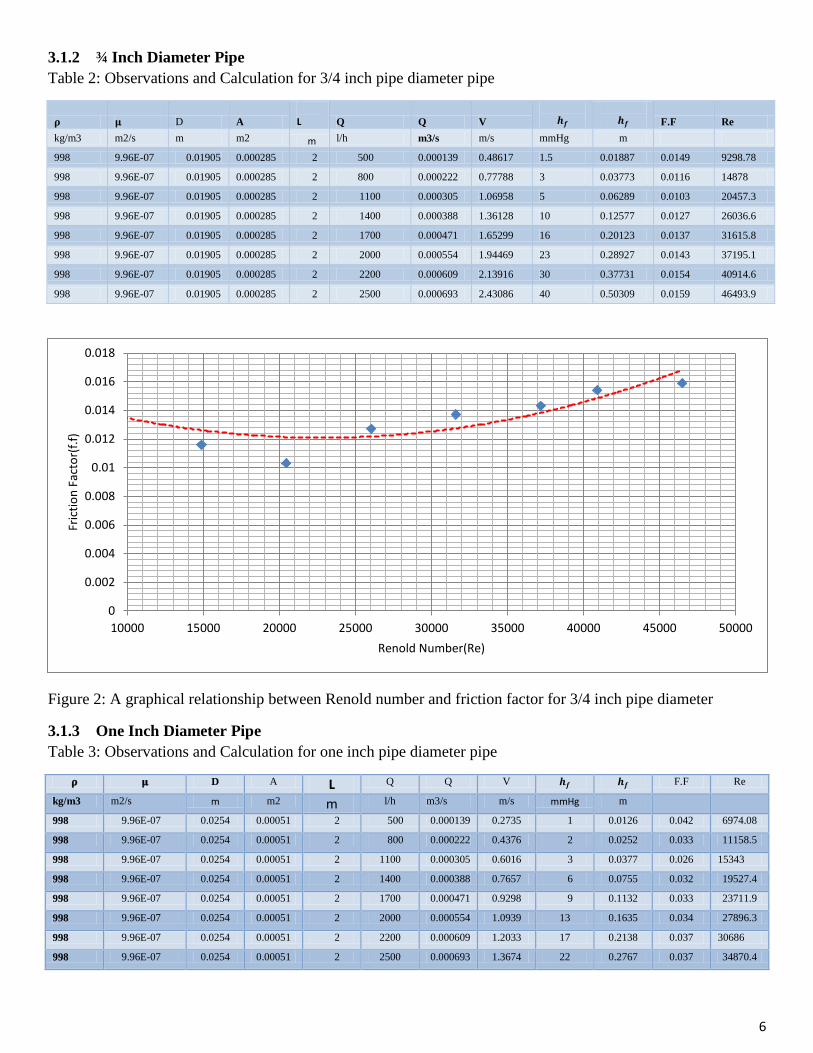
3.1.2 ¾ Inch Diameter Pipe
Table 2: Observations and Calculation for 3/4 inch pipe diameter pipe
𝛒 𝛍 D A
L Q Q V
F.F Re
kg/m3 m2/s m m2 m l/h m3/s m/s mmHg m
998 9.96E-07 0.01905 0.000285 2 500 0.000139 0.48617 1.5 0.01887 0.0149 9298.78
998 9.96E-07 0.01905 0.000285 2 800 0.000222 0.77788 3 0.03773 0.0116 14878
998 9.96E-07 0.01905 0.000285 2 1100 0.000305 1.06958 5 0.06289 0.0103 20457.3
998 9.96E-07 0.01905 0.000285 2 1400 0.000388 1.36128 10 0.12577 0.0127 26036.6
998 9.96E-07 0.01905 0.000285 2 1700 0.000471 1.65299 16 0.20123 0.0137 31615.8
998 9.96E-07 0.01905 0.000285 2 2000 0.000554 1.94469 23 0.28927 0.0143 37195.1
998 9.96E-07 0.01905 0.000285 2 2200 0.000609 2.13916 30 0.37731 0.0154 40914.6
998 9.96E-07 0.01905 0.000285 2 2500 0.000693 2.43086 40 0.50309 0.0159 46493.9
Figure 2: A graphical relationship between Renold number and friction factor for 3/4 inch pipe diameter
3.1.3 One Inch Diameter Pipe
Table 3: Observations and Calculation for one inch pipe diameter pipe
𝛒 𝛍 D A L Q Q V F.F Re
kg/m3 m2/s m m2 m l/h m3/s m/s mmHg m
998 9.96E-07 0.0254 0.00051 2 500 0.000139 0.2735 1 0.0126 0.042 6974.08
998 9.96E-07 0.0254 0.00051 2 800 0.000222 0.4376 2 0.0252 0.033 11158.5
998 9.96E-07 0.0254 0.00051 2 1100 0.000305 0.6016 3 0.0377 0.026 15343
998 9.96E-07 0.0254 0.00051 2 1400 0.000388 0.7657 6 0.0755 0.032 19527.4
998 9.96E-07 0.0254 0.00051 2 1700 0.000471 0.9298 9 0.1132 0.033 23711.9
998 9.96E-07 0.0254 0.00051 2 2000 0.000554 1.0939 13 0.1635 0.034 27896.3
998 9.96E-07 0.0254 0.00051 2 2200 0.000609 1.2033 17 0.2138 0.037 30686
998 9.96E-07 0.0254 0.00051 2 2500 0.000693 1.3674 22 0.2767 0.037 34870.4
0
0.002
0.004
0.006
0.008
0.01
0.012
0.014
0.016
0.018
10000 15000 20000 25000 30000 35000 40000 45000 50000
Fric
tio
n F
acto
r(f.
f)
Renold Number(Re)

7
Figure 3: A graphical relationship between Renold number and friction factor for one inch pipe diameter
3.2 Observations and Calculation for Minor Losses
The head losses associated with fittings such as elbows, tees, couplings, etc. are referred to as “minor losses”. In some
cases, such as short pipes with multiple fittings, these losses are actually a large percentage of the total head loss and
hence are not really “minor”. Minor losses are expressed as;
Where is minor head loss, K is discharge coefficient and V is average velocity of fluid flow.
3.2.1 Minor Losses due to 90 Degree Bend in Pipe
Table 4: Observation and Calculation for 90 Degree Bend in Pipe
𝛒 𝛍 D A Q Q V k Re
kg/m3 m2/s m m2 l/h m3/s m/s mmHg m
998 9.96E-07 0.0254 0.000506 500 0.0001385 0.273472 1 0.013 3.2962 6974.08
998 9.96E-07 0.0254 0.000506 800 0.0002216 0.437555 1.5 0.019 1.9314 11158.5
998 9.96E-07 0.0254 0.000506 1100 0.0003047 0.601638 1.5 0.019 1.0215 15343
998 9.96E-07 0.0254 0.000506 1400 0.0003878 0.765721 2 0.025 0.8409 19527.4
998 9.96E-07 0.0254 0.000506 1700 0.0004709 0.929804 2.5 0.031 0.7128 23711.9
998 9.96E-07 0.0254 0.000506 2000 0.000554 1.093888 3 0.038 0.618 27896.3
998 9.96E-07 0.0254 0.000506 2200 0.0006094 1.203276 5 0.063 0.8513 30686
998 9.96E-07 0.0254 0.000506 2500 0.0006925 1.367359 8 0.101 1.0548 34870.4
0
0.005
0.01
0.015
0.02
0.025
0.03
0.035
0.04
0.045
7000 12000 17000 22000 27000 32000
Fric
tio
n F
acto
r(f.
f)
Renold Number(Re)

8
Figure 4: A graphical relationship between Renold number and head loss coefficient for 90 degree bend pipe.
3.2.2 Minor Losses due to Sudden Enlargement in Pipe
Table 5; Observation and Calculation for Sudden Enlargement in Pipe
𝛒 𝛍 d1 d2 A 1 A 2 Q Q V1 V2 hm k Re
kg/m3 m2/s m m m2 m2 l/h m3/s m/s m/s mmHg m 998 9.96
E-07
0.0254 0.0381 0.00051 0.00114 500 0.000139 0.273 0.122 0.5 0.006 1.648 6974.082
998 9.96
E-07
0.0254 0.0381 0.00051 0.00114 800 0.000222 0.438 0.194 0.5 0.006 0.644 11158.53
998 9.96E-07
0.0254 0.0381 0.00051 0.00114 1100 0.000305 0.602 0.267 1 0.013 0.681 15342.98
998 9.96
E-07
0.0254 0.0381 0.00051 0.00114 1400 0.000388 0.766 0.34 1.5 0.019 0.631 19527.43
998 9.96
E-07
0.0254 0.0381 0.00051 0.00114 1700 0.000471 0.93 0.413 2.5 0.031 0.713 23711.88
998 9.96E-07
0.0254 0.0381 0.00051 0.00114 2000 0.000554 1.094 0.486 3 0.038 0.618 27896.33
998 9.96
E-07
0.0254 0.0381 0.00051 0.00114 2200 0.000609 1.203 0.535 3.5 0.044 0.596 30685.96
998 9.96
E-07
0.0254 0.0381 0.00051 0.00114 2500 0.000693 1.367 0.608 3.5 0.044 0.461 34870.41
Figure 5: A graphical relationship between Renold number and head loss coefficient for sudden enlargement.
0
0.5
1
1.5
2
2.5
3
3.5
6000 11000 16000 21000 26000 31000
Hea
d L
oss
Co
-eff
icie
nt(
K)
Renold Number(Re)
0
0.2
0.4
0.6
0.8
1
1.2
1.4
1.6
1.8
6000 11000 16000 21000 26000 31000
Hea
d L
oss
Co
-eff
icie
nt(
K)
Renold Number(Re)

9
3.2.3 Minor Losses due to Contraction in Pipe
Table 6: Observation and Calculation for Contraction in Pipe
𝛒 𝛍 D1 D2 A 1 A 2 Q Q V1 V2 hf hm k Re
kg/m3 m2/s m m m2 m2 l/h m3/s m/s m/s mmHg m
99
8
9.96E-07
0.0254 0.0381 0.00051 0.00114 500 0.000139 0.273 0.122 0.5 0.006 1.648 6974.082
99
8
9.96E-
07
0.0254 0.0381 0.00051 0.00114 800 0.000222 0.438 0.194 1 0.013 1.288 11158.53
99
8
9.96E-
07
0.0254 0.0381 0.00051 0.00114 1100 0.000305 0.602 0.267 1.5 0.019 1.022 15342.98
99
8
9.96E-07
0.0254 0.0381 0.00051 0.00114 1400 0.000388 0.766 0.34 2 0.025 0.841 19527.43
99
8
9.96E-
07
0.0254 0.0381 0.00051 0.00114 1700 0.000471 0.93 0.413 2.5 0.031 0.713 23711.88
99
8
9.96E-07
0.0254 0.0381 0.00051 0.00114 2000 0.000554 1.094 0.486 2.5 0.031 0.515 27896.33
99
8
9.96E-
07
0.0254 0.0381 0.00051 0.00114 2200 0.000609 1.203 0.535 4 0.05 0.681 30685.96
99
8
9.96E-
07
0.0254 0.0381 0.00051 0.00114 2500 0.000693 1.367 0.608 6 0.075 0.791 34870.41
Figure 6: A graphical relationship between Renold number and head loss coefficient for Contraction in pipe
3.2.4 Minor Losses due to Gate Valve in Pipe
Table 7: Observation and Calculation for Gate Valve in Pipe
𝛒 𝛍 D area Q Q v hf hm k Re
kg/m3 m2/s m m2 l/h m3/s m/s mmHG m
998 9.96E-07 0.0254 0.000507 500 0.000139 0.2735 0.5 0.006289 1.648 6974.082
998 9.96E-07 0.0254 0.000507 800 0.000222 0.4376 1 0.012577 1.288 11158.53
998 9.96E-07 0.0254 0.000507 1100 0.000305 0.6016 1 0.012577 0.681 15342.98
998 9.96E-07 0.0254 0.000507 1400 0.000388 0.7657 1.5 0.018866 0.631 19527.43
998 9.96E-07 0.0254 0.000507 1700 0.000471 0.9298 2 0.025154 0.57 23711.88
998 9.96E-07 0.0254 0.000507 2000 0.000554 1.0939 3 0.037731 0.618 27896.33
998 9.96E-07 0.0254 0.000507 2200 0.000609 1.2033 3 0.037731 0.511 30685.96
998 9.96E-07 0.0254 0.000507 2500 0.000693 1.3674 4 0.050309 0.527 34870.41
0
0.2
0.4
0.6
0.8
1
1.2
1.4
1.6
1.8
6000 11000 16000 21000 26000 31000
Hea
d L
oss
Co
-eff
icie
nt(
K)
Renold Number(Re)

10
Figure 7: A graphical relationship between Renold number and head loss coefficient for gate valve in pipe
3.2.5 Minor Losses due to Globe Valve in Pipe
Table 8: Observation and Calculation for Globe Valve in Pipe
𝛒 𝛍 D A Q Q V hf hm k Re
kg/m3 m2/s m m2 l/h m3/s m/s mmHG m
998 9.96E-07 0.0254 0.000507 500 0.000139 0.2735 4 0.050309 13.18 6974.082
998 9.96E-07 0.0254 0.000507 800 0.000222 0.4376 10 0.125772 12.88 11158.53
998 9.96E-07 0.0254 0.000507 1100 0.000305 0.6016 18 0.226389 12.26 15342.98
998 9.96E-07 0.0254 0.000507 1400 0.000388 0.7657 29 0.364737 12.19 19527.43
998 9.96E-07 0.0254 0.000507 1700 0.000471 0.9298 42 0.52824 11.98 23711.88
998 9.96E-07 0.0254 0.000507 2000 0.000554 1.0939 60 0.754629 12.36 27896.33
998 9.96E-07 0.0254 0.000507 2200 0.000609 1.2033 72 0.905555 12.26 30685.96
998 9.96E-07 0.0254 0.000507 2500 0.000693 1.3674 94 1.182253 12.39 34870.41
Figure 8: A graphical relationship between Renold number and head loss coefficient for Globe valve in pipe
0
0.2
0.4
0.6
0.8
1
1.2
1.4
1.6
1.8
6000 11000 16000 21000 26000 31000
Hea
d L
oss
Co
-eff
icie
nt(
K)
Renold Number(Re)
11.8
12
12.2
12.4
12.6
12.8
13
13.2
13.4
6000 11000 16000 21000 26000 31000
Hea
d L
oss
Co
-eff
icie
nt(
K
Renold Number(Re)

11
3.2.6 Minor Losses due to Cock in Pipe
Table 9: Observation and Calculation for Minor Losses due to Cock in Pipe
𝛒 𝛍 D A Q Q V hf hm k Re
kg/m3 m2/s m m2 l/h m3/s m/s mmHG m
998 9.96E-07 0.0254 0.0005065 500 0.000139 0.2735 0.5 0.006289 1.648 6974.082
998 9.96E-07 0.0254 0.0005065 800 0.000222 0.4376 1 0.012577 1.288 11158.53
998 9.96E-07 0.0254 0.0005065 1100 0.000305 0.6016 1.5 0.018866 1.022 15342.98
998 9.96E-07 0.0254 0.0005065 1400 0.000388 0.7657 2 0.025154 0.841 19527.43
998 9.96E-07 0.0254 0.0005065 1700 0.000471 0.9298 4 0.050309 1.141 23711.88
998 9.96E-07 0.0254 0.0005065 2000 0.000554 1.0939 6 0.075463 1.236 27896.33
998 9.96E-07 0.0254 0.0005065 2200 0.000609 1.2033 9 0.113194 1.532 30685.96
998 9.96E-07 0.0254 0.0005065 2500 0.000693 1.3674 13 0.163503 1.714 34870.41
Figure 9: A graphical relationship between Renold number and head loss coefficient for cock in pipe
3.3 Measurement of Discharge Coefficient for Volume Flow Rate Measuring Devices
Discharge coefficient is the ratio of actual flow to theoretical flow across nozzle, orifice or venture tube. It is always less
than 1. Actual flow rate is given by the reading on the Rota meter while theoretical flow rate is calculated by relation
given in following equations.
√ ----------------------------------------------------------------------------------3
Where, is discharge coefficient for Venturi tube and is head loss in Venturi tube.
√
Where, is discharge coefficient for nozzle and is head loss in nozzle.
√
Where, is discharge coefficient for orifice and is head loss in orifice.
0
0.5
1
1.5
2
6000 11000 16000 21000 26000 31000
Hea
d L
oss
Co
-eff
icie
nt(
K)
Renold Number(Re)

12
3.3.1 Discharge Co-efficient (Cv) of Venturi
Table 10: Observations and calculations for Venturi tube
𝛍 dv D A Q Q V h hv Qth Cv Re
m2/s m m m2 l/h m3/s m/sec mmHg m m3/s
9.96E-07 0.0119 0.0254 0.000506 500 0.000139 0.273 4 0.05 0.00011 1.25469 6974.08
9.96E-07 0.0119 0.0254 0.000506 800 0.000222 0.438 15 0.189 0.000214 1.03667 11158.5
9.96E-07 0.0119 0.0254 0.000506 1100 0.000305 0.602 31 0.39 0.000307 0.99154 1534
3 9.96E-07 0.0119 0.0254 0.000506 1400 0.000388 0.766 50 0.629 0.00039 0.99366 19527.4
9.96E-07 0.0119 0.0254 0.000506 1700 0.000471 0.93 75 0.943 0.000478 0.98518 23711.9
9.96E-07 0.0119 0.0254 0.000506 2000 0.000554 1.094 96 1.207 0.000541 1.02445 27896.3
9.96E-07 0.0119 0.0254 0.000506 2200 0.000609 1.203 105 1.321 0.000566 1.07752 30686
9.96E-07 0.0119 0.0254 0.000506 2500 0.000693 1.367 130 1.635 0.000629 1.10044 34870.4
Figure 10: A graphical relationship between Renold number and discharge coefficient for Venturi tube
3.3.2 Discharge Co-efficient (Cn) of Nozzle
Table 11; Observations and calculations for Nozzle
𝛍 dn D A Q Q V h hv Qth Cn Re
m2/s m m m2 l/h m3/s m/s mmHg m m3/s
9.96E-07 0.0131 0.0254 0.000506 500 0.000139 0.273 4 0.05 0.000134 1.03535 6974.08
9.96E-07 0.0131 0.0254 0.000506 800 0.000222 0.438 14 0.176 0.00025 0.88547 11158.5
9.96E-07 0.0131 0.0254 0.000506 1100 0.000305 0.602 28 0.352 0.000354 0.86092 1534
3 9.96E-07 0.0131 0.0254 0.000506 1400 0.000388 0.766 50 0.629 0.000473 0.81996 19527.4
9.96E-07 0.0131 0.0254 0.000506 1700 0.000471 0.93 68 0.855 0.000552 0.85377 23711.9
9.96E-07 0.0131 0.0254 0.000506 2000 0.000554 1.094 88 1.107 0.000627 0.88295 27896.3
9.96E-07 0.0131 0.0254 0.000506 2200 0.000609 1.203 105 1.321 0.000685 0.88915 30686
9.96E-07 0.0131 0.0254 0.000506 2500 0.000693 1.367 122 1.534 0.000739 0.93736 34870.4
0
0.2
0.4
0.6
0.8
1
1.2
1.4
6000 11000 16000 21000 26000 31000 36000
Dis
char
ge C
o-e
ffic
ien
t(C
v)
Renold Number(Re)

13
Figure 11: A graphical relationship between Renold number and discharge coefficient for Nozzle
3.3.3 Discharge Co-efficient (Co) of Orifice
Table 12: Observations and calculations for Orifice
𝛍 do D A Q Q V hf ho Q Co Re
m2/s m m m2 l/h m3/s m/s mmHg m m3/s
9.96E-07 0.0147 0.0254 0.000506 500 0.000139 0.273 3 0.038 0.000146 0.94944 6974.08
9.96E-07 0.0147 0.0254 0.000506 800 0.000222 0.438 12 0.151 0.000292 0.75955 11158.5
9.96E-07 0.0147 0.0254 0.000506 1100 0.000305 0.602 29 0.365 0.000454 0.67182 15343
9.96E-07 0.0147 0.0254 0.000506 1400 0.000388 0.766 48 0.604 0.000584 0.66461 19527.4
9.96E-07 0.0147 0.0254 0.000506 1700 0.000471 0.93 69 0.868 0.00
07
0.6731 23711.9
9.96E-07 0.0147 0.0254 0.000506 2000 0.000554 1.094 96 1.207 0.000825 0.67135 27896.3
9.96E-07 0.0147 0.0254 0.000506 2200 0.000609 1.203 127 1.597 0.000949 0.64206 30686
9.96E-07 0.0147 0.0254 0.000506 2500 0.000693 1.367 170 2.138 0.001098 0.63063 34870.4
Figure 12: A graphical relationship between Renold number and discharge coefficient for orfice
0
0.2
0.4
0.6
0.8
1
1.2
6000 11000 16000 21000 26000 31000
Dis
char
ge C
o-e
ffic
ien
t(K
Cn
)
Renold Number(Re)
0
0.1
0.2
0.3
0.4
0.5
0.6
0.7
0.8
0.9
1
6000 11000 16000 21000 26000 31000 36000
Dis
char
ge C
o-e
ffic
ien
t(C
o)
Renold Number(Re

14
4 Result and Discussion
The graphs from figure 1 to figure 3 appear to show that the "friction factor" decreases as the Reynolds number
goes up. More speed and hence discharge gives less friction to fluid flow. The "friction factor" is purely a
measure of how the pipe affects the flow, so as the diameter of the pipe increases the friction factor decreases.
For half inch diameter pipe the friction factor is high while for one inch diameter pipe it is low. Renold number
has a direct relation and friction factor has inverse relation with the diameter of the pipe and velocity of the fluid
flowing through that pipe. Since major head losses are directly proportional to the friction factor, so the head
loss will be high for low diameter pipe and at high velocity of fluid flow. There are some deviations in
calculated results from actual result. These deviations are occurred because manometers were not working
properly.
The graphs from figure 4 to figure 9 for different fittings in the pipe of one inch diameter show that minor head
loss coefficient decreases with increasing Renold number. Since minor head losses are directly proportional to
the head loss coefficient, so the minor head loss will be high for low head loss coefficient and at high velocity
of fluid flow. The head loss coefficient for glove valve (Figure 8) is high as compared to the other fitting in the
pipes. The head loss coefficient for is low for cock fitting as compared the other fitting the fittings. For sudden
enlargement the head loss is low as compared to that of sudden contraction (Figure 4 and Figure 5).
Discharge coefficients for Venturi tube, Nozzle and Orifice decreases for increasing Renold number. From
graphs of Figure 9, Figure 10 and Figure 11 we see that Cv>Cn>Co. Since discharge coefficient is inversely
proportional to the volume flow rate from of devices (venture, nozzle, orifice), so head loss for orifice is large
than other so flow rate for orifice become large and coefficients become small.
5 Conclusions
From above discussion it is concluded friction factor for major losses, coefficients of head loss for minor losses
and discharge coefficients of flow rate measuring devices decreases as Reynolds number increases. Theses head
losses decreases with increasing diameter of the pipe and decreasing the velocity of fluid flow. The minor head
loss is high for glove valve as compare to the other fittings in the pipe. The discharge coefficient for Venturi
tube is high, so it is a good flow rate measuring device.