
Flow through pressure relief devices and the … THROUGH PRESSURE RELIEF DEVICES AND THE DISPERSION...
31
FLOW THROUGH PRESSURE RELIEF DEVICES AND THE DISPERSION OF THE DISCHARGE K Moodie* and S F Jagger* The venting characteristics of spring-loaded pressure relief valves and the subsequent dispersion of the discharges are assessed from results obtained during a series of kerosene pool fire engulfment trials on uninsulated LPG tanks of up to 5 tonnes capacity, which had different levels of initial fill. The LPG tanks were instrumented to measure mainly pressures and temperatures within the vessels and, in the case of the 5 tonne tank, the vent system. The discharge rates were also measured, either directly by load cells or by calculation from other data. The size and dispersion characteristics of the flaring propane releases from the 5 tonne tank were obtained from photographic records. The performances of the vent systems are compared with theoretical estimates based on all vapour venting. The flare profiles from the 5 tonne tank, and their trajectories, are compared with theoretical estimates based on fully gaseous jet/plume models. Keywords: relief valves, venting, jet/plume dispersion, fire eng- ulfment, LPG, vapour/liquid flow. 1 INTRODUCTION It is accepted industrial practice to fit pressure relief systems to pressure vessels and chemical reactors, in order to prevent them being pressurised beyond their design limits as this could result in the vessel sustaining permanent damage. The processes undertaken in the vessel or in a reactor system dictate the likelihood of overpressures or pressure transients occurring, but typical sources are, processes involving exothermic reactions, the storage and use of pressurised liquefied gases, and the heating of the vessel's contents due either to internal volumetric heat generation or to external sources in the form of an engulfing fire. A pressure relief system must be of sufficient capacity to cope with the maximum vapour or liquid generation rates developed by the net energy input to the system. Typically this is in the form of a heat input leading to *Health and Safety Executive, Explosion and Flame Laboratory, Harpur Hill, Buxton, Derbyshire 215
Transcript of Flow through pressure relief devices and the … THROUGH PRESSURE RELIEF DEVICES AND THE DISPERSION...

FLOW THROUGH PRESSURE RELIEF DEVICES AND
THE DISPERSION OF THE DISCHARGE
K Moodie* and S F Jagger*
The venting characteristics of spring-loaded pressure relief valves and the subsequent dispersion of the discharges are assessed from results obtained during a series of kerosene pool fire engulfment trials on uninsulated LPG tanks of up to 5 tonnes capacity, which had different levels of initial fill.
The LPG tanks were instrumented to measure mainly pressures and temperatures within the vessels and, in the case of the 5 tonne tank, the vent system. The discharge rates were also measured, either directly by load cells or by calculation from other data. The size and dispersion characteristics of the flaring propane releases from the 5 tonne tank were obtained from photographic records.
The performances of the vent systems are compared with theoretical estimates based on all vapour venting. The flare profiles from the 5 tonne tank, and their trajectories, are compared with theoretical estimates based on fully gaseous jet/plume models.
Keywords: relief valves, venting, jet/plume dispersion, fire engulfment, LPG, vapour/liquid flow.
1 INTRODUCTION
It is accepted industrial practice to fit pressure relief systems to pressure vessels and chemical reactors, in order to prevent them being pressurised beyond their design limits as this could result in the vessel sustaining permanent damage. The processes undertaken in the vessel or in a reactor system dictate the likelihood of overpressures or pressure transients occurring, but typical sources are, processes involving exothermic reactions, the storage and use of pressurised liquefied gases, and the heating of the vessel's contents due either to internal volumetric heat generation or to external sources in the form of an engulfing fire.
A pressure relief system must be of sufficient capacity to cope with the maximum vapour or liquid generation rates developed by the net energy input to the system. Typically this is in the form of a heat input leading to
*Health and Safety Executive, Explosion and Flame Laboratory, Harpur Hill, Buxton, Derbyshire
215

FLOW THROUGH PRESSURE RELIEF DEVICES AND
THE DISPERSION OF THE DISCHARGE
K Moodie* and S F Jagger*
The venting characteristics of spring-loaded pressure relief valves and the subsequent dispersion of the discharges are assessed from results obtained during a series of kerosene pool fire engulfment trials on uninsulated LPG tanks of up to 5 tonnes capacity, which had different levels of initial fill.
The LPG tanks were instrumented to measure mainly pressures and temperatures within the vessels and, in the case of the 5 tonne tank, the vent system. The discharge rates were also measured, either directly by load cells or by calculation from other data. The size and dispersion characteristics of the flaring propane releases from the 5 tonne tank were obtained from photographic records.
The performances of the vent systems are compared with theoretical estimates based on all vapour venting. The flare profiles from the 5 tonne tank, and their trajectories, are compared with theoretical estimates based on fully gaseous jet/plume models.
Keywords: relief valves, venting, jet/plume dispersion, fire eng-ulfment, LPG, vapour/liquid flow.
1 INTRODUCTION
It is accepted industrial practice to fit pressure relief systems to pressure vessels and chemical reactors, in order to prevent them being pressurised beyond their design limits as this could result in the vessel sustaining permanent damage. The processes undertaken in the vessel or in a reactor system dictate the likelihood of overpressures or pressure transients occurring, but typical sources are, processes involving exothermic reactions, the storage and use of pressurised liquefied gases, and the heating of the vessel's contents due either to internal volumetric heat generation or to external sources in the form of an engulfing fire.
A pressure relief system must be of sufficient capacity to cope with the maximum vapour or liquid generation rates developed by the net energy input to the system. Typically this is in the form of a heat input leading to
*Health and Safety Executive, Explosion and Flame Laboratory, Harpur Hill, Buxton, Derbyshire
215

IChemE SYMPOSIUM SERIES No. 102
pool fire of kerosene contained in the pit. The tests were repeated with different initial levels of propane fill. The tanks were re-used after each test, but only after a careful metallurgical examination to check that they had not been weakened excessively in the previous fire.
2.1 Fire and bund design
Two sizes of engulfing fire were used for the tests. The two smaller tank sizes were tested in a fire bund enclosure some 4m long by 2.4m wide by 0.6m deep. A lm high wind break surrounded the bund at a distance of lm from it. The LPG tanks were supported on firebrick piers so that the bottom of the tank was flush with the top of the pool walls. When testing the 1 tonne tank four load cells were fitted under the tank so that the weight of the vessel and its contents could be recorded continuously throughout a trial.
The 5 tonne tank was tested in a larger bund but of similar construction. This was 7m long by 4m wide by 2m deep with a 1.5m high wind break. The test tank was set lower in the bund, its central axis being level with the top of the bund. Four load cells were fitted under the legs of the tank supporting structure.
The kerosene fuel for the fires was floated on top of a layer of water, which filled the lower regions of the bunds, and protected the load cells. The burning rate of kerosene in the smaller bund was approximately 0.64 1/s, a lower rate of burning was recorded for the fires in the larger bund.The typical duration of a fire was 30 - 45 minutes.
They were all started by an electrically operated igniter. A fluorocarbon foam fire extinguishing system was provided, which could be operated remotely, and which would extinguish a fire within 30 seconds. Two alternative back-up fire extinguishing systems were employed for the tests on the 5 tonne tank.
2.2 Tank Instrumentation
Tank wall temperatures were measured by stainless-steel sheathed chromel-alumel thermocouples welded to the walls of the various test tanks. Liquid and vapour temperatures inside the tanks were similarly measured. Internal pressures were measured by pressure transducers connected to pressure tappings at the top and bottom of the tanks. For the 5 tonne trials, water calorimeters surrounding the tank, were used to obtain the average heat flux from the fire. The heat fluxes to the 5 tonne tank and its contents were obtained from pairs of thermocouples attached to the inner and outer tank walls. The positions of thermocouples, attached to and within the 5 tonne tank, are shown in Fig 1.
The masses of the 1 and 5 tonne tanks and their contents were measured using a four-point load cell weighing system with preamplifier and temperature compensation. The load cells and preamplifier were positioned on the floor of the bund and were submerged in water. All transducer signals were carried out of the fire zone by means of mineral insulated multicore cables. The pressure transducers, thermocouples, and weighing system were connected to a computer controlled data logger situated within a control room remote from the bund. Up to one hundred and twenty-eight channels of data are collected at a sampling rate of one sample per second
217

IChemE SYMPOSIUM SERIES No. 102
per channel. The main test conditions are summarised in Table 1.
2.3 Pressure Relief Systems
The 1/4 and 1 tonne tanks were each fitted with spring operated pressure relief valves, these were attached externally, directly into the top surface of the tanks. A 1 metre long by 38mm dia. flare stack was then attached to the exit of the relief valve. The effective areas of the PRV's used for the 1/4 and 1 tonne tests were respectively 1.79 x 10-i*m2 and 2.76 x 10_4m2.
The 5 tonne tank had two pressure relief valves of the same type attached internally, directly into the top surface of the tank. Their outlets were each connected to two short lengths of 100mm dia. pipe which in turn connected into a single 150mm dia. flare pipe. The overall length of the vent stack was approximately 2.3m. The static temperature and the dynamic pressure were measured in the outlet plane of the vent stack. The effective area of each PRV was 8.87 x 10⁻⁴m2.
2.4 Release Observations
A comprehensive photographic record was taken of each trial. Two 35mm still cameras were placed approximately at right angles to and along the wind direction, and hence provided two views one along and another across the flare. The cameras were time synchronised and set at a framing rate of either 6 or 12 per minute. The camera positions were accurately fixed using conventional survey methods. A video record of each trial was also made and a variety of radiometers used to measure the heat output from the flare.
Additionally continuous observations of wind speed and direction were made using respectively, a cup anemometer and a wind vane positioned approximately 40m from the flare stack and at a height of about 2m above it.
3. RELIEF VALVE SIZING
3.1 Single-Phase Discharges
The simplest type of discharge considered was a single phase vapour flow, for which the energy equation is usually written in terms of the stagnation enthalpy (hs) as follows:-
hs = h + hfu2 (1)
In the case of vapour flow through a nozzle the maximum mass flow occurs when the flow is choked, and depends only upon the upstream stagnation conditions thus:-
J zray ,
j f + i ' {21) r=r
( r + i)
The effective area C^Ap is a measure of the discharge efficiency of the relief valve compared to an ideal nozzle. It was obtained from equation (2) by substituting the results from a series of tests in which the air flow rate through the PRV was measured using an orifice plate, during the
218
martin
Note
This equation (2) was subsequently corrected to the version which appears in the Errata document (no 23) at the end of this document collection.

IChemE SYMPOSIUM SERIES No. 102
continuous discharge of the contents of an air receiver through the PRV. The initial air pressure in the receiver was well in excess of the operating pressure of the valve. Measurements were continued until the valve closed.
The exit mach number from the vent was calculated from the isentropic gas flow assumptions and continuity. Thus for the 5-Tonne tank
<+l V+l MAE = Uj; = 0.0502 ( 2 ) 2 05-1) (Pg) T T (3)
CE (*+l) (PE)
for a stack expansion ratio, Ag of 19.93. AT
The flare pipe fitted to the 5 tonne test tank was sized to give a fully expanded discharge with an exit velocity of approximately half the sonic velocity. This ensured that flame stabilisation occurred during burning, and thus reduced the risk of blow-off. In practice however, it may not always be practicable to fit a large diameter flare pipe and as an alternative a sonic or near sonic under-expanded jet release is utilised. The entrainment and dispersion characteristics of under-expanded gaseous jets have been examined in a separate study and the results reported elsewhere<6 and 7).
3.2 Two-Phase Discharges
When a vessel containing liquid close to its saturation temperature is depressurised, for instance when a pressure relief valve opens, swelling of the liquid occurs due to the formation of vapour within the liquid as it tries to restore equilibrium. In the worst case(°) the swell fills the vessel with a homogeneous mixture which defines the initial inlet quality to the vent system. Experimental observations reported by Sallet^ indicate that the inlet quality increases as the venting process proceeds, until a vapour space develops above the boiling mixture and which continues to grow as the venting proceeds further. Droplet entrainment is observed during this period, remaining until the swelled liquid/vapour interface reaches a level which supports all vapour flow into the vent. Under these conditions the vapour flow entering the vent may not be saturated, as considerable thermal stratification is observed during this venting phase,Sallet(10) and Moodie(n).
^curate modelling of the two-phase vent discharge characteristics for a range of inlet conditions is a complex process. Numerous theoretical models have been proposed and reviewed by for instance Wallis^12), Chisholm(13) and MorrisU4). Calculations of flashing two-phase mass flow rates through the vent system on the 5 tonne tank were made following the recommendation of Morris ft4), that for an inlet quality of greater than 10% the homogenous equilibrium model (HEM) will give a reasonably good approximation. This assumes that metastable or non-equilibrium flow through the PRV can be ignored. The numerical solution procedure used to solve the HEM equations was the 'PIPE' computer programme as described by Akhter(15)_ ^ e iniet quality was matched to the mass flow rate as measured during actual fire engulfment trials over a specified period of time. When the inlet quality is very low and non-equilibrium flow through the vent is considered likely, then the Henry-Fauske critical flow model as
219

IChemE SYMPOSIUM SERIES No. 102
given in (3) may provide a better estimate of the flow conditions.
4. EXPERIMENTAL RESULTS
The mass flow rates through the vent systems fitted to 1/4 and 1 tonne tanks have been reported previously(16), from which Table 2 is reproduced. The first two rows of results are the mass flow rates as measured directly from the load cells attached beneath the tank. The choked mass flow rate is the value calculated at the time the PRV first opens, based on the corresponding values of vapour pressure and bulk vapour temperature, as also given in Table 2. The discharge rates observed seemed to indicate that some high quality two-phase flow (droplet carry-over) was occurring during the early stages of venting in all of these test results.
The performance of the vent system used on the 5 tonne propane tank during fire engulfment was compared with theoretical predictions derived using the methods given in the previous two sections. Four tests were analysed for which the initial fill levels were nominally 20, 40, 60 and 80%. Although two pressure relief valves were fitted, examination of the valve seats after each trial suggested that in all but the 60 and 80% fill tests only one valve had opened. In these two cases the visual records of the tests indicated that both valves may have been open momentarily during the early stages of venting. However for calculational purposes this possibility was ignored and all the comparisons were made on the basis of only one valve opening.
4.1 5 tonne Tank:- Bulk Fluid Temperatures
Figs 2 and 3 illustrate the temperature stratification observed within the bulk liquid and vapour spaces, for initial fill levels of nominally 20% and 60% respectively. The thermocouple traces are shown in descending order from the top of the tank, the exact locations of the thermocouples are shown in Fig 1. The vapour space stratification can be seen clearly in the two cases considered. It followed a similar pattern in every case, rising initially until the PRV first opens, then falling momentarily towards saturation, presumably as frothing occurs, before rising again as the venting progresses. Thus maximum vapour superheat levels of the order of 300 - 400°C were observed as the venting progressed. This can be expected (from equation 2) to decrease the maximum vent discharge rate if all vapour venting is taking place.
The rapid temperature decay shown in Fig 2 after twenty minutes was due to the fire extinguishing and vessel cooling process. Fig 2 also shows that the vapour temperatures rose more quickly for the lowest initial fill although the peak level reached was some 100°C lower than in the other case. This may have been due to lower than average heat fluxes through the vapour space wall of the vessel, some of which were actually negative during the test.
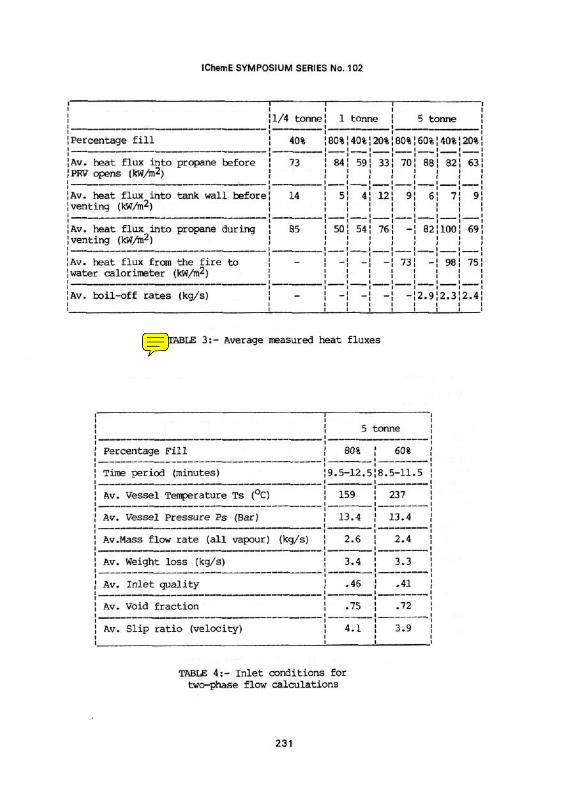
The average heat fluxes into the liquid propane during all four tests were obtained by averaging the measured temperature differences across the liquid space walls and assuming a one dimensional heat flow across the walls of the vessel. The results are shown in Table 3. The average heat fluxes from the fire were obtained from the water calorimeter data and are also shown in Table 3. The heat fluxes appropriate to the venting periods were used to calculate average boil-off rates to compare with the measured
220

IChemE SYMPOSIUM SERIES No. 102
discharge rates. These results are also shown in Table 3.
4.2 5 tonne Tank:- Internal Pressure
The internal vapour pressures recorded for the four initial fill levels are shown in Fig 4 for the first 30 minutes of each test. The set opening pressure was 14.2 bar in all cases, but the valves invariably opened at lower pressures as venting progressed. The times to initial opening, of around 6 minutes, were very similar in all cases, and represented the peak pressure achieved during venting. There were some momentary valve closures during venting in all but the 80% fill test. These resulted in two significant pressure peaks in the 20% test as can be seen from Fig 4. These occurred after the fire had been extinguished and are considered to have resulted from residual heat within the tank shell being transferred to the remaining liquid.
The similarity of the times to initial valve opening, together with the observed vapour/liquid thermal stratification, indicates that the internal pressure was to some extent being controlled by the heat and mass transfer to the vapour space, and not solely by the heat required to bring the liquid up to saturation. Thus the bulk of the liquid is sub-cooled at the onset of venting, and this may limit the level of swell obtained once the PRV opens.
The initial venting times may also be compared with those to reach bulk liquid saturation, calculated from a simple heat balance, or similar as given by Forrest(17). Thus the times to venting are 4.3, 3.1, 2.8, 2.9 mins for respectively 80, 60, 40 and 20% initial fills, and a fixed time of 4.9 mins according to (!'). These times do not allow for the heat capacity of the vessel nor for any heat exchange through the vapour space.
4.3 5 tonne Tank;- Load Cell Measurements
The changes in weight of the tank and its contents during the venting process are shown in Fig 5. These were obtained from four load cells fitted beneath the tank support frame, as described in Section 2.2. Problems were encountered initially due to thermal expansion effects, which resulted in non-axial loading of the load cells. These were eventually overcome by supporting one pair of load cells on rollers. However, as the gradient of the curve was used in the assessment it was considered justifiable to ignore these thermal loading effects. No load cell data was obtained for the 40% fill trial due to an amplifier failure soon after commencement of the test.
4.4 5 tonne Tank;- Mass Flow Rates
The mass flow rates through the vent system were calculated assuming choked vapour flow from equation (2) , using vapour pressure and maximum vapour temperature data, such as that given in Figs 2-4. The results are shown in Figs 6 and 7 for the four tests considered. It will be observed that the all vapour mass flow rate predictions decrease as venting progresses, and the greater the initial fill the greater the rate of discharge. The mass flow rates were also obtained by differentiating the weight loss after smoothing the basic data with a sixty point moving average routine. The results are also shown in Figs 6 and 7. These indicate, that in the initial stages of discharge for 80 and 60% fills, the mass flow rate is
221

iChemE SYMPOSIUM SERIES No. 102
higher than that obtained from the choked all vapour flow assessment. This is presumed to be due to liquid carry-over, which is in agreement with the physical description of the venting process as given by Sallet^).
An estimate of the inlet quality for these two cases was obtained using the solution procedure(l^). The two-phase calculations were performed at saturation conditions, by calculating the equivalent valve area which gave the same vapour mass flow at saturated conditions as was observed at the higher experimental temperatures. Values were calculated based on average conditions over a time period of three minutes for each test. This was chosen to correspond with the time periods used to assess the dispersion and flare profiles as described in Section 5. The test results are shown in Table 4.
The observed rate of weight loss from the tank when 20% full was slightly less than the maximum vapour only prediction, as can be seen from Fig 7. This was greater towards the end of the trial and also for the 80 and 60% trials, during the periods when the fires had been extinguished and the vessel was cooling. However a less than the maximum discharge rate is to be expected as only residual heat is available for vapour generation.
4.5 5 tonne Tank Vent Stack Exit Velocity
The vent stack exit Mach numbers were calculated, assuming all vapour flow, from equation (3) for the four fills considered. The results are shown in Fig 8. The exit velocity was also calculated, using the small Mach number approximation, from the observed dynamic pressure head and static temperature, measured at the exit from the vent stack. The exit Mach numbers so calculated are shown in Fig 9. These compare favourably with the results obtained from equation (3). However there are some discrepancies particularly the 80% fill, which may be due to untypically high values of the static temperature at the stack exit, possibly because of back radiation from the flare or from flame impingement. In addition non-equilibrium effects during the period of two-phase discharge may have influenced the exit pressure.
4.6 Assessment of Results
The test results from the 5-tonne trials seem to indicate that for non-reacting systems two-phase flow (or droplet carry-over) is to be expected, for initial fill levels greater than 50% of the vessel volume and when the heat flux to the liquid contents is in the region of 60-80 kW/m^. Two-phase flow was indicated at lower initial levels of fill for the two smaller sizes of tank. However the currently accepted, though physically unrealistic assumption of all vapour venting, though underpredicting the vent size for two-phase flow does not, on the basis of these results, do so to such an extent that vessel failure will be a direct result. The reason for this may be that vessel failure is primarily dependant on the maximum wall temperature reached^6). Thus although two-phase flow can result in the pressure rising during the early stages of venting, the likely skin temperature combined with the safety margins for overpressure as provided by the design code can compensate for the effects of two-phase flow and prevent vessel failure. However this may not necessarily be the case at higher levels of heat input or if the vent take-off position is nearer the initial liquid surface, as may be the case if the tank is tipped to one side.
222

IChemE SYMPOSIUM SERIES No. 102
5. BUKNIN3 JETS
The behaviour of torches and jet flames depends strongly on source term characteristics. Current practice is to use non-ignited plume/jet models and identify the steady state flame size with the predicted LFL contour. This actually indicates the maximum travel distance of a flame in a preformed cloud with delayed ignition. The subsequent steady state flame length may be shorter(18)#
A wide range of plume/jet models of varying complexity is available. The clear preference is for a simple predictive tool which does not underestimate hazards. Here two models are tested against observations.
5.1 Asymptotic Jet Models
Jagger and Edmondson^ have shown that the discharge from a relief vent into a crossflow can be classified according to the four relevant length scales determined from initial release conditions and the crossflow velocity:
1Q = QAfc lm = M3/4/6*
(4) Zn, = M V U Z B = B/U3
1 Q is determined by the source and only influences flow close to the release point. 1^ shows the relative importance of the initial momentum and buoyancy and indicates the point at which the buoyancy-induced velocities dominate over the initial momentum. Thus for distances from the source <lm the flow is jet-like, and at greater distances plume-like behaviour is most important, z^ and zg show the influence of the ambient flow. Thus for small values of z^ or zg the flow is largely determined by the crossflow and the jet or plume is said to be 'bent over1 in the ambient flow direction. For large values of these parameters the buoyancy or momentum are the determining factors and the flow is largely in the vertical direction.
Consequently, providing 1 Q is small or distances from the exit are sufficient for the source to have little effect, lm, zm and zg can be used to classify flows; lra specifying plume or jet type behaviour and % and zg showing that the flow is principally in the horizontal or vertical directions.
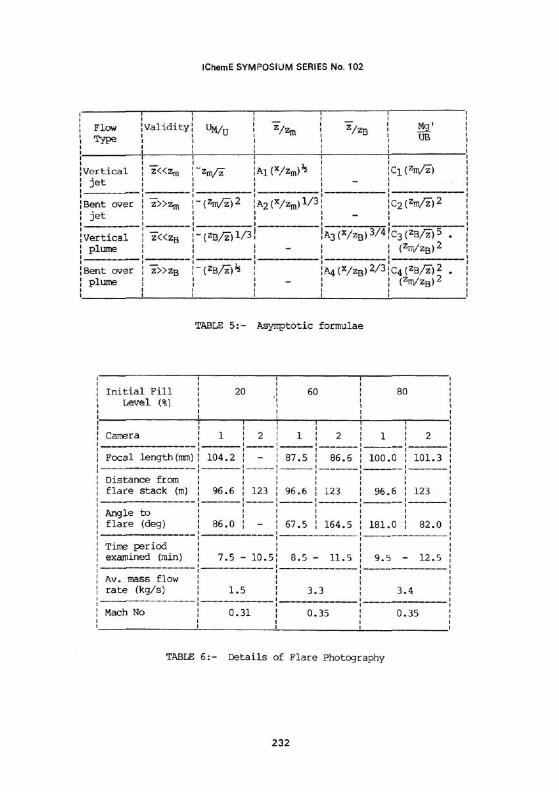
Thus four analytical solutions to the full fluid flow equations can be obtained in certain limiting situations identified by __(->) • These correspond to regions of the flow where the ratios z/z™ or z/z are » or « 1 and give the functional variation of centre line velocity, release trajectory and downstream dilution. A sum-nary of these solutions is found in Table 5. When applied to a typical stack release such simple relations can be used to give the approximate variation of the path and concentration on the centre line.
5.2 Integral Models
A more complex formulation is typified by that of Ooms et al(19) developed for stack gas releases. Such 'integral' models again start from the full fluid flow equations expressing conservation of mass, momentum, energy and
223

IChemE SYMPOSIUM SERIES No. 102
species. These are then integrated across a plane normal to the plume axis using similarity assumptions for radial velocity, temperature and concentration profiles, to give the downstream variation of plume height, velocity, temperature and concentration. An entrainment assumption must be used to close the equations.
A similar model(5) has been developed to predict concentrations resulting from relief vent discharges. This formulation incorporated several features different to that of Ooms et al to represent the particular behaviour of such emissions:-
(a) Releases from relief vents often approach sonic velocities. Conventional plume/jet models do not provide accurate predictions in such circumstances. Hence a compressible jet model has been incorporated to describe the near-field release behaviour.
Ewan and Moodie(^) have described an experimental investigation of under-expanded gaseous jets and validated a suitable analytical model to represent the velocity and concentration decay. They found an initial region characterised by a shock structure in which the flow adjusts to external pressure conditions. This is a region of little dilution. The length of this region is defined as the barrel length B. Empirically this was found to be given by
B = 0.77% + O.OeSDE1-3^ (5)
where dimensions are in mm. Typically a further barrel length is required for full equilibriation of velocity across the jet so an equivalent jet origin can be defined two barrel lengths from the nozzle. From this position Ewan and Moodie found their data closely represented by a conventional compressible jet model from which axial velocity and concentration decay are given by:
{&• §6- * - « * ( < & ) m where Q is an axial correlation parameter and Xc is the non-dimensional core length taken as 0.70. The axial correlation parameter Q, is a function of eddy viscosity, jet exit parameters and downstream distance.
(b) A formulation has been developed which can incorporate a variety of entrainment assumptions. Since releases from relief vents can vary markedly in density, an entrainment relation in which local plume/jet density appears explicitly would appear most suitable. Badr and Grand(20) have recently reviewed available entrainment relations for such models. Though further validation is required in this area, the entrainment function used for this study was based on earlier work of Wu and Koh(20) and is given by
E = (<*[UM - Ucose] + ^ U|sin©| cos© + a4 U')R (7)
with ot= 0.057 + 0.4775 sin 6 for Fr > 19.1 Fr
<*= 0.082 for Fr < 19.1,
and fitti = 0.354, and 84 = 1
224

IChemE SYMPOSIUM SERIES No. 102
Fr is the local densimetric Froude number which explicitly includes the effect of local density.
5.3 Experimental Flare Data
The flares from three trials have been the subject of an initial study. The flares selected, on the basis of the most complete data set, were the 5 tonne tests at initial fill levels of 20, 60 and 80%. From each of these data sets a single three minute period was chosen during the first vent opening. These periods are noted in Table 6 along with relevant outlet data for flow from the PRV.
Details of the still photography obtained during each trial are also given in Table 6. Unfortunately only one camera was operational for the 20% trial and no upwind view was obtained. The angle between each camera and the flare given in Table 6 was obtained from a knowledge of the camera position and a three minute average wind direction together with the assumption that the flare instantaneously lines up with the wind.
Still photography was processed as 7" x 5" prints. Since the framing rate for each trial was 12 per minute each camera produced 36 frames and hence a total of 180 prints were examined.
A grid was laid over each print and a series of measurements made to allow the determination of release dimensions and trajectory at various downwind distances and heights above the stack. Such measurements were then used in conjunction with wind direction data, camera positions, lens focal lengths and considerations of simple co-ordinate geometry to define either instantaneous or time averaged flare sizes and positions. Typical examples are shown in Figs 10 and 11. These refer to the 60% fill case and show crosswind and upwind views of respectively the 3 minute average of flare extent and the maximum extent of the burning region over a 3 minute period. In the averaged case a best fit contour has been drawn by eye.
5.4 Model Comparisons
With flare photographic data reduced to a form represented by Figs 10 and 11, it is possible to easily perform several types of analysis. Thus the dependence of maximum plume height and length on windspeed or mass efflux can be investigated and the adequacey of plume/jet models in representing the extent of the burning region can be assessed. An analysis of the latter type has been used here as an example. The results of this comparison are shown in Figs 10, 12 and 13. The numbers appearing next to the asymptotic model trajectories in these figures refer to volume concentration predictions.
The two models described in Sections 5.1 and 5.2 have been applied to the three minute periods during the 20, 60 and 80% fill 5 tonne trials for which data were examined. Parameterising each release in terms of the relevant length scales defined by (5' suggest that the 20% case behaves as a vertical jet while the 60 and 80% releases underwent a rapid transition to a 'bent-over' jet.
On this basis the trajectory and centre line dilutions have been computed and are given in Figs 10, 12 and 13. No entrainment assumption was used with this model so that the width of the flare is not given. Similarly predictions of plume trajectory, and extent as calculated using the
225

IChemE SYMPOSIUM SERIES No. 102
integral model are also given in Figs 10, 12 and 13. The concentration contour used for comparison in this case is the LFL level of propane of 2.5%.
5.5 Assessment of Results
For the two trials during which both cameras were operational, the data derived from the two orthogonal and simultaneous views of the flare were subject to several consistency checks. Thus the instantaneous plume height and width as seen by the two cameras were generally in close agreement as was their response to changes in windspeed and direction.
The influence of averaging time in defining the flare extent and shape has also been investigated. A comparison of Figs 10 and 11 illustrate the highly intermittent nature of the flare. However, in general increasing the average time above 1 minute had little affect on the definition, shape and extent of the flare, but reduced the uncertainty in fixing the boundary of the burning region. Here a 3 minute averaging time was chosen as providing an adequate flare definition using a manageable number of frames.
Using the 3 minute averaged flare profiles as a basis for model comparisons, several deductions can be made regarding their performance. The simple asymptotic model appears to underpredict the extent of the burning region in all cases, while in only one trial is the trajectory in good agreement. This is the 20% initial fill case with a low ambient wind speed ~1.3m/s. In all cases this model underestimates the length of the burning region.
Similar deductions can be made from a comparison of the integral model predictions and flare data. In this case flare lengths show adequate agreement with time-averaged values. However, the predicted trajectories appear strongly influenced by the crossflow and in consequence are 'bent-over1 to an extent not observed in the trials. Also the predicted radii of the flares are much smaller than those observed.
One possible explanation for the strong influence of the crosswind lies in the neglect by the models of any additional buoyancy due to the release of heat of combustion during burning. Related thermal expansion effects may also account for the much greater widths of the observed flare radii. Thus some scope exists for improving the simple asymptotic predictions by including in the initial buoyancy flux a correction to allow for combustion effects. These influences can also be incorporated in integral models through additional terms in the equation for conservation of energy.
6. CONCmSIONS
1) Data relating to the performance of pressure relief valves, sized and fitted to LPG tanks in accordance with current practices, obtained during the time that the tanks were subjected to pool fire engulfment indicate that some degree of two-phase flow or droplet carry over occurred when the initial level of fill was greater than 50%, in the case of the 5 tonne tank and less for tanks of smaller capacity.
2) Vent sizing on the basis of all vapour flow, whilst physically unrealistic, did not in these tests result in overpressures leading directly to vessel failure.
226

IChemE SYMPOSIUM SERIES No. 102
The extent of the burning regions and the flare trajectories from the vent systems, when compared with predictions from two non-ignited plume/jet models show that the models are deficient in several respects; in particular the predicted flare radii and trajectories are in poor agreement with observations.
7. NOMENCLATURE
SYMBOL
B h U c m cD A P T R Z V M MA z _1 Z
D C G U' N g'
MEANING
specific buoyancy flux enthalpy velocity sound speed density mass flow rate discharge coefficient area pressure temperature gas constant compressibility Factor specific Heat Ratio specific momentum flux Mach number length scale length scale height of plume/jet centre line above stack exit jet exit diameter concentration plume/jet inclination atmospheric turbulence vel. exit pressure ratio effective gravitational ace.
UNITS
m4/s3 JAg m/s m/s kg/m3
kg/s
m2 bar °K J/kg-mole/°K
mVs
m m
m m
deg m/s
m/s2
SUFFIX
stagnation throat plane exit plane buoyancy related quantity momentum related quantity source quantity centre line quantity jet
227

IChemE SYMPOSIUM SERIES No. 102
8. REFERENCES
(1) API 521 "Guide for pressure-relieving and depressurising systems", API Washington, Sept 1982.
(2) J E Huff "Multiphase flashing flow in pressure relief systems". Loss Prevention Symp. AIChE, Houston, March 1985.
(3) R E Henry and H K Fauske "The two-phase critical flow of one-component mixtures in nozzles, orifices and short tubes". J. Ht. Transfer. 1971. Vol, 93, No 2.
(4) S F Jagger and J N Edmondson "Discharge of dense gases from relief valves", I.Chem.E. Symp. Ser. 85. Chester 1985.
(5) S F Jagger. To be published.
(6) B C R Ewan and K Moodie "Structure and velocity measurements in under-expanded jets". Combust. Sci. and Tech. Vol. 45 pp 275-288, 1986.
(7) B C R Ewan and K Moodie "A velocity decay scheme for under-expanded jets from vented vessels. 5th Int. Loss Prev. Symp., Cannes, Sept 1986.
(8) J C Leung "Simplified Vent sizing equations for emergency relief requirements in reactors and storage vessels", AIChE Vol 32, No. 10, Oct 1986.
(9) D W Sallet "Pressure relief valve sizing for vessels containing compressed liquefied gases", I.Mech.E., C274/79, 1979.
(10) D W Sallet and G W Somers "Flow capacity and response of safety relief valves to saturated water flow, "Loss Prevention Symp. AIChE, Houston, March 1985.
(11) K Moodie et al "Fire engulfment tests on a 5 tonne LPG tank", Major Hazards - Pressurised liquefied Gases symp., New Brunswick, Canada, Aug 1987.
(12) G B Wallis "One-dimensional two-phase flow". MoGraw Hill. 1969.
(13) D Chisholm et al "Two-phase venting system - literature review". RTFS DR52, AERE Harwell 1981.
(14) S D Morris "Pressure relief valves and related aspects of venting". Yard Report No. 3308, HSE-RLSD 1987.
(15) M Akhter "PIPE2 User's Manual", HTFS AERE Harwell, Sept 1981.
(16) K Moodie et al "The fire engulfment of LPG storage tanks", IChemE Symp. UMIST April 1985.
(17) H S Forrest "Emergency relief vent sizing for fire exposure", Loss Prevention Symp. AIChE. Houston, March 1985.
228

IChemE SYMPOSIUM SERIES No. 102
(18) J Vilain VKI Lecture Series 1986-03 "Two Phase Plows in Major Technological Hazards", March 1986.
(19) G Ooms et al "The plume path of vent gases heavier-than-air", 1st Int Symp. on Loss Prevention and Safety Promotion in the Proc. Ind., The Hague 1974.
(20) A Badr and D Grand. "Development of an integral model of a radioactive jet," European Appl. Res. Nucl. Sci Tech. j>_(i) 1 1983.
ACKNOWLEDGEMENTS
The authors wish to thank the Director, Research and Laboratory Services Division of the Health and Safety Executive for permission to publish, and also Shell Research Ltd who assisted with the experimental work on which the paper is based.
(c) Crown Copyright
229

IChemE SYMPOSIUM SERIES No. 102
! 1/4 ! ! !tonne! 1 tonne 5 tonne
Percentage fill (nominal) | 40% | 80% | 40% j 20% 1 80% | 60% { 40% j 20%
Tank total surface area(m2)|3.8 | 10.4! 10.4| 10.4J27.7 J27.7 !27.7 |27.7
Wetted surface area (m2) il.68 \ 6.28J 4.32! 3.02il8.1 |l5.2 ill.3 j 8.7
Initial vol. of propane (1)!185 | 1635! 789', 308! 75701 5900! 3676] 2250
Initial depth of liquid (m)!0.22 | 0.68[ 0.35', 0.18! 1.16! -954! .66! .474
Ambient temperature (°C) !5 ! 14.0! -3 | -3 ! 5 3 j 1.5 | 6
Initial tank pressure (bar) [5.5 ', 6.1! 4.1J 4.1", 5.4 | 5 | 4.5 | 5.7
Initial propane mass (kg) j 100 ! 870 ', 420 j 160 \ 3860! 3109! 1930 J 1170
Average wind speed (m/s) | - \ - j - \ - \ 5 !4.5!3.0!1.3
TABLE 1 : - Test cond i t ions , a l l tank s i ze s
!Percentage fill (nominal)
1 Initial mass flow rates (kg/s)
1 Average mass flow rates (kg/s)
!Choked mass flow rate (kg/s)
JPRV vapour pressure (bar)
iPRV (bulk) vapour temperature (°C)
1/4 tonne
40%
.52
.7
17.0
179
1 tonne J
80% 1 40%
2.1 ! 1.35
1.01! .74
1.04! .88
15.2 ! 13.8
121 ! 187
20%
1.54 j
.79 !
.97 1
17.1 !
293 J
TABLE 2 : - Average discharge r a t e s
230
martin
Note
This table (Table 1) was subsequently corrected to the version which appears in the Errata document (no 23) at the end of this document collection.
IChemE SYMPOSIUM SERIES No. 102
Percentage fill
Av. heat flux into propane before PEV opens (kW/m2)
Av. heat flux into tank wall before venting (kW/m2)
Av. heat flux into propane during venting (kW/m2)
Av. heat flux from the fire to water calorimeter (kW/m2)
Av. boil-off rates (kg/s)
1/4 tonne
40%
73
14
85
-
1
80%
84
5
50
tonne
40%!20%
59| 33
4| 12
54| 76
80%
70
9
73
5 tonne
60% j 40%!20%
88! 82! 63
6! 7! 9
82!100! 69
-! 98! 75
2.912.3J2.4
TABLE 3 : - Average measured heat f luxes
! Percentage Fill
! Time period (minutes)
[ Av. Vessel Temperature Ts (°C)
! Av. Vessel Pressure Ps (Bar)
! Av.Mass flow rate (all vapour) (kg/s)
! Av. Weight loss (kg/s)
! Av. Inlet quality
! Av. Void fraction
1 Av. Slip ratio (velocity)
5 tonne
80%
9.5-12.5
159
13.4
2.6
3.4
.46
.75
4.1
60%
8.5-11.5
237
13.4
2.4
3.3
.41
.72
3.9
TABLE 4 : - I n l e t condi t ions for two-phase flow c a l c u l a t i o n s
231
martin
Note
This table (Table 3) was subsequently corrected to the version which appears in the Errata document (no 23) at the end of this document collection.
IChemE SYMPOSIUM SERIES No. 102
Flow Type
Vertical jet
Bent over jet
Vertical plume
Bent over plume
Validity
'z«zm
7 » z m
Z«Zg
Z»ZB
" ' - " I • - I I
"M/U Vzm j V*B ^f'
~W z " JAltVzm)'5 ! |c!(Wz")
~ ( W z ) 2 !A2(x/zm)1/3i ic2(zm/z")2
~(zB/i)l/3! !A3(VzB)3/4lc3(ZB/i-j'5 .
! - ! ! ( W Z B ) 2
-(ZB/T)5! j !A4(VzB)2/3!C4(zB/i')2 -
! - ; ( W Z B ) 2
TABLE 5:- Asymptotic formulae
Initial Fill Level (%)
Camera
Focal length(mm)
Distance from flare stack (m)
Angle to flare (deg)
Time period examined (min)
Av. mass flow rate (kg/s)
Mach No
20
1
104.2
96.6
86.0
2
123
7.5 - 10.5
1.5
o.: 1
60
1
87.5
96.6
67.5
2
86.6
123
164.5
8.5 - 11.5
3.3
0.35
80
1
100.0
96.6
181.0
2
101.3
123
82.0
9.5 - 12.5
3.4
0 35
TABLE 6:- Details of Flare Photography
232

IChemE SYMPOSIUM SERIES No. 102
233

IChemE SYMPOSIUM SERIES No. 102
234

ChemE SYMPOSIUM SERIES No. 102
235

IChemE SYMPOSIUM SERIES No. 102
236

IChemE SYMPOSIUM SERIES No. 102
237

IChemE SYMPOSIUM SERIES No. 102
238

IChemE SYMPOSIUM SERIES No. 102
239

IChemE SYMPOSIUM SERIES No. 102
c
C 0)
> CO
i l
jaqiunu qoe|/\|
240

IChemE SYMPOSIUM SERIES No. 102
E
11'1
jaqwnu qoe(A|
241

IChemE SYMPOSIUM SERIES No. 102
242

IChemE SYMPOSIUM SERIES No. 102
243

IChemE SYMPOSIUM SERIES No. 102
CROSSWINDVIEW
ASYMPTOTIC MODEL
/
INTEGRAL MODEL
1 2 3 4 5 6 7 8 9
Downwind distance : m
Fig. 12 - 12th Sept 1986 - 3 minute average flare extent
10

IChemE SYMPOSIUM SERIES No. 102
245


