
FLOSS Fluoride in Schoolchildren Study: A Pilot Study
82
FLOSS Fluoride in Schoolchildren Study: A Pilot Study Caitlin Rose Davenport A thesis submitted in partial fulfilment of the requirements for the degree of Master of Dietetics At the University of Otago, Dunedin, New Zealand June 2017
Transcript of FLOSS Fluoride in Schoolchildren Study: A Pilot Study

FLOSS
Fluoride in Schoolchildren Study: A Pilot Study
Caitlin Rose Davenport
A thesis submitted in partial fulfilment of the requirements for the degree of
Master of Dietetics
At the University of Otago, Dunedin, New Zealand
June 2017

ii
Abstract
Background: Fluoride plays an essential role in maintaining good dental health,
especially during childhood when permanent teeth are forming. Fluoride helps prevent
tooth decay by promoting tooth remineralisation and preventing tooth demineralisation.
There are no data on the actual intakes of fluoride in New Zealand children 5 years or
older.
Objective: To trial the feasibility of measuring actual fluoride intakes of 9-10-year-old
New Zealand children living in the fluoridated and non-fluoridated cities of Dunedin
and Timaru, respectively.
Design: This study aimed to recruit 10 children from each city. Dietary fluoride intake
was measured by 24-hour diet records and duplicate diets. Expectorated toothpaste and
saliva samples were used to measure fluoride from toothpaste ingestion. Twenty-four-
hour urine samples were collected to analyse urinary fluoride excretion.
Results: The mean (SD) total daily fluoride intake of Dunedin (n=10) and Timaru
(n=10) children was 1.7 (0.6) mg/day and 1.2 (0.6) mg/day, respectively, with 1.0 (0.4)
mg/day and 1.0 (0.5) mg/day contributed from toothpaste; the AI for fluoride is
2mg/day. Fractional urinary fluoride excretion for Dunedin and Timaru children was
23% and 21%, respectively.
Conclusion: Diet records, expectorated toothpaste and saliva, and 24-hour urine
samples are feasible methods to determine the daily fluoride intakes of 9-10-year-old
children. Toothpaste was the primary source of fluoride for children in both cities and
fluoridated water was an important source of fluoride for Dunedin children.

iii
Preface
The research project undertaken in this thesis was conceived by the candidate’s
supervisor, Associate Professor Sheila Skeaff who was responsible for submitting the
research proposal, applying for funding, and obtaining ethical approval.
The Fluoride in Schoolchildren Study (FLOSS) was managed by Masters of Dietetic
two candidates, both from the Department of Human Nutrition. Responsibility for
every aspect of the study was shared between the candidates, as listed below.
• Contributed to the pilot study design.
• Assisted with the ethical application including drafts of Information for
Participants and Consent Forms.
• Developed an information pamphlet for children.
• Sourced and placed orders for equipment required for the study.
• Recruited participants i.e. contacting primary schools and university
departments via email, and parents via word of mouth and Facebook, and
corresponded with participants to arrange visiting times.
• Made up study packs for participants including kitchen scales, 4L plastic
bucket, 2L screw-top bottle, funnel, bowl, small pink urine pottles, diet record
and bin liner.
• Developed FLOSS baseline and follow-up survey Survey Monkey and
contributed to the cleaning of data set from Survey Monkey.
• Provided verbal and written instructions to parents and children on how to
complete sample collection.

iv
• Contacted Roncalli College in Timaru to gain permission to access the school
kitchen for use during the time in Timaru.
• Processed samples i.e. weighing samples, blending food, taking aliquots and
freezing samples at -20°C until analysis.
• Sourced fluoride food and beverage data from the 2016 Total Diet Study New
Zealand.
• Entered fluoride data for 75 foods into the nutrient lines of Kaiculator.
• Entered 15 diet records into Kaiculator and followed up on missing data from
caregivers.
• Completed sample analysis (urine and toothpaste) with assistance from
Michelle Harper (Human Nutrition) and Pauline Bandeen (Chemistry).
Associate Professor Skeaff proofread and provided feedback on the candidate’s written
work.

v
Acknowledgements
I would like to thank Associate Professor Sheila Skeaff for your support, expertise and
calming words. Your guidance through this process has been hugely appreciated and it
has been a privilege to work with you.
Chontelle Watts, I could not have asked for a better person to do this with. I
have been very thankful to have someone to laugh, blend and share ideas with. I wish
you all the best for your future and hope we remain friends for a long time!
Liz Fleming, thank you for the time and effort you put into our project and for
teaching us the do’s and don’ts of Kaiculator.
Thank you, Michelle, Pauline and Ash, for assisting us in the lab. A special
thank you to Michelle for receiving and storing our samples that we sent from Timaru
and for solving any issues we had with our results.
Kieran Columb, thank you for helping us find the equipment we needed for
our project (and for keeping those old blenders!).
Frances Moseley, thank you for making equipment/voucher ordering so easy
for us.
To Chris Comeau, Rose Struthers and Roncalli Staff Members for allowing us
to access to Roncalli school kitchen during our time in Timaru. It was nice to spend
time in such a familiar setting and was the perfect place to blend our food samples.
MDiet 2016/17 class thank you so much for the time we have spent together. I am
so grateful to have such a great group of people to share this experience with and know
I have made some lifelong friends. I wish you all the best of luck for the future.
Finally, thank you to my family and Ben. Your ongoing support, love and
belief in my abilities mean a lot.

vi
Table of Contents
ABSTRACT............................................................................................................................II
PREFACE..............................................................................................................................III
ACKNOWLEDGEMENTS.........................................................................................................V
TABLEOFCONTENTS...........................................................................................................VI
LISTOFTABLES..................................................................................................................VIII
LISTOFFIGURES..................................................................................................................IX
LISTOFABBREVIATIONS.......................................................................................................X
1 INTRODUCTION............................................................................................................1
2 LITERATUREREVIEW....................................................................................................3
2.1 FLUORIDEBACKGROUND..................................................................................................4
2.2 NEWZEALAND’SFLUORIDEINTAKE.....................................................................................9
2.3 GLOBALFLUORIDESTATUS/HISTORY................................................................................11
2.4 ASSESSMENTOFFLUORIDESTATUSINHUMANS.................................................................17
3 OBJECTIVESTATEMENT..............................................................................................22
4 METHODS..................................................................................................................23
4.1 OUTLINEOFSTUDYDESIGN.............................................................................................23
4.2 PARTICIPANTSANDRECRUITMENT....................................................................................23
4.3 DATACOLLECTION.........................................................................................................24
4.4 SAMPLEPREPARATIONANDANALYSIS...............................................................................27
5 RESULTS.....................................................................................................................30
6 DISCUSSION...............................................................................................................37

vii
6.1 FLUORIDESTATUSOF9-10-YEAR-OLDCHILDRENINDUNEDINANDTIMARU............................37
6.2 FEASIBILITY&RECOMMENDATIONSFORFUTURERESEARCH.................................................41
6.3 STRENGTHSANDLIMITATIONS.........................................................................................42
6.4 CONCLUSION................................................................................................................43
7 APPLICATIONOFRESEARCHTODIETETICPRACTICE....................................................44
APPENDICES.......................................................................................................................46
APPENDIXA.ETHICALAPPROVAL..................................................................................................46
APPENDIXB.INFORMATIONPACKANDCONSENTFORM(CHILD)........................................................48
APPENDIXC.INFORMATIONPACKANDCONSENTFORM(PARENT).....................................................50
APPENDIXD.SURVEYMONKEYQUESTIONNAIRES(BASELINEANDFOLLOW-UP)....................................56
APPENDIXE.24-HOURDIETRECORD............................................................................................60
APPENDIXF.KAICULATORASSUMPTIONS........................................................................................67
8 REFERENCES...............................................................................................................69

viii
List of Tables
TABLE1KEYWORDSUSEDINLITERATURESEARCH........................................................................3
TABLE2NUTRIENTREFERENCEVALUESNUTRIENTREFERENCEVALUESFORFLUORIDE:CHILDRENAND
ADOLESCENTS..............................................................................................................9
TABLE3STUDIESINVESTIGATINGSOURCESAND/ORLEVELSOFFLUORIDEINTAKEINCHILDREN............12
TABLE4SUMMARYOFSOCIO-DEMOGRAPHICCHARACTERISTICSOFPARTICIPANTS............................31
TABLE5MEAN(SD)ENERGY,PROTEINANDCALCIUMINTAKEINDUNEDINANDTIMARU..................32
TABLE6MEAN(SD)FLUORIDEINTAKEFROMDIETANDTOOTHPASTE............................................33
TABLE7MEAN(SD)URINARYFLUORIDEEXCRETIONINDUNEDINANDTIMARU...............................35

ix
List of Figures
FIGURE1CONTRIBUTIONOFFOODGROUPSTODIETARYFLUORIDEINTAKE.....................................33

x
List of Abbreviations
AI Adequate Intake
bw body weight
CWF community water fluoridation
DUFE daily urinary fluoride excretion
EAR Estimated Average Requirement
FUFE fractional urinary fluoride excretion
kg kilogram
kJ kilojoules
L litres
m metres
µg micrograms
mg milligrams
mL millilitres
mm millimetres
NRV Nutrient Reference Value
ppm parts per million
RDI Recommended Dietary Intake
SD standard deviation
TDFI total daily fluoride intake
TISAB total ionic adjustment buffer
WHO World Health Organisation

1
1 Introduction
Fluoride is a trace element occurring naturally in soil, water, and most foods at low levels
(1). Inorganic sources of fluoride include fluoridated toothpaste, community water
fluoridation (CWF) and fluoride tablets (1). Fluoride is involved in the mineralisation of
teeth and protects teeth from dental caries by inhibiting bacterial growth, preventing surface
demineralisation and promoting enamel remineralisation (2). Until recently, many countries
did not recognise fluoride as an essential nutrient because deficiency does not cause life-
threatening disease (3). However, low fluoride intake may result in suboptimal dental health
(4).
Dental caries is among the most prevalent diseases in New Zealand and is the most
common childhood disease worldwide (5). As a prevention strategy, the New Zealand
Ministry of Health strongly recommends community water fluoridation at levels of 0.7-
1.0ppm (6). However, CWF is currently at the discretion of district councils, thus some
areas of New Zealand have fluoridated water (52%) and others have non-fluoridated water
(48%) (6). Alongside fluoridated water, dentifrice is a primary source of fluoride (7, 8),
especially in children who tend to ingest more than adults. Other sources of fluoride
include diet, particularly bread (4, 9) and rice, pasta and vegetables cooked with
fluoridated water (9), and fluoride tablets (10). As is becoming more common, fluoride
intakes of those living in non-fluoridated and fluoridated areas may not differ significantly

2
because food and beverages produced in fluoridated areas may be transported to non-
fluoridated areas, and vice-versa (11, 12).
Much of the research conducted on fluoride focuses on its effect on dental health, hence
there is less data surrounding the intake of fluoride. The majority of fluoride intake data
that is available is conducted internationally, meaning it may not be applicable to the New
Zealand population. The most recent data available on fluoride intake in New Zealand has
been estimated from the New Zealand Total Diet Study, and is not actual intake; the study
reported that fluoride intake for the majority of the population, except 6-12month-old
infants, was below the level of Adequate Intake (AI) regardless of whether they had access
to fluoridated water or not (4). The current fluoride intake of New Zealand children is
unknown.
This pilot study aims to trial the feasibility of measuring actual fluoride intakes of New
Zealand children living in fluoridated and non-fluoridated areas of the South Island by
assessing:
• The methods used to determine the contribution of the diet to total fluoride intakes;
• The methods used to determine the contribution of fluoride from toothpaste
inadvertently swallowed.

3
2 Literature Review
A literature review was conducted to gather and review the existing information on the role
of fluoride in dental health, fluoride sources and intake, and the methods used to analyse
fluoride intake. To find key papers, several search engines and keywords were used.
Medline and Scopus search engines were accessed through the Otago University Library
website. Google Scholar was also used to provide a more general search. Further papers
were found by looking at the reference list of papers that had already been accessed.
Table 1 Keywords used in literature search
Fluoride
Children
Intake
New Zealand
Dental caries
Fluorosis
Metabolism
Sources

4
2.1 Fluoride Background
2.1.1 Fluoride Metabolism
Fluoride is the ionic form of fluorine (13). Gastric absorption of fluoride is pH dependent
but absorption in the small intestine is not (14). The presence of large quantities of
calcium, magnesium or aluminium can result in the formation of fluoride compounds,
preventing it from being fully absorbed due to low solubility (1). With low levels of these
dietary components present, almost all soluble fluoride is completely absorbed (1, 14).
Peak plasma concentration of fluoride will occur 20 to 60 minutes post-ingestion (14).
Following absorption, the majority of fluoride is taken up by the bones and teeth, with a
small proportion distributed to soft tissues and bodily fluids (1, 15). Approximately 99% of
absorbed fluoride accumulates in calcified bones, where it forms part of the hydroxyapatite
crystal lattice (1, 2). Fluoride not taken up by the skeleton is primarily filtered by the
kidneys then excreted in urine (16), although a small amount is also lost via faeces and
sweat (3).
2.1.2 Fluoride and Dental Health
Dental caries, more commonly known as tooth decay, is an irreversible disease that is
progressed by a diet high in fermentable carbohydrate (17) and a lack of dental hygiene (5,
18). Dental caries can occur at any age, regardless of demographic variations (5) and is
often first seen as a small, white spot or lesion on the tooth surface, or enamel (2). The
surface of the tooth is coated in enamel which, in mature adults, is mainly made up of non-
stoichiometric hydroxyapatite (calcium phosphate mineral), as well as an organic matrix

5
and water (19). Under the enamel lies calcified tissue called dentine (3, 6), which is more
susceptible to dental caries than enamel (18). Tooth enamel and dentine serve to protect the
core of the tooth (19). Demineralisation of the tooth can occur when plaque builds up on
the tooth surface. The bacteria in the plaque produce acid through anaerobic metabolism of
dietary sugars and starches (20, 21), causing the pH level in the plaque to fall below the
critical level of 5.5 (2, 21, 22). If this acidic environment is maintained, a dental cavity
may form (18, 23). However, demineralisation can be reversed in its early stages via
remineralisation which occurs when calcium and phosphate mineral in saliva, or in
remineralising solutions, is deposited in and on tooth enamel (19, 21) at an oral pH of 5.5
or higher (18). When fluoride is incorporated in the hydroxyapatite being deposited (i.e.
fluorhydroxyapatite), the remineralised enamel is less porous and more resistant to future
plaque damage than the original enamel (5).
Fluoride is an important catalyst in promoting the uptake of calcium and phosphate
mineral into the teeth (21), meaning fluoride plays a crucial role in preventing, and
reversing, dental caries (13). When bacteria build up on the tooth surface, the bacteria
metabolises sugar and starch which produces acid and causes the pH in the plaque to drop
(2). Fluoride can attach to hydrogen in this acid to form hydrogen fluoride which can
rapidly enter the cariogenic bacteria on the tooth surface. Once this occurs, hydrogen
fluoride dissociates and releases the fluoride (2) which disrupts acidogenic bacteria
metabolism by interfering with essential enzyme activity, thereby preventing
demineralisation of enamel crystals and promoting remineralisation (2). In the majority of
people, the cycle between demineralisation and remineralisation occurs several times a
day, eventually leading to either a cavity, remineralised enamel, or maintenance of the

6
current tooth structure (21). Fluoride provides the most benefit to dental health when it is
constantly present at low levels in saliva (1), thus in continuous contact with teeth (24).
Whilst suboptimal fluoride intake may result in dental caries, excessive intake may
also lead to adverse dental health effects in the form of fluorosis. Fluorosis is the only
proven side effect of excessive fluoride intake (18). Dental fluorosis usually presents as a
cosmetic defect rather than a health issue (25) and is caused by consuming high quantities
of fluoride in the first eight years of life when teeth are in the critical stages of
development (3, 25). Fluorosis is a permanent change in the tooth mineralisation, resulting
in a more porous tooth surface and subsurface (25). The majority of fluorosis cases are
mild, have no effect on teeth function, and commonly present as white spots on the tooth
surface, or may cause no visible appearance (26). However, some forms of fluorosis are
more severe and can result in the pitting and staining of teeth (1, 27). A rare form of
fluorosis is skeletal fluorosis, a bone and joint condition that also ranges in severity (27).
This condition may occur from long-term exposure to fluoride either by ingestion or
inhalation and results in a variety of symptoms including bone deformity, bone weakness
and joint stiffness (1, 27). Whilst fluoride generally promotes the strengthening of bones,
in the case of skeletal fluorosis, bone mineralisation appears to be slowed, eventually
resulting in weaker, more porous bones (1). A number of factors influence the amount of
fluoride deposited in the bones including age, kidney function and calcium intake (1).
2.1.3 Sources of Fluoride
The most common sources of fluoride can be arranged into the following three groups;
water, food and other beverages; dentifrice; and fluoride supplements (9). Beverages

7
typically provide the greatest amount of fluoride to the diet, however, this is dependent on
the concentration of fluoride in the water supply (3). Natural water supplies vary in
fluoride content, commonly from 0.1ppm-5ppm (3). Water collected from wells and
boreholes are typically higher in fluoride content than surface waters (3). In some areas of
the world, community water fluoridation (CWF) has been initiated due to the proven
beneficial effects of fluoride on dental health, the concentration of which generally ranges
from 0.7-1.2 ppm (1, 3).
In New Zealand, local councils currently hold the responsibility for deciding whether
or not the community water supply should be fluoridated (28). For those living in
fluoridated areas, the water supplies children with about one-quarter of their average daily
fluoride intake, and it supplies adults with about half of their daily intake. The
concentration of fluoride in drinking water directly influences the fluoride content of any
food or drink made using the fluoridated water (3).
Plant foods generally contain more fluoride than animal foods, with the exception of
ocean fish which contain about 1-3ppm of fluoride (3, 29). The concentration of fluoride in
plant foods depends on the fluoride content of the soil it was grown in (29). Tea leaves,
thus tea drinks, are also a primary source of fluoride in the diet (3) since tea plants have a
high uptake of fluoride and accumulate fluoride in their leaves (29). Previous studies found
that tea brewed in water contain fluoride concentrations of 0.4-3.4ppm (30, 31).
In New Zealand, bread and potatoes, beverages (tea and beer), and fluoridated
toothpaste (4, 32) are the main non-water sources of fluoride. Infant formula is the main
source of fluoride for infants (33).

8
Fluoride-containing dentifrice includes toothpaste and mouth rinses. Almost all
toothpaste contains fluoride at concentrations of 1000-1500ppm (29), with the minority
containing lesser amounts designed for children who inadvertently swallow more
toothpaste. (4, 33, 34). In non-fluoridated areas of New Zealand, toothpaste intake is the
main source of fluoride (32). Fluoride tablets containing approximately 0.5mg of fluoride
(35) may be available to children living in low-fluoride areas to promote good dental
health but are generally not recommended for population treatment in New Zealand (3, 6).
2.1.4 Nutrient Reference Values for New Zealand and Australia
The Ministry of Health recommends CWF at a level of 0.7-1.0ppm in order to provide
optimal dental benefits (5). The Adequate Intake (AI) for fluoride varies based on life stage
and gender and is adjusted as necessary with the goal of preventing dental caries (15). The
reference values for children aged 0-8-years-old have recently been reviewed since dietary
estimates of fluoride intake for this age group often exceed the Upper Limit of Intake (UL)
but without any evidence of widespread moderate or severe dental fluorosis (36). Such
findings indicated that the adequate and upper limits of intake for fluoride needed to be
reviewed. The AI for 1-3-year-olds decreased from 0.7mg/day in 2006 to 0.6mg/day in
2017 and for 4-8-year-olds, the AI increased from 1.0 mg/day to 1.1 mg/day. The upper
limit of intake for 1-8-year-olds doubled from 0.1mg/kg body weight/day in 2006 to
0.2mg/kg body weight/day in 2017 (36).

9
Table 2 Nutrient Reference Values Nutrient Reference Values for Fluoride: Children and Adolescents
Age Adequate level of intake (mg/day)
Upper limit of intake (mg/day)
0-6 months - 1.2
7-12 months 0.5 1.8
1-3 years 0.6 2.4
4-8 years 1.1 4.4
9-13 years 2.0 10.0
14-18 years 3.0 10.0
a New Zealand Nutrient Reference Values for Children and Adolescents (37)
2.2 New Zealand’s Fluoride Intake
In New Zealand, dental caries continues to be one of the most prevalent chronic diseases
affecting the population at all ages, despite the oral health of the nation improving over
several decades (6). The prevalence of dental caries in New Zealand is higher in areas
without fluoridated water than in areas with fluoridated water (38, 39). Children in New
Zealand can receive free oral health care from birth until they reach their eighteenth
birthday.
2.2.1 Fluoride Intake in New Zealand (children)
In 1990, a study measuring actual fluoride intakes of 11-13 month infants living in New
Zealand found that infants living in fluoridated areas were consuming an average of
0.263mg of fluoride per day via diet. This was half the recommended level of 0.5 and
0.7mg/day for 7-12months and 1-3-year-olds, respectively. Those living in non-fluoridated

10
areas had a mean dietary fluoride intake of 0.082mg of fluoride per day which was 16%
and 12% of the acceptable intake (33). When intake of fluoridated toothpaste and tablets
were included, fluoride intake increased to 0.305mg/day and 0.195mg/day for those living
in fluoridated and non-fluoridated areas, respectively. (33).
In 1996, Chowdhury et al (32) examined the fluoride content of 3- and 4-year-old
children’s diets and found the contribution of toothpaste and diet to average daily fluoride
intake was variable. Those living in non-fluoridated areas had a mean fluoride intake of
0.15mg/day which was significantly lower than those living in fluoridated areas, who had
an average intake of 0.36mg/day (32). The results suggest that on average, 3-year-old
children living in fluoridated areas met their recommended level of intake but 4-year-olds
did not (15). On average, children living in non-fluoridated areas did not meet the
recommended level of fluoride intake for their age group (15). For those living in non-
fluoridated areas, the contribution of toothpaste and diet to average daily fluoride intake
decreased significantly as age increased (32) which was likely due to decreased fluoride
intake from ingested toothpaste, as the child grew older and swallowed less toothpaste
during brushing. This decrease in toothpaste consumed impacted significantly on daily
fluoride intake because toothpaste were the primary source of fluoride in non-fluoridated
areas (32).
More recently, Cressey et al (4) conducted a study in which the mean daily fluoride
intake of different age groups was estimated by assessing dietary information collected
from several New Zealand nutrition and diet surveys. Information on the rates of
toothpaste intake for children was not available so values were assumed, as was the
number of times children brushed their teeth per day. They found that the estimated

11
average daily fluoride intake in all age groups, except infants aged 6-12 months, was below
the Adequate Intake (AI). Fluoride intake was markedly higher in areas with fluoridated
water supplies, although this was not significantly different to intakes from non-fluoridated
areas.
2.3 Global Fluoride Status/History
As shown in Table 3, children living in an area without naturally high or artificially
fluoridated water are less likely to be meeting the recommended level of fluoride intake (4,
7, 9, 32, 33, 40-43). Many children who live in areas with artificially fluoridated water also
do not meet the optimal range for fluoride intake (4, 7, 9, 32, 33, 40). Fluoride tablets used
to be a popular way to increase fluoride intake in areas without CWF (10), however, there
is concern over children exceeding the UL of fluoride intake if they are already consuming
optimally fluoridated water and toothpaste (1). A number of places worldwide, including
New Zealand, have implemented CWF as another method of increasing population fluoride
intake to meet the optimum range of 0.05-0.07mg fluoride/kg body weight/day.
Approximately 380 million (5.7%) people worldwide have access to CWF (44), including
approximately 211 million Americans (45) and 12 million Western Europeans (46). Some
countries, such as Brazil and Iran (40, 43), have regions where fluoride is found naturally
in water at high enough concentrations to be a primary source of fluoride. In many areas of
the world, CWF is unavailable due to political or climatic reasons, so other approaches to
community fluoridation have been proposed, such as salt and milk fluoridation (40).

12
Table 3 Studies investigating sources and/or levels of fluoride intake in children
Author (year)
Country
Age (years) Methods used to estimate TDFI (total daily fluoride intake)
Intake levels (daily average) Sources of fluoride
Chowdhury et al. (1990)
New
Zealand
11-13 months
n = 60
F vs NF areas Diet: Duplicate diet and breast milk samples were collected. Analysis: F content was measure using an F-specific electrode.
F areas: 0.130-0.679mg F/kg body weight via dietê NF areas: 0.036-0.281mg F/kg body weightê High F sources (tea and soy milk infant formula) or introducing F toothpaste and tablets increased intake to near the ‘optimal’ level for F.
Dietary sources containing high F include soy milk infant formula and tea. Non-dietary sources include toothpaste and F tablets.
Chowdhury et al. (1996)
New
Zealand
3 - 4
n = 66
F vs NF areas Diet: x3 24-hour duplicate diets Clinical: Expectorated toothpaste Analysis: Ion specific electrode. F content of the diet was calculated by multiplying dietary F content (mg F/kg of food) by the amount of food eaten (kg/day). The amount of ingested F from toothpaste was estimated by subtracting expectorated F from the amount of toothpaste put onto the toothbrush.
F areas: 0.68 ± 0.27mg/day • 3-year-olds• 4-year-oldsêNF areas: 0.49 ± 0.25mg/dayê
F areas: Diet in conjunction with toothpaste NF areas: Toothpaste

13
Author (year)
Country
Age (years) Methods used to estimate TDFI (total daily fluoride intake)
Intake levels (daily average) Sources of fluoride
Cressey et al.
(2010)
New Zealand
All age groups
Diet: Food composition data and simulated diet information from two New Zealand Total Diet Studies, National Nutrition Survey and 2002 National Children’s Nutrition Survey. F area was based on a water concentration of 1.0mg F. NF area was based on a water concentration of 0.1mg F.
All age groups: F intake was below the level of adequate intake. F intake was lower in NF areas than F areas. 7-10-year-old children (based on dietary modelling): F areas: 0.99mg F/dayê NF areas: 0.45mg F/dayê
7-10-year-old children: F areas: Water (41%), bread (7%), tea (5%), carbonated beverages (4%) and fruit drink (4%). NF areas: Bread, water, carbonated beverages and tea
Zohouri et al.
(2006)
United Kingdom
6
n = 33
F vs NF areas were categorised into three groups depending on their home tap water F concentration: • Optimal F (≤0.7ppm) • Sub-optimal F (≥0.3 to ≤O.7ppm) • NF (≤0.3ppm). 3-day diet records and food/beverage samples were collected and analysed.
Optimal F areas: 0.591mg/day (0.027mg/kg body weight/day)ê Sub-optimal F areas: 0.349mg/day (0.016mg/kg body weight/day)ê NF areas: 0.188mg/day (0.008mg/kg body weight/day)ê
Optimal and suboptimal F areas: Beverages made up with F tap water e.g. cordial, food cooked with water i.e. pasta, rice, vegetables. NF areas: Carbonated beverages and bread
Maguire et al.
(2007)
United Kingdom
6 - 7
n = 33
NF areas: 18 Sub-optimally F areas: 9 Optimally F areas: 6
F vs NF schools. Diet: 3-day food diaries, food and drink samples Biochemical: 24-hour urine samples Clinical: Expectorated toothpaste/ saliva Analysis: F content of food and drink was analysed using direct and indirect silicon-facilitated diffusion methods.
Optimally F areas: 0.047 ± 0.008mg/kg body weight/dayê Sub-optimally F areas: 0.038 ± 0.038mg/kg body weight/dayê NF areas: 0.031 ± .025 mg/kg body weight/dayê
F toothpaste is an important contributor to daily fluoride intake in children, especially for those living in NF areas.

14
Author (year)
Country
Age (years) Methods used to estimate TDFI (total daily fluoride intake)
Intake levels (daily average) Sources of fluoride
Omid et al. (2017)
United
Kingdom
4 - 6
n = 61
F area Two meetings, one week apart. Diet: Duplicate diets, 3-day diet records. Clinical: Toothpaste/saliva expectorate. Analysis: Daily F intake was calculated by combining dietary and toothpaste intake. 24-hour urine samples were collected to estimate daily F excretion. Weekly variation in F intake and excretion were assessed.
4-year-olds: 1.062 ± 0.699mg/day (0.057mg/kg body weight/day) 5-year-olds: 1.223 ± 0.827mg/day (0.060mg/kg body weight/day) 6-year-olds: 1.202 ± 0.549mg/day (0.050mg/kg body weight/day) There was no significant weekly variation for F intake and excretion.
Toothpaste is a major source of F for this age group. On average, for 4-, 5- and 6-year-olds, toothpaste provided them with 46%, 45% and 42% of their daily F intake.
Rodrigues et al.
(2009)
Brazil and Peru
4 - 6
n = 21-26 (in each of the
four communities)
Four communities in Brazil and Peru, each with different sources of F. • Bauru, Brazil: artificially F water
(AFW) • Brejo dos Santos: naturally F water
(NFW) • Lima, Peru: F salt (FS) • Trujillo, Peru: F milk (FM) • Control community: NF Diet: x2 duplicate diets Analysis: An ion-selective electrode was used to analyse dietary F content of the diets.
All in mg/kg body weight/day: Bauru, Brazil (AFW): 0.04 ± 0.01ê Brejo dos Santos, Brazil (NFW): 0.06 ± 0.02 Lima, Peru (FS): 0.05 ± 0.02 Trujillo, Peru (FM): 0.06 ± 0.01 Control community (NoF): 0.01ê
Depending on the location, primary sources of F include water, milk and salt.
Kimura et al. (2001)
Japan
1 - 6
n = 29
Diet: x3 24-hour duplicate diets (covering all seasons). The fluoride concentration in tap water was <0.05ppm. Analysis: The diets were homogenised and F content was analysed using an F electrode.
F: 0.28 ± 0.18mg/day with a range of 0.04-1.24mg/dayê No significant variation in F intake between seasons.
Japan does not have a water F program, nor do they use F supplements, which means that food and toothpaste are the main sources of F.

15
Author (year)
Country
Age (years) Methods used to estimate TDFI (total daily fluoride intake)
Intake levels (daily average) Sources of fluoride
Nohno et al. (2006)
Japan
2 - 8
n = 38
Moderately F areas (MFA): 0.555ppm vs low F areas (LFA): 0.040-0.131ppm. Diet: 24-hour duplicate diet
MFA (mg/kg body weight/day): • 2-5-years-old: 0.0252ê • 6-8-years-old: 0.0254ê LFA (mg/kg body weight/day): • 2-5-years-old:0.0126ê • 6-8-years-old 0.0144ê The difference in F intake between the two areas was only significant in 2-5-year-old children.
Some areas of Japan have water that is F naturally to a moderate or low level. Rice that is boiled using naturally F water is an important source of F in these areas.
Haftenberger et al.
(2001) Germany
3 - 6
n = 11
Diet: Duplicate diet Biochemical: 24-hour urine samples Clinical: Toothpaste/saliva expectorate. Analysis: F determined by ionometer coupled to a fluoride-specific electrode
F: 0.931 ± 0.392 mg/day (0.053 ± 0.021 mg/kg body weight/day)
F supplementation (salt and tablets) due to low level of F in water (0.25ppm). % contribution to daily F intake: F tablets: 48.8% Toothpaste: 29.4% Diet: 21.8% (partly due to F salt)
Zohouri et al.
(2000) Iran
4
n = 103
LFA: 0.3-0.35ppm MFA: 0.6ppm HFA (high fluoride area): 4.0ppm Diet: x2 3-day diet records. >117 items of food and drink were collected. Analysis: Food and drink samples: silicon-facilitated diffusion method in un-ashed samples. Diet records: Applied F content of food and drink samples and F data from several food composition tables.
LFA: 0.413 mg/day ê MFA: 0.698 mg/day ê HFA: 3.472 mg/day
Primary sources of F in all areas was water and drinks made with water i.e. tea. White rice and white bread contributed 5-8% dietary F in all areas.

16
Author (year)
Country
Age (years) Methods used to estimate TDFI (total daily fluoride intake)
Intake levels (daily average) Sources of fluoride
Rojas-Sanchez et
al. (1999)
USA, Puerto Rico
16 – 14mo
n = 54
Optimal F area: Indianapolis, Indiana (0.8-1.2ppm) LFA: Connersville, Indiana and San Juan, Puerto Rico (<0.3ppm) Diet: x2-3 duplicate diets Clinical: Expectorated toothpaste/saliva samples Analysis: Hexamethylsiloxane microdiffusion
Indianapolis: 0.965 ± 0.009 mg/day (0.07 ± 0.007 mg F/ kg body weight/day) Connersville: 0.965 ± 0.009 mg/day (0.073 ± 0.007 mg F/kg body weight/day) San Juan: 0.767± 0.0075 mg/day (0.056 ± .0004 mg F/kg body weight/day)
All areas: Toothpaste Indianapolis and Connersville: Water Connersville is surrounded by optimal F areas, which impacted on F intake due to the ‘halo’ effect.
F= fluoride/fluoridated, NF= non-fluoridated ppm= parts per million ê= below optimal level of intake Optimal level of intake based on 0.05-0.07mg F/kg bw/day (36, 47)

17
2.4 Assessment of Fluoride Status in Humans
Fluoride intakes in children have been assessed using a combination of dietary,
biochemical, and clinical assessment methods.
2.4.1 Dietary Assessment
Duplicate Plate Method:
The majority of studies that assessed dietary intake of fluoride in children, did so using the
duplicate plate method, as described by Chowdhury et al (33) because it measures actual
fluoride intake (11, 48). For this method, parents collected duplicates of meals and
beverages consumed over a set period of time, typically 1 to 3 days. This was often
repeated a short time later to account for dietary variations, such as on weekends (48, 49).
The importance of maintaining the child’s usual diet was stressed (32, 50). Parents were
provided with collection containers. Some beverages may have been collected separately,
such as fluoridated water and/or milk samples (40, 42). Parents were asked to wait until the
child had finished eating their meal, then remove any parts of the meal not eaten by the
child from the duplicate meal before putting it in the collection container for storage (32,
51). Commonly removed parts of food included bones, seeds, skin and cores (32). To
assess the fluoride content of meals, the duplicate portions were pooled together, weighed
and homogenised with a known amount of deionised water (32, 48). Aliquots of these
samples were then frozen until fluoride analysis (42, 51). The main limitation of the
duplicate plate method includes the burden of extra cost associated with producing two
meals instead of one, which may result in a reduced response rate or cause individuals to

18
alter their usual dietary habits, resulting in reporting bias (48). If the duplicate plate
method alone is used to assess fluoride intake, it will be impossible to assess the main
sources of fluoride in the diet because the collected food and beverages are homogenised
into one sample to assess fluoride content (48).
Diet Method:
Diet records only provide an estimate of fluoride intake because the data generated by diet
records are usually based on information from food composition tables (7, 48). In New
Zealand, Cressey et al (4) used fluoride values from two New Zealand Total Diet Studies.
It is not uncommon that there is limited data on fluoride (52), thus very few studies have
used the food diary method in isolation to assess dietary fluoride intake in children. In
contrast to the duplicate plate method, food records allow some individual sources of
fluoride in the diet to be identified and are less burdensome for individuals to complete
(48). The majority of studies looking at fluoride intake used diet records in conjunction
with the duplicate plate method to validate the accuracy of the data collected in the diet
record (10, 48). Where scales could not be provided, individuals were asked to estimate the
portions of food eaten using household measures, such as measuring cups and spoons (10,
48).
2.4.2 Toothpaste Analysis
Recent studies (11) have calculated intake of fluoride from toothpaste using a method as
described by Maguire et al (7). This involves asking the children to brush their teeth as
they usually would. The toothbrush is weighed before and after toothpaste is added to it, in

19
order to calculate the amount of toothpaste usually used. Any expectorated saliva and
toothpaste is collected in containers, as is any water used to rinse the toothbrush or mouth.
Any toothpaste left on the face or toothbrush is also collected for analysis using a spatula.
These samples are weighed and homogenised to a slurry before being frozen until fluoride
analysis. The frequency of brushing per day is recorded, as is the brand and concentration
of toothpaste used. Fluoride ingested from toothpaste can be estimated by calculating the
difference between the fluoride content of the toothpaste and water used, and the fluoride
content of expectorated saliva and toothpaste recovered after brushing (10). The fluoride
concentration of expectorated saliva/toothpaste samples is measured using a fluoride
specific electrode (8). Total daily fluoride intake from tooth brushing is calculated by
multiplying fluoride ingested during brushing by the frequency of brushing per day (11).
2.4.3 Biochemical Assessment
Urine as a biomarker for fluoride intake
The collection of urine samples is a non-invasive method that indirectly assesses fluoride
intake (53). The World Health Organisation (WHO) have developed basic methods to
guide the assessment of fluoride intake via urine (54). Twenty-four-hour urine samples are
required since the urinary fluoride concentration fluctuates during the day (55). Often the
first void of the day is not included (53, 54), but every subsequent void for the next twenty-
four hours, including the first void of the next day, is collected and pooled (11, 53). The
total amount of urine is weighed to assess the total daily excretion volume (11) and from
this sample, aliquots are taken and frozen until analysis (53). In children, daily fluoride

20
excretion varies between 30-80% (8, 11). The high variability is most likely due to age,
dietary intake and oral hygiene habits (8). The fluoride concentration of urine is also
influenced by glomerular filtration rate and urinary pH (13). A primary limitation of
collecting 24-hour urine samples from children is the possible lack of compliance (53).
Urine has been used as an indirect measure of individual fluoride intake for many years,
however, the World Health Organisation (54) states that using urinary fluoride excretion to
estimate individual fluoride intake is inappropriate, as there is an absence of standard
correlation between intake and excretion of fluoride. Urine samples are primarily assessed
by using a fluoride specific electrode and potentiometer after the sample has been mixed
with total ionic adjustment buffer (TISAB) I, II or III (8).
Nails as Biomarkers for Fluoride Intake
Several studies have used nails as biomarkers to monitor varying levels of exposure to
fluoride (56-58). In contrast to urine, fingernails represent the average intake of fluoride
over the past three months (59) rather than the fluoride intake over recent days, thus nails
may be a better indicator of chronic individual fluoride intake (53). No guidelines or
reference values have yet been developed for the process of using nails as biomarkers (53).
Nail clippings of at least 1.5mm in length are needed to be able to analyse their fluoride
content (60). Buzalaf et al (53) and Fukushima et al (58) contacted parents two weeks prior
to when the nail samples would be taken and asked them to avoid cutting their child’s nails
for this time to allow for adequate growth. Buzalaf et al (56) compared finger and toenails
and concluded that the big toenail is the most suitable biomarker of fluoride intake due to

21
its faster growth rate and reduced exposure to environmental contaminants. Nails must be
cleaned and unpolished to be used (59).
Conclusion
Fluoride plays an essential role in maintaining good dental health, especially during
childhood. In areas where the water is fluoridated, tap water and toothpaste are the primary
sources of fluoride. In areas without fluoridated water, diet and toothpaste are the primary
sources of fluoride. Usually areas without fluoridated water have a lower daily intake of
fluoride, however, this may begin to change due to food and beverage products from
fluoridated areas being sold in non-fluoridated areas and vice versa. Studies conducted in
New Zealand estimated that children living in fluoridated and non-fluoridated areas are not
meeting the AI for fluoride. The most appropriate methods for assessing fluoride intake in
children are 24-hour duplicate diets, diet records and urine samples, although nail sampling
has emerged as being an indicator of long-term fluoride intake.

22
3 Objective Statement
Only two New Zealand studies have directly measured fluoride intake; both were
conducted in the 1990’s, one in infants (33) and the other in 3-4-year-old children(32). In
2010, Cressey et al (4), estimated the fluoride intake for the New Zealand population, at all
ages, by assessing dietary information collected by two New Zealand Total Diet Studies,
the 1997 National Nutrition Survey and the 2002 National Children’s Nutrition Survey.
The estimated fluoride intake for all age groups, except 6-12-month infants, fell below the
AI. Internationally most studies focus on children aged 0-8-years because this is when
permanent teeth are formed, but oral health is important across the lifespan. There are no
published data on actual fluoride intakes in older children and adolescents.
Aim: To trial the feasibility of measuring actual fluoride intakes of 9-10-year-old New
Zealand children living in the fluoridated and non-fluoridated cities of Dunedin and
Timaru, respectively.
In order to obtain this aim, the objectives of this study are to:
i. Assess the methods used to determine the contribution of diet to total fluoride
intakes;
ii. Assess the methods used to determine the contribution of fluoride from toothpaste
inadvertently swallowed.

23
4 Methods
4.1 Outline of Study Design
This pilot study aimed to look at the feasibility of the methods used to determine the
fluoride intake of 9-and-10-year-old children in New Zealand. This research took place in
the cities of Dunedin and Timaru, in the South Island of New Zealand. Dunedin has a
fluoridated water supply whilst Timaru does not. Data collection took place between
March-May 2017. Ethical approval was obtained from the University of Otago Health
Ethics Committee (reference HE17/001) (Appendix A).
4.2 Participants and Recruitment
The inclusion criteria for participation was as follows: healthy children aged 9- and 10-
years-old at the time of the study. Siblings were excluded. Ten children from each area
were recruited into the study for a final sample size of 20 children. In Dunedin, children
were recruited via word of mouth and by advertising on Facebook. In Timaru, children
were recruited via word of mouth and through two local primary schools known to the
candidate. The schools were contacted by email and asked to distribute the study
information pamphlet and letter to children of suitable ages.
Interested children and their parents were each provided with an Information for
Participants form and Consent form (Appendix B and C). Caregivers and children who

24
returned a signed consent form were then contacted by phone or email to arrange a suitable
time for the researchers to visit their home for data collection.
4.3 Data Collection
Eleven children participated in two data collection periods each lasting 24 hours, which
took place 7-21 days apart. Nine children participated in one day of data collection, rather
than two due to time constraints. Data collected during each period included; an
expectorated toothpaste and saliva sample, a 24-hour urine sample, a 24-hour weighed diet
record and a 24-hour duplicate diet. Caregivers were contacted prior to the first visit and
asked to not clip the child’s toenails to allow adequate time for the nails to grow. Toenail
clippings were collected during either the first or second 24-hour period.
The researchers, caregivers and children met on two or four occasions. On the first
occasion, the researchers visited the children’s homes to explain the study and provide
instruction on sample collection. The children completed the online survey (Appendix D)
about their tooth-brushing habits, dental history and socio-demographic characteristics.
This survey was an altered version of the “Questionnaire on the use of fluoride
supplements and toothpaste” for children, created by the World Health Organisation (61).
The child’s weight was measured using a Seca electronic scale and height was measured
using a tape measure and results entered into the survey. Researchers provided caregivers
with all the necessary urine and food sample collection vessels, electronic kitchen scales, a
form for completing the 24-hour diet record, and a booklet with instructions for the
duplicate diet and urine collection. Verbal instructions on how and when to collect samples

25
were given, and the importance of the children following their usual diet and drinking
habits was emphasised. At the end of the visit, children were asked to brush their teeth and
expectorated saliva/toothpaste was collected, described in more detail later. The second
visit took place on the day following the sample collection, when researchers picked up the
first set of completed 24-hour urine sample, diet record, duplicate diet bucket. One set of
toenail clippings from each child were collected by the researchers at the second visit, and
frozen at -20C. The third and fourth visit followed a similar pattern, with a second 24-hour
urine sample, expectorated saliva/toothpaste sample, diet record, and duplicate diet
obtained from each participant collected at the fourth visit. Children were given two movie
tickets and parents were given a $30 supermarket voucher as a token of appreciation. A
follow-up questionnaire was sent out to caregivers following completion of the study to ask
about their experience of the study (Appendix D).
Dietary Assessment
Dietary fluoride intake was determined by the duplicate plate and 24-hour diet record
methods. Caregivers were asked to make duplicate portions of all their child’s food and
drink for 24-hours. The caregiver observed what the child ate and replicated this by
removing and discarding any uneaten parts of the meal from the duplicate portion,
including commonly discarded leftovers such as bones, fruit/vegetable cores and skins. All
duplicate portions of food and drink were placed in a plastic 2L bucket, with a lid, and
caregivers asked to keep the bucket stored in a cool place, such as the refrigerator.

26
Caregivers were also given a diet record form to fill out over the 24-hour time period.
Details about the food or drink including brand, preparation or cooking method, and weight
were noted in the record booklet at the time of consumption. For recipes, all ingredients
were weighed and recorded in total, and once the meal was assembled the caregivers were
asked to weigh the proportion of the recipe eaten by the child.
24-hour urine collection
Children were provided with a 2L screw-top bottle, along with a funnel and bowl to assist
with urine collection. The children collected their urine over the same 24-hour time period
being used to collect weighed diet records and duplicate diets. The time of the first void of
the day was recorded by caregivers and this urine was discarded. All urine for the
remaining 24-hours, including the first void of the following morning, was collected into
the 2L bottles; any missing void was noted.
Expectorated toothpaste and saliva:
At the first visit, the contribution of toothpaste to total daily fluoride intake was estimated
using the method of Maguire et al (7) as follows. The child’s toothbrush was weighed
before and after toothpaste was applied by the child, using a scale (Sartorius type 1475 MP
8-2) and the weight of the toothpaste noted. The fluoride content of the toothpaste was
recorded and it was assumed that the concentration of fluoride in the toothpaste was as
stated on the tube. The child was then asked to brush their teeth as normal, with all
expectorated toothpaste and saliva collected in the pottle, as was any residue on the face. If

27
the child completed two periods of data collection, this process was repeated at the third
visit.
4.4 Sample Preparation and Analysis
The day following data collection, researchers weighed the duplicate diet, subtracting the
weight of the bucket, to determine the weight of food eaten by the child. The food was
homogenised by an industrial-strength Waring blender until smooth. Known amounts of
deionised water used to rinse the bucket of any food residue were added to the blender.
Once homogenised, researchers took 50g and 200 g samples that were frozen at -20°C until
required for analysis. Due to time constraints, the fluoride content of duplicate diet and nail
samples will not be analysed in this study.
Information on the fluoride content of 75 food and beverages was obtained from the
2016 New Zealand Total Diet Study (62). The fluoride content (mg/100g) was entered into
the nutrient lines of Kaiculator, a food analysis programme developed at the University of
Otago. The fluoride values from the 2016 Total Diet Study were mapped to all similar
foods (4). For example, ‘wheatmeal bread’ fluoride values were mapped to all types of
wheatmeal bread, including bread rolls. Any foods without a fluoride value were assigned
a fluoride value of 0.0001mg/100g. The fluoride concentration of Dunedin water was
0.75ppm, and was 0.12ppm in Timaru (62). Each diet record was entered into Kaiculator
and was analysed for daily fluoride, calcium, energy and protein intake. The food
concentration values in Kaiculator for calcium, energy and protein were sourced from the
New Zealand Food Composition Database (Foodfiles) (63). Energy underreporting was

28
analysed by dividing the reported energy intake by the estimated energy expenditure for 9-
10-year-old boys and girls (64). If the value calculated was less than 0.9 the child was
classified as underreporting (64). If a child underreported during one data collection
period, but not the other, they were not excluded as this may have been due to under-eating
rather than under-reporting. For Dunedin diets, the fluoride found in cooked pasta and rice,
due to high water retention, was accounted for by adding fluoridated water to the recipe
(Appendix F). Several assumptions were made about one participant’s diet record, as
detailed in Appendix F.
At the end of the 24-hour collection, the total volume (weight) of urine was recorded,
and two 10mL aliquots of urine were placed in a test tube and frozen at -20C until analysis.
Completeness of 24-hour urine samples was assessed by comparing them to the lower limit
of 9mL/hour for children >6-years-old (65). Any sample that did not meet this criterion
was excluded from analysis. The fluoride content of the urine was measured by a fluoride
ion specific electrode, after the total ionic adjustment buffer (TISAB) III had been added to
the urine in a 1:1 ratio (66). The fluoride content of the urine samples was calculated using
a standard curve. The fluoride standards used to create the curve ranged from 0.1 –
25µg/mL (66). The standards were made using fluoride standard (1000mg/L) and
deionised water (66). TISAB III was mixed in a 1:1 ratio with the fluoride standard and
deionised water (67).
Expectorated toothpaste/saliva samples were weighed and frozen at -20°C until
required for analysis. Toothpaste samples were diluted to 100mL with deionised water,
then diluted again in a 1:4 ratio with deionised water. The fluoride content of the

29
toothpaste samples was analysed by a fluoride-specific electrode. The fluoride
concentration of the expectorated toothpaste and saliva samples were calculated using a set
of standards to the one mentioned above, based on the matrix of the solutions (i.e. urine
diluted with TISAB and expectorated saliva diluted with deionised water). The fluoride
standards used to create the curve ranged from 0.01-100µg/mL and were made using
fluoride standard (1000mg/L) and deionised water. The amount of fluoride ingested from
toothpaste was determined by subtracting the amount of fluoride found in the expectorated
toothpaste/saliva sample from the total amount of fluoride contained in the toothpaste first
applied to the toothbrush. This value was then multiplied by the number of times a day
children brushed their teeth (as noted in the survey) to determine total daily fluoride intake
from toothpaste.
For diet, toothpaste and urine statistical analysis, values for children who completed
two periods of data collection were averaged before being combined with the values for
children who completed one period of data collection.

30
5 Results
In Dunedin, 10 participants were recruited via word of mouth and the ‘Dunedin Mums’
Facebook page. Five Timaru primary schools were contacted, but only two replied and
were willing to circulate study information to children and parents. In Timaru, 10
participants were recruited via word of mouth and by contacting local primary schools.
As shown in Table 4, the socio-demographic characteristics of the Dunedin and
Timaru participants were similar. The average age of the Dunedin children was 9.5 years
and the average age of the Timaru children was 9.6 years. The body mass index (BMI) of
Dunedin and Timaru children was 18.4 and 16.6 kg/m2, respectively, as Timaru children
had a lower average body weight (33.4kg) than the Dunedin children (37.0kg). Thirteen
(65%) of the participants were male and seven (35%) were female. Of the 20 children who
participated in the study, 11 completed two 24-hour periods of data collection.

31
Table 4 Summary of socio-demographic characteristics of participants
a Area deprivation index as determined by the 2006 Census of Population and Dwellings, supplied by Statistics New Zealand (68)
The mean daily energy intake for Dunedin children was 7418kJ/day, and
7074kJ/day for Timaru children. During the first data collection period, only one child
from Dunedin underreported their energy intake and no children underreported during the
second data collection period. On average, Dunedin children met the estimated average
requirement (EAR) for protein intake and nearly met the EAR for calcium intake. On
average, children from Timaru cities met the EAR for daily protein but not for calcium.
Dunedin Timarun = 10 n = 10
Gender (%)
Male 60 70Female 40 30
Age (years) (%)
9 50 4010 50 60
Ethnicity (%) a
NZ European/Pakeha 70 90Māori 20 0Asian 0 10Other 10 0
Height (m) 1.4 1.4
Weight (kg) 37 33.4
BMI (kg/m 2 ) 18.4 16.6
Deprivation level b 4.6 4.2
Variable

32
Table 5 Mean (SD) energy, protein and calcium intake in Dunedin and Timaru.
a Estimated using weight, height, BMR (Basal Metabolic Rate) and a PAL (Physical Activity Level) of 1.55 (37)
b EAR (37)
Daily average fluoride intake from diet and toothpaste ingestion are shown in Table
6. The mean daily dietary fluoride intake for Dunedin children was 0.7mg/day (0.02mg
F/kg bw/day), while for Timaru children it was 0.2mg/day (0.01 mg F/kg bw/day). As
shown in Figure 1, the primary dietary source of fluoride for Dunedin children was
fluoridated water, which contributed to 75% of dietary fluoride intake. Whilst not
artificially fluoridated, water, followed by breads and cereals, were the primary sources of
dietary fluoride for Timaru children, contributing to 38% and 35% of dietary fluoride
intake, respectively. On average, diet alone contributed to 43% of total daily fluoride
intake (TDFI) in Dunedin, and 18% in Timaru.
Energy (kJ/day) Protein (g/day)Calcium (mg/day)
Dunedin 10 7418 (1136) 69 (25) 865 (400)
Timaru 10 7074 (1646) 63 (16) 704 (289)
NRV
Girls 6475-8870a 24b 800b
Boys 7812-10480a 31b 800b
nCityMean (SD) Daily Energy, Protein and Calcium Intake

33
Table 6 Mean (SD) fluoride intake from diet and toothpaste
a Ministry of Health NRVs for children aged 9-10-years-old (36) b One participant excluded from toothpaste analysis. If outlier included, mean F intake from toothpaste = 1.7 (2.3) mg/day
Figure 1 Contribution of food groups to dietary fluoride intake
Diet Toothpaste Diet + ToothpasteDunedin
mg/day 10 0.705 (0.357) 0.951 (0.414) 1.656 (0.555) 2.0
mg F/kg bw/day 10 0.018 (0.008) 0.038 (0.015) 0.056 (0.015)
Timaru
mg/day 10 0.212 (0.060) 0.987 (0.524)b 1.199 (0.600) 2.0
mg F/kg bw/day 10 0.006 (0.001) 0.030 (0.013) 0.032 (0.018)
City nMean (SD) Daily Fluoride Intake AI
(mg/day)a
0
10
20
30
40
50
60
70
80
90
100
Water Breads&cereals
Fish&seafood
Meat&meat
alternatives
Milk&dairyproducts
Fruit Vegetables Other
Contriibu
tiontodietaryfluo
rideintake(%
)
Foodgroups
Dunedin Timaru

34
Toothpaste ingestion was a major source of fluoride in both Dunedin and Timaru, on
average contributing 1.0 ± 0.4 mg/day (57%) and 1.0 ± 0.5 (82%) to TDFI, respectively.
The mean amount of toothpaste used by Dunedin children each day was 1.5g, while
Timaru children used 1.1g. Children in both Dunedin and Timaru brushed their teeth an
average of two times a day (ranged from 1-3 times per day). No Dunedin children
swallowed their toothpaste after brushing, but in Timaru during the first data collection
period, three children swallowed their toothpaste and during the second data collection
period, two children swallowed their toothpaste (i.e. there was no expectorated toothpaste
and saliva). The average fluoride concentration of toothpaste used by the children was
1000ppm in Dunedin and 1200ppm in Timaru. No children reported using fluoride tablets,
therefore diet and toothpaste were their only sources of fluoride. Toothpaste ingestion data
were excluded for one participant because of an unusually high fluoride intake from
toothpaste (8.12mg/day).
Overall, neither the Dunedin or Timaru children met the AI for fluoride intake.
Dunedin children had average total daily fluoride intake of 1.7 ± 0.6mg (0.06 ± 0.02mg
F/kg bw/day) which is 83% of the fluoride required to meet the AI for daily fluoride intake.
On average, Timaru children had a total daily fluoride intake of 1.2 ± 0.6mg (0.03 ± 0.02
mg F/kg bw/day) which is 65% of the daily fluoride required to meet the AI. No children
exceeded the UL for fluoride intake of 10mg/day.

35
Table 7 Mean (SD) urinary fluoride excretion in Dunedin and Timaru.
a One participant excluded due to an incomplete urine sample b FUFE = (DUFE/TDFI)*100
Data on daily urinary fluoride excretion (DUFE) are presented in Table 7. Data from one
child were excluded due to an incomplete urine sample. Dunedin children had an average
daily urine volume of 0.790L which is lower than that of Timaru children who, on average,
had a daily urine volume of 0.908L. On average, Dunedin children excreted 0.4 ± 0.6 mg
of fluoride per day whilst Timaru children excreted 0.2 ± 0.1 mg of fluoride per day in
their urine. Based on average body weight, mean DUFE was 0.01 ± 0.003 mg F/kg bw/day
in Dunedin children and 0.008 ± 0.004 mg F/kg/bw/day in Timaru children. Both Dunedin
and Timaru children excreted approximately 22% of ingested fluoride in their urine, with
up to 78% of ingested fluoride being retained.
The results from the follow-up survey showed that 12 caregivers found urine
collection to be the easiest aspect of data collection and six found the duplicate diet to be
the most difficult, closely followed by completing the diet record. Five caregivers
Dunedin Timarun=10 n=9a
Mean volume of urine (L/day)
0.790 (0.244) 0.908 (0.430)
DUFE:mg/day 0.378 (0.155) 0.249 (0.123)
mg F/kg bw/day 0.010 (0.003) 0.008 (0.004)
FUFE (%) b 23 21
Mean(SD)DailyUrinaryFluoride

36
responded saying they found no part of the study difficult to complete. Most (87%)
caregivers said they did not change how their child ate during the study, but 7% said they
made meals that were cheaper and 7% said they made meals that were easier to make, thus
easier to write down in the diet record. Children did not drink less to avoid, or reduce urine
collection.

37
6 Discussion
This pilot study demonstrated that it is feasible to conduct a study to assess the fluoride
intake of 9-10-year-old children living in New Zealand. The results of this study also show
that the fluoride intake of children living in both fluoridated and non-fluoridated areas of
New Zealand falls below the Adequate Intake. However, since this is a pilot study and only
20 children participated, some caution is needed when interpreting the results.
6.1 Fluoride Status of 9-10-year-old children in Dunedin and Timaru
The mean total daily fluoride intakes for Dunedin and Timaru was 0.06 ± 0.02mg F/kg
bw/day and 0.03 ± 0.02 mg F/kg bw/day, respectively. These values are similar to those for
6-7-year-old children living fluoridated and non-fluoridated areas of the United Kingdom,
who had intakes of 0.05 ± 0.01 and 0.03 ± 0.03mg F/kg bw/day, respectively (7). The
fluoride intake of Dunedin and Timaru children were higher than the intakes reported for
4-6-year-old children living in artificially (0.6-0.8ppm) and non-fluoridated areas of Brazil
(40), who had fluoride intakes of 0.04 and 0.01 mg F/kg bw/day, respectively.
The fluoride content of Dunedin drinking water is 0.75ppm, which falls within the
level recommended for CWF of 0.7-1.0ppm as set by the New Zealand Ministry of Health.
The fluoride concentration of Timaru drinking water is 0.12ppm. The fluoride water
concentrations are similar to water from fluoridated and non-fluoridated areas in Brazil
(40) and the United Kingdom (9). As shown by the difference in mean dietary fluoride
intake and total daily fluoride intake between Dunedin and Timaru children, fluoridated
water plays a key role in improving the daily fluoride intake of children and increased

38
fluoride intake by 0.5mg/day. Before fluoridated water was included in the dietary
analysis, Dunedin children had a similar dietary fluoride intake to Timaru children.
However, the results of the pilot study show that even with fluoridated water, diet alone
does not provide sufficient fluoride to achieve the recommended fluoride intake of
2mg/day.
Dietary fluoride intake has been underestimated in the present study because New
Zealand fluoride values were not available for many foods, however, the extent of the
underestimation is likely to be small. Fluoride values for dairy, meat and seafood groups
were not determined as part of the 2016 New Zealand Total Diet Study because of
methodological difficulties. These are important and frequently consumed food groups for
9-10-year-old children. In 6-7-year-old children living in optimally fluoridated areas of the
United Kingdom, fish and seafood, and meat and meat products contributed <1 and 5µg to
total daily fluoride intake, respectively (9). However, in non-fluoridated areas of the United
Kingdom, seafood and fish contributed 7µg of fluoride to children’s total daily fluoride
intake, and meat and meat products contributed 17µg of fluoride (9), similar to the daily
fluoride intake from bread (20µg/day). Bread has previously been noted as a primary
dietary source of fluoride for children living in non-fluoridated areas (4, 9) but meat and
meat products have not. In both areas of the United Kingdom, milk provided 2-3µg of
fluoride to mean total daily fluoride intake (9).
If the fluoride content values of meat and meat products, dairy, and fish and
seafood in the United Kingdom (69) were used for the quantities of these foods eaten by
Dunedin and Timaru children, this might increase fluoride intakes in New Zealand children

39
of this age by 6.5-8.5µg/day. Similar to the United Kingdom children (9), milk may have
added 2-3µg to the total daily fluoride intake of both groups of children, and a similar
amount added again by cheese. In the present study, few children ate beef, chicken or
seafood, and sausages were the most popular meat product which might have contributed
an extra 2.5µg/day of fluoride to their total daily fluoride intake. The theoretical
contribution of meat and seafood to dietary fluoride intakes are quite similar for Dunedin
children and 6-7-year-old children living in fluoridated areas of the United Kingdom.
However, the fluoride contribution from these food groups is much lower for Timaru
children, compared to the children living in non-fluoridated areas of the United Kingdom
as mentioned above (9). Fluoride values provided by a United Kingdom database (69)
could not have been used in the present study because the fluoride content of New Zealand
foods may differ to foods grown and purchased in the United Kingdom.
Toothpaste was the primary source of fluoride for Dunedin and Timaru children, and
although the amount of fluoride ingested from toothpaste was similar between cities,
toothpaste contributed to a greater proportion of total daily fluoride intake in Timaru
children (82%). The higher contribution of toothpaste to the total daily fluoride intake of
Timaru children is consistent with previous studies that report toothpaste as the primary
source of fluoride in non-fluoridated areas (7, 32). However, no studies have reported a
contribution to total daily fluoride intake as high as 82%, observed for Timaru children.
This could be due to younger children (or their parents) putting less toothpaste on their
toothbrushes and/or the impact of some Timaru children swallowing their toothpaste which
is usually more common in much younger children (7). It is also uncommon for toothpaste

40
to provide the greatest amount of fluoride to total daily fluoride intake for children living in
fluoridated areas, as it did in Dunedin (i.e. 57%). Previous studies have reported lower
toothpaste contributions to total daily fluoride intake of 47% for both 3-4-year-olds in
fluoridated areas of New Zealand (32) and 6-7-year-old children living in optimally
fluoridated areas in the United Kingdom (7). These differences in toothpaste fluoride
contribution may be due to Dunedin children using more toothpaste and drinking less
fluoridated water than in other populations. The results of the present study suggest that
toothpaste ingestion is the most important source of fluoride for 9-10-year-old children,
regardless of whether they have access to fluoridated water or not. However, it is important
to note that, as residual fluoride on the toothbrush was not determined in the present study,
it is likely that fluoride intake from toothpaste was overestimated which may have resulted
in the lower FUFE values seen compared to other values published in the literature (8, 11).
Based on the results of this pilot study, if CWF was implemented throughout New
Zealand it is unlikely that 9-10-year-old children would exceed the UL of 10mg/day. Diet
alone contributes very little to total daily fluoride intake, and whilst fluoridated water and
toothpaste contribute more fluoride, on average Timaru and Dunedin children did not meet
the AI of 2mg/day. For 9-13-year-olds, the recommended intake (AI) for water
consumption is 1.9 and 2.2L a day for girls and boys, respectively (37). If Dunedin
children had met the AI for daily water consumption, fluoridated water alone could have
contributed 1.4-1.7mg of fluoride per day to total daily fluoride intake which in addition to
the average dietary and toothpaste fluoride ingestion, may have resulted in an average total
daily fluoride intake of 3.03-3.33mg/day. This is above the AI but still well below the UL.

41
6.2 Feasibility & Recommendations for Future Research
Completed data collection and analysis show that it is feasible to assess fluoride intake in
9- and 10-year-old children in New Zealand. Although the children were old enough to
complete some aspects of data collection on their own, such as urine collection and filling
in parts of the diet record, parental guidance and assistance during the study was very
important. If the study was to be undertaken with children younger than 9- and 10-years-
old, heavy parental involvement would be required to ensure that data collection was
completed correctly. Younger children may have more difficulty collecting 24-hour urine
samples, so it may be more practical to use spot morning urine samples to estimate 24-hour
fluoride excretion, as detailed by Zohoori et al (55). Many parents reported that completing
the duplicate diet was the most difficult part of the study. If the fluoride content of the
duplicate diets and diet records was very similar, only the diet record would need to be
completed in future studies which would be less burdensome for participants. The analysis
of expectorated toothpaste and saliva was successful and quick to complete, as was the
urine analysis so it would be feasible to undertake this study on a larger scale. For future
studies, the collection of and analysis of 24-hour diet records, expectorated toothpaste and
saliva samples, and 24-hour urine samples is suggested. Furthermore, one data collection
period, not two, is recommended and supported by a recent study that found there was no
weekly significant variation in children’s total daily fluoride intake (8).

42
6.3 Strengths and Limitations
6.3.1 Strengths
This is the first study conducted that measured the actual fluoride intakes of 9-10-year-old
children living in fluoridated and non-fluoridated areas of New Zealand, using 24-hour diet
records, 24-hour urine samples and expectorated toothpaste/saliva samples. This pilot
study identified the methods that are the most important for assessing daily fluoride intakes
in New Zealand children and that could be replicated reliably in future studies.
The samples and information collected during this pilot study provide a good estimate
of fluoride intakes because the children’s caregivers reported that their child did not drink
less to avoid, or reduce, urine collection and the majority did not change how their child
ate during the data collection periods. The accuracy of the diet records and duplicate diets
were checked by comparing the sum of the weights recorded in the diet record, and the
total weight of the food and drink collected in the duplicate diet bucket. This pilot study
used the most recently available information on the fluoride content of New Zealand foods
which was sourced from the 2016 New Zealand Total Diet Survey (62).
6.3.2 Limitations
As discussed above, fluoride data was not available for all food and beverages in New
Zealand and this may have resulted in lowering dietary fluoride intake values have been
underreported. Some assumptions had to be made about the children’s diets if there were
missing or incorrectly recorded values in the diet record. These assumptions can be found
in Appendix F. The fluoride content of urine samples may have been underreported

43
slightly because some children forgot to collect one urine void during the data collection
period. Fluoride intake from toothpaste may be overestimated because any fluoride left on
the toothbrush after brushing was not accounted for.
6.4 Conclusion
The results of this pilot study confirm that it is feasible to measure the mean daily fluoride
intakes of 9- and 10-year-old children living in fluoridated and non-fluoridated areas of
New Zealand. Furthermore, the results show that 9- and 10-year-old children living in
Dunedin and Timaru are not meeting the AI for fluoride intake. Toothpaste was the
primary source of fluoride for children in both cities and fluoridated water was an
important source of fluoride for Dunedin children. Further research is required on a larger
scale to determine the mean total daily fluoride intakes of New Zealand children aged
across a wider range of ages including 5-8-years old.

44
7 Application of Research to Dietetic Practice
The skills used this pilot study can be applied to both public health and clinical areas of
dietetic practice.
This research project has taught me that effective communication skills can take a lot
of practice to develop but that they are key when interacting with the public. If a patient is
asked to do something, such as complete a diet record, and they do not completely
understand what the dietitian has meant, the diet record might be filled in incorrectly. This
is frustrating for the patient and the dietitian. It is the responsibility of the dietitian to
ensure they explain information and instructions clearly to the patient, without using
scientific jargon. Often, referring to a visual aid, such as an example of a diet record, can
enhance the patient’s understanding and teaches the dietitian what language and
information are helpful when educating members of the public, thus improving the
dietitian’s communication skills. Another strategy that can enhance a patient’s
understanding and a dietitian’ communication skills, is getting the patient to repeat back
what the dietitian said or getting the patient to describe what they are going to do.
During this whole process, I have also learnt the importance of new research.
Currently, in New Zealand, fluoride fortification is a controversial topic. Many members of
the public are concerned that community water fluoridation is going to provide some of the
population with too much fluoride. Our research showed that this is unlikely to happen,
and in fact, community water fluoridation is much more likely to improve health, rather
than be a detriment to it. A dietitian is required to use evidence-based practice during all

45
aspects of their job. Therefore, a dietitian has a responsibility to keep up to date with new
research being published in order to give evidence-based advice to whoever needs it,
especially since nutrition is an ever-evolving area. I have developed the ability to ascertain
whether scientific articles are of good quality or not by looking at the study design, the
study size and demographics and the methods used. In addition, I have learnt how to
interpret the findings of the study and apply them to what I am working on, which will be a
valuable skill to have when working as a dietitian.
In dietetic practice, the actions of dietitians must be always guided by ethical
principles. These include maintaining a patient’s autonomy, acting in the best interest of
the patient, causing no harm to the patient and acting fairly, and in a non-biased or
judgmental way. A way to ensure these principles are achieved during research is to obtain
ethical approval. Ethical approval indicates that researchers have abided by the accepted
ethical standards when designing their study which minimises any risk for the participant.
Participants and patients have a right to be protected during any research or treatment they
are involved with. They also have a right to know what information will be collected from
them and what will happen with it. During each step of completing this research, it was
important to reflect on the ethical principles and make sure they were being met. This is an
important habit to develop as it is an integral part of working as a dietitian.

46
Appendices
Appendix A. Ethical approval

47

48
Appendix B. Information Pack and Consent Form (child)

49

50
Appendix C. Information Pack and Consent Form (Parent)

51

52

53

54

55

56
Appendix D. Survey Monkey Questionnaires (Baseline and Follow-up)

57

58
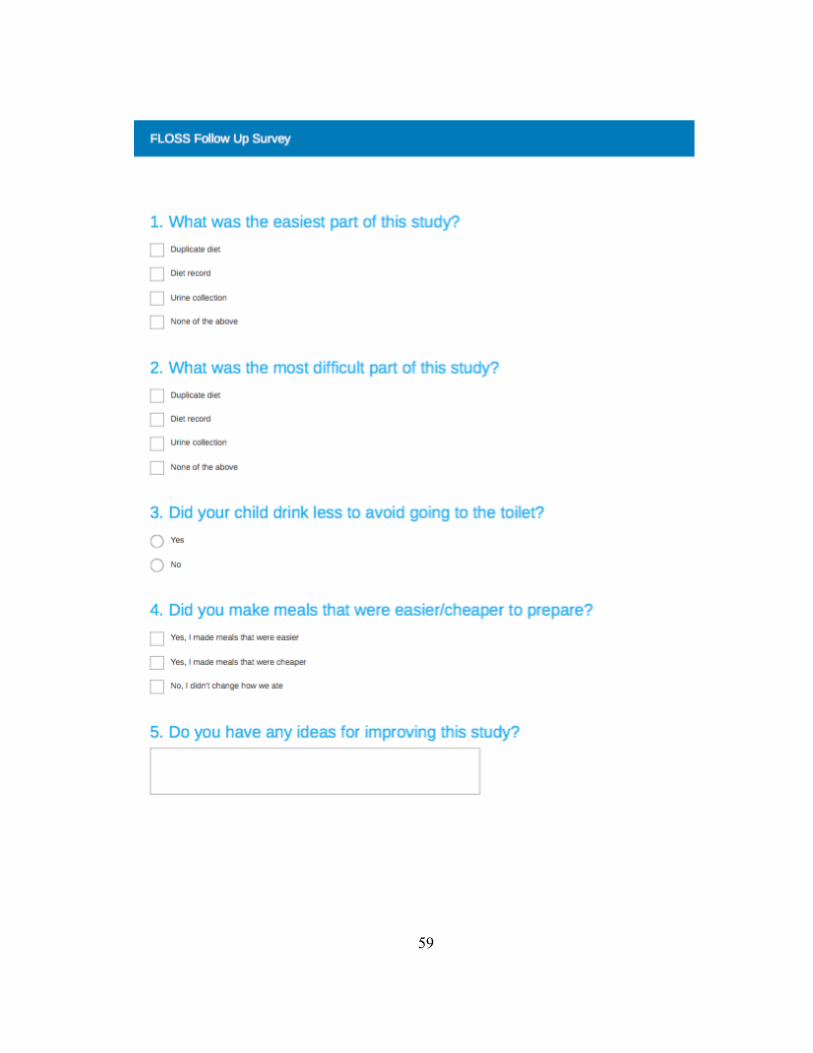
59

60
Appendix E. 24-hour Diet Record

61

62

63

64

65

66

67
Appendix F. Kaiculator assumptions

68

69
8 References
1. World Health Organization. Environmental Health Criteria 227. Fluorides. Geneva: World Health Organization; 2002. 2. Featherstone JDB. The science and practice of caries prevention. JADA. 2000;131:887-99. 3. Truswell S. Fluoride. Essentials of human nutrition 4th ed. New York, USA: Oxford University Press; 2012. p. 192-5. 4. Cressey P, Gaw S, Love J. Estimated dietary fluoride intake for New Zealanders. J Public Health Dent. 2010;70(4):327-36. 5. Ministry of Health. Our Oral Health: Key Findings of the 2009 New Zealand Oral Health Survey. In: Ministry of Health, editor. Wellington2010. p. xvii-15. 6. New Zealand Guidelines Group. Guidelines for the Use of Fluorides Wellington Ministry of Health; 2009. p. vii-30. 7. Maguire A, Zohouri FV, Hindmarch PN, Hatts J, Moynihan PJ. Fluoride intake and urinary excretion in 6- to 7-year-old children living in optimally, sub-optimally and non-fluoridated areas. Community Dent Oral Epidemiol. 2007;35(6):479-88. 8. Omid N, Maguire A, O'Hare WT, Zohoori FV. Total daily fluoride intake and fractional urinary fluoride excretion in 4- to 6-year-old children living in a fluoridated area: weekly variation? Community Dent Oral Epidemiol. 2017. 9. Zohouri F, Maguire A, Moynihan P. Sources of dietary fluoride intake in 6-7-year-old English children receiving optimally, sub-optimally, and non-fluoridated water. J Public Health Dent. 2006;66(4):227-34. 10. Haftenberger M, Viergutz G, Neumeister V, Hetzer G. Total fluoride intake and urinary excretion in German children ages 3-6 years. Caries Res. 2001;35:451-7. 11. Zohoori FV, Walls R, Teasdale L, Landes D, Steen IN, Moynihan P, et al. Fractional urinary fluoride excretion of 6-7-year-old children attending schools in low-fluoride and naturally fluoridated areas in the UK. Br J Nutr. 2013;109(10):1903-9. 12. Heilman JR KM, Levy SM, Wefel JS. Assessing fluoride levels of carbonated soft drinks. J Am Dent Assoc. 1999;130:1593-9. 13. Whitford G. The metabolism and toxicity of fluoride. Monogr Oral Sci. 16. Switzerland: Karger; 1996. p. xi-xiii. 14. Buzalaf M, Whitford G. Fluoride metabolism. In: Buzalaf M, editor. Fluoride and the Oral Environment. 22. Basel, Switzerland: Karger; 2011. p. 20-36. 15. National Health and Medical Research Council. Fluoride. Nutrient reference values for Australia and New Zealand including recommended dietary intakes. Canberra, Australia: NHMRC; 2006. p. 175-80. 16. Whitford G. Fluoride metabolism and excretion in children. J Public Health Dent. 1999;59(4):224-8. 17. Touger-Decker R, van Loveren C. Sugars and dental caries. Am J Clin Nutr. 2003;78(suppl):881s-92S.

70
18. Buzalaf M, Pessan J, Honório H, ten Cate J. Mechanism of action of fluoride for caries control. In: Buzalaf M, editor. Fluoride and the oral environment. 22. Basel, Switzerland: Karger; 2011. p. 97-114. 19. Arends J. Tooth enamel remineralization. J Cryst Growth. 1981;53:135-47. 20. Cummings J, Mann J. Carbohydrates Essentials of Human Nutrition 4th. New York, USA: Oxford University Press; 2012. p. 42. 21. Selwitz R, Ismail A, Pitts N. Dental caries. Lancet. 2007;369:51-9. 22. Marsh PD. Dental plaque as a biofilm and a microbial community - implications for health and disease. BMC Oral Health. 2006;6 Suppl 1:S14. 23. Arnold WH, Dorow A, Langenhorst S, Gintner Z, Banoczy J, Gaengler P. Effect of fluoride toothpastes on enamel demineralization. BMC Oral Health. 2006;6:8. 24. Robinson C. Fluoride and the caries lesion: interactions and mechanism of action. Eur Arch Paediatr Dent. 2009;10(3):136-40. 25. Burt BA. The Changing Patterns of Systemic Fluoride Intake. J Dent Res. 1992;71(5):1228-37. 26. National-Health-and-Medical-Research-Council. Draft Information paper: Effects of water fluoridation on dental and other health outcomes. In: National-Health-and-Medical-Research-Council, editor. Canberra, Australia2016. p. 1-81. 27. Craig L, Lutz A, Berry KA, Yang W. Recommendations for fluoride limits in drinking water based on estimated daily fluoride intake in the Upper East Region, Ghana. Sci Total Environ. 2015;532:127-37. 28. Jiang Y, Foster-Page L, McMillan J, Lyons K, Broadbent J, Morgaine K. Is New Zealand water fluoridation justified? N Z Med J. 2014;127:80-6. 29. Ayoob S, Gupta AK. Fluoride in Drinking Water: A Review on the Status and Stress Effects. Critical Reviews in Environmental Science and Technology. 2006;36(6):433-87. 30. Gulati P, Singh V, Gupta MK, Vaidya V, Dass S, Prakash S. Studies on the leaching of fluoride in tea infusions. The Science of the Total Environment. 1993;138:213-22. 31. Duckworth R, Duckworth S. The ingestion of fluoride in tea. Br Dent J. 1978;145:368-70. 32. Guha-Chowdhury N, Drummond B, Smillie A. Total Fluoride Intake in Children Aged 3 to 4 Years- A Longitudinal Study. J Dent Res. 1996;75(7):1451-7. 33. Chowdhury N, Brown R, Shepherd M. Fluoride intake of infants in New Zealand. J Dent Res. 1990;69(12):1823-33. 34. Van Loveren C, Ketley C, Cochran J, Duckworth R, O'Mullane D. Fluoride ingestion from toothpaste: fluoride recovered from the toothbrush, the expectorate and the after-brush rinses. Community Dent Oral Epidemiol. 2004;32 Suppl 1:54-61. 35. Broadbent J, Thomson M, Ramrakha S, Moffitt T, Zeng J, LA FP, et al. Community Water Fluoridation and Intelligence: Prospective Study in New Zealand. Am J Public Health. 2015;105(1):72-6. 36. Australian Government Department of Health, New Zealand Ministry of Health. Australian and New Zealand Nutrient Referene Values for Fluoride. Australia: Australian Government Department of Health, New Zealand Ministry of Health,; 2017. p. 52-5.

71
37. National Health and Medical Research Council, Australian Government Department of Health and Ageing, New Zealand Ministry of Health. Nutrient Reference Values for Australia and New Zealand Including Recommended Dietary Intakes. Version 1.1. Canberra: National Health and Medical Research Council; 2006. 38. The Royal Society of New Zealand, Office of the Prime Miniter's Chief Science Advisor. Health effects of water fluoridation: A review of the scientific evidence. Wellington: The Royal Society of New Zealand 2014. 39. Kanagaratnam S, Schluter P, Durward C, Mahood R, Mackay T. Enamel defects and dental caries in 9-year-old children living in fluoridated and nonfluoridated areas of Auckland, New Zealand. Community Dent Oral Epidemiol. 2009;37(3):250-9. 40. Rodrigues MH, Leite AL, Arana A, Villena RS, Forte FD, Sampaio FC, et al. Dietary fluoride intake by children receiving different sources of systemic fluoride. J Dent Res. 2009;88(2):142-5. 41. Kimura T, Morita M, Kinoshita T, Tsuneishi M, Akagi T, Yamashita F, et al. Fluoride intake from food and drink in Japansese children ages 1-6 years. Caries Res. 2001;35:47-9. 42. Nohno K, Sakuma S, Koga H, Nishimuta M, Yagi M, Miyazaki H. Fluoride intake from food and liquid in Japanese children living in two areas with different fluoride concentrations in the water supply. Caries Res. 2006;40(6):487-93. 43. Zohouri F, Rugg-Gunn AJ. Sources of dietary fluoride intake in 4-year-old children residing in low, medium and high fluoride areas in Iran. Int J Food Sci Nutr. 2000;51(5):317-26. 44. The British Fluoridation Society, The UK Public Health Association, The British Dental Association, The Faculty of Public Health. One in a million: The facts about water fluoridation. 2 ed. Manchester: British Fluoridation Society; 2004. 55-80 p. 45. Centers for Disease Control and Prevention. Fluoridation Statistics United States: U.S Department of Health and Human Services; 2016 [ 46. Cheng KK, Chalmers I, Sheldon TA. Adding fluoride to water supplies. Br Med J. 2007;335(7622):699-702. 47. Buzalaf M. Fluoride and the oral environment. Switzerland: Karger Medical and Scientific Publishers; 2011. 48. Omid N, Maguire A, O'Hare WT, Zohoori FV. Estimation of daily dietary fluoride intake: 3-d food diary v. 2-d duplicate plate. Br J Nutr. 2015;114(12):2103-9. 49. Rojas-Sanchez F, Kelly S, Drake K, Eckert G, Stookey G, Dunipace A. Fluoride intake from foods, beverages and dentifrice by young children in communities with negligibly and optimally fluoridated water: a pilot study. Community Dent Oral Epidemiol. 1999;27:288-97. 50. Paiva SM, Lima YBO, Cury JA. Fluoride intake by Brazilian children from two communities with fluoridated water. Community Dent Oral Epidemiol. 2003;31(3):184-91. 51. Zohoori FV, Buzalaf MA, Cardoso CA, Olympio KP, Levy FM, Grizzo LT, et al. Total fluoride intake and excretion in children up to 4 years of age living in fluoridated and non-fluoridated areas. Eur J Oral Sci. 2013;121(5):457-64. 52. Stockley L. Food composition tables in the calculation of the nutrient content of mixed diets. J Hum Nutr Diet. 1988;1:187-95.

72
53. Buzalaf MA, Rodrigues MH, Pessan JP, Leite AL, Arana A, Villena RS, et al. Biomarkers of fluoride in children exposed to different sources of systemic fluoride. J Dent Res. 2011;90(2):215-9. 54. World Health Organization. Basic methods for assessment of renal fluoride excretion in community prevention programmes for oral health. Geneva, World Health Organization2014. 55. Zohouri FV, Swinbank CM, Maguire A, Moynihan PJ. Is the fluoride/creatinine ratio of a spot urine sample indicative of 24-h urinary fluoride? Community Dent Oral Epidemiol. 2006;34:130-8. 56. Buzalaf MA, Pessan JP, Alves KM. Influence of growth rate and length on fluoride detection in human nails. Caries Res. 2006;40(3):231-8. 57. Whitford G, Sampaio F, Arneberg P, FR von der Fehr. Fingernail fluoride: A method for monitoring fluoride exposure Caries Res. 1999;33:462-7. 58. Fukushima R, Rigolizzo DS, Maia LP, Sampaio FC, Lauris JR, Buzalaf MA. Environmental and individual factors associated with nail fluoride concentration. Caries Res. 2009;43(2):147-54. 59. Whitford G. Monitoring fluoride exposure with fingernail clippings. Schweiz Monatsschr Zahnmed. 2005;115:685-9. 60. McDonnell S, O'Mullane D, Cronin M, MacCormac C, Kirk J. Relevant factors when considering fingernail clippings as a fluoride biomarker. Community Dent Health. 2004;21:19-24. 61. World Health Organization. Oral Health Surveys: Basic Methods. 5th ed. Geneva: World Health Organisation; 2013. 62. New Zealand Government. New Zealand Total Diet Study. In: Ministry for Primary Industries, editor. Wellington 2017. 63. Sivakumaran S HL, Gilmore Z, Sivakumaran S. New Zealand FOODfiles 2016 manual. The New Zealand Institute for Plant & Food Research Limited and Ministry of Health; 2017. 64. Pikholz C, Swinburn B, Metcalf P. Under-reporting of energy intake in the 1997 National Nutrition Survey. N Z Med J. 2004;117(1202):1-11. 65. Marthaler TM. Monitoring of renal fluoride excretion in community preventive programmes on oral health. Geneva: World Health Organisation; 1999. 66. Tolos W. Fluoride in urine: Method 8308. In: Eller PM, editor. Niosh Manual of Analytical Methods. 4th ed: Centers for Disease Control and Prevention; 1994. 67. AOAC International. Fluoride-Selective Electrode Method. In: Cunniff P, editor. Official Methods of Analysis of AOAC International. 16th ed. Arlington, USA: AOAC International; 1996. 68. Prebble C. Mashblock New Zealand [Internet]. Statistics New Zealand; 2017 [Available from: http://www.mashblock.co.nz/. 69. Zohoori FV, Maguire A. Database of the Fluoride (F) content of Selected Drinks and Foods in the UK. United Kingdom: Newcastle University and Teesside University; 2015.


![Health & Fitnessjohngedeon.com/Health-OIAI-4Feb16.pdf9. Floss, brush, and see a dentist regularly. [use fluoride rinse] 10. Ask your doctor if medication can help you control the potential](https://static.fdocuments.us/doc/165x107/600f941d8dd1fe59775730b8/health-9-floss-brush-and-see-a-dentist-regularly-use-fluoride-rinse.jpg)


