Florida’s Independent Living Survey Initiative Protect the Vulnerable, Promote Strong and...
16
Mission: Protect the Vulnerable, Promote Strong and Economically Self-Sufficient Families, and Advance Personal and Family Recovery and Resiliency Overview of Florida’s Independent Living Program Patricia Armstrong, Director Eleese Davis, Chief of Quality Assurance Office of Child Welfare Updated August 2012
Transcript of Florida’s Independent Living Survey Initiative Protect the Vulnerable, Promote Strong and...

Mission: Protect the Vulnerable, Promote Strong and Economically Self-Sufficient Families, and Advance Personal and Family Recovery and Resiliency
Overview of Florida’s Independent Living Program
Patricia Armstrong, Director Eleese Davis, Chief of Quality Assurance
Office of Child Welfare
Updated August 2012

Pre-Independent Living & Independent Living – Updated August 2012 2
Table of Contents
Background ...................................................................................................................................... 3
Legislative Action ......................................................................................................................... 3 # Teens Out-of-Home Care Teens, Eligible Young Adults, and Removals of 17 year old Teens .. 3
Overview of Available Survey Data ................................................................................................ 4 Survey Results for Teens 13-17 ....................................................................................................... 5 Independent Living and Transition Critical Services Checklist and My Services .............................
Education ..................................................................................................................................... 5 Employment ................................................................................................................................ 6 Health and Dental Care ............................................................................................................... 7 Normalcy...................................................................................................................................... 8 Involvement in the Juvenile Justice System Involvement ......................................................... 10
Survey Results for Young Adults 18-22 ......................................................................................... 10 Florida National Youth in Transition Database Survey ....................................................................
Education ................................................................................................................................. 110 Employment ............................................................................................................................ 110 Health and Dental Care ........................................................................................................... 123 Housing & Transportation ....................................................................................................... 123 Involvement in the Criminal Justice System ............................................................................ 144 Age at Removal ........................................................................................................................ 145
Independent Living Budget ........................................................................................................... 15
Allocated funds and Expenditures ............................................................................................. 15 Distribution of Expenditures ...................................................................................................... 16

Pre-Independent Living & Independent Living – Updated August 2012 3
Background Legislative Action
The Chafee Foster Care Independence Act (1999)
In 1999 the federal government enacted the Chafee Foster Care Independence Act. This legislation gave
states increased funding to provide foster teens and young adults that have “aged out” of the foster
care system with better access to programs that are designed to promote the development of adult self-
sufficiency. Available Independent Living training opportunities, programmatic supports, and direct
services covered by the Chafee Foster Care Independence Act include,
Educational training and supports
Preparation for post secondary education
Daily life skills training
Employment training
Substance abuse services
Pregnancy prevention and preventive health activities
Programs that are designed to connect foster teens and young adults that have aged out of the
foster care system with positive and permanent adult mentors
Road to Independence Act (2002)
In 2002 Florida passed the Road to Independence Act. This state based program is designed to provide
direct stipend payments to young adults that have aged out of the foster care system while they pursue
fulltime educational opportunities in the areas of continuing adult education (GED), vocational
training/certification, or post secondary associate/bachelor degrees. The current maximum allowable
monthly stipend payment can be no more than $1256 per month.
78.6% of those aging out of foster care will initially receive RTI funds.
At age 19, only 51.2% of those who aged out of care are still receiving benefits,
At age 20, only 38.1%
At age 21, only 37.2%
At age 22, 26.2%
Number of Teens Out-of-Home Care Teens, Eligible Young Adults, and Removals of 17 year old Teens
5,000- Approximate number of teens between the ages of 13-17 residing in out-of-home care
placement on any given day over the past year.
5,500- Approximate number of young adults who are eligible to receive Independent Living
services on any given day over the past year.
4,000- Approximate number of young adults accessing Road to Independence services on any
given day over the past year.
350-450- Total removals involving teens that are 17 years of age (2-3% of the statewide annual
total).

Pre-Independent Living & Independent Living – Updated August 2012 4
Overview of Available Survey Data
Independent Living and Transition Critical Services Checklist (2007-2010)
In 2007, Florida created the Independent Living and Transition Critical Services Checklist. This survey
was designed to analyze and capture how those youth that had aged out of foster care (ages 18-22)
were doing in establishing adult self-sufficiency. Current foster teens (ages 13-17) were also surveyed in
an effort to get an better understanding of how well foster teens were being prepared for the possibility
of aging out of foster care as well as to a get a better understanding of foster teens viewed the overall of
quality of services provided by the foster care system. The paper based Independent Living and
Transition Critical Services Checklist was last administered in 2010 and has since replaced by the
following three separate online surveys.
Federal National Youth in Transition Database (2011-current)
The National Youth in Transition Database (NYTD) survey is an 88 question federally required survey.
The federal NYTD survey is administered every other year by Connected by 25 to current and former
foster teens in predetermined cohorts of 17, 19, and 21 years in a online format. The objective of the
survey is to gain a better understanding of how this population is moving towards achieving the goal of
adult self-sufficiency. Categories and question covered by the survey addresses areas related to health,
housing & transportation, education, employment; and involvement with the Juvenile/Criminal Justice
System. Florida national Youth in Transition Database (2011-current)
In an effort to ensure that all of the federally required NYTD survey populations were being properly
tracked Florida made the decision to have Connected by 25 administer the federal NYTD survey on an
annual basis to all former foster care youth (ages 18-22) that could be located and were willing/able to
complete the 88 question survey. The Florida NYTD survey is administered annually (spring) by
Connected by 25 in an online format and mirrors the categories and questions covered by the federal
NYTD survey.
My Services (2011-current)
My Services is a 200+ question online survey that is administered by Connected by 25 on a biannual
basis (spring and fall) that attempts to survey all foster teens (ages 13-17) The survey provides general
information on how well teens are being prepared for adult self-sufficiency as well as how they view the
overall of quality of services that are being provided by the foster care system. Categories and
questions covered by the survey included,
Case management practices and general documentation requirements
Educational attainment services and progression planning
Employment preparation and employment supports
Financial literacy training, Life skills training
General foster care support and quality
Ability to participate in normal teen activities
Health/dental care service
Involvement with the Juvenile/Criminal Justice system
Preparation for aging out of the foster care system

Pre-Independent Living & Independent Living – Updated August 2012 5
Survey Results for Teens 13-17 Independent Living and Transition Critical Services Checklist and My Services The following survey findings are derived from a combination of both the Independent Living and
Transition Critical Services Checklist and the My Services surveys. Though not all of the questions
contained within both these surveys are identical, there is enough available information contained with
both of these tools so as to allow for a very general review of how foster teens are being prepared for
adult self sufficiency as well as how they view the overall of quality of services that are being provided
by the foster care system
Unless otherwise noted all results listed below for 2007-2010 are derived from the annual Independent
Living and Transition Critical Services Checklist and all 2011-2012 results are derived from the biannual
My Services survey.
Education
Survey results indicate that approximately three-fourths of foster teens reported that their grades or
report cards were reviewed by their placement or caseworker. The surveys also indicated that teens
appear to be unaware or disconnected from the educational planning process given that only about
one-third to one-half of the respondents indicated that had an Education & Career Path Plan or
Individualized Education Plan. Teens also are indicating that school stability appears to be a major
problem with nearly one-half of all teens indicating that changed schools within the past year.
Education
Foster parents or group home staff review the youths school grades and report cards
Year 2007 2008 2009 2010 Spring 2011
Fall 2011
Spring 2012
Percentage Yes 79% 81% 76%
Yes 1,227 1,369 1,306
Total 1,560 1,699 1,712
Caseworker reviews school grades and report cards
Year 2007 2008 2009 2010 Spring 2011
Fall 2011
Spring 2012
Percentage Yes 73% 71% 69%
Yes 1,139 1,204 1,189
Total 1,560 1,699 1,712
Youth has an Education & Career Path Plan [This may be your EPEP]
Year 2007 2008 2009 2010 Spring 2011
Fall 2011
Spring 2012
Percentage Yes 52% 40% 35%
Yes 818 681 599
Total 1,560 1,699 1,712

Pre-Independent Living & Independent Living – Updated August 2012 6
Education continued
Youth has an Individualized Education Plan [IEP]
Year 2007 2008 2009 2010 Spring 2011
Fall 2011
Spring 2012
Percentage Yes 43% 43% 41%
Yes 669 723 709
Total 1,560 1,699 1,712
Youth has changed schools at least once during the school year
Year 2007 2008 2009 2010 Spring 2011
Fall 2011
Spring 2012
Percentage Yes 47% 30% 47%
Yes 734 506 800
Total 1,560 1,699 1,712
Source: My Services Survey - Responses by youth age 14-17 Spring 2010 and 13-17 all others
Employment Only a very small percentage of foster teens reported that are currently employed (7%). However,
nearly three-fourths of foster teens indicate that are being given the opportunity to earn money through
alternative activities such as baby-sitting or yard work. Yet it is troubling to note that only about one-
half of foster teens indicated that they have received formalized training on how to apply and interview
for a job.
Employment
Currently employed
Year 2007 2008 2009 2010 Spring 2011
Fall 2011
Spring 2012
Percentage Yes 7% 5% 4% 8% 7% 6%
Yes 64 95 83 74
Total 1,726 1,198 1,221 1,199
Asked of youth 13-17 through 2010 and 15-17 all Others
Earns extra money by babysitting, mowing lawns, cleaning yards and other activities
Year 2007 2008 2009 2010 Spring 2011
Fall 2011
Spring 2012
Percentage Yes 74%
75% 65%
Yes 532 789 794
Total 1,361 1,699 1,712
Responses by youth age 14-17 Spring 2010 and 13-17 all Others
Completed a life skills training program on how to get a job-including job interviewing skills, completing a job application and resume
Year 2007 2008 2009 2010 Spring 2011
Fall 2011
Spring 2012
Percentage Yes 47% 55% 46%
Yes 417 439 330
Total 883 798 711
Only asked of youth age 15-16

Pre-Independent Living & Independent Living – Updated August 2012 7
Health and Dental Care
Eighty-five percent of foster teens indicate that they receiving the medical care that they need and a
similar number reported that they have had a dental exam within the last year. Teens who reported
that they were currently taking a prescription medication indicated that they have a good understanding
of their medication’s possible side effects. The percentage of respondents reporting that they are
receiving the mental health or substance abuse services that they need was not nearly as strong with
only about a one-half reporting that they feel that they are getting the services that the need in these
two areas.
Health and Dental Care
Youth receiving needed medical care
Year 2007 2008 2009 2010 Spring 2011 Fall 2011
Spring 2012
Percentage No, I am receiving the medical care I need
86% 84% 86%
No, I am receiving the medical care I
need
1,338 1,435 1,479
Total 1,560 1,699 1,712
Youth receiving needed mental health care
Year 2007 2008 2009 2010 Spring 2011 Fall 2011
Spring 2012
Percentage Yes 60% 57% 52%
Yes 934 969 897
Total 1,560 1,699 1,712
Youth receiving substance abuse treatment services
Year 2007 2008 2009 2010 Spring 2011 Fall 2011
Spring 2012
Percentage Yes 58% 55% 57%
Yes 345 334 353
Total 591 609 620
Youth taking prescription medication
Year 2007 2008 2009 2010 Spring 2011 Fall 2011
Spring 2012
Percentage Yes 44% 47% 44%
Yes 682 793 753
Total 1,560 1,699 1,712
Youth who have seen a Dentist in the Last Year
Year 2007 2008 2009 2010 Spring 2011
Fall 2011
Spring 2012
Percentage Yes 72% 85% 85% 86%
Yes 893 1,330 1,448 1,472
Total 1,237 1,560 1,699 1,712

Pre-Independent Living & Independent Living – Updated August 2012 8
Health and Dental Care continued
Youth who have had an Eye Exam in the Last Year
Year 2007 2008 2009 2010 Spring 2011
Fall 2011
Spring 2012
Percentage Yes 44% 81% 82% 68%
Yes 540 1,271 1,195 1,164
Total 1,237 1,560 1,460 1,712
Source: My Services Survey - Responses by youth age 14-17 Spring 2010 and 13-17
Normalcy In general foster teens report that the effort to establish a more normal living environment within the
foster care system is still lagging. The percentage of teens that reported that they have a written
approved activities plan is trending solidly within the sixty percentage range. Compliance with statutory
requirements that foster receive a weekly allowance also appears to have locked into the fifty percent
range. Teens that reported that they have a Florida Identification (40%), Learners Permit (10%), or
Derivers’ License (3%) were also low.
Normalcy
Youth has a written plan for participation in activities
Year 2007 2008 2009 2010 Spring 2011 Fall 2011
Spring 2012
Percentage Yes 33% 44% 52% 66% 64% 68% 62%
Yes 803 1,003 1,153 1,056
Total 1,216 1,560 1,699 1,712
Responses by youth age 14-17 Spring 2010 and 13-17 all Others
Youth can spend time with friends WITHOUT adult supervision.
Year 2007 2008 2009 2010 Spring 2011 Fall 2011
Spring 2012
Percentage Yes 74% 67% 65%
Yes 1,153 1,130 1,117
Total 1,560 1,699 1,712
Responses by youth age 14-17 Spring 2010 and 13-17 all Others
Youth can spend the night with friends from school or social group.
Year 2007 2008 2009 2010 Spring 2011 Fall 2011
Spring 2012
Percentage Yes 51% 51% 45%
Yes 650 443 542
Total 1,269 867 1,199
Only asked of youth age 15-17 Except for Fall 2011 16-17
Receives a personal allowance each week.
Year 2007 2008 2009 2010 Spring 2011 Fall 2011
Spring 2012
Percentage Yes 54% 55% 53%
Yes 845 938 901
Total 1,560 1,699 1,712
Source: My Services Survey - Responses by youth age 14-17 Spring 2010 and 13-17

Pre-Independent Living & Independent Living – Updated August 2012 9
Normalcy Continued
Have a Florida Identification
Year 2007 2008 2009 2010 Spring 2011 Fall 2011
Spring 2012
Percentage Yes 38% 40% 39%
Yes 593 687 675
Total 1,560 1,699 1,712
Responses by youth age 14-17 Spring 2010 and 13-17 all Others
Have a Learners Permit
Year 2007 2008 2009 2010 Spring 2011 Fall 2011
Spring 2012
Percentage Yes 11% 10%
Yes 130 117
Total 1,221 1,199
Responses by youth age 13-17
Successfully completed a driver’s education course
Year 2007 2008 2009 2010 Spring 2011 Fall 2011
Spring 2012
Percentage Yes 6% 7% 11% 8% 5% 13% 12%
Yes 81 40 162 139
Total 955 853 1,221 1,199
Only asked of youth age 15-17
Have a Driver’s License
Year 2007 2008 2009 2010 Spring 2011 Fall 2011
Spring 2012
Percentage Yes 7% 3%
Yes 57 22
Total 867 862
Source: My Services Survey - Only asked of youth age 16-17

Pre-Independent Living & Independent Living – Updated August 2012 10
Involvement in the Juvenile Justice System Involvement
About of one-quarter of foster teens report that they have been arrested within the last year or are currently under some type of Department of Juvenile Justice supervision.
Juvenile Justice System Involvement
Been arrested in the past 12 months
Year 2007 2008 2009 2010 Spring 2011
Fall 2011
Spring 2012
Percentage Yes 10% 28% 30% 30% 29% 27% 28%
Yes 405 841 663 514 454 467 482
Total 3,897 3,004 2,176 1,726 1,560 1,699 1,712
Currently on probation or under DJJ supervision
Year 2007 2008 2009 2010 Spring 2011
Fall 2011
Spring 2012
Percentage Yes Not
Asked 42% 23% 24% 21% 21% 22%
Yes 1,252 505 407 333 364 379
Total 2,982 2,163 1,710 1,560 1,699 1,712
Source: My Services Survey - Responses by youth age 14-17 Spring 2010 and 13-17
Juvenile Justice System Involvement by Age
Been arrested in the past 12 months
Age 13 14 15 16 17 Total
Percentage Yes 15% 24% 31% 33% 32% 28%
Yes 37 62 103 125 155 482
Total 255 258 337 374 488 1,712
Source: My Services Survey - Responses by young adults age 13-17
Currently on probation or under DJJ supervision
Age 13 14 15 16 17 Total
Percentage Yes 10% 17% 23% 29% 25% 22%
Yes 25 44 77 109 124 379
Total 255 258 337 374 488 1,712
Source: My Services Survey - Responses by young adults age 13-17
Children Served by DJJ 4/1/2012-4/30/2012
DJJ Program Component DCF In Home DCF Out-of-Home Total
Probation - Community Supervision 96 356 452
Juvenile Detention 20 107 127
Juvenile Residential Program 14 120 134
Grand Total 130 583 713 Source: Data Match with DJJ – Children Served in FSFN anytime during 04/01/2012 - 04/30/2012

Pre-Independent Living & Independent Living – Updated August 2012 11
Survey Results for Young Adults 18-22 Florida National Youth in Transition Database Survey The following survey findings are derived from a combination of both the Independent Living and
Transition Critical Services Checklist and the 2011 Florida National Youth in Transition Database surveys.
Though not all of the questions contained within both of these surveys are identical, there is enough
available information contained with both of these tools so as to allow for a very general review of how
young adults that have aged out of the foster care system are progressing towards self-sufficiency.
Education
Only about one-half of young adults formerly in foster care who participated in the survey have finished
high school and only a very small percentage goes on to college.
Education
Completed Grade 12 or Graduation Equivalency
Diploma
Year 2008 2009 2010 Florida NYTD
2011 Florida NYTD
2012
Percentage Yes 52% 48% 48% 54% 57%
Yes 979 744 568 1,093 1,041
Total 1,887 1,547 1,180 2,015 1,821
Completed Post Secondary Education
Year 2008 2009 2010 Florida NYTD
2011 Florida NYTD
2012
Percentage Yes 5% 3% 3% 3% 7%
Yes 86 48 33 54 65
Total 1,887 1,547 1,180 2,015 1,821
Responses by young adults age 18-22 Employment
There has been a steady decline in the percentage of young adults formerly in foster care who have a
job of any kind, especially full-time. Of those that do have a full-time job, nearly one-half do not have
benefits and the percentage who are only earning minimum wage has increased.
Employment
Any job: part-time, full-time, temporary, or
seasonal
Year 2008 2009 2010 Florida NYTD
2011 Florida NYTD
2012
Percentage Yes 30% 22% 17% 14% 19%
Yes 572 342 203 195 346
Total 1,920 1,559 1,199 1,398 1,821
Responses by young adults age 18-22
Pre-Independent Living & Independent Living – Updated August 2012 12
Employment continued
Full time job
Year 2008 2009 2010 Florida NYTD
2011 Florida NYTD
2012
Percentage Yes 6% 3% 3% 4% 4%
Yes 124 54 40 61 1697
Total 1,920 1,559 1,199 1398 1,821
Of those having a full-
time job, percent who have benefits
Year 2008 2009 2010 Florida NYTD
2011 Florida NYTD
2012
Percentage Yes 52% 60% 52% No Longer Asked
No Longer Asked
Yes 57 27 16
Total 109 45 31
Minimum wage
Year 2008 2009 2010 Florida NYTD
2011 Florida NYTD
2012
Percentage Yes 31% 36% 36% 40% 35%
Yes 163 118 72 97 109
Total 525 331 198 244 310
Responses by young adults age 18-22
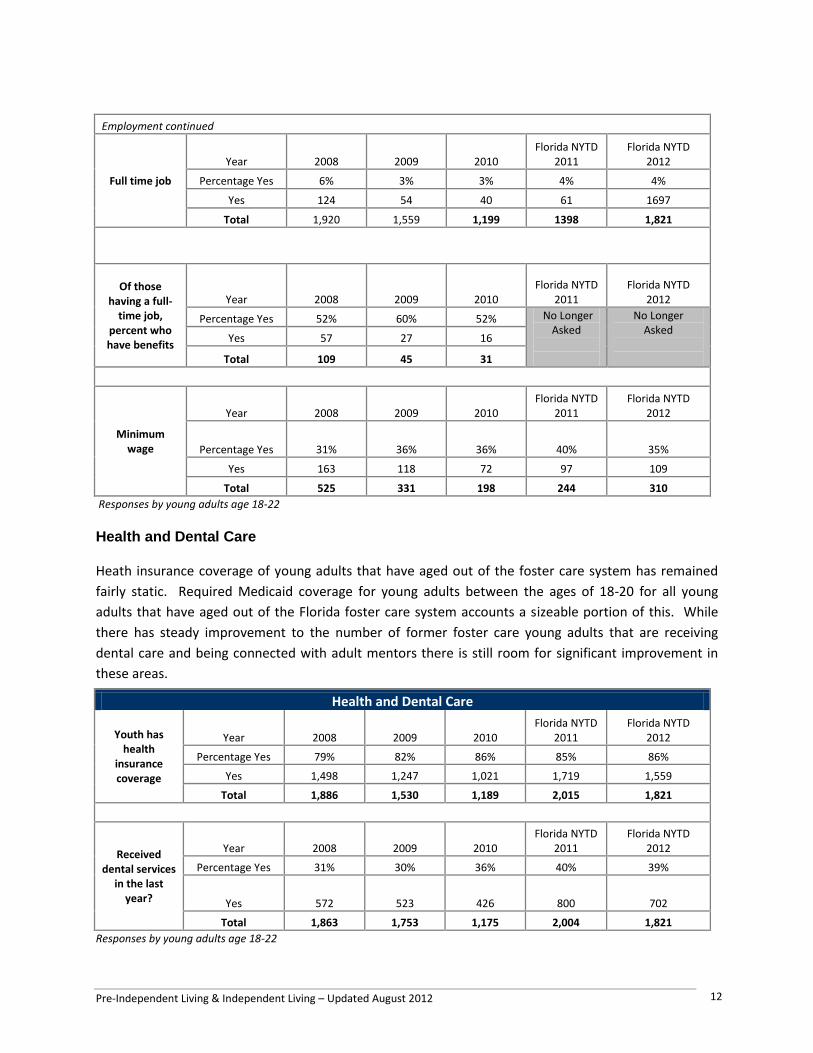
Health and Dental Care Heath insurance coverage of young adults that have aged out of the foster care system has remained
fairly static. Required Medicaid coverage for young adults between the ages of 18-20 for all young
adults that have aged out of the Florida foster care system accounts a sizeable portion of this. While
there has steady improvement to the number of former foster care young adults that are receiving
dental care and being connected with adult mentors there is still room for significant improvement in
these areas.
Health and Dental Care
Youth has health
insurance coverage
Year 2008 2009 2010 Florida NYTD
2011 Florida NYTD
2012
Percentage Yes 79% 82% 86% 85% 86%
Yes 1,498 1,247 1,021 1,719 1,559
Total 1,886 1,530 1,189 2,015 1,821
Received dental services
in the last year?
Year 2008 2009 2010 Florida NYTD
2011 Florida NYTD
2012
Percentage Yes 31% 30% 36% 40% 39%
Yes 572 523 426 800 702
Total 1,863 1,753 1,175 2,004 1,821
Responses by young adults age 18-22

Pre-Independent Living & Independent Living – Updated August 2012 13
Health and Dental Care continued
Connected to an adult mentor Question
changed to do you currently
have a relationship that
is trusting, supportive, and unconditional
with at least one adult who will
always be there for you
Year 2008 2009 2010 Florida NYTD
2011 Florida NYTD
2012
Percentage Yes 42% 46% 50% 76% 83%
Yes 738 682 556 1,596 1,392
Total 1,755 1,487 1,118 2,013 1,812
Responses by young adults age 18-22 Housing & Transportation
The percentage of former foster young adults that reported that are residing in stable housing declined
significantly in 2011 and the reliable work transportation appears to be a significant issue for this
population.
Housing & Transportation
Safe Housing
Year 2008 2009 2010 Florida NYTD
2011 Florida NYTD
2012
Percentage Yes 95% 96% 97% 90% 92%
Yes 1,777 1,465 1,140 1,806 1,683
Total 1,877 1,528 1,178 2,015 1,821
Stable Housing
Year 2008 2009 2010 Florida NYTD
2011 Florida NYTD
2012
Percentage Yes 91% 91% 93% No Longer
Asked
No Longer Asked
Yes 1,677 1,381 1,094
Total 1,853 1,515 1,176
Spent at least one night homeless in past 12 months
Question Changed in 2011to have you ever
been homeless
Year 2008 2009 2010 Florida NYTD
2011 Florida NYTD
2012
Percentage Yes 14% 14% 10% 28% 28%
Yes 267 218 121 561 492
Total 1,899 1,530 1,177 2,015 1,821
Responses by young adults age 18-22

Pre-Independent Living & Independent Living – Updated August 2012 14
Housing & Transportation continued
Have reliable means of
transportation to school
Question Changed in 2011 to Reliable
means of Transportation to
school and/or Work
Year 2008 2009 2010 Florida NYTD
2011 Florida NYTD
2012
Percentage Yes 80% 84% 87% 73% 80%
Yes 1,519 1,309 1,033 1,473 1,379
Total 1,901 1,556 1,192 2,015 1,821
Have a reliable means of
transportation to work
Question Changed in 2011 to Reliable
means of Transportation to
school and/or Work
Year 2008 2009 2010 Florida NYTD
2011 Florida NYTD
2012
Percentage Yes 45% 36% 31% 73% 80%
Yes 645 558 366 1,473 1,379
Total 1,437 1,533 1,193 2,015 1,821
Have a driver's license
Year 2008 2009 2010 Florida NYTD
2011 Florida NYTD
2012
Percentage Yes 75% 69% 70% 44% 47%
Yes 731 556 402 891 872
Total 980 808 571 2,015 1,821
Responses by young adults age 18-22 Involvement in the Criminal Justice System
Within any given year approximately one-fifth of former foster care young adults report that they had
been arrested within the last 12 months and roughly ten percent indicated that are currently on
probation or under court supervision.
Criminal Justice
Been arrested in the past 12 months Question changed in 2011 to have you ever been arrested
Year 2008 2009 2010 Florida NYTD
2011 Florida
NYTD 2012
Percentage Yes 25% 23% 17% 43% 40%
Yes 1,226 551 210 860 688
Total 4,905 2,397 1,203 2,015 1,821
Currently on probation or under juvenile court supervision
Year 2008 2009 2010 Florida NYTD
2011 Florida
NYTD 2012
Percentage Yes 10% 12% 10% No Longer Asked
No Longer Asked
Yes 155 227 117
Total 1,548 1,888 1,200
Responses by young adults age 18-22

Pre-Independent Living & Independent Living – Updated August 2012 15
Age at Removal
Concerns have been raised that some CBC lead agencies have been flooded with removals of 17-year
olds. The chart below does not support that belief.
Source: DCF Keith Perlman from the IV-E waiver evaluation FFY 2010-11 entry cohort file.
Independent Living Budget Allocated funds and Expenditures The Legislature has appropriated $30,170,469 annually in budget for the Independent Living Program since State Fiscal Year 2009-2010. Due to changes in Federal Grant Funding levels year-to-year a small portion of these appropriations have been unfunded and therefore not allocated in CBC contracts. The actual allocation has ranged from $30,170,469 to $29,476,721. However CBCs have the flexibility to spend other state funds from their DCF foster care and related services contracts including state carry forward funds for the IL program which they have done in order to meet the need.

Pre-Independent Living & Independent Living – Updated August 2012 16
Total Independent Living Funding of Expenditures and Funding
State Fiscal Year
From IL Budget
From Other CBC State
Funds
From State Carry Fwd
Funds Total
Funding
Federal State
2009-10 $30,170,469 $17,528,372 $4,181,259 $51,880,100 $9,042,586 $42,837,514
2010-11 $29,451,721 $17,164,587 $4,945,531 $52,280,587 $8,161,242 $44,119,345
2011-12 $29,476,721 $13,057,985 $6,504,452 $49,039,158 $8,181,242 $40,857,916
Distribution of Expenditures
For FY11-12, approximately sixty-one (61%) percent of all Independent Living dollars were spent on
Road to Independence stipends. Case coordination and life skills training costs accounted for roughly
twenty-seven (27%) percent of total Independent Living expenditures with Transitional Support services
accounting for approximately ten (10%) percent of the total amount spent. Aftercare and Subsidized
Independent Living accounted for fewer than two (2%) percent of total dollars spent.
Expenditures ($) by IL Program Area
State Fiscal Year
Road to Independence
(RTI)
Case Coordination and Life Skill
Training
Transitional Aftercare Subsidized IL
(SIL) Total
FY 09-10 35,260,682 10,738,650 4,265,864 877,447 737,457 51,880,100
FY 10-11 35,204,424 11,626,648 4,591,816 448,780 408,919 52,280,587
FY 11-12 29,858,300 13,066,982 5,208,321 628,794 276,761 49,039,158
Expenditures (%) by Program Area
State Fiscal Year
Road to Independence
(RTI)
Case Coordination
and Life Skill Training
Transitional Aftercare Subsidized IL
(SIL) Total
FY 09-10 67.97% 20.70% 8.22% 1.69% 1.42% 100.00%
FY 10-11 67.34% 22.24% 8.78% 0.86% 0.78% 100.00%
FY 11-12 60.89% 26.65% 10.62% 1.28% 0.56% 100.00%