Florida Suspicious Vehicle Collision QCs - Florida … Suspicious Vehicle Collision QCs An analysis...
12
Alleged Suspicious Vehicle Collisions Analysis - Florida 1st Half of 2011 Page 1 of 12 Date: September 26, 2011 Regarding: Suspicious Vehicle Collision Questionable Claim Analysis - Florida 1 st Half of 2011 Prepared By: Luis Padilla, Field Information Analyst Florida Suspicious Vehicle Collision QCs An analysis was performed of the NICB Questionable Claims, as submitted by member companies from January 1, 2011 through June 30, 2011. This report analyzes suspicious vehicle collision activity in Florida according to the top five cities of loss and loss types. A Questionable Claim (QC) was associated with Florida if the Loss State field contained “FL” 1 . To isolate QC’s involving suspicious vehicle collisions, only the referrals that listed at least one of the five alleged referral reasons listed below were included in this analysis 2 . Referral Reasons • Jump-in • Paper Accident/Phantom Accident • Solicitation (Chasers and Cappers) • Staged/Caused Accident • Suspicious Hit While Parked Section 1 of this report contains an overview of QCs and suspicious vehicle collisions for the first six months of 2011. Section 2 reviews the top ten counties of loss for suspicious vehicle collision QC’s. Section 3 details the top loss cities and regions for suspicious vehicle collision QC’s. Section 4 is an analysis of the top loss types. Section 5 contains a summary of the information covered in this report. Each section of the following report analyzes data for January 1 through June 30, 2011. In addition, Subsections 3A through 3E of Section 3 give a more in-depth look at the top five Florida regions. 1 For the purposes of this report Questionable Claims without a valid city name in the “Loss City” field were not counted. 2 A Questionable Claim may assert up to 7 reasons for referral.
Transcript of Florida Suspicious Vehicle Collision QCs - Florida … Suspicious Vehicle Collision QCs An analysis...

Alleged Suspicious Vehicle Collisions Analysis - Florida 1st Half of 2011 Page 1 of 12
Date: September 26, 2011 Regarding: Suspicious Vehicle Collision Questionable Claim Analysis - Florida 1st Half of 2011 Prepared By: Luis Padilla, Field Information Analyst
Florida Suspicious Vehicle Collision QCs
An analysis was performed of the NICB Questionable Claims, as submitted by member companies from January 1, 2011 through June 30, 2011. This report analyzes suspicious vehicle collision activity in Florida according to the top five cities of loss and loss types. A Questionable Claim (QC) was associated with Florida if the Loss State field contained “FL”1. To isolate QC’s involving suspicious vehicle collisions, only the referrals that listed at least one of the five alleged referral reasons listed below were included in this analysis2. Referral Reasons
• Jump-in • Paper Accident/Phantom Accident • Solicitation (Chasers and Cappers) • Staged/Caused Accident • Suspicious Hit While Parked
Section 1 of this report contains an overview of QCs and suspicious vehicle collisions for the first six months of 2011. Section 2 reviews the top ten counties of loss for suspicious vehicle collision QC’s. Section 3 details the top loss cities and regions for suspicious vehicle collision QC’s. Section 4 is an analysis of the top loss types. Section 5 contains a summary of the information covered in this report. Each section of the following report analyzes data for January 1 through June 30, 2011. In addition, Subsections 3A through 3E of Section 3 give a more in-depth look at the top five Florida regions.
1 For the purposes of this report Questionable Claims without a valid city name in the “Loss City” field were not counted. 2 A Questionable Claim may assert up to 7 reasons for referral.

Alleged Suspicious Vehicle Collisions Analysis - Florida 1st Half of 2011 September 26, 2011 Page 2 of 12
SECTION 1: Statewide Overview 2011
In the first half of 2011 a total of 4,849 Questionable Claims were submitted that listed Florida as the loss state. This is an increase of 528 or 12% over the 4,321 claims referred in first half of 2010. If the second half remains the same, the projected total for the year would be 9,797. This would be a projected increase of 1,067 or 12% over the 2010 total of 8,730. In the first half of 2011 a total of 1,940 QC’s referred in Florida were categorized as PIP. This is an increase of 354 or 22% over the 1,586 claims referred in first half of 2010. If the second half remains the same, the total for the year could be around 3,941. Compared to the 3,222 PIP QC’s from 2010, this would be an increase of 719 or 22%. In the first half of 2011 a total of 1,365 claims were referred as suspicious vehicle collision QC’s. This is a decrease of 53 or 4% over the 1,418 claims referred in first half of 2010. If the second half remains the same, the total for the year could be around 2,668. Compared to the 2,779 suspicious vehicle collision QC’s from 2010, this would be a decrease of 111 or 4%.
Questionable Claim Type 2010 (1st half) 2011 (1st half) Change Percent All Types 4,321 4,849 528 12% PIP only 1,586 1,940 354 22%
Suspicious Vehicle Collision 1,418 1,365 -53 -4%
0
500
1000
1500
2000
2500
3000
3500
4000
4500
5000
All QCs PIP QCs Suspicious Vehicle Collision QCs
4321
1586 1418
4849
1940
1365
Florida Questionable Claims
2010 (1st Half)
2011 (1st Half)

Alleged Suspicious Vehicle Collisions Analysis - Florida 1st Half of 2011 September 26, 2011 Page 3 of 12
Section 2: Loss County
The Questionable Claims were analyzed by Loss County. The top ten (10) Loss Counties are depicted in the below chart. The Loss County with the most suspicious vehicle collision QC’s in the first half of 2011 was Dade, with 427 asserted suspicious vehicle collisions, or 31% of the total number.
0
50
100
150
200
250
300
350
400
450 427
239
207
159
89
6249
19 18 13
Florida Suspicious Vehicle Collisions By County 2011**(1st Half)

Alleged Suspicious Vehicle Collisions Analysis - Florida 1st Half of 2011 September 26, 2011 Page 4 of 12
SECTION 3: Loss City
The Questionable Claims involving asserted suspicious vehicle collisions were analyzed by Loss City and ranked. The top five (5) Loss Cities are listed, and are depicted in a bar chart. The Loss City with the most suspicious vehicle collision QC’s in the first half of 2011 was Miami with 255 alleged suspicious vehicle collisions, or 19% of the total number.
Top five (5) Loss Cities for 2011 (1st Half) Rank City Suspicious Vehicle
Collisions 1 Miami 255 2 Tampa 195 3 Orlando 178 4 Hialeah 97 5 West Palm Beach 62
0
50
100
150
200
250
300
255
195
178
97
62
Florida Suspicious Vehicle Collision QC's by Loss City 1st Half 2011

Alleged Suspicious Vehicle Collisions Analysis - Florida 1st Half of 2011 September 26, 2011 Page 5 of 12
Subsection 1: Florida Loss Areas Map
Top five (5) Loss Areas3 for 2011 (1st Half)
Rank Loss Area Suspicious Vehicle
Collisions 1 Southeast Florida Area 445 2 Tampa Bay Area 228 3 Orlando Area 186 4 Fort Myers Area 96 5 Jacksonville Area 18
3 Loss areas are based on the cities in Florida where an NICB major or mini medical task force is located at, and include the referrals from the top five cities that are within 50 miles. The Tampa area is counted separately from the Orlando area due to the large distance between these two cities.

Alleged Suspicious Vehicle Collisions Analysis - Florida 1st Half of 2011 September 26, 2011 Page 6 of 12
Subsection 3A: Southeast Florida Overview for 2011 (1st Half)
The Questionable Claims submitted in the first half of 2011 involving alleged suspicious vehicle collisions were also analyzed by Loss City and ranked within the Southeast Florida region. The top five (5) cities identified as part of the Southeast Florida area have a combined total of 445 suspicious vehicle collision QC’s. The city of Miami has 255 QC’s, or 57% of the top five cities total.
Southeast Florida Area Suspicious Vehicle Collision QC’s by Loss City
Rank Loss City 2011 (1st half) 1 Miami 255 2 Hialeah 97 3 West Palm Beach 62 4 Boynton Beach 19 5 Fort Lauderdale 12
0
50
100
150
200
250
300
Miami Hialeah West Palm Beach Boynton Beach Fort Lauderdale
255
97
62
19 12
Southeast Florida Suspicious Vehicle Collisions by Loss City 1st Half 2011

Alleged Suspicious Vehicle Collisions Analysis - Florida 1st Half of 2011 September 26, 2011 Page 7 of 12
Subsection 3B: Tampa Bay Area Overview for 2011 (1st Half)
The Questionable Claims in the first half of 2011 involving alleged suspicious vehicle collisions were also analyzed by Loss City and ranked within the Tampa Bay area. The top five (5) cities identified as part of the Tampa Bay area have a combined total of 228 suspicious vehicle collision QC’s. The city of Tampa has 195 QC’s, or 86% of the Tampa Bay area’s top five cities total.
Tampa Bay Area Suspicious Vehicle Collision QC’s by Loss City
Rank Loss City 2011 (1st half) 1 Tampa 195 2 Brandon 13 3 Saint Petersburg 7 3 Oldsmar 7 4 Clearwater 6
0
20
40
60
80
100
120
140
160
180
200
Tampa Brandon Saint Petersburg Oldsmar Clearwater
195
13 7 7 6
Tampa Bay Area Suspicious Vehicle Collision by Loss City 1st Half 2011

Alleged Suspicious Vehicle Collisions Analysis - Florida 1st Half of 2011 September 26, 2011 Page 8 of 12
Subsection 3C: Orlando Area Overview for 2011 (1st Half)
The Questionable Claims in the first half of 2011 involving alleged suspicious vehicle collisions were also analyzed by Loss City and ranked within the Orlando region. The top four (4) cities4 identified as part of the Orlando area have a combined total of 186 suspicious vehicle collision QC’s. The city of Orlando has 178 QC’s, or 96% of the Orlando area’s top four cities total.
Orlando Area Suspicious Vehicle Collision QC’s by Loss City
Rank Loss City 2011 (1st half) 1 Orlando 178 2 Apopka 5 3 Sanford 2 4 Winter Park 1
4 Only four cities were identified as having suspicious vehicle collision Questionable Claims
0
20
40
60
80
100
120
140
160
180
Orlando Apopka Sanford Winter Park
178
5 2 1
Orlando Area Suspicious Vehicle Collisions by Loss City 1st Half 2011

Alleged Suspicious Vehicle Collisions Analysis - Florida 1st Half of 2011 September 26, 2011 Page 9 of 12
Subsection 3D: Fort Myers Area Overview for 2011 (1st Half) The Questionable Claims in the first half of 2011 involving alleged suspicious vehicle collisions were also analyzed by Loss City and ranked within the Fort Myers region. The top five (5) cities identified as part of the Fort Myers area have a combined total of 96 suspicious vehicle collision QC’s. The city of Naples has 39 QC’s, or 41% of the Fort Myers area’s top five cities total.
Fort Myers Area Suspicious Vehicle Collision QC’s by Loss City
Rank Loss City 2011 (1st half) 1 Naples 39 2 Fort Myers 27 3 Lehigh Acres 18 4 Cape Coral 7 5 Immokalee 5
0
5
10
15
20
25
30
35
40
Naples Fort Myers Lehigh Acres Cape Coral Immokalee
39
27
18
75
Fort Myers Area Suspicious Vehicle Collisions by Loss City 1st Half 2011
Alleged Suspicious Vehicle Collisions Analysis - Florida 1st Half of 2011 September 26, 2011 Page 10 of 12
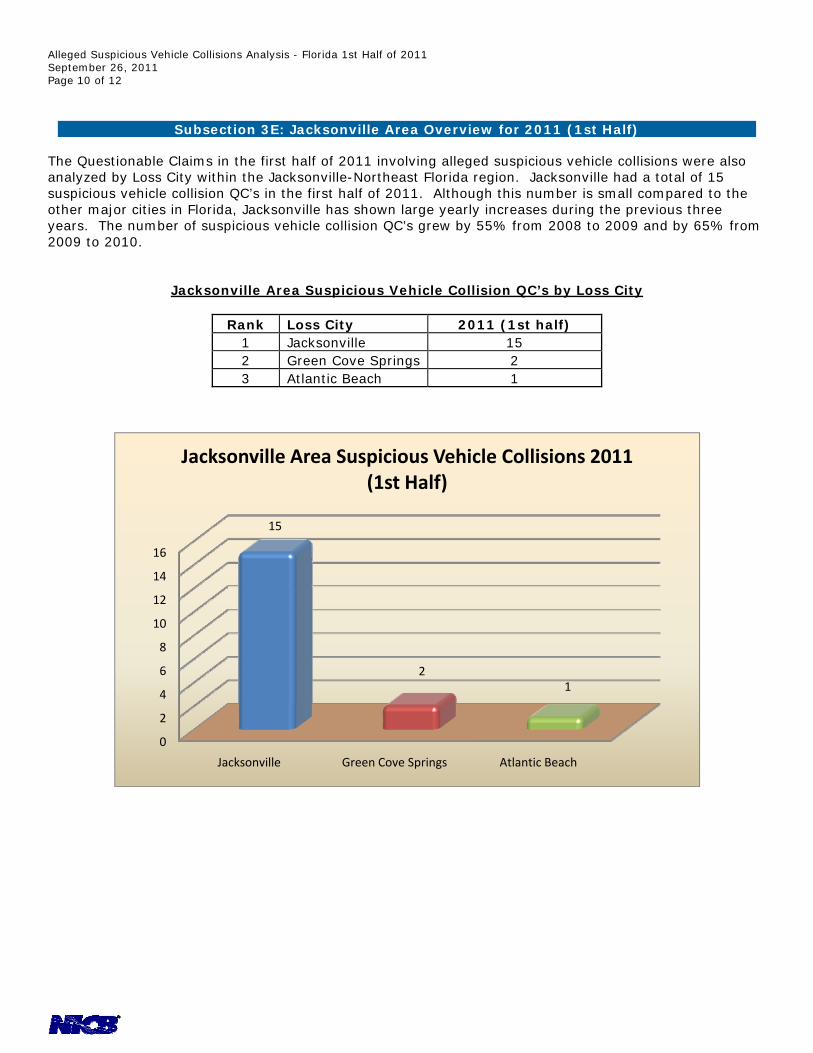
Subsection 3E: Jacksonville Area Overview for 2011 (1st Half)
The Questionable Claims in the first half of 2011 involving alleged suspicious vehicle collisions were also analyzed by Loss City within the Jacksonville-Northeast Florida region. Jacksonville had a total of 15 suspicious vehicle collision QC’s in the first half of 2011. Although this number is small compared to the other major cities in Florida, Jacksonville has shown large yearly increases during the previous three years. The number of suspicious vehicle collision QC’s grew by 55% from 2008 to 2009 and by 65% from 2009 to 2010.
Jacksonville Area Suspicious Vehicle Collision QC’s by Loss City
Rank Loss City 2011 (1st half) 1 Jacksonville 15 2 Green Cove Springs 2 3 Atlantic Beach 1
0
2
4
6
8
10
12
14
16
Jacksonville Green Cove Springs Atlantic Beach
15
21
Jacksonville Area Suspicious Vehicle Collisions 2011 (1st Half)

Alleged Suspicious Vehicle Collisions Analysis - Florida 1st Half of 2011 September 26, 2011 Page 11 of 12
SECTION 4: Loss Type
The Florida Questionable Claims involving alleged suspicious vehicle collisions were also analyzed by Loss Type and ranked for the first half of 2011. In the first half of 2011, a total of 14 Loss Types were identified within the 1,365 Florida QC’s. The top five (5) Loss Types are listed and are depicted in bar charts. The top five (5) Loss Types for both years remained the same. The Loss Type with the most QC’s was “Personal Injury Protection (PIP)” with 574 QC’s in first half of 2011.
Florida Suspicious Vehicle Collision QC’s by Loss Type
Top Five (5) Loss Types
Rank Loss Type 2011 (1st half) 1 PIP 574 2 Bodily Injury 378 3 Other Auto 218 4 Property Damage 85 5 Collision 76
0
100
200
300
400
500
600
PIP Bodily Injury Other Auto Property Damage Collision
574
378
218
85 76
Florida Suspicious Vehicle Collisions Questionable Claims by Loss Type 1st Half 2011

Alleged Suspicious Vehicle Collisions Analysis - Florida 1st Half of 2011 September 26, 2011 Page 12 of 12
SECTION 5: Conclusion The number of Questionable Claims in Florida increased from the first half of 2010 (4,321) through the first half of 2011 (4,849). The additional 528 claims represent a 12 percent increase. By contrast, the number of suspected suspicious vehicle collisions in Florida decreased by 4 percent, from the first half of 2010 (1,418) through the first half of 2011 (1,365). Tampa which was ranked number 1 during the previous three years showed a large decrease in alleged suspicious vehicle collisions from the first half of 2010 through the first half of 2011 (-58%). Miami, which ranked third in 2010, has moved back into first place, with an 83% increase. The rest of the top five cities experienced less dramatic changes: Orlando went from 2nd to 3rd, Hialeah remained in 4th, and West Palm Beach moved up from 6th to 5th. This report does not contain any concrete proof of a cause and effect relationship between the events listed below that have occurred since the summer of 2010 and the recent decrease in the number of suspicious vehicle collision QC’s in Florida. It is up to the reader to draw his or her own conclusions as to whether or not any or all of these events played a role in the decrease. Notable anti-fraud events since the summer of 2010:
• Billboard and radio ad campaigns regarding suspicious vehicle collisions • Creation of the Central Florida Medical Fraud Task Force in Tampa • Release of Insurance Information Institute’s report5 on the impact of PIP fraud in Florida • Introduction of legislative bills designed to reduce PIP fraud • 118 arrests or warrants from July 1, 2010 through September 1, 2011 related to medical
investigations assigned to the Central Florida Medical Fraud Task Force
5 “No-Fault Auto Insurance In Florida: Trends, Challenges & Costs” - January 2011